Embed Size (px)
Citation preview

Learning from Learning from Model-Produced Graphs Model-Produced Graphs
in a Climate Change Science Class in a Climate Change Science Class
Catherine Gautier
Geography Department
UC Santa Barbara
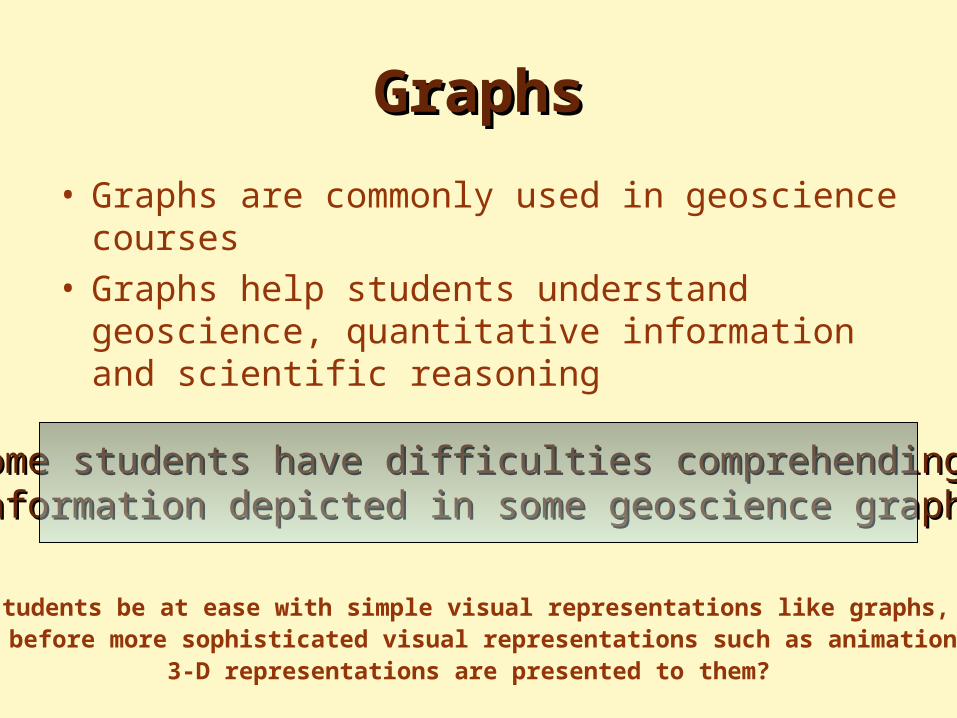
GraphsGraphs
• Graphs are commonly used in geoscience courses
• Graphs help students understand geoscience, quantitative information and scientific reasoning
Some students have difficulties comprehending Some students have difficulties comprehending information depicted in some geoscience graphsinformation depicted in some geoscience graphs
Should students be at ease with simple visual representations like graphs, maps, charts before more sophisticated visual representations such as animations or
3-D representations are presented to them?

What is the role of graphs What is the role of graphs in learning climate sciencein learning climate science
Communicate relevant quantitative
information
Promote thinking about data and scientific information
Comprehension Scientific Reasoning
Dealing with quantitative information
Cognitiveaspects

Graphs and Graphs and Scientific ReasoningScientific Reasoning
• Ability to think about data by relating them to: theories, conclusions, hypotheses, explanations
– What kind of tasks promote students’ ability to explain data and relate data to theories and hypotheses?
• Ability to ask the “right” question– Do certain kinds of graphs support reasoning
about the “right” questions?– Can graphs highlight questions students might
ask and therefore promote scientific reasoning skills?

Experiment and Data CollectionExperiment and Data CollectionModel-based Inquiry CourseModel-based Inquiry Course
• Student-generated scientific question and experimental design
• Student-performed experiment with model• Graphs and data tables generation• Graphs integration into a scientific reasoning• Students- produced graphics analyzed to
evaluate – students’ ability to comprehend graphs and interpret quantitative
information (display quantitative skills)– Graphs’ role in helping students’ thinking about data and in
promoting scientific inquiry (asking “right” question)

Multimedia DisplayMultimedia Display
Multimedia display – Visual and textual– Interaction of task and graphic format– Complementarity of graphical presentation
forms: integrative with graph and separative with table
Visual characteristics of graphic display
– 2-D format– Line graph (suggests continuity of vertical
distribution and provide trend)– Multiple lines for comparisons– Simple mapping between referent (flux) and
variable altitude, wavelength, time, sun angle
Table– To get single point value (surface)– To extract data for additional (external)
visualizationText
– To explain how model works– To describe inputs and outputs

Experiment and Data CollectionExperiment and Data CollectionModel-based Inquiry CourseModel-based Inquiry Course
• Student-generated scientific question and experimental design
• Student-performed experiment with model• Graphs and data tables generation• Graphs integration into scientific reasoning• Students-produced graphics analyzed to
evaluate – Students’ ability to interpret quantitative information (display
quantitative skills)– Graphs’ role in helping students’ thinking about data and in
promoting scientific inquiry (asking “right” question)

Analysis of GraphsAnalysis of Graphs
• Two types of graphs – model-produced – student-produced (advanced investigations)
• Graph interpretation: graphs and quantitative skills
• Graphs and scientific reasoning: analytical representation of results for theory establishment or verification
• Graphs and scientific reasoning: asking “right” question
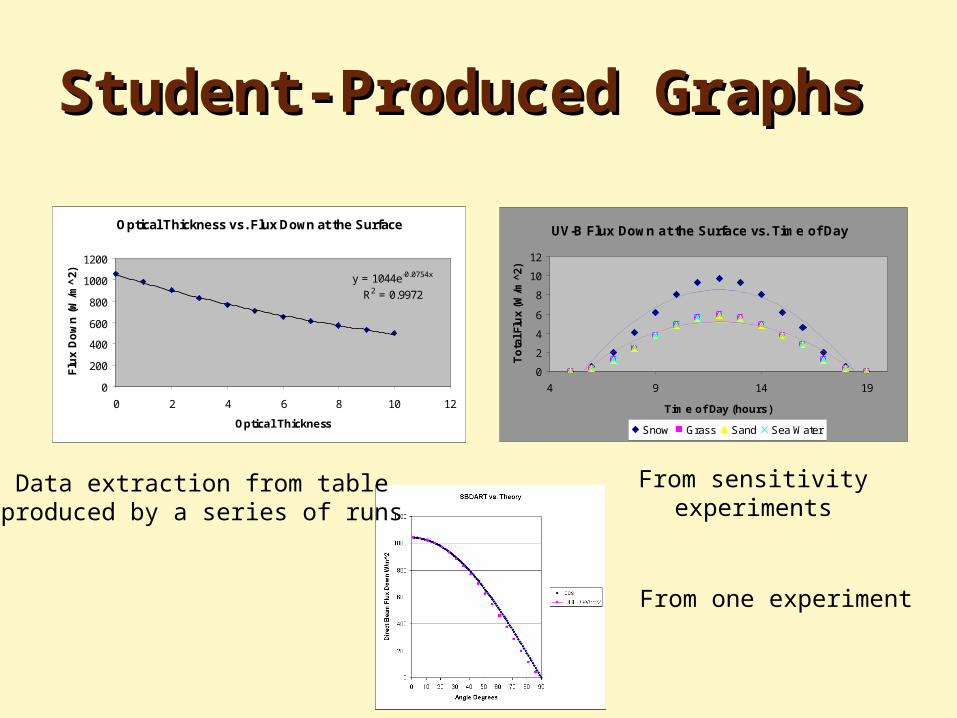
Student-Produced GraphsStudent-Produced Graphs
Optical Thickness vs. Flux Down at the Surface
y = 1044e-0.0754x
R2 = 0.9972
0
200
400
600
800
1000
1200
0 2 4 6 8 10 12
Optical Thickness
Flu
x D
ow
n (
W/m
^2)
UV-B Flux Down at the Surface vs. Time of Day
0
2
4
6
8
10
12
4 9 14 19
Time of Day (hours)
To
tal F
lux
(W/m
^2)
Snow Grass Sand Sea Water
Data extraction from tableproduced by a series of runs
From sensitivityexperiments
From one experiment

Analysis of GraphsAnalysis of Graphs
• Two types of graphs – model-produced – student-produced (advanced investigations)
• Graph interpretation: graphs and quantitative skills
• Graphs and scientific reasoning: analytical representation of results for theory establishment or verification
• Graphs and scientific reasoning: asking “right” question

Graphs Interpretation and Graphs Interpretation and Quantitative SkillsQuantitative Skills
Quantitative skills Frequency of use in
graph interpretationEstimating 10-15%
Phenomena Quantification 99% (required)
Hypothesis evaluation 98% (required)
Processes Quantification/explanation ~25%
Graphic Production ~10%
Advanced mathematical/statistical modeling
~5%

Analysis of GraphsAnalysis of Graphs
• Two types of graphs – model-produced – student-produced (advanced investigations)
• Graph interpretation: graphs and quantitative skills
• Graphs and scientific reasoning: analytical representation of results for theory establishment or verification
• Graphs and scientific reasoning: asking “right” question (talk on Thursday morning)

Theory Verification or Theory Verification or EstablishmentEstablishment
Theory Verification
instructor
Theory Establishment
Scattered Radiation vs. Wavelength
y = 5.4157x-3.9746
R2 = 0.6567
0.00
100.00
200.00
300.00
400.00
500.00
600.00
700.00
800.00
0 0.1 0.2 0.3 0.4 0.5 0.6 0.7 0.8 0.9
wavelength
Sa
ctt
ere
d R
ad
iati
on
Scattered RadiationPower (Scattered Radiation)
Optical Thickness vs. Flux Down at the Surface
y = 1044e-0.0754x
R2 = 0.9972
0
200
400
600
800
1000
1200
0 2 4 6 8 10 12
Optical Thickness
Flu
x D
ow
n (
W/m
^2)
Theory Verification
Noisy data from model?

SummarySummary
• Importance of repetitive nature of tasks and graphs produced to graph comprehension– Development of graph schema for lower performing students
• Graph interpretation and quantitative skills– Required quantitative skills related to the use of graphs well
grasped– Other quantitative skills only employed by best students
• Graphs allowed students to visualize and communicate quantitative information and this promoted thinking about data
• Through the interaction between graphs and quantitative skills, the class activities supported the application and development of scientific reasoning including – theory validation or establishment, hypothesis testing– Asking valid scientific questions

Future ResearchFuture Research• Assessment
– Scientific reasoning cognitive level in climate change science– Students’ graph comprehension/schema prior and after class– Interaction between graph schema and content knowledge
• Develop series of focused questions– What are the main characteristics of the “relevant” information that need to be
communicated in climate change? What makes a graph better or worse at communicating relevant quantitative information in climate change?
– How do students comprehend graphs and what are the factors that influence students’ interpretations?
– How might different ways in which data are manipulated promote thinking about data?
– How do individual differences in graph reading skills and domain knowledge influence the kinds of interpretations that students give graphs presented to them?
• Develop customized tools for assessment– Develop multiple assessment approach and Integrate results from different tools– For each question develop appropriate tool (questionnaires, video and audio
recording, analysis of written and presented work, concept maps)