Embed Size (px)
Citation preview

Climate change as an entrepreneurial challenge
Jonathan Koomey Research Fellow, Steyer-‐Taylor Center for Energy
Policy and Finance, Stanford University [email protected] hFp://www.koomey.com
Lawrence Berkeley NaLonal Laboratory October 21, 2014
1 Copyright Jonathan Koomey 2014

The world is warming and humans are responsible
“A strong, credible body of scienLfic evidence shows that climate change is occurring, is caused largely by human acLviLes, and poses significant risks for a broad range of human and natural systems. . . . Some scienLfic conclusions or theories have been so thoroughly examined and tested, and supported by so many independent observaLons and results, that their likelihood of subsequently being found to be wrong is vanishingly small. Such conclusions and theories are then regarded as seFled facts. This is the case for the conclusions that the Earth system is warming and that much of this warming is very likely due to human acLviLes.”
US NaLonal Academy of Sciences. 2010. Advancing the Science of Climate Change
2 Copyright Jonathan Koomey 2014

Historical global C emissions
Source: Carbon Dioxide Information Analysis Center (CDIAC)
Copyright Jonathan Koomey 2014 3

Big jump in CO2 concentraLons from fossil fuels and land use changes
Sources: Vostok and Lawdome ice core data, plus measured concentrations from the Carbon Dioxide Information Analysis Center, plotted in Cold Cash, Cool Climate
Copyright Jonathan Koomey 2014 4

A closer look at the last 12,000 years Sources: Vostok and Lawdome ice core data, plus measured concentrations from the Carbon Dioxide Information Analysis Center, plotted in Cold Cash, Cool Climate
Copyright Jonathan Koomey 2014 5

Global surface temperatures have risen in the last century
Source: Marcott et al. (2013) and Jones et al. (2013) Copyright Jonathan Koomey 2014 6

Increasing temperatures “load the dice”
Source: Adapted from a graph made originally by the University of Arizona, Southwest Climate Change Network
Copyright Jonathan Koomey 2014 7

What the data show
8
Source: The New Climate Dice: Public Percep=on of Climate Change. James Hansen, Makiko Sato, and Reto Ruedy. August 2012. hFp://www.giss.nasa.gov/research/briefs/hansen_17/. Data are for Northern Hemisphere. X-‐axes in graphs below are in standard deviaLons, not C degrees.
Copyright Jonathan Koomey 2014
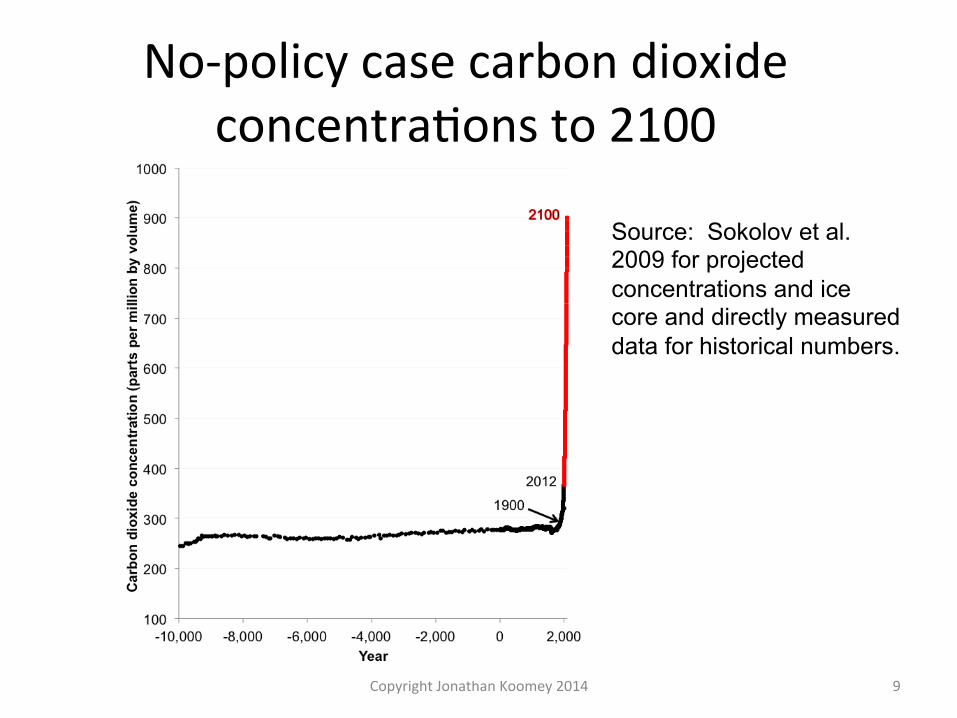
No-‐policy case carbon dioxide concentraLons to 2100
Source: Sokolov et al. 2009 for projected concentrations and ice core and directly measured data for historical numbers.
Copyright Jonathan Koomey 2014 9

No-‐policy case greenhouse gas concentraLons to 2100 (all gases)
Copyright Jonathan Koomey 2014 10
Source: Sokolov et al. 2009 for projected concentrations and ice core and directly measured data for historical numbers.

No-‐policy case greenhouse gas concentraLons to 2100
Source: Sokolov et al. 2009, plotted in Cold Cash, Cool Climate Copyright Jonathan Koomey 2014 11

Current trends = 5 C degrees by 2100, with no end in sight
Historical data from Marcott et al. (2013) and Jones et al. (2013), with MIT projection taken from Sokolov et al. 2009. MIT climate sensitivity is 2.9 degrees C, but warming by 2100 doesn’t reflect the full warming impact because full equilibration takes centuries.
12 Copyright Jonathan Koomey 2014
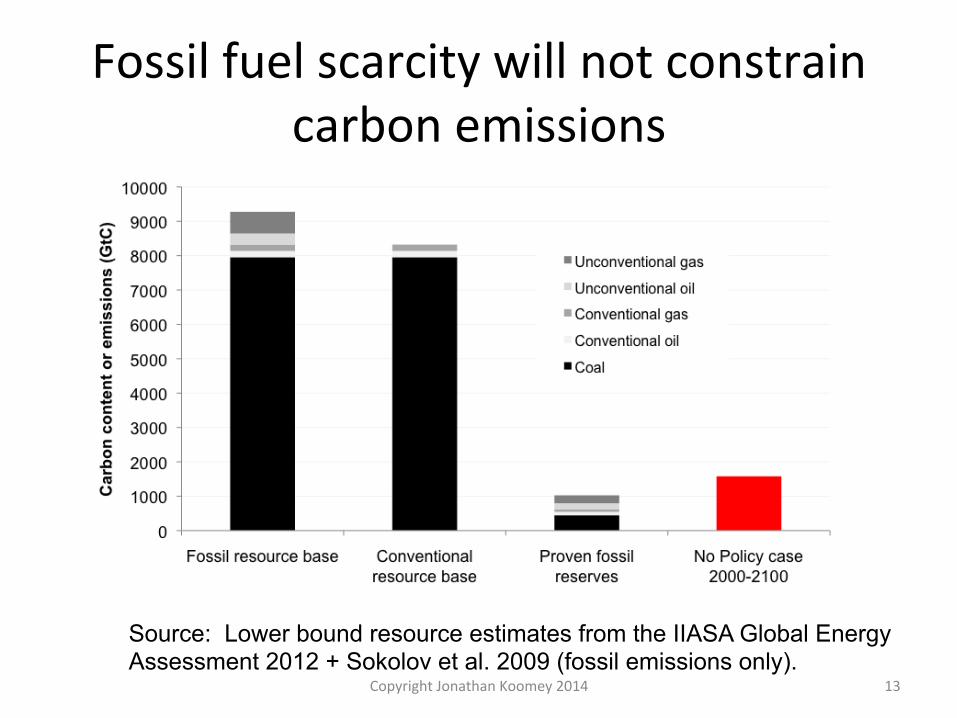
Fossil fuel scarcity will not constrain carbon emissions
Source: Lower bound resource estimates from the IIASA Global Energy Assessment 2012 + Sokolov et al. 2009 (fossil emissions only).
13 Copyright Jonathan Koomey 2014

What can we do?
14 Copyright Jonathan Koomey 2014

Our options
• Adapt–modify human systems to make them more flexible and resilient
• Suffer–accept what comes (but what comes is likely to be costly in lives, ecosystem damage, and economic disruption)
• Mitigate–reduce emissions
15 Copyright Jonathan Koomey 2014

Questions about mitigation options • How much carbon will they save? • How much will they cost? • Are they feasible
– technically? (science and technology) – logistically? (implementation and
policy) – politically? (social will and equity)
16 Copyright Jonathan Koomey 2014
17
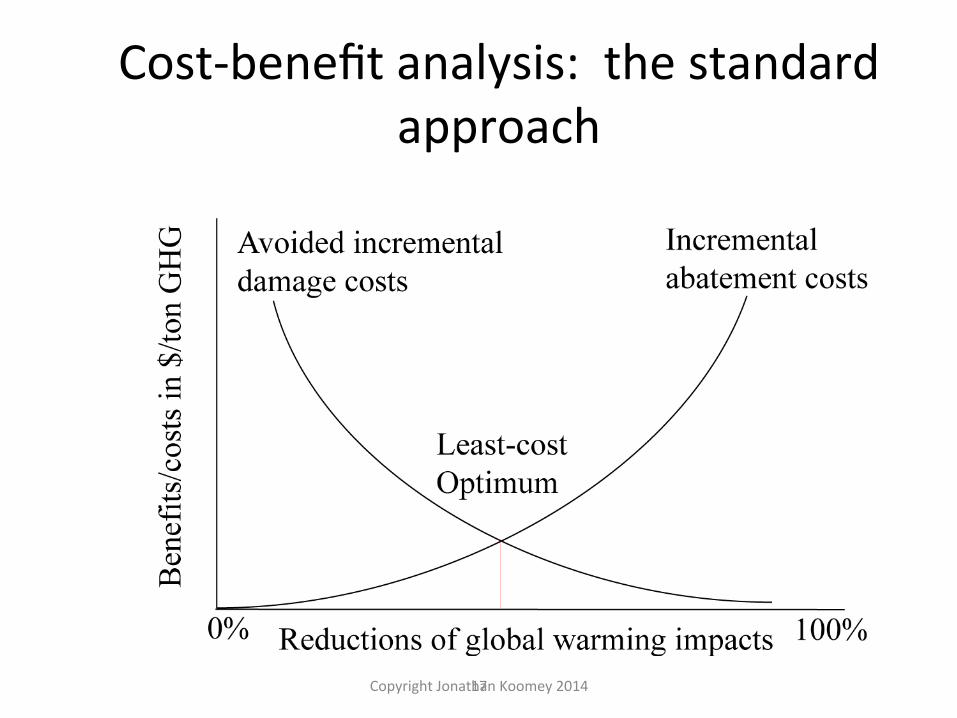
Cost-‐benefit analysis: the standard approach
Copyright Jonathan Koomey 2014

The forecasLng quandary
• Economics ≠ physics: we need to act, but it’s impossible to calculate costs and benefits in an accurate way
• ImplicaLon: the convenLonal model of full benefit-‐cost analysis before acLng is not adequate to address this problem
18 Copyright Jonathan Koomey 2014

An evoluLonary, path-‐dependent view
• There is no “opLmal path”, but there are many possible alternaLve paths – We can’t plan or know everything about the path ahead but the warming limit defines the broad outlines of success
• Our choices now affect our opLons later • Need to
– invest in a broad pornolio of opLons – fail fast – modify plans dynamically – learn as fast as we can
19 Copyright Jonathan Koomey 2014

An alternaLve approach
• Define a warming limit (e.g. 2 C degrees above preindustrial levels)
• Determine the total greenhouse gases we can then emit to stay under that limit
• Define pathways that meet that constraint • Assess what we’d need to do achieve that pathway (# of power plants, rate of improvement in energy efficiency, etc)
• Try opLons, fail fast, alter course as needed
20 Copyright Jonathan Koomey 2014

There’s no Lme to waste
21
Source: The Copenhagen Diagnosis, 2009 Copyright Jonathan Koomey 2014

Working toward the limit • Like strategic planning, not forecasLng • e.g., to meet some fracLon of the target
– how many emission-‐free power plants would we have to build and how much capital would that require?
– how fast would efficiency need to improve given expected rates of economic growth?
– what insLtuLonal changes would be needed to accelerate the rate of implementaLon?
• A way to organize our thinking about soluLons to the problem
22 Copyright Jonathan Koomey 2014

MeeLng constraints of the safer climate case won’t be easy
Source: Lower bound resource estimates from the IIASA Global Energy Assessment 2012 + calcs in Cold Cash, Cool Climate (fossil emissions only). 23 Copyright Jonathan Koomey 2014

Lessons for entrepreneurs
• Start with tasks, then redefine them • Focus on the whole system • Time is money • Modify property rights • Harness informaLon technology
– Data collecLon – SubsLtute bits for atoms and smarts for parts – Transform insLtuLons
• Work forward toward goals to learn more rapidly
Copyright Jonathan Koomey 2014 24

Peak compuLng efficiency
• Doubling about every year and a half since the 1940s
• 100x improvement every decade
• Enabled the existence of laptops and smart phones
• Trend slowing since 2000, but standby efficiency improving more rapidly since then
25 Copyright Jonathan Koomey 2014 Source: Koomey et al. 2011

These trends sLll have a long way to
run Psssst: Researchers at Purdue and the University of New South Wales in 2012 created a reliable one atom transistor…
2041
26 Copyright Jonathan Koomey 2014

Summary • Warming limit approach is similar to how businesses make big strategic decisions
• Focus is on risk reducLon, experimentaLon, evaluaLon, innovaLon and cost effecLveness, not on knowing “opLmal” path in advance (impossible!)
• Science points to 2 deg C limit but ulLmate choice is a poliLcal judgment – Declare value judgment up front (not buried in black box models, as is customary)
• Implies rapid reducLons and keeping most fossil fuels in the ground (requires rapid innovaLons in technologies AND behavior/insLtuLons)
27 Copyright Jonathan Koomey 2014

Summary (conLnued)
• Immediate implementaLon is essenLal (can’t just wait and see while doing R&D) – Learning by doing only happens if we do!
• ExisLng low carbon resources are plenLful but we’ll need new innovaLons in later decades to keep reducLons on track
• Start small. Think big. Get going!
28 Copyright Jonathan Koomey 2014

“The best way to predict the future is to invent it.” –Alan Kay
29 Copyright Jonathan Koomey 2014

References • Allison, et al. 2009. The Copenhagen Diagnosis, 2009: Upda=ng the World on the Latest Climate Science. Sydney, Australia: The
University of New South Wales Climate Change Research Centre (CCRC). • Brynjolfsson, Erik, and Andrew McAffee. 2014. The Second Machine Age: Work, Progress, and Prosperity in a Time of Brilliant
Technologies. New York, NY: W. W. Norton & Company. [hFp://amzn.to/1gYHEGk] • Caldeira, Ken, Atul K. Jain, and MarLn I. Hoffert. 2003. "Climate SensiLvity Uncertainty and the Need for Energy Without CO2 Emission "
Science. vol. 299, no. 5615. pp. 2052-‐2054. <hFp://www.sciencemag.org/cgi/content/abstract/299/5615/2052> • DeCanio, Stephen J. 2003. Economic Models of Climate Change: A Cri=que. Basingstoke, UK: Palgrave-‐Macmillan. • Brown, Marilyn A., Mark D. Levine, Walter Short, and Jonathan G. Koomey. 2001. "Scenarios for a Clean Energy Future." Energy Policy
(Also LBNL-‐48031). vol. 29, no. 14. November. pp. 1179-‐1196. • Gritsevskyi, Andrii, and Nebojsa Nakicenovic. 2000. "Modeling uncertainty of induced technological change." Energy Policy. vol. 28, no.
13. November. pp. 907-‐921. • Jones, P. D., D. E. Parker, T. J. Osborn, and K. R. Briffa. 2013. Global and hemispheric temperature anomalies-‐-‐land and marine
instrumental records. Oak Ridge, TN: CDIAC, Oak Ridge NaLonal Laboratory, U.S. Department of Energy. [hFp://cdiac.esd.ornl.gov/trends/temp/jonescru/jones.html]
• Koomey, Jonathan. TesLmony of Jonathan Koomey, Ph.D. for a hearing on "Efficiency: The Hidden Secret to Solving Our Energy Crisis". Joint Economic CommiFee of the U.S. Congress. U.S. Congress. Washington, DC: U.S. Congress. July 30, 2008. <hFp://www.jec.senate.gov/index.cfm?FuseAcLon=Hearings.HearingsCalendar&ContentRecord_id=6fc51d63-‐e7e2-‐82b7-‐10c3-‐3faa2c150115>
• Koomey, Jonathan G., Stephen Berard, Marla Sanchez, and Henry Wong. 2011. "ImplicaLons of Historical Trends in The Electrical Efficiency of CompuLng." IEEE Annals of the History of Compu=ng. vol. 33, no. 3. July-‐September. pp. 46-‐54. [hFp://doi.ieeecomputersociety.org/10.1109/MAHC.2010.28]
• Koomey, Jonathan G. Cold Cash, Cool Climate: Science-‐Based Advice for Ecological Entrepreneurs. Burlingame, CA: AnalyLcs Press, 2012.
• Koomey, Jonathan. 2013. "Moving Beyond Benefit-‐Cost Analysis of Climate Change." Environmental Research LeSers. vol. 8, no. 041005. December 2. [hFp://iopscience.iop.org/1748-‐9326/8/4/041005/]
30 Copyright Jonathan Koomey 2014

References (conLnued) • Krause, FlorenLn, Wilfred Bach, and Jonathan G. Koomey. 1992. Energy Policy in the Greenhouse. NY, NY: John Wiley and Sons. (1989
ediLon of this book downloadable at <hFp://files.me.com/jgkoomey/9jzwgj>) • Luderer, Gunnar, Robert C. Pietzcker, Christoph Bertram, Elmar Kriegler, Malte Meinshausen, and OFmar Edenhofer. 2013. "Economic
miLgaLon challenges: how further delay closes the door for achieving climate targets." Environmental Research LeSers. vol. 8, no. 3. September 17. [hFp://iopscience.iop.org/1748-‐9326/8/3/034033/arLcle]
• MarcoF, Shaun A., Jeremy D. Shakun, Peter U. Clark, and Alan C. Mix. 2013. "A ReconstrucLon of Regional and Global Temperature for the Past 11,300 Years." Science. vol. 339, no. 6124. March 8, 2013. pp. 1198-‐1201. [hFp://www.sciencemag.org/content/339/6124/1198.abstract]
• Meinshausen, Malte, Nicolai Meinshausen, William Hare, Sarah C. B. Raper, Katja Frieler, Reto Knu|, David J. Frame, and Myles R. Allen. 2009. "Greenhouse-‐gas emission targets for limiLng global warming to 2 degrees C." Nature. vol. 458, April 30. pp. 1158-‐1162. <hFp://www.nature.com/nature/journal/v458/n7242/full/nature08017.html>
• Pacala, S., and Rob Socolow. 2004. "StabilizaLon Wedges: Solving the Climate Problem for the Next 50 Years with Current Technologies " Science. vol. 305, no. 5686. August 13. pp. 968-‐972. [hFp://www.sciencemag.org/cgi/content/abstract/305/5686/968]
• Joeri, Rogelj, Meinshausen Malte, Sedláček Jan, and Knu| Reto. 2014. "ImplicaLons of potenLally lower climate sensiLvity on climate projecLons and policy." Environmental Research LeSers. vol. 9, no. 3. pp. 031003. [hFp://stacks.iop.org/1748-‐9326/9/i=3/a=031003]
• Williams, James H., Andrew DeBenedicLs, Rebecca Ghanadan, Amber Mahone, Jack Moore, William R. Morrow, Snuller Price, and Margaret S. Torn. 2011. "The Technology Path to Deep Greenhouse Gas Emissions Cuts by 2050: The Pivotal Role of Electricity." Science. November 24. [hFp://www.sciencemag.org/content/early/2011/11/22/science.1208365.abstract]
31 Copyright Jonathan Koomey 2014

Extra slides
32 Copyright Jonathan Koomey 2014

Contributors to climate change through 2005
Source: IPCC 2007 (Working Group 1, the Physical Science Basis) Copyright Jonathan Koomey 2014 33
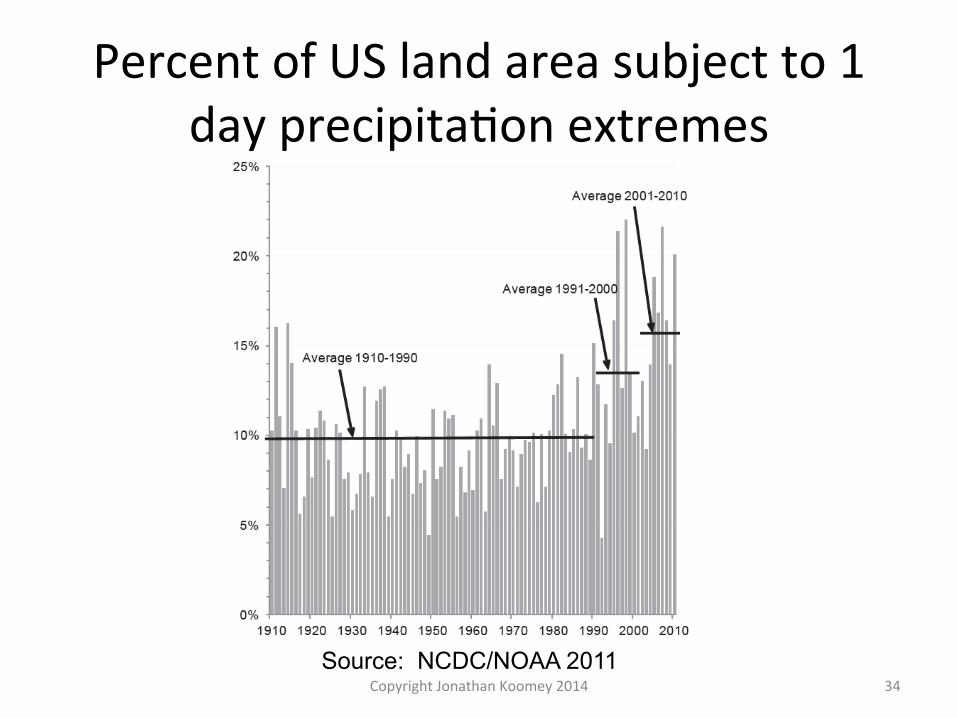
Percent of US land area subject to 1 day precipitaLon extremes
Source: NCDC/NOAA 2011 Copyright Jonathan Koomey 2014 34

2 C degree warming limit • Keeps global T within humanity’s experience • Likely avoids the worst of the posiLve feedbacks • Implies cumulaLve GHG emissions “budget” • Limit itself now widely accepted (e.g., G8 in 2009), but implicaLons sLll not well known – Global emissions must turn down this decade, down 50% by 2050, more soon a�erwards
– WaiLng has a real cost – We must act quickly on many fronts
• It’s Sputnik, not Apollo – We can’t burn it all
• C Storage not pracLcally relevant for decades, if ever
35 Copyright Jonathan Koomey 2014

Most 2050 infrastructure built between now and 2050
36 Copyright Jonathan Koomey 2014

Forecasts o�en underesLmate the possibiliLes for change
• Economic models (with very few excepLons) – assume current rigidiLes will conLnue forward in the forecast (“The Big Mistake”, related to Ascher’s “assumpLon drag”)
– assume structure of property rights is constant – ignore increasing returns to scale – rely on incomplete technology and policy pornolios – ignore “no-‐regrets” opLons
• All but last issue true for top-‐down AND boFom-‐up models
37 Copyright Jonathan Koomey 2014

Delaying makes no sense in the warming limit context
• When we act makes a difference • Delaying acLon on climate
– eats up the budget – makes required reducLons more difficult and costly later
– sacrifices learning and reduces possibiliLes for future acLon
• Remember, energy techs don’t ∆ fast
38 Copyright Jonathan Koomey 2014

Impacts of Uncertainty, Learning, and Spillovers (IPCC AR4 , 2007)
Figure 2.2. Emissions impacts of exploring the full spectrum of technological uncertainty in a given scenario without climate policies. Rela=ve frequency (percent) of 130,000 scenarios of full technological uncertainty regrouped into 520 sets of technology dynamics with their corresponding carbon emissions (GtC) by 2100 obtained through numerical model simula=ons for a given scenario of intermediary popula=on, economic output, and energy demand growth. Also shown is a subset of 13,000 scenarios grouped into 53 sets of technology dynamics that are all "op=mal" in the sense of sa=sfying a cost minimiza=on criterion in the objec=ve func=on. The corresponding distribu=on func=on is bi-‐modal, illustra=ng "technological lock-‐in" into low or high emissions futures respec=vely that arise from technological interdependence and spillover effects. Baseline emissions are an important determinant for the feasibility and costs of achieving par=cular climate targets that are ceteris paribus cheaper with lower baseline emissions. Adapted from Gritsevskyi and Nakicenovic, 2000.
39 Copyright Jonathan Koomey 2014

Decanio concludes…
“The applicaLon of general equilibrium analysis to climate policy has produced a kind of specious precision, a situaLon in which the assumpLons of the analysts masquerade as results that are solidly grounded in theory and the data. This leads to a tremendous amount of confusion and mischief, not least of which is the noLon that although the physical science of the climate is plagued by uncertainLes, it is possible to know with a high degree of certainty just what the economic consequences of alternaLve policy acLons will be.” (italics in original)
40 Copyright Jonathan Koomey 2014

Fossil fuel resources are huge
41 Source: Table A-‐1 from Cold Cash, Cool Climate, mainly using GEA data 2012
Note: Current annual global primary energy use is 0.6 ZJ (1 ZJ = 1000 EJ or 10e21 J), which is about 30 TW.
Copyright Jonathan Koomey 2014


![Capitulo I Unidad Koomey[1]](https://img.pdfslide.net/doc/110x75/56d6c0261a28ab30169926c1/capitulo-i-unidad-koomey1.jpg)