Embed Size (px)
Citation preview
Climatic Changes in Southern Connecticut Recorded by Pollen Deposition at Rogers LakeAuthor(s): Margaret B. DavisSource: Ecology, Vol. 50, No. 3 (May, 1969), pp. 409-422Published by: Ecological Society of AmericaStable URL: http://www.jstor.org/stable/1933891 .Accessed: 20/08/2011 18:35
Your use of the JSTOR archive indicates your acceptance of the Terms & Conditions of Use, available at .http://www.jstor.org/page/info/about/policies/terms.jsp
JSTOR is a not-for-profit service that helps scholars, researchers, and students discover, use, and build upon a wide range ofcontent in a trusted digital archive. We use information technology and tools to increase productivity and facilitate new formsof scholarship. For more information about JSTOR, please contact [email protected].
Ecological Society of America is collaborating with JSTOR to digitize, preserve and extend access to Ecology.
http://www.jstor.org
CLIMATIC CHANGES IN SOUTHERN CONNECTICUT RECORDED BY POLLEN DEPOSITION AT ROGERS LAKE
MARGARET B. DAVIS
Department of Zoology and Great Lakes Research Division University of Michigan, Ann Arbor, Mich.
(Accepted for publication November 2, 1968)
Abstract. Rates of deposition of pollen grains throughout late- and postglacial time were determined from the pollen concentration in radiocarbon-dated sediment. Changes by a factor of 5 or more for all except rare pollen types from one level to the next were considered sig- nificant indication of changes in the pollen input to the lake, reflecting changes in the pollen productivity of the surrounding vegetation.
Low pollen deposition rates in the oldest sediments reflect the prevalence of tundra vegeta- tion between 14,000 and 12,000 years ago. An increase in the rate for tree pollen occurred 12,000 years ago, when boreal woodland became established. The rates continued to increase until a sudden sharp rise for white pine, hemlock, poplar, oak, and maple pollen 9,000 years ago marked the establishment of forest, similar perhaps to modern forests of the northern Great Lakes region. Pine pollen rates declined 8,000 years ago, and deciduous tree pollen became dominant. Ragweed pollen was deposited at relatively high rates 8,000 years ago, reflecting changes in the vegetation associated with the "prairie period' recorded in the Great Lakes region at this time. Subsequent changes in pollen deposition rates reflect the immi- gration of beech (6,500 years B.P.), hickory (5,500 years B.P.), and chestnut (2,000 B.P.) to southern Connecticut. During the past few hundred years pollen deposition rates reflect changes in the vegetation caused by disturbance by European settlers. Throughout much of postglacial time the pollen assemblages deposited at Rogers Lake are different from assemblages known from modern sediment. This makes climatic interpretation difficult and suggests that the forest associations of the region as they are recognized now are of quite recent origin.
INTRODUCTION
Fossil pollen grains from terrestrial plants occur abundantly and almost ubiquitously in Quaternary sediments. They form a continuous fossil record in the organic muds accumulating in lakes and peat bogs, providing one of the richest sources of information about the terrestrial environment of the past. Analyses of fossil pollen, presented as pollen diagrams, show the percentages of different pollen types changing characteristically from one stratigraphic level to another, defining various stratigraphic horizons, and thereby aiding in cor- relation of sediments. Many changes resemble differences between modern pollen assemblages associated with different vegetation types. Be- cause these changes in pollen are widespread, oc- curring in contemporaneously deposited sediment of all types, they must reflect changes in ancient vegetation similar to the geographical differences in modern vegetation. Thus pollen diagrams pro- vide evidence for a sequence of vegetation changes, induced by a series of changes in regional climate (von Post 1967).
In this paper I have sought to augment the in- formation contained in the traditional pollen per- centage diagram by estimating rates of deposition of pollen grains in the accumulating sediment. Deposition rates at different times in the past can be compared meaningfully, since the yearly influx
of each pollen type is independent of the influx of other pollen types. Changes in deposition rates infer changes in species abundances of plants that cannot be inferred with certainty from pollen per- centages. Furthermore, many fossil assemblages are different from pollen assemblages known in modern sediment and cannot be compared with the present. Interpretation of these pollen se- quences can now be made by comparing pollen deposition rates as they change from level to level (Tsukada and Stuiver 1966). As more informa- tion becomes available on present pollen deposi- tion rates and their relationship to modern vegeta- tion, it may become possible to read pollen depo- sition rate diagrams directly as a record of density of vegetation on the landscape (Davis and Deevey 1964). Interpretations offered here have been more cautious because little is known about fac- tors that control pollen input to and distribution within lakes (Davis 1967a, 1968). Nevertheless, the results have enlarged upon and strengthened previous interpretations of vegetation based on pollen percentages, providing new insights into the climatic history of southern Connecticut.
LOCATION OF SITE
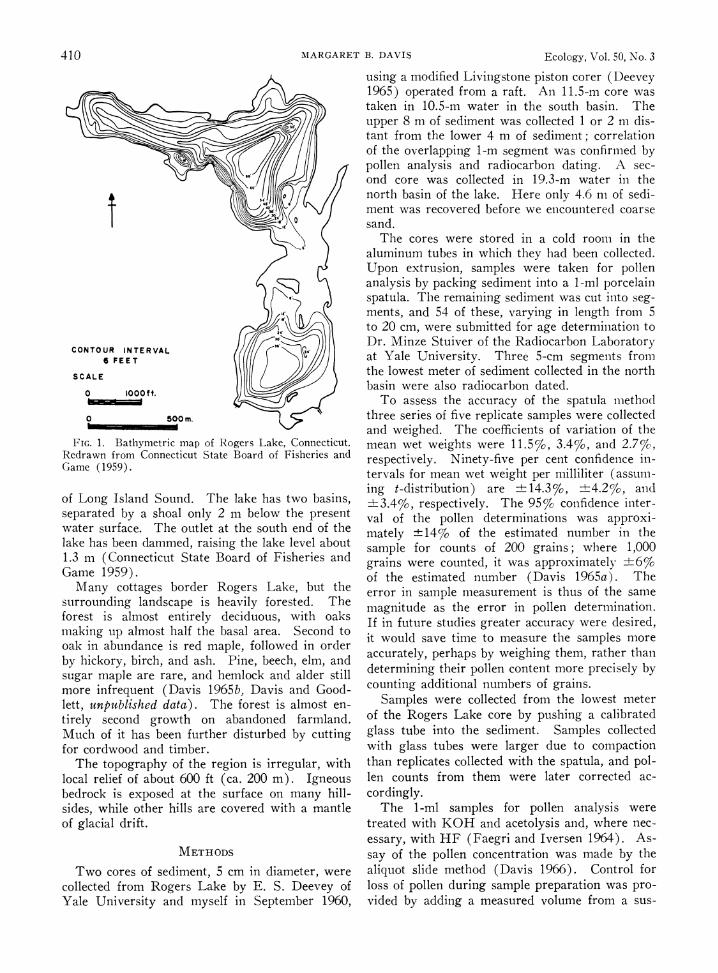
Rogers Lake (Fig. 1) is a large (107 ha) lake in southern Connecticut (410 22' N, 720 7' W), 6 km east of the Connecticut River and 8 km north
410 MARGARET B. DAVIS Ecology, Vol. 50, No. 3
CONTOUR INTERVAL 6 FEET
SCALE
O IOO0ft.
0 500m.
FIG. 1. Bathymetric map of Rogers Lake, Connecticut. Redrawn from Connecticut State Board of Fisheries and Game (1959).
of Long Island Sound. The lake has two basins, separated by a shoal only 2 m below the present water surface. The outlet at the south end of the lake has been dammed, raising the lake level about 1.3 m (Connecticut State Board of Fisheries and Game 1959).
Many cottages border Rogers Lake, but the surrounding landscape is heavily forested. The forest is almost entirely deciduous, with oaks making up almost half the basal area. Second to oak in abundance is red maple, followed in order by hickory, birch, and ash. Pine, beech, elm, and sugar maple are rare, and hemlock and alder still more infrequent (Davis 1965b, Davis and Good- lett, unpublished data). The forest is almost en- tirely second growth on abandoned farmland. Much of it has been further disturbed by cutting for cordwood and timber.
The topography of the region is irregular, with local relief of about 600 ft (ca. 200 m). Igneous bedrock is exposed at the surface on many hill- sides, while other hills are covered with a mantle of glacial drift.
METHODS
Two cores of sediment, 5 cm in diameter, were collected from Rogers Lake by E. S. Deevey of Yale University and myself in September 1960,
using a modified Livingstone piston corer (Deevey 1965) operated from a raft. An 11.5-m core was taken in 10.5-m water in the south basin. The upper 8 m of sediment was collected 1 or 2 m dis- tant from the lower 4 m of sediment; correlation of the overlapping 1-m segment was confirmed by pollen analysis and radiocarbon dating. A sec- ond core was collected in 19.3-m water in the north basin of the lake. Here only 4.6 m of sedi- ment was recovered before we encountered coarse sand.
The cores were stored in a cold room in the aluminum tubes in which they had been collected. Upon extrusion, samples were taken for pollen analysis by packing sediment into a 1-ml porcelain spatula. The remaining sediment was cut into seg- ments, and 54 of these, varying in length from 5 to 20 cm, were submitted for age determination to Dr. Minze Stuiver of the Radiocarbon Laboratory at Yale University. Three 5-cm segments from the lowest meter of sediment collected in the north basin were also radiocarbon dated.
To assess the accuracy of the spatula method three series of five replicate samples were collected and weighed. The coefficients of variation of the mean wet weights were 11.5%, 3.4%, and 2.7%, respectively. Ninety-five per cent confidence in- tervals for mean wet weight per milliliter (assum- ing t-distribution) are ? 14.3%, ?4.2%, and ?3.4%, respectively. The 95% confidence inter- val of the pollen determinations was approxi- mately ?+14% of the estimated number in the sample for counts of 200 grains; where 1,000 grains were counted, it was approximately ?6% of the estimated number (Davis 1965a). The error in sample measurement is thus of the same magnitude as the error in pollen determination. If in future studies greater accuracy were desired, it would save time to measure the samples more accurately, perhaps by weighing them, rather than determining their pollen content more precisely by counting additional numbers of grains.
Samples were collected from the lowest meter of the Rogers Lake core by pushing a calibrated glass tube into the sediment. Samples collected with glass tubes were larger due to compaction than replicates collected with the spatula, and pol- len counts from them were later corrected ac- cordingly.
The 1-ml samples for pollen analysis were treated with KOH and acetolysis and, where nec- essary, with HF (Faegri and Iversen 1964). As- say of the pollen concentration was made by the aliquot slide method (Davis 1966). Control for loss of pollen during sample preparation was pro- vided by adding a measured volume from a sus-
Late Spring 1969 CLIMATIC RECORD AT ROGERS LAKE 411
pension of pure Eucalyptus pollen to the samples before preparation; the Eucalyptus pollen was counted together with the native pollen on the aliquot slides and the percentage recovery calcu- lated. In only one case was the number of Euca- lyptus pollen in prepared samples significantly different from the estimated number added. (The exception is the sample from 8.37-m depth.) The control was not in use at the time the late-glacial samples were prepared. In these samples the pollen concentration was determined using an older method (Davis 1965a) and cannot be ac- cepted with equal confidence. From 200 to 1,000 grains total were counted on the aliquot slides; these counts were used both for estimation of the concentration of each type and for calculation of percentages.
Pollen from eastern white pine (Pinus strobus) was distinguished from pollen from the three other northeastern pine species (jack (P. banksiana), red (P. resinosa), and pitch (P. rigida), which were grouped as a single type) using the morpho- logical criterion described by Ueno (1958). Mi- croscope preparations from 11 samples were scanned under oil immersion and all pine grains were classified (Table 1); the results were extrap-
TABLE 1. Percentage contribution of species to total pine pollen from selected levels in the Rogers Lake core (Values for other levels were obtained by interpolation)
Other Estimated White P. banksiana,
Depth age of P. P. resinosa, Unidenti- (m) sample n strobus P. rigidas viable
.075 +206 25 28 36 36 1.72 1,525 50 38 30 32 4.86 3,890 50 38 32 30 7.59 7,348 25 36 32 32 8.37 8,332 50 56 12 32 8.71 8,657 50 72 6 22 9.08 9,354 50 34 40 26 9.38 9,936 50 14 58 28 9.63 10,489 50 8 74 18 9.74 10,760 50 0 84 16
10.14 11,806 50 20 48 32
olated to the intervening levels. The mounting medium used was silicone fluid, so grains could be turned to improve visibility, but even so, almost one-third of the grains were torn or folded in such a way that critical identification could not be made. This proportion remained the same re- gardless of which type was dominant, however, indicating that failures to identify did not bias estimates of the relative abundances of the two types. Within the non-white pine species group, size will distinguish jack and/or red pine pollen from the much larger pollen of pitch pine (White- head 1964). Measurements were not made on the Rogers Lake material, but are available from stratigraphically equivalent levels at other sites.
RESULTS AND DISCUSSION
Definition of terms
Pollen percentage is the percentage of any given pollen type among the total grains counted in a sample. Pollen percentages are plotted against depth or age of the sediment in the pollen per- centage diagram (the traditional "pollen dia- gram").
Sediment matrix accumulation rate is the net thickness of sediment accumulated per unit time, after compaction and diagenesis. It may also be expressed as the amount of time per unit thickness of sediment; this has been termed deposition time per centimeter in a recent paper by Waddington (1969).
Pollen concentration is the number of grains per unit volume of wet sediment. Pollen concen- tration (per unit volume or weight of sediment) is often referred to in the literature as "absolute pollen frequency," or APF.
Pollen deposition rate, or pollen accumulation rate, is the net number of grains accumulated per unit area of sediment surface per unit time. It can also be called pollen influx per unit time. E. J. Cushing (personal communication) has sug- gested that this term is appropriate since we are measuring grains falling on an area. In the pol- len deposition rate diagram, or pollen influx di- agram, the number per square centimeter per year is plotted against the age of the sediment. This type of diagram has also been called an "absolute diagram," an undesirable term because it leaves unspecified whether the diagram shows pollen con- centration or pollen deposition rate.
The general procedure in the study has been to multiply the pollen concentration at each level by the sediment matrix accumulation rate, in order to compute the pollen deposition rate.
Determination of sediment matrix accumulation rate
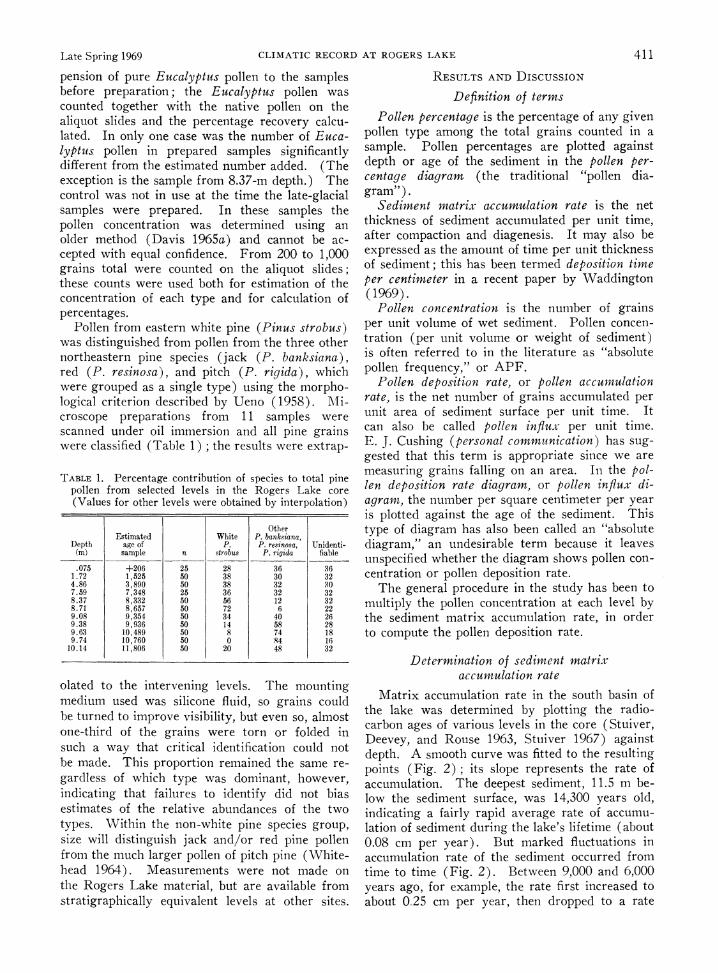
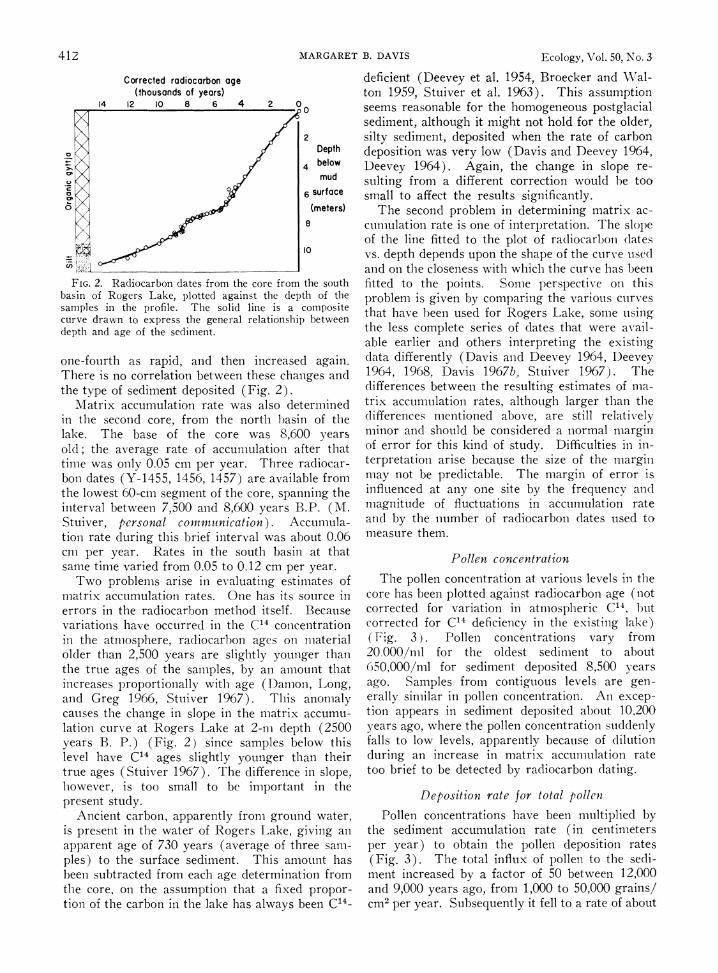
Matrix accumulation rate in the south basin of the lake was determined by plotting the radio- carbon ages of various levels in the core (Stuiver, Deevey, and Rouse 1963, Stuiver 1967) against depth. A smooth curve was fitted to the resulting points (Fig. 2); its slope represents the rate of accumulation. The deepest sediment, 11.5 m be- low the sediment surface, was 14,300 years old, indicating a fairly rapid average rate of accumu- lation of sediment during the lake's lifetime (about 0.08 cm per year). But marked fluctuations in accumulation rate of the sediment occurred from time to time (Fig. 2). Between 9,000 and 6,000 years ago, for example, the rate first increased to about 0.25 cm per year, then dropped to a rate
412 MARGARET B. DAVIS Ecology, Vol. 50, No. 3
Corrected radiocarbon age (thousands of years)
14 12 10 8 6 4 2 0
2 Depth below mud
2 6~~~~~~~~~~~~~~r Surface
0 t w ,,f z ] (meters) 8
10
FIG. 2. Radiocarbon dates from the core from the south basin of Rogers Lake, plotted against the depth of the samples in the profile. The solid line is a composite curve drawn to express the general relationship between depth and age of the sediment.
one-fourth as rapid, and then increased again. There is no correlation between these changes and the type of sediment deposited (Fig. 2).
Matrix accumulation rate was also determined in the second core, from the north basin of the lake. The base of the core was 8,600 years old; the average rate of accumulation after that time was only 0.05 cm per year. Three radiocar- bon dates (Y-1455, 1456, 1457) are available from the lowest 60-cm segment of the core, spanning the interval between 7,500 and 8,600 years B.P. (M. Stuiver, personal communication). Accumula- tion rate during this brief interval was about 0.06 cm per year. Rates in the south basin at that same time varied from 0.05 to 0.12 cm per year.
Two problems arise in evaluating estimates of matrix accumulation rates. One has its source in errors in the radiocarbon method itself. Because variations have occurred in the C14 concentration in the atmosphere, radiocarbon ages on material older than 2,500 years are slightly younger than the true ages of the samples, by an amount that increases proportionally with age (Damon, Long, and Greg 1966, Stuiver 1967). This anomaly causes the change in slope in the matrix accumu- lation curve at Rogers Lake at 2-m depth (2500 years B. P.) (Fig. 2) since samples below this level have C14 ages slightly younger than their true ages (Stuiver 1967). The difference in slope, however, is too small to be important in the present study.
Ancient carbon, apparently from ground water, is present in the water of Rogers Lake, giving an apparent age of 730 years (average of three sam- ples) to the surface sediment. This amount has been subtracted from each age determination from the core, on the assumption that a fixed propor- tion of the carbon in the lake has always been C14-
deficient (Deevey et al. 1954, Broecker and Wal- ton 1959, Stuiver et al. 1963). This assumption seems reasonable for the homogeneous postglacial sediment, although it might not hold for the older, silty sediment, deposited when the rate of carbon deposition was very low (Davis and Deevey 1964, Deevey 1964). Again, the change in slope re- sulting from a different correction would be too small to affect the results significantly.
The second problem in determining matrix ac- cumulation rate is one of interpretation. The slope of the line fitted to the plot of radiocarboi1 platess vs. depth depends upon the shape of the curve used and on the closeness with which the curve e has been fitted to the points. Somne perspective Oil this problem is given by comparing the various curves that have been used for Rogers Lake, some using the less complete series of dates that were avail- able earlier and others interpreting the existing data differently (Davis and Deevey 1964, Deevey 1964, 1968, Davis 1967b, Stuiver 1967). The differences between the resulting estimates of mna- trix accumulation rates, although larger than the differences mentioned above, are still relatively minor and should be considered a normal margin of error for this kind of study. Difficulties in in- terpretation arise because the size of the margin may not be predictable. The margin of error is influenced at any one site by the frequency and magnitude of fluctuations in accumulation rate and by the number of radiocarbon dates used to measure them.
Pollen concentration
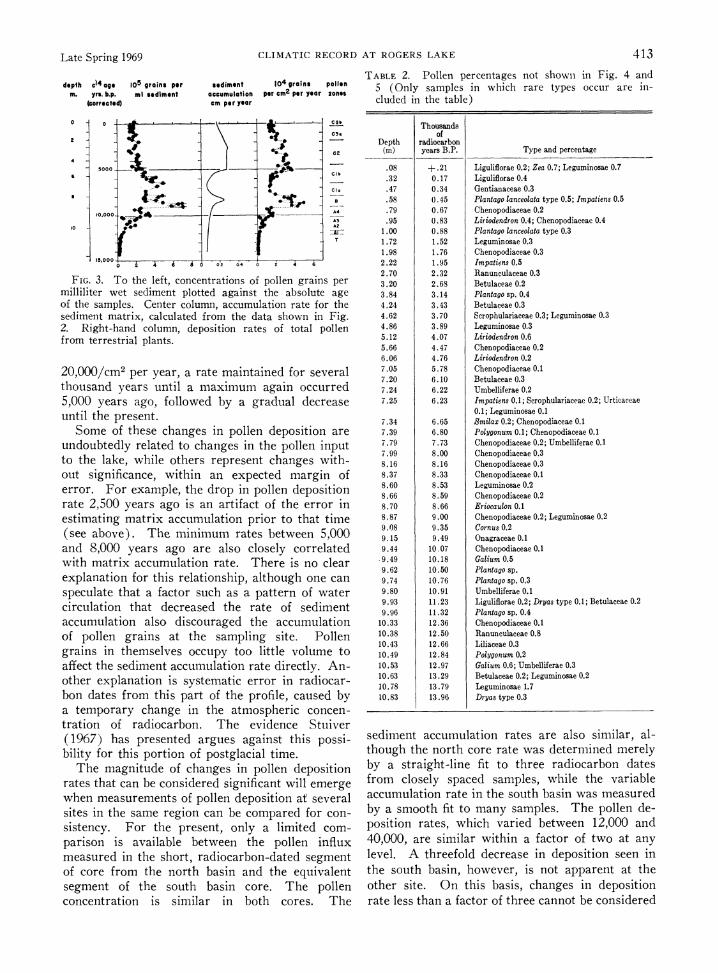
The pollen concentration at various levels in the core has been plotted against radiocarbon age (not corrected for variation in atmospheric C14. but corrected for C14 deficiency in the existing lake) ( Fig. 3 ). Pollen concentrations vary from 20 000/ml for the oldest sediment to about 650,000/ml for sediment deposited 8,500 years ago. Samples from contiguous levels are gen- erally similar in pollen concentration. An excep- tion appears in sediment deposited about 10,200 years ago, where the pollen concentration suddenly falls to low levels, apparently because of dilution during an increase in matrix accumulation rate too brief to be detected by radiocarbon dating.
Deposition rate for total pollen
Pollen concentrations have been multiplied by the sediment accumulation rate (in centimeters per year) to obtain the pollen deposition rates (Fig. 3). The total influx of pollen to the sedi- ment increased by a factor of 50 between 12,000 and 9,000 years ago, from 1,000 to 50,000 grains/ cm2 per year. Subsequently it fell to a rate of about
Late Spring 1969 CLIMATIC RECORD AT ROGERS LAKE 413
depth c4age 105 grains per sediment 104 grains pollen m. yrs. b.p. ml sediment accumulation per cm2 per year zones
(corrected) cm per year
0 0 G -- V3b
2 0
4 - _ .- -
10 000 t /t
~ % 04
25,000 10.000 4 6 a 0.2 04 0 2 4 6
FIG. 3. To the left, concentrations of pollen grains per milliliter wet sediment plotted against the absolute age of the samples. Center column, accumulation rate for the sediment matrix, calculated from the data shown in Fig. 2. Right-hand column, deposition rates of total pollen from terrestrial plants.
20,000/cm2 per year, a rate maintained for several thousand years until a maximum again occurred 5,000 years ago, followed by a gradual decrease until the present.
Some of these changes in pollen deposition are undoubtedly related to changes in the pollen input to the lake, while others represent changes with- out significance, within an expected margin of error. For example, the drop in pollen deposition rate 2,500 years ago is an artifact of the error in estimating matrix accumulation prior to that time (see above). The minimum rates between 5,000 and 8,000 years ago are also closely correlated with matrix accumulation rate. There is no clear explanation for this relationship, although one can speculate that a factor such as a pattern of water circulation that decreased the rate of sediment accumulation also discouraged the accumulation of pollen grains at the sampling site. Pollen grains in themselves occupy too little volume to affect the sediment accumulation rate directly. An- other explanation is systematic error in radiocar- bon dates from this part of the profile, caused by a temporary change in the atmospheric concen- tration of radiocarbon. The evidence Stuiver (1967) has presented argues against this possi- bility for this portion of postglacial time.
The magnitude of changes in pollen deposition rates that can be considered significant will emerge when measurements of pollen deposition at several sites in the same region can be compared for con- sistency. For the present, only a limited com- parison is available between the pollen influx measured in the short, radiocarbon-dated segment of core from the north basin and the equivalent segment of the south basin core. The pollen concentration is similar in both cores. The
TABLE 2. Pollen percentages not shown in Fig. 4 and 5 (Only samples in which rare types occur are in- cluded in the table)
Thousands of
Depth radiocarbon (m) years B.P. Type and percentage
.08 +.21 Liguliflorae 0.2; Zea 0.7; Leguminosae 0.7
.32 0.17 Liguliflorae 0.4
.47 0.34 Gentianaceae 0.3
.58 0.45 Plantago lanceolata type 0.5; Impatiens 0.5
.79 0.67 Chenopodiaceae 0.2
.95 0.83 Liriodendron 0.4; Chenopodiaceac 0.4 1.00 0.88 Plantago lanceolata type 0.3 1 .72 1 .52 Leguninosae 0.3 1.98 1.76 Chenopodiaceae 0.3 2.22 1.95 Impatiens 0.5 2.70 2.32 Ranunculaceae 0.3 3.20 2.68 Betulaceae 0.2 3.84 3.14 Plantago sp. 0.4 4.24 3 .43 Betulaceae 0.3 4.62 3.70 Scrophulariaceae 0.3; Leguninosae 0.3 4.86 3.89 Leguminosae 0.3 5.12 4.07 Liriodendron 0.6 5.66 4.47 Chenopodiaceae 0.2 6.06 4.76 Liriodendron 0.2 7.05 5.78 Chenopodiaceae 0.1 7.20 6.10 Betulaceae 0.3 7.24 6.22 Umbelliferae 0.2 7.25 6.23 Impatiens 0.1; Scrophulariaceac 0.2; Urticaceae
0.1; Leguninosae 0.1 7.34 6.65 Smilax 0.2; Chenopodiaceae 0.1 7.39 6.80 Polygonum 0.1; Chenopodiaceae 0.1 7.79 7.73 Chenopodiaceae 0.2; Umbelliferae 0.1 7.99 8.00 Chenopodiaceae 0.3 8.16 8.16 Chenopodiaceae 0.3 8.37 8.33 Chenopodiaceae 0.1 8.60 8.53 Leguminosae 0.2 8.66 8.59 Chenopodiaceae 0.2 8.70 8.66 Eriocaulon 0.1 8.87 9.00 Chenopodiaceae 0.2; Leguminosae 0.2 9.08 9.35 Cornus 0.2 9.15 9.49 Onagraceae 0.1 9.44 10.07 Chenopodiaceae 0.1 9.49 10.18 Galium 0.5 9.62 10.50 Plantago sp. 9.74 10.76 Plantago sp. 0.3 9.80 10.91 Umbelliferae 0.1 9.93 11.23 Liguliflorae 0.2; Dryas type 0.1; Betulaceae 0.2 9.96 11.32 Plantago sp. 0.4
10.33 12.36 Chenopodiaceae 0.1 10.38 12.50 Ranunculaceae 0.8 10.43 12.66 Liliaceae 0.3 10.49 12.84 Polygonum 0.2 10.53 12.97 Galium 0.6; Umbelliferae 0.3 10.63 13.29 Betulaceae 0.2; Leguminosae 0.2 10.78 13.79 Leguminosae 1.7 10.83 13.96 Dryas type 0.3
sediment accumulation rates are also similar, al- though the north core rate was determined merely by a straight-line fit to three radiocarbon dates from closely spaced samples, while the variable accumulation rate in the south basin was measured by a smooth fit to many samples. The pollen de- position rates, which varied between 12,000 and 40,000, are similar within a factor of two at any level. A threefold decrease in deposition seen in the south basin, however, is not apparent at the other site. On this basis, changes in deposition rate less than a factor of three cannot be considered
414 MARGARET B. DAVIS Ecology. Vol. 50. No. 3
significant. (The margin of error is greater for rare pollen types whose concentration has not been determined as accurately.) Taking into ac- count the additional error introduced at certain levels by problems in radiocarbon dating, changes
in pollen deposition by a factor of five are prob- ably the smallest attributable to variations in pol- len input to the lake. Future studies will indicate whether this opinion is too conservative or too optimistic.
ROGERS LAKE - TREE POLLEN PERCENTAGES
I C E
Ga E O~ C> ,, @ E ?_ _
0 0[t r | T -e '8 U-E C E , -- _
. a a a , L i
a, 00 O E O E~~~~~~~~~~~~~~~~~~~~~~~~~~~~~~~~~~a *.~~~~~~~~~~~~~~~~ ~~~~~~~j~~~~~~~~~~~-~~~~~~-oa, 0 I-W= o o - _a .u a. uEU a_
o O- --- -- -- ----- ----- ----- ---- C 4 _ _ _ _ __ _ _ _ - - t- - -- - a - - --b-- t -
2 ----------------- - ---
0420 0 0 20 40 0 C0 0'
a ,8 ',, ---- --- S--- -- - -- -
j a , - 2o aaa ?0 ~ a * CE
U>C ~ ~ ~ ~~~~~~~ ~ 0C 0 a.Ca 40Q 40~tQo < < K o C Z..J0- Co
o0'-' b'-'-'; -'J--W2t C ; -F--b -
2 6 _- -- --------- ---------- ------
6 _ _____ _C__ , -Tj-|tJlt1t}. 4
C)~~~~~~~~~~~~~~~~~~~~~~~~~~~~~~~~~i
Cla
< 8 -A - '- - t- - - - - - - - - - - - - - - - !--'}- - A--E -'t-;---
0 A2 o 2 4~~~~~~~~~~~~~~~~~~~~~~A
-0 0 066 o4o '' o2~6
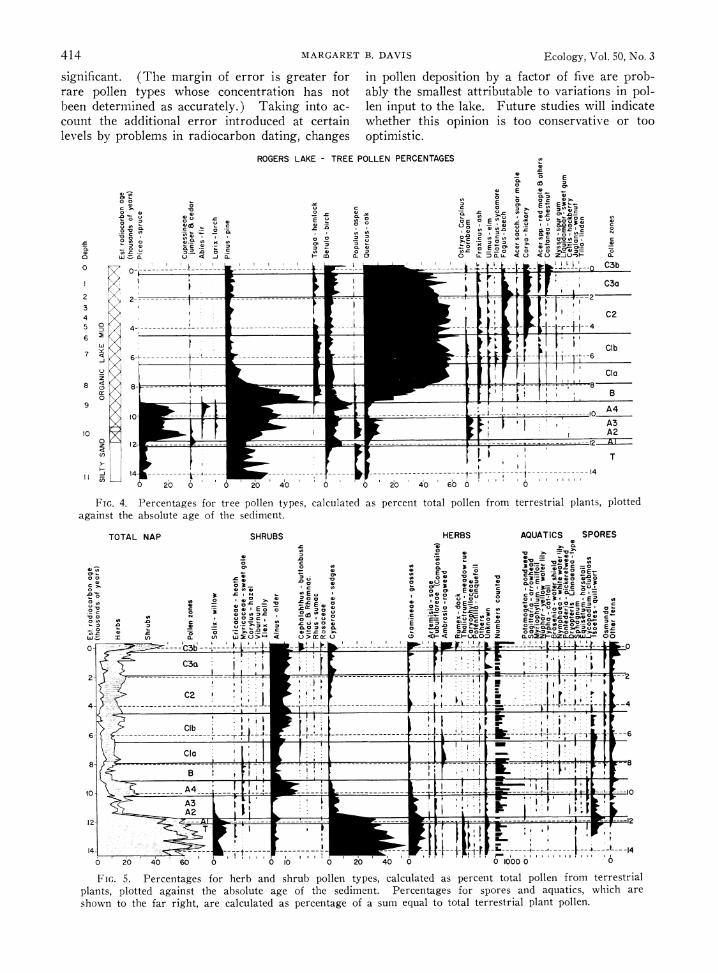
FIG. 4. Percentages for treebadhu pollen types, calculated as percent total pollen from terrestrialplnspote
patpotdagainst the absolute age of the sediment. Pretgsfrsoe n qais hc r
shown0 6 40 6 6 ~ o C o total a ,
FIG 4 Prcetaesfortre olln yps, alulte Cs aen toa olnf m tresra lns lte
agantteasoueaeo the sedi meCnt2
C a,. 0 0)~~ ~ ~~~~ ~ ~~~~ ~ ~~0 Wa,0 3aaa _3) C.CE~ ..-.)a a3: aaaE,.a a 0~~~~~4 0 0 Ee CO 5 3 CEa
a, a, ~~~0 a,.0) ~o0 aE 0; _ aEE0- a,:C 'C 0.C - 0 ~~~5a, 0 0 - a~o..a,.OWOCE5O C
- - a. a~~~~~~a~~a, a, C0~~~~~~~ ~I 0 a O1 E E9, S E=
0 - C~~~~~~b~--VL 4 2..... OAE 2 1 ___~~~~~~~~~~~~~~~~~~~~~~~~~~~~~~~.. &Z I ,a4Z . 2C 'v 3~~~~~~~~~~~~_1 0
tO B - Lz~~~~~~~~~~~~~~~~~~~~~z't;O
40 0 6 0 10' I= 0 1- o' bE = 0 1C0000 6, U ,
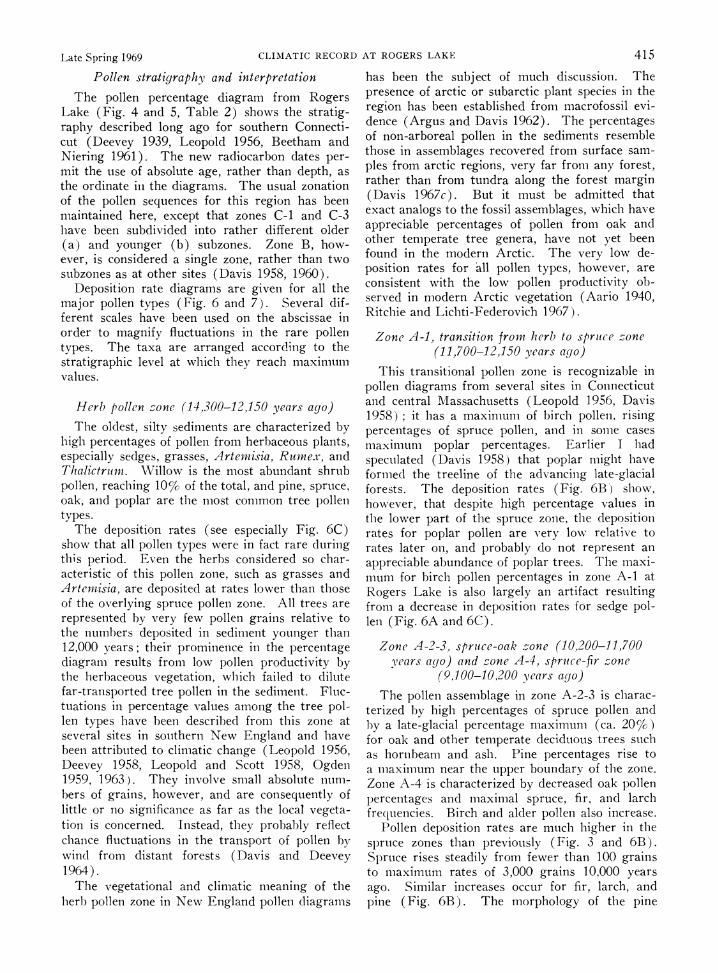
FIG. 5. Percent~age for herb - and >shru pole tye, acuaeda percent tta plln from terrestrial--- 0 plns plte 0gis h boueaeo h eiet.Pretgsfrsoe n qais hc r
shownto te fa rigt, ae caculaed a perentae of sumequa to otalterrstril plnt pllen
late Snrinp 1969 CLIMATIC RECORD AT ROGERS LAKE 415
Pollen stratigrapizy and interpretation
The pollen percentage diagram from Rogers Lake (Fig. 4 and 5, Table 2) shows the stratig- raphy described long ago for southern Connecti- cut (Deevey 1939, Leopold 1956, Beetham and Niering 1961). The new radiocarbon dates per- mit the use of absolute age, rather than depth, as the ordinate ill the diagrams. The usual zonation of the pollen sequences for this region has been maintained here, except that zones C-1 and C-3 have been subdivided into rather different older (a) and younger (b) subzones. Zone B, how- ever, is considered a single zone, rather than two subzones as at other sites (Davis 1958, 1960).
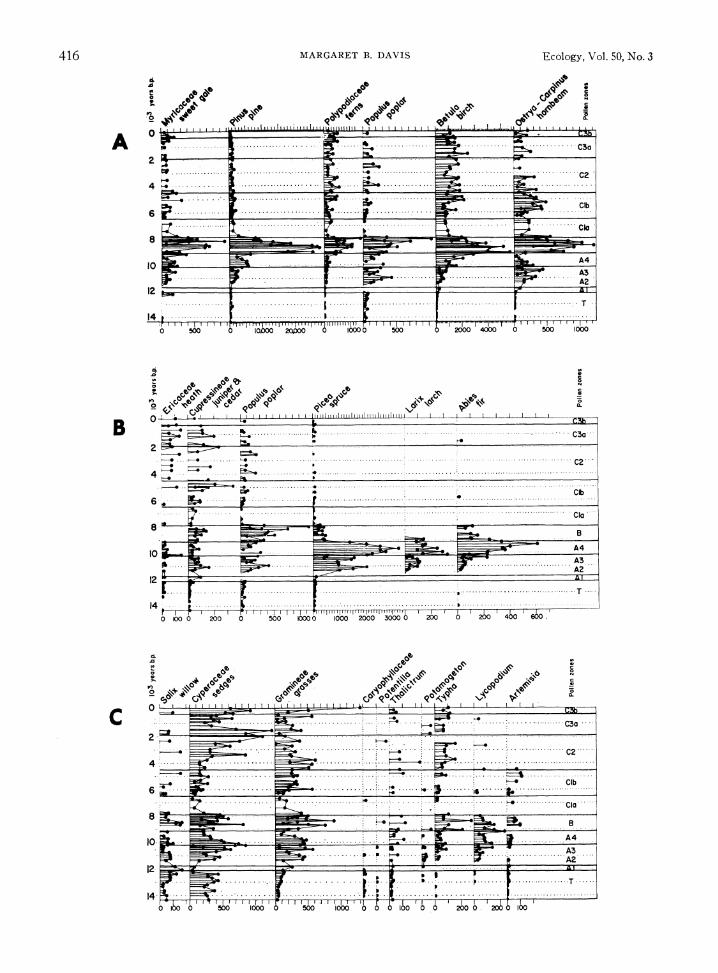
Deposition rate diagrams are given for all the major pollen types (Fig. 6 and 7). Several dif- ferent scales have been used on the abscissae in order to magnify fluctuations in the rare pollen types. The taxa are arranged according to the stratigraphic level at which they reach maximum values.
Herb pollen -one (14,300-12,150 years ago)
The oldest, silty sediments are characterized by high percentages of pollen from herbaceous plants, especially sedges, grasses, Artemisia, Rumex, and Thalictrutn. Willow is the most abundant shrub pollen, reaching 10% of the total, and pine, spruce, oak, and poplar are the most common tree pollen types.
The deposition rates (see especially Fig. 6C) show that all pollen types were in fact rare during this period. Even the herbs considered so char- acteristic of this pollen zone, such as grasses and Artenuisia, are deposited at rates lower than those of the overlying spruce pollen zone. All trees are represented by very few pollen grains relative to the numbers deposited in sediment younger than 12,000 years; their prominence in the percentage diagram results from low pollen productivity by the herbaceous vegetation, which failed to diltute far-transported tree pollen in the sediment. Fluc- tuations in percentage values among the tree pol- len types have been described from this zone at several sites in southern New England and have been attributed to climatic change (Leopold 1956, Deevey 1958, Leopold and Scott 1958, Ogden 1959, 1963). They involve small absolute num- bers of grains, however, and are consequently of little or no significance as far as the local vegeta- tion is concerned. Instead, they probably reflect chance fluctuations in the transport of pollen by wind from distant forests (Davis and Deevey 1964).
The vegetational and climatic meaning of the herb pollen zone in New England pollen diagrams
has been the subject of much discussion. The presence of arctic or subarctic plant species in the region has been established from macrofossil evi- dence (Argus and Davis 1962). The percentages of non-arboreal pollen in the sediments resemble those in assemblages recovered from surface sam- ples from arctic regions, very far from any forest, rather than from tundra along the forest margin (Davis 1967c). But it must be admitted that exact analogs to the fossil assemblages, which have appreciable percentages of pollen from oak and other temperate tree genera, have not yet been found in the modern Arctic. The very low de- position rates for 'all pollen types, however, are consistent with the low pollen productivity ob- served in modern Arctic vegetation (Aario 1940, Ritchie and Lichti-Federovich 1967).
Zone A-i, transition from herb to spru ce zone (11,700-12,150 years ago)
This transitional pollen zone is recognizable in pollen diagrams from several sites in Connecticut and central Massachusetts (Leopold 1956, Davis 1958); it has a maximum of birch pollen, rising percentages of spruce pollen, and in some cases maximum poplar percentages. Earlier I had speculated (Davis 1958) that poplar might have formed the treeline of the advancing late-glacial forests. The deposition rates (Fig. 6B) show, however, that despite high percentage values in the lower part of the spruce zone, the deposition rates for poplar pollen are very low relative to rates later on, and probably do not represent an appreciable abundance of poplar trees. The maxi- mum for birch pollen percentages in zone A-i at Rogers Lake is also largely an artifact resulting from a decrease in deposition rates for sedge pol- len (Fig. 6A and 6C).
Zone A-2-3, spruce-oak zone (10,200-11,700 years ago) and zone A-4, spruce-fir zone
(9,100-10 200 years ago)
The pollen assemblage in zone A-2-3 is charac- terized by high percentages of spruce pollen and by a late-glacial percentage maximum (ca. 20%c) for oak and other temperate deciduous trees such as hornbeam and ash. Pine percentages rise to a maximum near the upper boundary of the zone. Zone A-4 is characterized by decreased oak pollen percentages and maximal spruce, fir, and larch frequencies. Birch and alder pollen also increase.
Pollen deposition rates are much higher in the spruce zones than previously (Fig. 3 and 6B). Spruce rises steadily from fewer than 100 grains to maximum rates of 3,000 grains 10,000 years ago. Similar increases occur for fir, larch, and
pine (Fig. 6B). The morphology of the pine
416 MARGARET B. DAVIS 'Ecology, Vol. 50, No. 3
b~~~~~~~~ i
CIO &V md,~~~~~~~~~~~~~~~~~~~~~~~~~~ 0; %'- p\ a a 0 *.~~~~~~~~~~~~A 14 00 % 'Ib '0'e ~ ~ ~ _________ A2
2 +-N~~~~~~~~~~~~~~~~~~~~~~~~ 0~~~~~~~~~~~~~~~~~~~~' i
o 500 IO$)00 20000 ~~) 0000 500 2000 4000 0 500 1C00
f2
A~~~~A C 1
C2
CIa
12
' 4 . . . . . ._.. . . ._.. . . . . . .
0 0 50 10050 1000 00010000 5 004000 0100 0
Late Spring 1969 CLIMATIC RECORD AT ROGERS LAKE 417
10A. . . i . , A4
Ao A3
12 I.:
il 6 '11 266 4"i o 6 4 56o 61 666' ''5o' 65"6"% ' b"''16"'66' ' 'z
0~~~~~
.....-.-.* C3aT 2
FC2 We* Cb
HS~~~~~~~~~~~~~~~~~~~~~~...... . g ^>
6 CIO
8 ~~~~~~~~~~~~~~~~~~~~~~~~~~~~~~~~~~~B A4 10 I|4_?A
r , p * C | ~~~~~~~~~~~~~~~~~~~~~~~~A2
.T
14 . .'...
1000 2 000 0 1000 210000 1506 0 o 5000 500 1000 0 500 1000 5001000
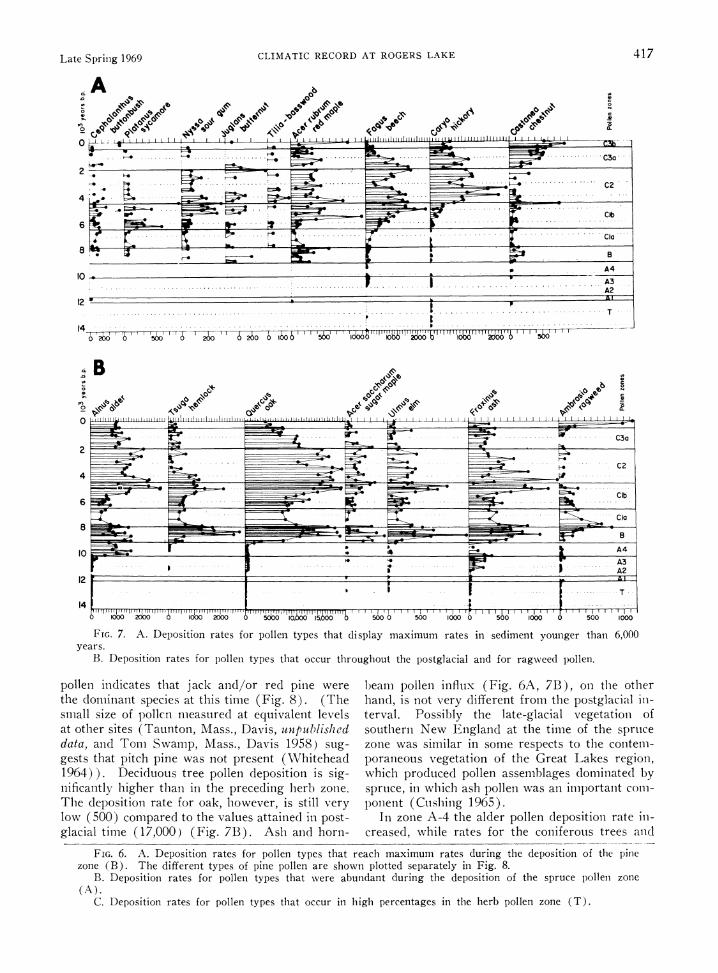
FIG. 7. A. Deposition rates for pollen types that display maximum rates in sediment younger than 6,000O years.
B. Deposition rates for pollenl types that occur throughout the p)ostglacial anld for ragweed pollenl.
pollen indicates that jack and/or red pine were the dominant species at this time (Fig. 8). (The small size of pollen measured at equivalent levels at other sites (Taunton, Mass., Davis, unpublished data, and Tom Swamp, Mass., Davis 1958) sug- gests that pitch pine was not present (Whitehead 1964)). Deciduous tree pollen deposition is sig- nificantly higher than in the preceding herb zone. The deposition rate for oak, however, is still very low (500) compared to the values attained in post- glacial time (17,000) (Fig. 7B). Ash and horn-
l)eam pollen influx (Fig. 6A, 7B), on the other hand, is not very different from the postglacial in- terval. Possibly the late-glacial vegetation of southern New England at the time of the spruce zone was similar in some respects to the contem- poraneous vegetation of the Great Lakes region, which produced pollen assemblages domi nated by spruce, in which ash pollen was an imlportant corin- oonent (Cushing 1965).
In zone A-4 the alder pollen deposition rate in- creased, while rates for the coniferous trees and
FIG. 6. A. Deposition rates for pollen types that reach maximum rates during the deposition of the pine zone (B). The different types of pine pollen are shown plotted separately in Fig. 8.
B. Deposition rates for pollen types that were abundant during the deposition of the spruce pollen zone (A).
C. Deposition rates for pollen types that occur in high percentages in the herb pollen zone (T).
418 MARGARET B. DAVIS Ecology, Vol. 50, No. 3
r A. B. c o o +,-ffi: PERCENT ABSOLUTE ACCUMULATION RATE z 0 O N2 TOTAL POLLEN THOUSANDS OF GRAINS PER CM2 PER YEAR
0 0 total pine total red, jock 1 white pine pitch pine
C< 2 0b - _ _ _ _ _ _ _ _ _ _ _ _ _ _ _ _ _ _ _ C3a 2000 -
C2 4000
CIb 6000
CIO 8000 - 8 0 ., -.--,-,- ..... ... : :
A 4 _IO ,O O X -:-: :-- :: :: > ........... ... . . ... .. . p ........................... A 4 _ _..._._....... ..... ...
A 3 ... ... ............ tif ied A 2
A I 12 ,00 0- -_ _ _ _ _ _ _ _ _ _ _ _ _ _ _ _ _ _ _
T 14,000....
0 20 40 60% 10 20 0 10 0 10 20
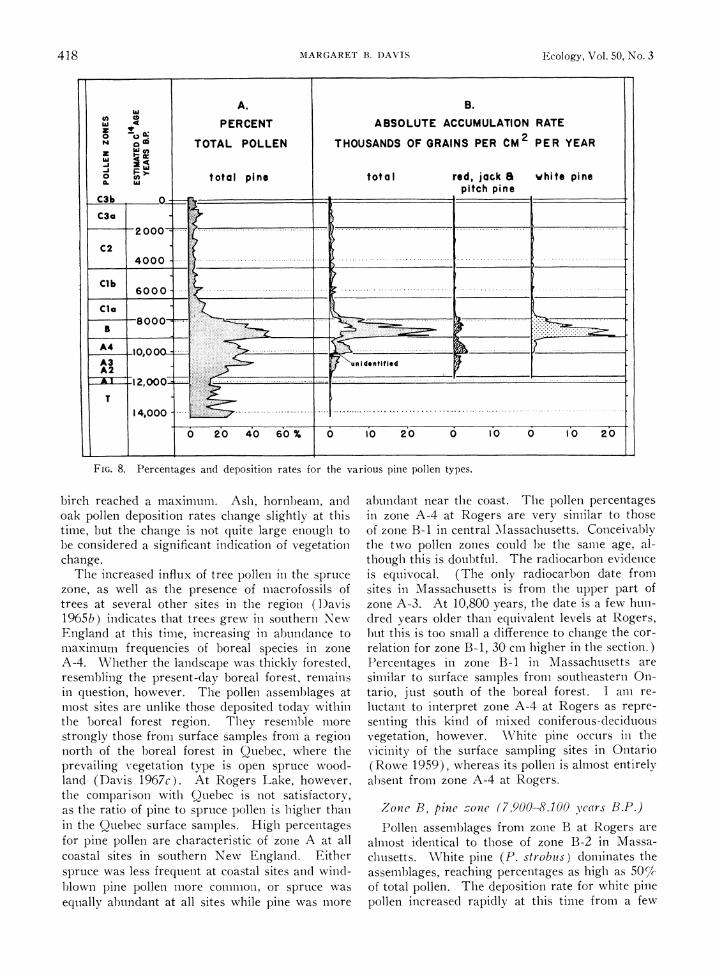
FIG. 8. Percentages and deposition rates for the various pine pollen types.
birch reached a maximum. Ash, hornbeam, and oak pollen deposition rates change slightly at this time, but the change is not quite large enough to be considered a significant indication of vegetation change.
The increased influx of tree pollen in the spruce zone, as well as the presence of macrofossils of trees at several other sites in the region (lDavis 1965b) indicates that trees grew in southern New England at this time, increasing in abundance to maximum frequencies of boreal species in zone A-4. Whether the landscape was thickly forested, resembling the present-day boreal forest, remains in question, however. The pollen assemblages at most sites are unlike those deposited today within the boreal forest region. They resemble more strongly those from surface samples from a region north of the boreal forest in Quebec, where the prevailing vegetation type is open spruce wood- land (Davis 1967c). At Rogers Lake, however, the comparison with Quebec is not satisfactory, as the ratio of pine to spruce pollen is higher than in the Quebec surface samples. High percentages for pine pollen are characteristic of zone A at all coastal sites in southern New England. Either spruce was less frequent at coastal sites and wind- blown pine pollen more common, or spruce was equally abundant at all sites while pine was more
abundant near the coast. The pollen percentages in zone A-4 at Rogers are very similar to those of zone B-1 in central AIassachusetts. Conceivably the two pollen zones could be the same age, al- though this is doubtful. The radiocarbon evidence is equivocal. (The only radiocarbon date from sites in Massachusetts is from the upper part of zone A-3. At 10,800 years, the date is a few hun- dred years older than equivalent levels at Rogers, bnt this is too small a difference to change the cor- relation for zone B-1, 30 cm higher in the section.) Percentages in zone B-1 in Massachusetts are similar to surface samples from southeastern On- tario, just south of the boreal forest. I am re- luctant to interpret zone A-4 at Rogers as repre- senting this kind of mixed coniferous-deciduous vegetation, however. White pine occurs in the vicinity of the surface sampling sites in Ontario (Rowe 1959), whereas its pollen is almost entirely absent from zone A-4 at Rogers.
Zone B., pine tone (7,900-8,100 ears B.P.)
Pollen assemblages from zone B at Rogers are almost identical to those of zone B-2 in Massa- chusetts. White pine (P. strobus) dominates the assemblages, reaching percentages as high as 50%lc of total pollen. The deposition rate for white pine pollen increased rapidly at this time from a few
Late Spring 1969 CLIMATIC RECORD AT ROGERS LAKE 419
hundred grains to 20,000 grains (Fig. 8). The increase was so rapid that pollen from several other genera, also increasing at this time, can hardly be noticed in the percentage diagram; the rate diagrams (Fig. 6A and 7B) show clearly, however, that pollen of the Myricaceae, poplar, birch, alder, hornbeam, oak, and hemlock, and fern spores reached a maximum. (The fern spores are from the Polypodiaceae, rather than Pteridium, which occurs characteristically in the pine zone in Minnesota (McAndrews 1966) ). Also apparent (Fig. 6B) is the rapid decrease in de- position rates, as well as percentages, for boreal genera such as spruce, fir, and larch.
The climate must have changed dramatically at this time to produce such a striking change in the vegetation (Wright 1964, Ogden 1967). \Vhite pine, hemlock, and oak are distributed at present south of about 46? N lat in eastern Canada. Hemlock is the most restricted in range, occurring only to the south and east of Lake Superior. In the east white pine and hemlock range far south- ward along the Appalachian Mountain chain, but in the Midwest they drop out of the flora in southern Michigan, Wisconsin, and Minnesota (Fowell 1965). The climate of zone B time pre- sumably approximated the modern climate some- where within the geographical zone where these species ranges now coincide. Surface samples that precisely match the fossil percentages of zone B have not yet been found, but much of this area has not been sampled thoroughly. The high ratio of pine to birch pollen in zone B is similar to sur- face samples from central Canada northeast of the Great Lakes; it is in the Great Lakes region that analogs to the vegetation might occur.
Zones C-1, C-2, and C-3, oak zones (7,900 years ago to present)
The pollen diagrams show the postglacial stra- tigraphy described by Deevey (1939) many years ago: zone C-1, oak and hemlock, zone C-2, oak and hickory, and zone C-3, oak and chestnut. Ad- ditional details can now be seen: ragweed pollen occurs in the lower portion of zone C-1, designated here C-la, while appreciable percentages of beech pollen characterize the upper portion (C-lb). In zone C-2 beech percentages (as well as hemlock) decline to a minimum, confirming the correlation of the beech minimum in Ohio with the hemlock minimum of zone C-2 in New England (Ogden 1966). In the upper portion of C-3 (C-3b) per- centages of pollen from ragweed, Runiex, and other weeds increase.
The deposition rate for total pollen was rela- tively stable during this long period, and conse- quently the trends in rates for individual types
are similar to the trends in percentages. Deposi- tion rates for tree pollen seem to reach a minimum in zone C-la, although the change is not large enough to be considered significant. At this time pollen from ragweed was deposited at increased rates. The maximum ragweed rate 8,000 years ago is approximately half as high as the modern rates, which record the response of this weedy species to forest clearance by European settlers. Further, the increased deposition of ragweed pol- len in C-la is a regional event: a similar maxi- mum (of percentage) occurs in zone C-1 in a pollen diagram from Ohio (Ogden 1966). I be- lieve that it indicates decreased density of forest, brought about by climatic changes associated with the expansion of prairie in the Great Lakes region 8,000 years ago (Cushing 1965). Wright (1968b), on the other hand, believes that the ragweed maxi- mumn in Northeastern profiles represents pollen blown from the expanded prairie in the Prairie Peninsula region of Illinois and Indiana. He points out that the warmest and driest part of postglacial time in the Northeast is generally con- sidered to have occurred later, between 5,000 and 2,000 years ago. If the ragweed pollen were wind- blown, I would expect a ragweed maximum in postglacial sediment everywhere in New England. But although Vermont is no farther from the Prairie Peninsula than Connecticut, there is no ragweed maximum at Brownington Pond. There is, to the contrary, an increase in oak pollen per- centages there at stratigraphically similar levels. In that region oak would increase in response to a drier climate (Davis 1965b). It is unfortunate that diagrams from Massachusetts (Davis 1958) are not detailed enough to show whether or not a ragweed maximum occurs in zone C-1.
An interesting feature in the Rogers Lake pol- len sequence is the late arrival of several tree spe- cies (Fig. 7A, 7B). Red maple and hemlock first appeared 9,000 years ago (Figs. 7A, 7B), while hickory pollen was absent until 5,000 years ago, when its deposition rate suddenly increased to high levels. Chestnut pollen increased in abun- dance 2,000 years ago. Its pollen also appears sporadically throughout the profile. Presumably these late times of arrival and sudden increases to high frequencies are due to delayed migration from glacial refuges. This possibility has recently been emphasized by Wright (1964, 196&8). The absence of pollen from these important tree species in older sediment makes comparison with modern pollen assemblages and vegetation difficult. Sur- face samples from regions with a similar, although cooler, climate than southern Connecticut, for
example central Massachusetts, contain about 20% pine pollen and 8% pollen from chestnut; none of
420 MARGARET B. DAVIS Ecology, Vol. 50, No. 3
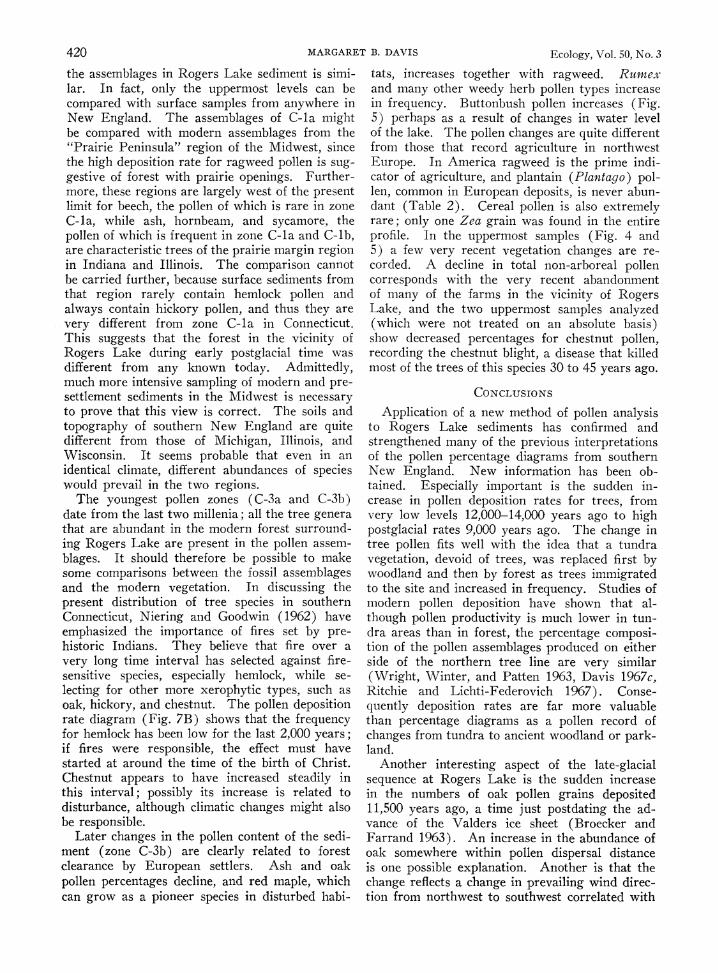
the assemblages in Rogers Lake sediment is simi- lar. In fact, only the uppermost levels can be compared with surface samples from anywhere in New England. The assemblages of C-la might be compared with modern assemblages from the "Prairie Peninsula" region of the Midwest, since the high deposition rate for ragweed pollen is sug- gestive of forest with prairie openings. Further- more, these regions are largely west of the present limit for beech, the pollen of which is rare in zone C-la, while ash, hornbeam, and sycamore, the pollen of which is frequent in zone C-la and C-lb, are characteristic trees of the prairie margin region in Indiana and Illinois. The comparison cannot be carried further, because surface sediments from that region rarely contain hemlock pollen and always contain hickory pollen, and thus they are very different from zone C-la in Connecticut. This suggests that the forest in the vicinity of Rogers Lake during early postglacial time was different from any known today. Admittedly, much more intensive sampling of modern and pre- settlement sediments in the Midwest is necessary to prove that this view is correct. The soils and topography of southern New England are quite different from those of Michigan, Illinois, and Wisconsin. It seems probable that even in an identical climate, different abundances of species would prevail in the two regions.
The youngest pollen zones (C-3a and C-3b) date from the last two millenia; all the tree genera that are abundant in the modern forest surround- ing Rogers Lake are present in the pollen assem- blages. It should therefore be possible to make some comparisons between the fossil assemblages and the modern vegetation. In discussing the present distribution of tree species in southern Connecticut, Niering and Goodwin (1962) have emphasized the importance of fires set by pre- historic Indians. They believe that fire over a very long time interval has selected against fire- sensitive species, especially hemlock, while se- lecting for other more xerophytic types, such as oak, hickory, and chestnut. The pollen deposition rate diagram (Fig. 7B) shows that the frequency for hemlock has been low for the last 2,000 years; if fires were responsible, the effect must have started at around the time of the birth of Christ. Chestnut appears to have increased steadily in this interval; possibly its increase is related to disturbance, although climatic changes might also be responsible.
Later changes in the pollen content of the sedi- ment (zone C-3b) are clearly related to forest clearance by European settlers. Ash and oak pollen percentages decline, and red maple, which can grow as a pioneer species in disturbed habi-
tats, increases together with ragweed. Rumex and many other weedy herb pollen types increase in frequency. Buttonbush pollen increases (Fig. 5) perhaps as a result of changes in water level of the lake. The pollen changes are quite different from those that record agriculture in northwest Europe. In America ragweed is the prime indi- cator of agriculture, and plantain (Plantago) pol- len, common in European deposits, is never abun- dant (Table 2). Cereal pollen is also extremely rare; only one Zea grain was found in the entire profile. In the uppermost samples (Fig. 4 and 5) a few very recent vegetation changes are re- corded. A decline in total non-arboreal pollen corresponds with the very recent abandonment of many of the farms in the vicinity of Rogers Lake, and the two uppermost samples analyzed (which were not treated on an absolute basis) show decreased percentages for chestnut pollen, recording the chestnut blight, a disease that killed most of the trees of this species 30 to 45 years ago.
CoNCLUSIONS
Application of a new method of pollen analysis to Rogers Lake sediments has confirmed and strengthened many of the previous interpretations of the pollen percentage diagrams from southern New England. New information has been ob- tained. Especially important is the sudden in- crease in pollen deposition rates for trees, from very low levels 12,000-14,000 years ago to high postglacial rates 9,000 years ago. The change in tree pollen fits well with the idea that a tundra vegetation, devoid of trees, was replaced first by woodland and then by forest as trees immigrated to the site and increased in frequency. Studies of modern pollen deposition have shown that al- though pollen productivity is much lower in tun- dra areas than in forest, the percentage composi- tion of the pollen assemblages produced on either side of the northern tree line are very similar (Wright, Winter, and Patten 1963, Davis 1967c, Ritchie and Lichti-Federovich 1967). Conse- quently deposition rates are far more valuable than percentage diagrams as a pollen record of changes from tundra to ancient woodland or park- land.
Another interesting aspect of the late-glacial sequence at Rogers Lake is the sudden increase in the numbers of oak pollen grains deposited 11,500 years ago, a time just postdating the ad- vance of the Valders ice sheet (Broecker and Farrand 1963). An increase in the abundance of oak somewhere within pollen dispersal distance is one possible explanation. Another is that the change reflects a change in prevailing wind direc- tion from northwest to southwest correlated with
Late Spring 1969 CLIMATIC RECORD AT ROGERS LAKE 421
the beginning of a time of very rapid glacial re- treat.
The deposition rates throw new light on the nature of the vegetation 8,500-9,500 years ago, during the "pine period," when the pollen influx from white pine (Pinus strobus) increased very rapidly, implying a marked population increase for the species, followed by an equally rapid de- cline only a thousand years later. Many other pollen types, including poplar, maple, oak, and hemlock, also increase steeply 9,500 years ago, a change that is largely masked in the percentage diagram. Pollen influx for boreal species de- creased, indicating that the change in the percent- age pollen diagrams is not merely caused by dilu- tion by increased pine pollen, but represents a real decline in numbers of boreal trees. The sub- sequent marked decline in deposition rate of pine pollen indicates a shift to almost purely deciduous forest. Perhaps the changes in species composi- tion of the plankton in Rogers Lake at this time (Deevey 1968) are an additional reflection of changes in regional climate.
One of the new features of the Rogers Lake sequence is a maximum for ragweed pollen in zone C-la, 7,000-8,000 years ago, a feature that has not been noticed in earlier analyses from the region, probably because emphasis was placed on tree pollen rather than upon herbs. Stratigraph- ically the ragweed maximum at Rogers Lake (Davis 1967b) is correlated with the Prairie Pe- riod of the Great Lakes region and reflects directly or indirectly vegetation changes associated with a xerothermic interval that occurred there between 5,000 and 8,000 years ago (Wright 1968b). The changes in pollen frequency that were originally thought to represent the zerothermic interval in southern New England (Deevey 1939) are in younger sediment, precisely dated now at 2,000- 4,500 years B.P. These changes seem most easily interpreted now as the reflection of successive im- migrations to Connecticut of first beech, then hickory, and then chestnut. Only during the last 2,000 years have the pollen assemblages in south- ern Connecticut been sufficiently similar to modern assemblages to permit comparison. This suggests that the forest communities there, as they are pres- ently recognized, may be of very recent origin.
ACKNOWLEDGMENTS
This paper is contribution 104 from the Great Lakes Research Division, University of Michigan. The work was initiated while the author was a research fellow at Yale University in 1960-61 and has been continued at the University of Michigan. Research support has been pro- vided by the National Science Foundation, research grants G-19335, to Yale University, G-17830, GB-2377, and GB- 5320 to the University of Michigan. I gratefully acknowl-
edge the encouragement and cooperation of Edward S. Deevey, Jr. I also extend special thanks to Minze Stuiver, who has dated the sediment core from Rogers Lake.
LITERATURE CITED
Aario, L. 1940. Waldgrenzen und subrezente Pollen- spektren in Petsamo Lappland. Ann. Acad. Sci. Fenn., Ser. A, 54(8): 1-120.
Argust, G. W., and M. B. Davis. 1962. Macrofossils from a late-glacial deposit at Cambridge, Massa- chusetts. Amer. Midland Natur. 67: 106-117.
Beetham, Nellie, and W. A. Niering. 1961. A pollen diagram from southeastern Connecticut. Amer. J. Sci. 259: 69-75.
Broecker, W. S., and W. R. Farrand. 1963. Radiocar- bon age of the Two Creeks forest bed. Geol. Soc. Amer. Bull. 74: 795-802.
Broecker, W. S., and Alan Walton. 1959. The geo- chemistry of C14 in fresh-water systems. Geochem. Cosmochim. Acta 16: 15-38.
Connecticut State Board of Fisheries and Game. 1959. A fisheries survey of the lakes and ponds of Con- necticut. Lake and Pond Surv. Unit Rep. 1. 395 p.
Cushing, E. J. 1965. Problems in the Quaternary phytogeography of the Great Lakes region, p. 403- 416. In H. E. Wright and D. G. Frey [ed.] The Quaternary of the United States. Princeton Univ. Press, Princeton, N. J. 922 p.
Damon, P. E., A. Long, and D. C. Greg. 1966. Fluctu- ation of atmospheric C14 during the last six mil- lennia. J. Geophys. Res. 71: 1055-1063.
Davis, M. B. 1958. Three pollen diagrams from cen- tral Massachusetts. Amer. J. Sci. 256: 540-570.
. 1960. A late-glacial pollen diagram from Taun- ton, Massachusetts. Bull. Torrey Bot. Club. 87: 258- 270.
. 1965a. A method for determination of absolute pollen frequency, p. 674-686. In B. Kummel and D. Raup [ed.] Handbook of paleontological techniques. W. H. Freeman, San Francisco, Calif. 852 p. --. 1965b. Phytogeography and palynology of north- eastern United States, p. 377-401. In H. E. Wright, Jr., and D. G. Frey [ed.] The Quaternary of the United States. Princeton Univ. Press, Princeton, N. J. 922 p.
. 1966. Determination of absolute pollen frequency. Ecology 47: 310-311. - . 1967a. Pollen deposition in lakes as measured in sediment traps. Geol. Soc. Amer. Bull. 849: 858.
. 1967b. Pollen accumulation rates at Rogers Lake, Connecticut, during late- and postglacial time. Rev. Palaeobot. 2: 219-230.
1967c. Late-glacial climate in northern United States: a comparison of New England and the Great Lakes region, p. 11-43. In E. J. Cushing and H. E. Wright, Jr. [ed.] Quaternary paleoecology. Yale Univ. Press, New Haven, Conn. 425 p.
. 1968. Pollen grains in lake sediments: rede- position caused by seasonal water circulation. Sci- ence 162: 796-799.
Davis, M. B., and E. S. Deevey, Jr. 1964. Pollen ac- cumulation rates: estimates from late-glacial sedi- ment of Rogers Lake. Science 145: 1293-1295.
Deevey, E. S., Jr. 1939. Studies on Connecticut lake sediments. I. A postglacial climatic chronology for southern New England. Amer. J. Sci. 237: 691-724.
. 1958. Radiocarbon-dated pollen sequences in eastern North America. Ver6ff. Geol. Inst. Riibel (Zurich) 34: 30-37.
422 K. J. McCREE AND R. S. LOOMIS Ecology, Vol. 50, No. 3
. 1964. Preliminary account of fossilization of zooplankton in Rogers Lake. Proc. Intern. Ass. Theor. Apple. Limnol. 15: 981-992.
. 1965. Sampling lake sediments by use of the Livingstone sampler, p. 521-529. In B. Kummel and D. Raup [ed.] Handbook of paleontological tech- niques. W. H. Freeman, San Francisco, Calif. 852 p.
. 1968. Cladoceran populations of Rogers Lake, Connecticut, during late- and postglacial time. 1st Inter. Conf. Paleolimnol. Proc. (1967), in press.
Deevey, E. S., Jr., M. S. Gross, G. E. Hutchinson, and H. L. Kraybill. 1954. The natural C14 contents of materials from hardwater lakes. Proc. Nat. Acad. Sci. 40: 285-288.
Faegri, K., and J. Iversen. 1964. Textbook of pollen analysis. 2nd ed. Munksgaard, Copenhagen. 237 p.
Fowell, H. A. 1965. Silvics of forest trees of the United States. U. S. Dep. Agr. Handbook 271. 762 p.
Leopold, E. B. 1956. Two late-glacial deposits in southern Connecticut. Proc. Nat. Acad. Sci. 42: 863- 867.
Leopold, E. B., and R. A. Scott. 1958. Pollen and spores and their use in geology. Smithson. Inst. Rep., 1957: 303-323.
McAndrews, J. H. 1966. Postglacial history of prairie, savanna, and forest in northwestern Minnesota. Mem. Torrey Bot. Club 22: 1-72.
Niering, W. A., and R. H. Goodwin. 1962. Ecological studies in the Connecticut Arboretum Natural Area. I. Introduction and a survey of vegetation types. Ecology 43: 41-54.
Ogden. J. G., III. 1959. A late-glaciai pollen sequence from Martha's Vineyard, Massachusetts. Amer. J. Sci. 257: 366-381.
. 1963. The Squibnocket cliff peat; radiocarbon dates and pollen stratigraphy. Amer. J. Sci. 261: 344-353.
. 1966. Forest history of Ohio. I. Radiocarbon dates and pollen stratigraphy of Silver Lake, Logan County, Ohio. Ohio J. Sci. 66: 387-400.
. 1967. Evidence for a sudden climatic change around 10,000 years ago, p. 117-127. Inl E. J. Cushing and H. E. Wright, Jr. [ed.] Quaternary paleoecology. Yale University Press, New Haven, Conn. 425 p.
von Post, L. 1967. Forest tree pollen in south Swedish peat bog deposits (transl.). Pollen et Spores 9: 375- 402.
Ritchie, J. C., and S. Lichti-Federovich. 1967. Pollen dispersal phenomena in arctic-subarctic Canada. Rev. Paleobot. Palynol. 3: 255-266.
Rowe, J. S. 1959. Forest regions of Canada. Can. Dep. Northern Affairs and Natur. Res., Forest. Branch, Bull. 123. 71 p.
Stuiver, Minze. 1967. Origin and extent of atmos- pheric C14 variations during the past 10,000 years, p. 27-40. In Radio-active dating and methods of low-level counting. Int. Atom. Energy Agency, Vienna.
Stuiver, Minze, E. S. Deevey, Jr., and Irving Rouse. 1963. Yale natural radiocarbon measurements II. Radiocarbon 4: 35-42.
Tsukada, M., and M. Stuiver. 1966. Man's influence on vegetation in Central Japan. Pollen et Spores 8: 309-313.
Ueno, Jitsuro. 1958. Some palynological observations of Pinaceae. J. Inst. Polytechnics, Osaka City Univ., Ser. D 9: 163-186.
Waddington, J. C. B. 1969. A stratigraphic record of the pollen influx to a lake in the Big Woods of Minnesota. Twelfth Conf. Great Lakes Res. Ab- stracts: 52-53.
Whitehead, D. R. 1964. Fossil pine pollen and full- glacial vegetation in southeastern North Carolina. Ecology 45: 767-777.
Wright, H. E., Jr. 1964. Aspects of the early post- glacial forest succession in the Great Lakes region. Ecology 45: 439-448.
. 1968a. History of the Prairie Peninsula, p. 78- 88. In R. E. Bergstrom [ed.] The Quaternary of Illinois. Univ. Illinois Coll. Agr. Spec. Publ. 14.
-. 1968b. The roles of pine and spruce in the forest history of Minnesota and adjacent areas. Ecology 49: 937-955.
Wright, H. E., Jr., T. C. Winter, and H. L. Patten. 1963. Two pollen diagrams from southeastern Min- nesota: problems in the regional late-glacial and post-glacial vegetational history. Geol. Soc. Amer. Bull. 74: 1371-1396.
PHOTOSYNTHESIS IN FLUCTUATING LIGHT'
K. J. MCCREE2 AND R. S. LOOMIS Agronomy Department, University of California, Davis, Calif.
(Accepted for publication February 3, 1969)
Abstract. Experiments were conducted to test the assumption, always made in models of the productivities of higher plant communities, that photosynthetic rates measured in steady light can be used to predict the rates in fluctuating light. The photosynthetic rates of whole cucumber plants (Cucumis sativus) were measured in light which alternated between high and low levels, at irradiances and frequencies comparable with the fluctuations found in nature (16-220 w/m2 of photosynthetically active radiation, 10-2-103 sec at each level). The mean photosynthetic rate in alternating light was always within a few percent of the mean of the two photosynthetic rates in steady light at the two irradiances which were alternated. In a practical test, daily totals of carbon dioxide assimilated in natural fluctuating light caused by clouds were within a few percent of those calculated from the irradiances and the steady-state
lSupported by a National Science Foundation grant (GB4192) to W. A. Williams and R. S. Loomis. 2 Onl leave from the Physics and Engineering Laboratory, Department of Scientific and Industrial Research,
Lower Hutt, New Zealand. Present address: Institute of Life Science, Texas A & M University, College Station, Texas 77843.