Embed Size (px)
Citation preview
Climbing-ripple successions in turbidite systems: depositionalenvironments, sedimentation rates and accumulation times
ZANE R. JOBE*,1, DONALD R. LOWE* and WILLIAM R. MORRIS�*Department of Geological and Environmental Sciences, Stanford University, 450 Serra Mall, Building320, Stanford, CA 94305, USA (E-mail: [email protected])�ConocoPhillips, Houston, TX 77079, USA
ABSTRACT
Climbing-ripple cross-lamination is most commonly deposited by turbidity
currents when suspended load fallout and bedload transport occur
contemporaneously. The angle of ripple climb reflects the ratio of suspended
load fallout and bedload sedimentation rates, allowing for the calculation of
the flow properties and durations of turbidity currents. Three areas exhibiting
thick (>50 m) sections of deep-water climbing-ripple cross-lamination
deposits are the focus of this study: (i) the Miocene upper Mount Messenger
Formation in the Taranaki Basin, New Zealand; (ii) the Permian Skoorsteenberg
Formation in the Tanqua depocentre of the Karoo Basin, South Africa; and (iii)
the lower Pleistocene Magnolia Field in the Titan Basin, Gulf of Mexico. Facies
distributions and local contextual information indicate that climbing-ripple
cross-lamination in each area was deposited in an ‘off-axis’ setting where flows
were expanding due to loss of confinement or a decrease in slope gradient. The
resultant reduction in flow thickness, Reynolds number, shear stress and
capacity promoted suspension fallout and thus climbing-ripple cross-
lamination formation. Climbing-ripple cross-lamination in the New Zealand
study area was deposited both outside of and within channels at an inferred
break in slope, where flows were decelerating and expanding. In the South
Africa study area, climbing-ripple cross-lamination was deposited due to a loss
of flow confinement. In the Magnolia study area, an abrupt decrease in gradient
near a basin sill caused flow deceleration and climbing-ripple cross-lamination
deposition in off-axis settings. Sedimentation rate and accumulation time were
calculated for 44 climbing-ripple cross-lamination sedimentation units from
the three areas using TDURE, a mathematical model developed by Baas et al.
(2000). For Tc divisions and Tbc beds averaging 26 cm and 37 cm thick,
respectively, average climbing-ripple cross-lamination and whole bed
sedimentation rates were 0Æ15 mm sec)1 and 0Æ26 mm sec)1 and average
accumulation times were 27 min and 35 min, respectively. In some instances,
distinct stratigraphic trends of sedimentation rate give insight into the evolution
of the depositional environment. Climbing-ripple cross-lamination in the three
study areas is developed in very fine-grained to fine-grained sand, suggesting a
grain size dependence on turbidite climbing-ripple cross-lamination formation.
Indeed, the calculated sedimentation rates correlate well with the rate of
sedimentation due to hindered settling of very fine-grained and fine-grained
sand–water suspensions at concentrations of up to 20% and 2Æ5%, respectively.
For coarser grains, hindered settling rates at all concentrations are much too high
to form climbing-ripple cross-lamination, resulting in the formation of massive/
structureless S3 or Ta divisions.
1Present address: Shell Projects and Technology, Houston, TX 77025, USA.
Sedimentology (2012) 59, 867–898 doi: 10.1111/j.1365-3091.2011.01283.x
� 2011 The Authors. Journal compilation � 2011 International Association of Sedimentologists 867
Keywords Climbing ripples, low-density turbidity current, non-uniformflow, off-axis depositional environment, sedimentation mechanics, sedimen-tation rate, suspended load fallout, turbidity current duration.
INTRODUCTION
Climbing-ripple (CR) bedforms and climbing-rip-ple cross-lamination (CRCL) were first recognizedand described by H. C. Sorby over 150 years ago(Sorby, 1852, 1859). As predicted by Sorby (1859),CRCL has proved to be a useful sedimentarystructure for calculating sediment accumulationrates (Bucher, 1919; Reineck, 1961; Jopling &Walker, 1968; Allen, 1970, 1971a,b) and identify-ing the environment and conditions of deposition(Walker, 1967; Mutti, 1977; Rubin & Hunter,1982). Climbing ripples are common in fine-grained turbidite systems (e.g. Kuenen, 1953,1967; Bouma, 1962; Walker, 1965; Walker, 1969;Mutti & Normark, 1987; Hodgson et al., 2006;Luthi et al., 2006), probably because non-uniformturbidity currents deposit sediment from suspen-sion concurrently while passing through theripple stability field (Allen & Leeder, 1980; Baas,2004; Sumner et al., 2008).
Despite all the research conducted on CRCL, nostudy has focused on determination of thespecific depositional settings of deep-water CRCLand on estimating flow properties of turbiditycurrents based on the physical characteristics ofCRCL deposits. This study focuses on three areaswhere CRCL is especially abundant and widelydistributed: (i) the Miocene upper Mount Mes-senger Formation in the Taranaki Basin, NewZealand; (ii) the Permian Skoorsteenberg Forma-tion in the Tanqua depocentre of the Karoo Basin,South Africa; and (iii) the lower PleistoceneMagnolia Field reservoir, Gulf of Mexico. Thisstudy explores the geometry and distribution ofCRCL in these areas, the environmental settingswithin which it formed, and the characteristics ofthe depositing flows.
CLIMBING RIPPLES
How and why current ripples climb
Current ripples are developed most commonlyin very fine to fine-grained sand (Stanley, 1974;Southard & Boguchwal, 1990; Allen, 1968) andrepresent bedload transport by a lower-flow-
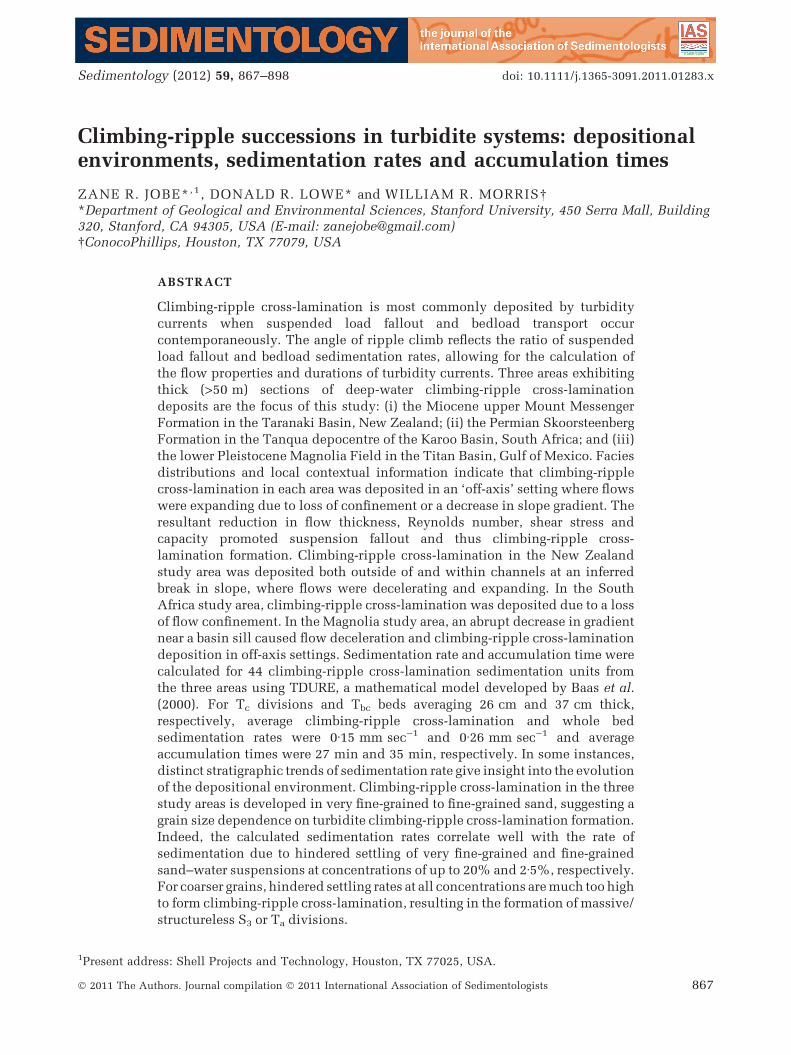
regime unidirectional current (Raudkivi,1963;Allen, 1968). Figure 1 shows the general mor-phology and terminology of current ripples.Boundary layer separation at the ripple crestand reattachment at the reattachment point(Fig. 1; Raudkivi, 1963) create a downstream-propagating asymmetrical bedform that has acharacteristic height H (5 to 30 mm) and wave-length k (10 to 30 cm; Leeder, 1999). The rippleindex, defined as k/H (Tanner, 1967), usuallyranges from 5 to 40 (Tanner, 1967; Leeder, 1999)and is somewhat dependent on plan view mor-phology (Allen, 1963).
Climbing ripples require not only bedloadtransport but also concurrent rapid suspendedload fallout rates (Sorby, 1859). When suspendedsediment falls rapidly onto a bed with activebedload transport within the ripple-stability field,erosion at the reattachment point may be reducedor suppressed completely, resulting in incom-plete removal of ripples as they migrate. Conse-quently, upstream ripples climb over the nextdownstream ripple (Fig. 2). The angle of climbreflects the interplay of suspended-load falloutrate and bedload transport rate according to:
tanf ¼ RH
2jbð1Þ
where f is the angle of climb, R is the suspended-load fallout rate, H is the observed ripple
Fig. 1. Ripple morphology and terminology (modifiedfrom Jopling & Walker, 1968; Allen, 1971a). Undernormal bedload transport conditions, the lee and stosssides of current ripples are depositional and erosional,respectively. Climbing occurs when suspension sedi-mentation reduces or suppresses reattachment pointerosivity.
868 Z. R. Jobe et al.
� 2011 The Authors. Journal compilation � 2011 International Association of Sedimentologists, Sedimentology, 59, 867–898
height and jb is the bedload transport rate (Allen,1970).
Areas of climbing-ripple cross-laminationformation
Climbing ripples require lower flow regime bed-load transport and high rates of suspended loadfallout. These conditions are most commonlyassociated with non-uniform flows, wheredecreasing turbulence intensity over relativelyshort distances results in an abrupt loss ofcapacity (Hiscott, 1994; Kneller, 1995) and, con-sequently, rapid suspended load fallout. Turbu-lence intensity can be measured by the flowReynolds number (Reynolds, 1883):
Re ¼ vqf L
lð2Þ
where v is velocity of the flow, qf is the fluiddensity, L is the flow depth and l is the fluidviscosity. Non-uniformity in turbidity currents isusually associated with a rapid decrease in v,
commonly caused by a break in slope, or areduction in L, commonly associated with a lossof confinement. Decreasing v and/or L acts tolower the Reynolds number, decreasing localturbulence intensity and increasing suspended-load fallout rate for flows transporting at capacity.Hence, in deep water settings, CRCL is mostcommonly developed: (i) on levees and alongchannel-margins (McKee, 1966; Mutti, 1977;Morris et al., 2000) where flow stripping (sensuPiper & Normark, 1983; Fildani et al., 2006) iscommon; (ii) at channel mouths (Mutti & Nor-mark, 1987; Wynn et al., 2002) and associatedlobe and splay settings (Walker, 1967), whereconfinement is lost; and (iii) in areas where slopegradient abruptly decreases (Bursik & Woods,2000; Maier et al., 2011), such as at the base ofslope (Mutti & Normark, 1987). Rapid gradientchanges are especially common in topographi-cally complex basin settings, including active-margin and salt-influenced basins (e.g. Pratheret al., 1998; Clark & Cartwright, 2009; Jobe et al.,2010; Maier et al., 2011). In addition, local topo-graphic complexity (e.g. Adeogba et al., 2005;Armitage et al., 2009) may drive flow non-unifor-mity and thus CRCL deposition.
Classification of climbing-ripplecross-lamination deposits
Plan-view morphology, cross-sectional geometryand the angle of climb are common metrics bywhich CR and CRCL are classified (e.g. Walker,1963; Jopling & Walker, 1968; Allen, 1973; Harmset al., 1975). With time, ripple plan-view mor-phology evolves from simple, straight-crestedforms to equilibrium linguoid forms (Baas, 1994,1999). The time required to reach equilibriumdepends on the shear stress (i.e. flow velocity),and equilibrium ripple forms are always linguoid(Baas, 1994, 1999). Thus, the plan-view ripplemorphology can be qualitatively related to flowconditions and durations.
Hunter (1977) divided climbing ripples intotwo categories based on their cross-sectionalgeometry and climb angle: subcritical and super-critical (Fig. 2; Hunter, 1977), terms not to beconfused with identical terms describing flowstage according to the Froude number. The crit-ical angle of climb is that in which: ‘‘the vector ofripple climb is parallel to the steepest part of theripple stoss slope’’ (Hunter, 1977). Consequently,subcritical CRCLs, also termed type A by Allen(1973), have low climb angles (ca 0 to 15�) andpartial stoss side erosion. Supercritical CRCLs,
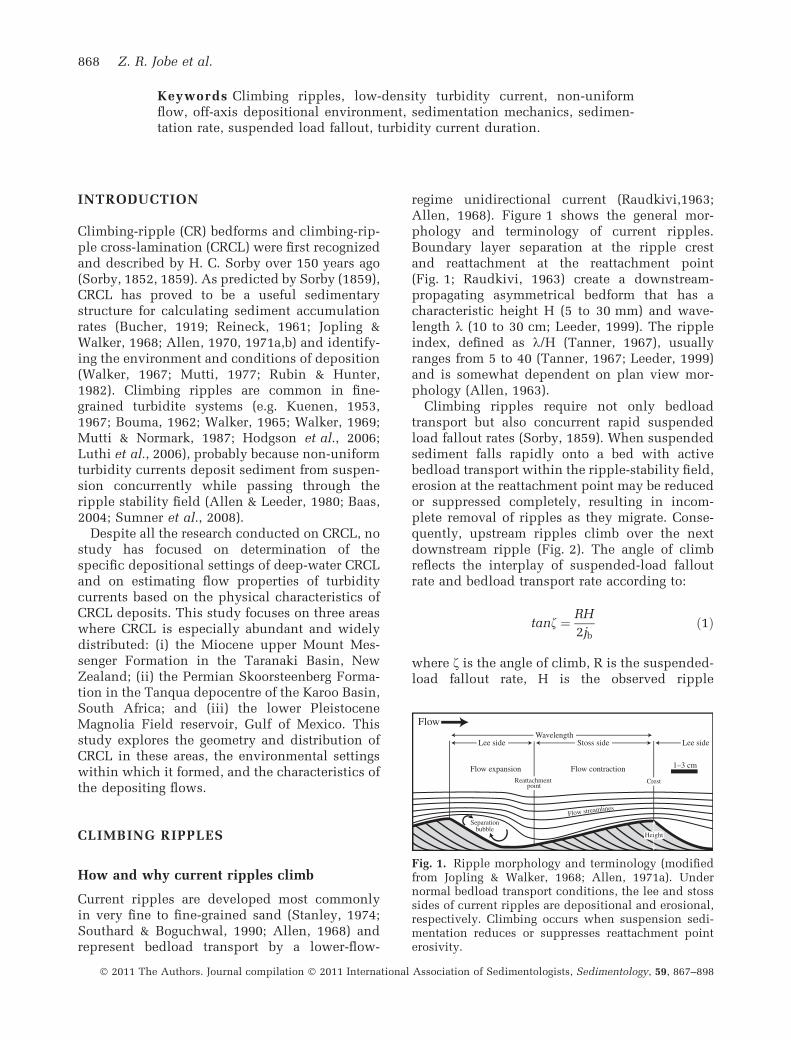
Fig. 2. Climbing-ripple cross-lamination (CRCL)nomenclature and classification. CRCL deposits can beclassified according to the critical angle of climb, wherestoss-side erosion occurs. CRCL with low climb anglesand stoss-side erosion are ‘subcritical’ while CRCL withhigher climb angles and stoss-side preservation are‘supercritical’. Sinusoidal, or wavy, lamination occursat very high climb angles and high suspension falloutrates and is essentially an aggrading bedform. Theincreasing angle of climb indicates an increasingrate of suspension sedimentation and/or decreasingrate of bedform migration. Figure modified fromHunter (1977); climb angle ranges and thicknesses areapproximate.
Climbing ripples deposited by turbidity currents 869
� 2011 The Authors. Journal compilation � 2011 International Association of Sedimentologists, Sedimentology, 59, 867–898
termed type B by Allen (1973), display high climbangles (ca 15 to 45�) and stoss side preservation(Fig. 2). Climbing-ripple cross-laminations thathave very steep angles of climb and more sym-metrical cross-sections are termed sinusoidallamination, or type S (Allen, 1973); these areessentially aggrading bedforms with climb anglesin excess of 45� (Fig. 2) that exhibit no significantdownstream ripple migration. Sinusoidal lamina-tion has been considered to indicate very highrates of suspension fallout in a waning current(Allen, 1963; Jopling & Walker, 1968; Hunter,1977). Subcritical CRCL, supercritical CRCL andsinusoidal lamination describe climb angle andthe resultant cross-sectional geometry, and canoccur for any ripple plan-view morphology.
GEOLOGICAL SETTING OF CLIMBING-RIPPLE CROSS-LAMINATION LOCALESIN THIS STUDY
The three locales (Fig. 3) that are the focus of thisstudy were chosen due to the striking CRCLsuccessions in each. These CRCL successions arethick, both in terms of the entire succession,generally >50 m, and the thickness of individualsedimentation units, commonly >1 m. Theselocales will be abbreviated as (Fig. 3): Mioceneupper Mount Messenger Formation, New Zealand(‘NZ’); Permian Skoorsteenberg Formation, Tan-qua depocentre, Karoo Basin, South Africa (‘ZA’);and Pleistocene Magnolia Field, deep-water Gulfof Mexico (‘MAG’).
Upper Mount Messenger Formation, TaranakiBasin, New Zealand (‘NZ’)
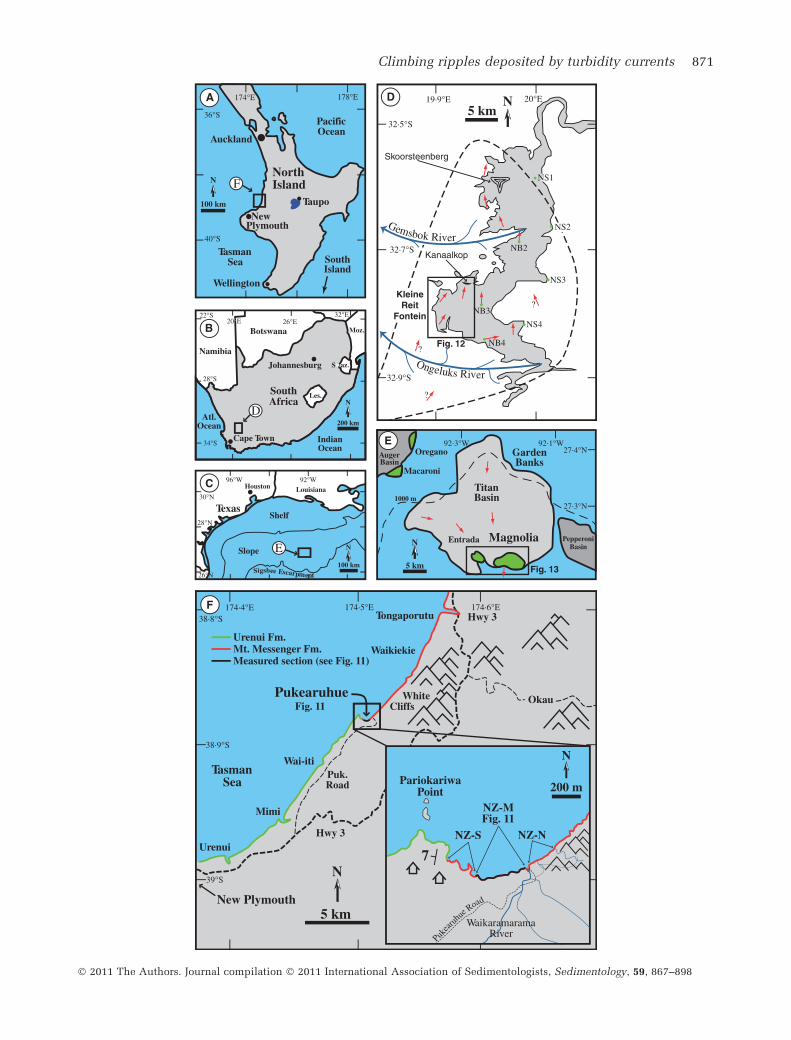
The Taranaki Basin exists mainly offshore of thewest coast of the North Island of New Zealand(Fig. 3A), but basin sediments crop out locally onbeach cliffs and are inferred to continue inland,
where outcrops are sparse due to extensivevegetation. The basin has a complex tectonichistory, with many episodes of extension andshortening related to subduction along the eastcoast of the North Island of New Zealand (King &Thrasher, 1992, 1996; King, 2000). During the lateMiocene, the Taranaki Basin was in a back-arcposition and subsiding, providing a deep-marineenvironment for the deposition of the MountMessenger Formation (Fig. 3F). Generally, thelocal source area was to the south, resulting innorth/north-westward sediment transport (Kinget al., 1993). Highly variable in terms of facies,the lower Mount Messenger includes thick-bed-ded sandy turbidites, mass transport deposits andburrowed silty turbidites (King et al., 1993, 1994;Browne et al., 2000). The upper Mount Messen-ger is a >100 m thick, very fine-grained sand-stone–mudstone succession that has intervals ofCRCL-rich deposits; it is well-exposed in coastalcliffs at Pukearuhue Beach (Fig. 3F, inset).Browne & Slatt (2002) interpreted this successionas a channel-levee complex on a base of slopeapron.
Skoorsteenberg Formation, Tanqua Karoo,South Africa (‘ZA’)
The Tanqua depocentre in the Western CapeProvince of South Africa (Fig. 3B) includes awell-studied Permian deep-water sedimentarysuccession developed in the Karoo retro-arc fore-land basin (Fildani et al., 2007). The UpperPermian Skoorsteenberg Formation consists ofsix discrete sandstone packages interpreted asstacked submarine fan systems separated bymudstone units (Wickens, 1994; Morris et al.,2000; Hodgson et al., 2006). ‘Fan 3’ (Fig. 3D), thebest exposed and most studied (e.g. Morris et al.,2000; Wickens & Bouma, 2000; Johnson et al.,2001a; van der Werff & Johnson, 2003; Hodgsonet al., 2006; Luthi et al., 2006; Prelat et al., 2009),
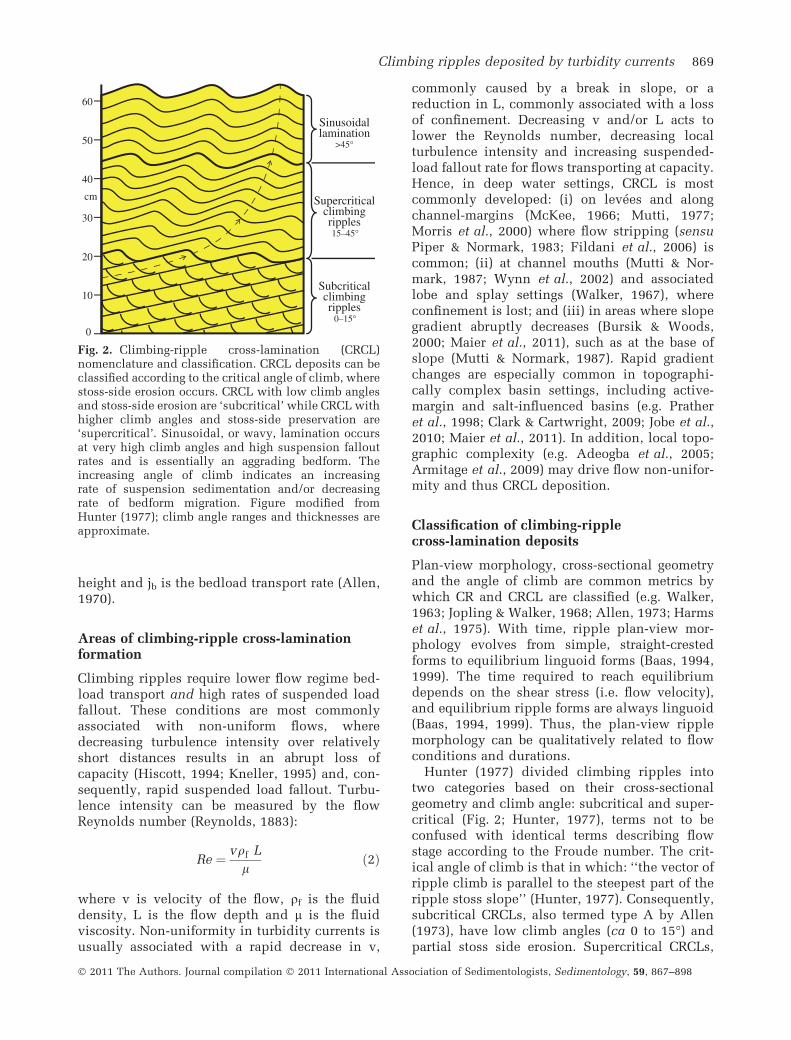
Fig. 3. Locations of the three study areas. A general location map of each is shown: New Zealand (‘NZ’) is shown in(A), South Africa (‘ZA’) in (B) and Magnolia (‘MAG’) in (C); boxes denote locations of more detailed figures. (D)Tanqua depocentre, Karoo Basin, South Africa – for location, see (B). Skoorsteenberg Formation outcrops are shownin grey. ‘Fan 3’ average palaeocurrents are shown with red arrows and the approximate boundary of the fan isindicated with a dashed line. The solid box shows the location of Fig. 12 and the Fan 3 climbing-ripple cross-lamination (CRCL) deposits at the Kleine Reit Fontein locale. Modified from Johnson et al. (2001a), Hodgson et al.(2006) and Prelat et al. (2009). (E) The Titan mini-basin in the Gulf of Mexico, showing the location of Magnolia field.The black box denotes the location of Fig. 13 and red arrows indicate generalized sediment dispersal patterns. Notethe location of Magnolia near the southern exit of the Titan Basin. (F) The Mount Messenger (red) and Urenui (green)formations outcrop along the Taranaki coast, North Island, New Zealand; gentle south-westerly dips revealstratigraphy younging to the south. The Upper Mount Messenger Formation at Pukearuhue Beach (inset) is theclimbing-ripple locale in this study. NZ-M is the measured section while NZ-N and NZ-S are the older and youngerCRCL sub-locales where individual bed measurements were made. See Fig. 11 for outcrop description.
870 Z. R. Jobe et al.
� 2011 The Authors. Journal compilation � 2011 International Association of Sedimentologists, Sedimentology, 59, 867–898
Climbing ripples deposited by turbidity currents 871
� 2011 The Authors. Journal compilation � 2011 International Association of Sedimentologists, Sedimentology, 59, 867–898
consists of very fine to fine-grained sandstonerepresenting both channel and lobe depositionalsettings (Morris et al., 2000). Climbing-ripplecross-lamination deposits occur in the non-channellized areas of Fan 3 (Morris et al., 2000),such as the Kleine Reit Fontein locale (Fig. 3D),
the focus of this study. Flows moving into thebasin from the west/south-west show an abruptdeflection to the north in eastern outcrops (Fig. 3D), interpreted to result from the presence of atectonically induced topographic buttress alongthe eastern margin of the basin (Hodgson et al.,2006; Luthi et al., 2006).
Magnolia Field, Gulf of Mexico (MAG)
The Magnolia Field, a producing oil and gas fieldoperated by ConocoPhillips, is located at thesouthern edge of the Titan mini-basin in the Gulfof Mexico (Fig. 3C and E) in 1433 m water depthand with reservoir depths of ca 3700 m belowmudline (Weissenburger & Borbas, 2004). Thesouthward filling of the basin (Fig. 3E) evolvedthrough ponded, transitional and bypass phases(sensu Prather et al., 1998; Weissenburger &Borbas, 2004). The main reservoir of lower Pleis-tocene age occupies the transitional phase ofbasin fill (Haddad et al., 2003). This reservoir hasbeen interpreted by Haddad et al. (2003) andMcGee et al. (2003) as an off-stacking, erosionallyconfined channel complex. Seismic and boreholedata indicate that the reservoir is heterogeneousand includes thick, blocky sandy turbidites, masstransport deposits and thinner bedded CRCL-richsuccessions. Furthermore, fluid pressure, phaseand compositional data indicate that the reservoiris highly segmented and compartmentalized(Weissenburger & Borbas, 2004; McCarthy et al.,2005, 2006) due to syn-depositional and post-depositional faulting due to allochthonous saltmovement. The only cored well in the field,located near the salt-cored sill of the mini-basin
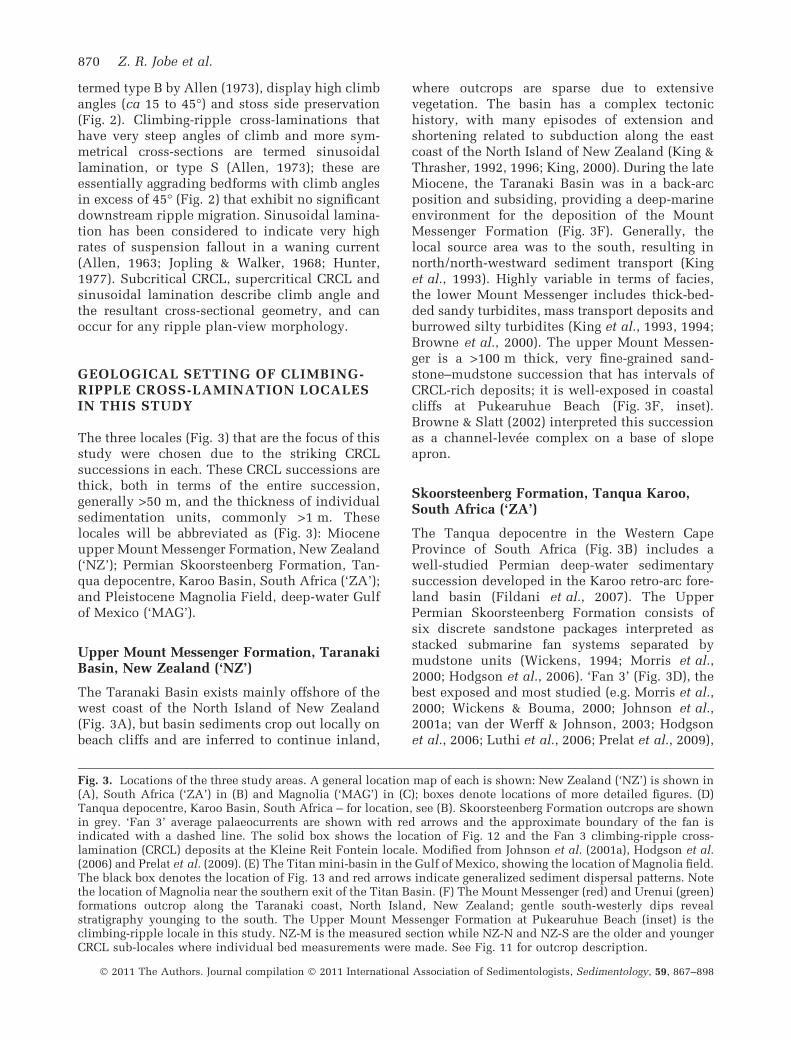
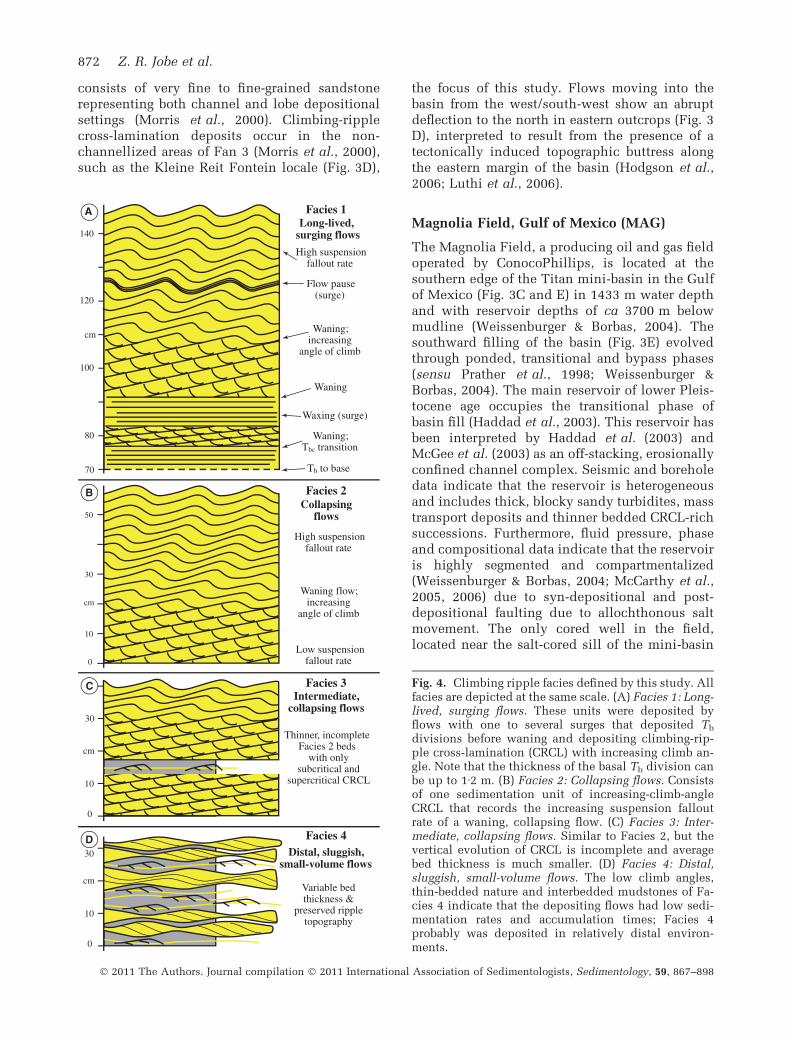
Fig. 4. Climbing ripple facies defined by this study. Allfacies are depicted at the same scale. (A) Facies 1: Long-lived, surging flows. These units were deposited byflows with one to several surges that deposited Tb
divisions before waning and depositing climbing-rip-ple cross-lamination (CRCL) with increasing climb an-gle. Note that the thickness of the basal Tb division canbe up to 1Æ2 m. (B) Facies 2: Collapsing flows. Consistsof one sedimentation unit of increasing-climb-angleCRCL that records the increasing suspension falloutrate of a waning, collapsing flow. (C) Facies 3: Inter-mediate, collapsing flows. Similar to Facies 2, but thevertical evolution of CRCL is incomplete and averagebed thickness is much smaller. (D) Facies 4: Distal,sluggish, small-volume flows. The low climb angles,thin-bedded nature and interbedded mudstones of Fa-cies 4 indicate that the depositing flows had low sedi-mentation rates and accumulation times; Facies 4probably was deposited in relatively distal environ-ments.
872 Z. R. Jobe et al.
� 2011 The Authors. Journal compilation � 2011 International Association of Sedimentologists, Sedimentology, 59, 867–898
(Fig. 3E), contains 61 m of thick and thin-bedded,very fine-grained sand and silty deposits rich inCRCL.
CLIMBING-RIPPLE CROSS-LAMINATIONFACIES
Classifying CRCL deposits using their physicalgeometries/morphologies and stacking patterns(i.e. facies) is useful for qualitative analysis offlow conditions at, as well as boundary condi-tions of, the site of deposition. Using the mor-phology and stacking patterns of the CRCLdeposits from NZ, ZA, and MAG, four facies aretermed Facies 1, 2, 3 and 4 (Fig. 4A to D andFigs 5 to 8, respectively). These facies do notrepresent different flow types, but rather a mod-ified Bouma sequence that reflects the downslopeevolution of flow properties due to changes inboundary conditions (Fig. 9) or the relative mag-nitude of the flow. All sand-bed grain sizes arevery fine to fine-grained sand (Table 1).
Facies 1: Long-lived and/or rapidly depositing,surging flows
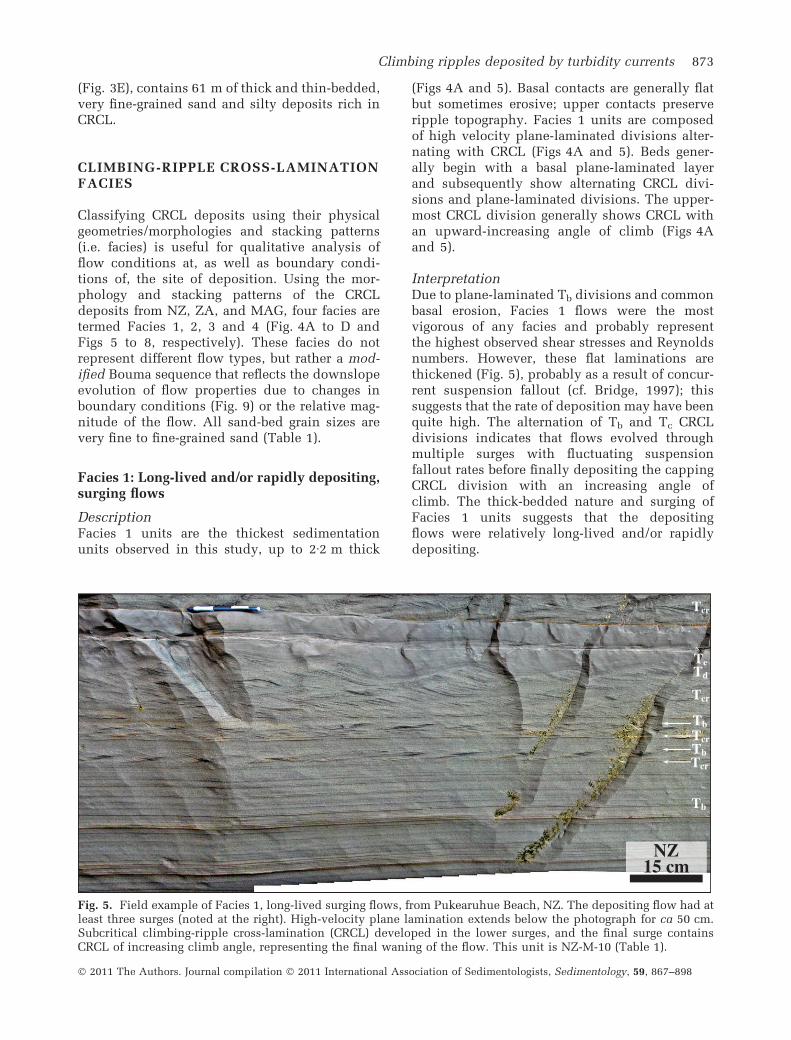
DescriptionFacies 1 units are the thickest sedimentationunits observed in this study, up to 2Æ2 m thick
(Figs 4A and 5). Basal contacts are generally flatbut sometimes erosive; upper contacts preserveripple topography. Facies 1 units are composedof high velocity plane-laminated divisions alter-nating with CRCL (Figs 4A and 5). Beds gener-ally begin with a basal plane-laminated layerand subsequently show alternating CRCL divi-sions and plane-laminated divisions. The upper-most CRCL division generally shows CRCL withan upward-increasing angle of climb (Figs 4Aand 5).
InterpretationDue to plane-laminated Tb divisions and commonbasal erosion, Facies 1 flows were the mostvigorous of any facies and probably representthe highest observed shear stresses and Reynoldsnumbers. However, these flat laminations arethickened (Fig. 5), probably as a result of concur-rent suspension fallout (cf. Bridge, 1997); thissuggests that the rate of deposition may have beenquite high. The alternation of Tb and Tc CRCLdivisions indicates that flows evolved throughmultiple surges with fluctuating suspensionfallout rates before finally depositing the cappingCRCL division with an increasing angle ofclimb. The thick-bedded nature and surging ofFacies 1 units suggests that the depositingflows were relatively long-lived and/or rapidlydepositing.
Fig. 5. Field example of Facies 1, long-lived surging flows, from Pukearuhue Beach, NZ. The depositing flow had atleast three surges (noted at the right). High-velocity plane lamination extends below the photograph for ca 50 cm.Subcritical climbing-ripple cross-lamination (CRCL) developed in the lower surges, and the final surge containsCRCL of increasing climb angle, representing the final waning of the flow. This unit is NZ-M-10 (Table 1).
Climbing ripples deposited by turbidity currents 873
� 2011 The Authors. Journal compilation � 2011 International Association of Sedimentologists, Sedimentology, 59, 867–898
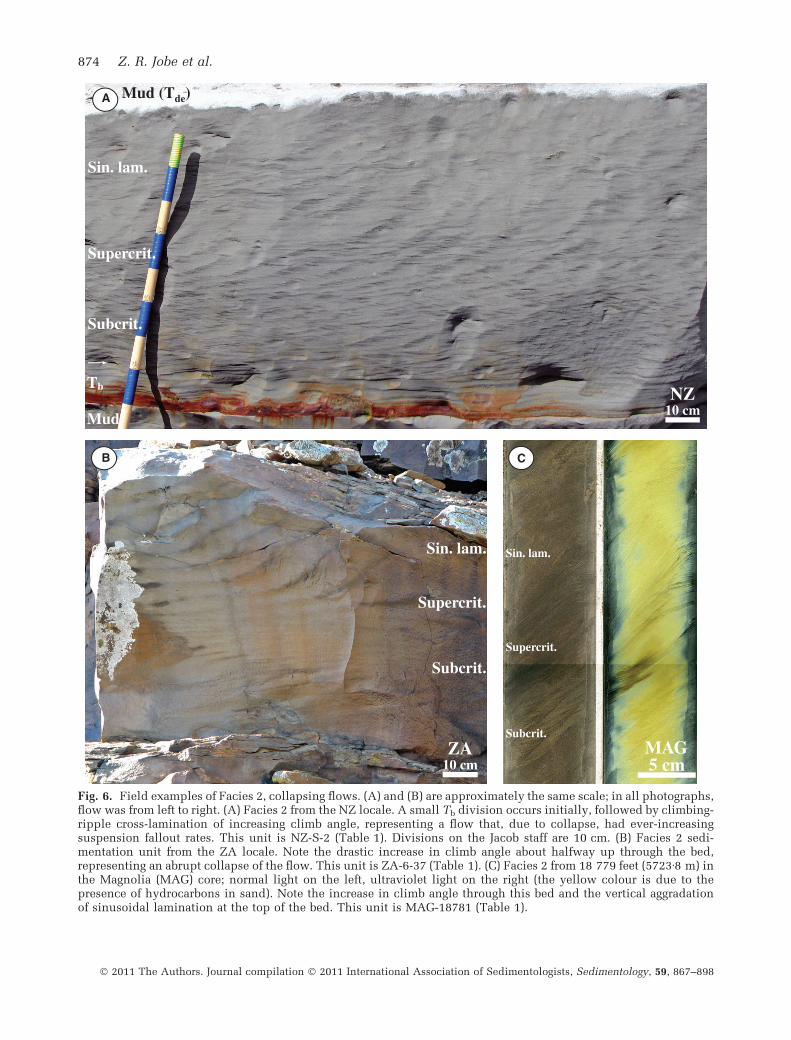
Fig. 6. Field examples of Facies 2, collapsing flows. (A) and (B) are approximately the same scale; in all photographs,flow was from left to right. (A) Facies 2 from the NZ locale. A small Tb division occurs initially, followed by climbing-ripple cross-lamination of increasing climb angle, representing a flow that, due to collapse, had ever-increasingsuspension fallout rates. This unit is NZ-S-2 (Table 1). Divisions on the Jacob staff are 10 cm. (B) Facies 2 sedi-mentation unit from the ZA locale. Note the drastic increase in climb angle about halfway up through the bed,representing an abrupt collapse of the flow. This unit is ZA-6-37 (Table 1). (C) Facies 2 from 18 779 feet (5723Æ8 m) inthe Magnolia (MAG) core; normal light on the left, ultraviolet light on the right (the yellow colour is due to thepresence of hydrocarbons in sand). Note the increase in climb angle through this bed and the vertical aggradationof sinusoidal lamination at the top of the bed. This unit is MAG-18781 (Table 1).
874 Z. R. Jobe et al.
� 2011 The Authors. Journal compilation � 2011 International Association of Sedimentologists, Sedimentology, 59, 867–898
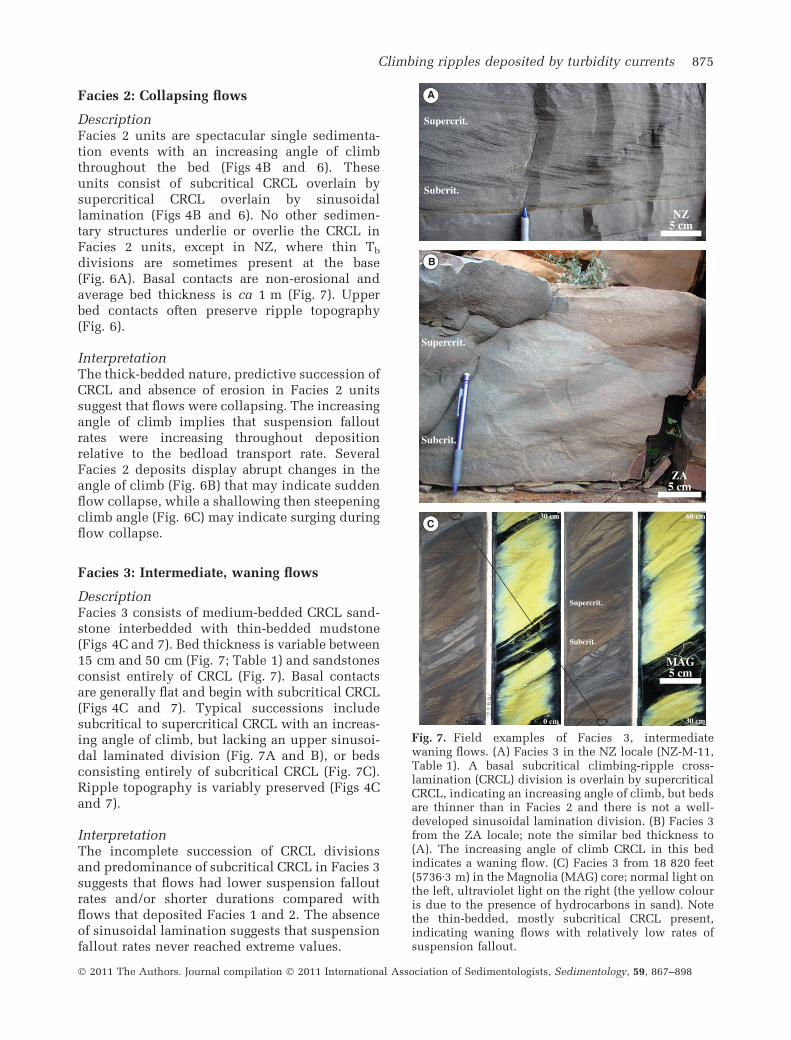
Facies 2: Collapsing flows
DescriptionFacies 2 units are spectacular single sedimenta-tion events with an increasing angle of climbthroughout the bed (Figs 4B and 6). Theseunits consist of subcritical CRCL overlain bysupercritical CRCL overlain by sinusoidallamination (Figs 4B and 6). No other sedimen-tary structures underlie or overlie the CRCL inFacies 2 units, except in NZ, where thin Tb
divisions are sometimes present at the base(Fig. 6A). Basal contacts are non-erosional andaverage bed thickness is ca 1 m (Fig. 7). Upperbed contacts often preserve ripple topography(Fig. 6).
InterpretationThe thick-bedded nature, predictive succession ofCRCL and absence of erosion in Facies 2 unitssuggest that flows were collapsing. The increasingangle of climb implies that suspension falloutrates were increasing throughout depositionrelative to the bedload transport rate. SeveralFacies 2 deposits display abrupt changes in theangle of climb (Fig. 6B) that may indicate suddenflow collapse, while a shallowing then steepeningclimb angle (Fig. 6C) may indicate surging duringflow collapse.
Facies 3: Intermediate, waning flows
DescriptionFacies 3 consists of medium-bedded CRCL sand-stone interbedded with thin-bedded mudstone(Figs 4C and 7). Bed thickness is variable between15 cm and 50 cm (Fig. 7; Table 1) and sandstonesconsist entirely of CRCL (Fig. 7). Basal contactsare generally flat and begin with subcritical CRCL(Figs 4C and 7). Typical successions includesubcritical to supercritical CRCL with an increas-ing angle of climb, but lacking an upper sinusoi-dal laminated division (Fig. 7A and B), or bedsconsisting entirely of subcritical CRCL (Fig. 7C).Ripple topography is variably preserved (Figs 4Cand 7).
InterpretationThe incomplete succession of CRCL divisionsand predominance of subcritical CRCL in Facies 3suggests that flows had lower suspension falloutrates and/or shorter durations compared withflows that deposited Facies 1 and 2. The absenceof sinusoidal lamination suggests that suspensionfallout rates never reached extreme values.
Fig. 7. Field examples of Facies 3, intermediatewaning flows. (A) Facies 3 in the NZ locale (NZ-M-11,Table 1). A basal subcritical climbing-ripple cross-lamination (CRCL) division is overlain by supercriticalCRCL, indicating an increasing angle of climb, but bedsare thinner than in Facies 2 and there is not a well-developed sinusoidal lamination division. (B) Facies 3from the ZA locale; note the similar bed thickness to(A). The increasing angle of climb CRCL in this bedindicates a waning flow. (C) Facies 3 from 18 820 feet(5736Æ3 m) in the Magnolia (MAG) core; normal light onthe left, ultraviolet light on the right (the yellow colouris due to the presence of hydrocarbons in sand). Notethe thin-bedded, mostly subcritical CRCL present,indicating waning flows with relatively low rates ofsuspension fallout.
Climbing ripples deposited by turbidity currents 875
� 2011 The Authors. Journal compilation � 2011 International Association of Sedimentologists, Sedimentology, 59, 867–898
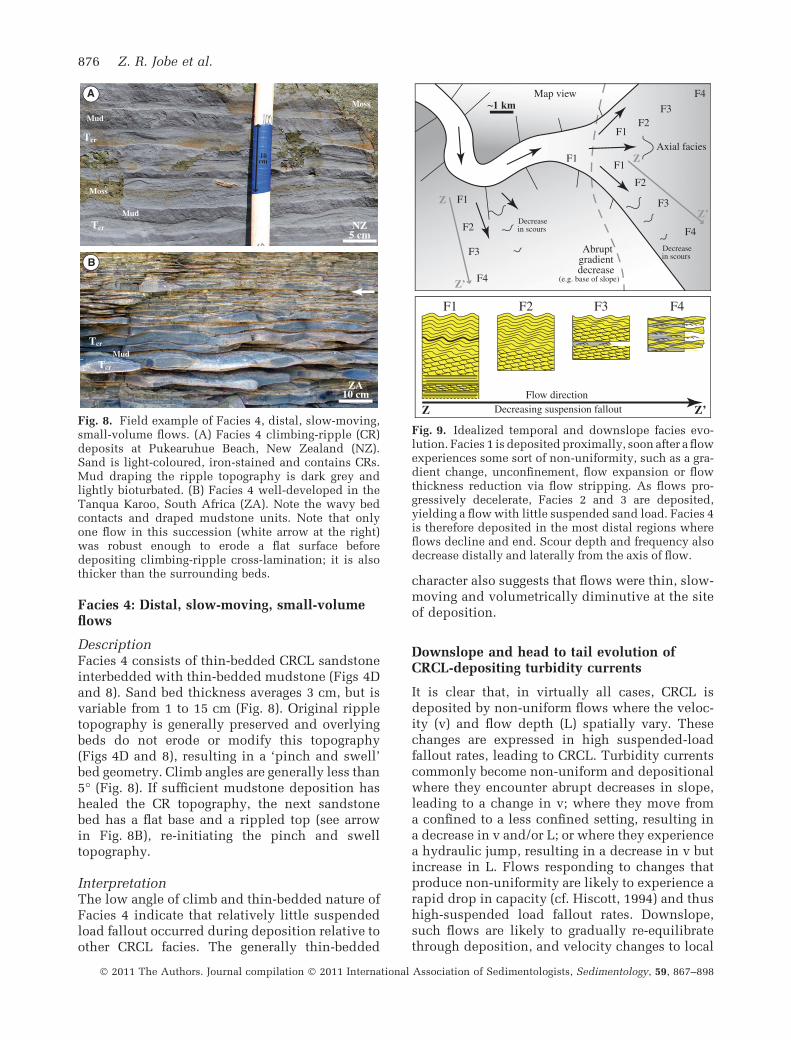
Facies 4: Distal, slow-moving, small-volumeflows
DescriptionFacies 4 consists of thin-bedded CRCL sandstoneinterbedded with thin-bedded mudstone (Figs 4Dand 8). Sand bed thickness averages 3 cm, but isvariable from 1 to 15 cm (Fig. 8). Original rippletopography is generally preserved and overlyingbeds do not erode or modify this topography(Figs 4D and 8), resulting in a ‘pinch and swell’bed geometry. Climb angles are generally less than5� (Fig. 8). If sufficient mudstone deposition hashealed the CR topography, the next sandstonebed has a flat base and a rippled top (see arrowin Fig. 8B), re-initiating the pinch and swelltopography.
InterpretationThe low angle of climb and thin-bedded nature ofFacies 4 indicate that relatively little suspendedload fallout occurred during deposition relative toother CRCL facies. The generally thin-bedded
character also suggests that flows were thin, slow-moving and volumetrically diminutive at the siteof deposition.
Downslope and head to tail evolution ofCRCL-depositing turbidity currents
It is clear that, in virtually all cases, CRCL isdeposited by non-uniform flows where the veloc-ity (v) and flow depth (L) spatially vary. Thesechanges are expressed in high suspended-loadfallout rates, leading to CRCL. Turbidity currentscommonly become non-uniform and depositionalwhere they encounter abrupt decreases in slope,leading to a change in v; where they move froma confined to a less confined setting, resulting ina decrease in v and/or L; or where they experiencea hydraulic jump, resulting in a decrease in v butincrease in L. Flows responding to changes thatproduce non-uniformity are likely to experience arapid drop in capacity (cf. Hiscott, 1994) and thushigh-suspended load fallout rates. Downslope,such flows are likely to gradually re-equilibratethrough deposition, and velocity changes to local
Fig. 8. Field example of Facies 4, distal, slow-moving,small-volume flows. (A) Facies 4 climbing-ripple (CR)deposits at Pukearuhue Beach, New Zealand (NZ).Sand is light-coloured, iron-stained and contains CRs.Mud draping the ripple topography is dark grey andlightly bioturbated. (B) Facies 4 well-developed in theTanqua Karoo, South Africa (ZA). Note the wavy bedcontacts and draped mudstone units. Note that onlyone flow in this succession (white arrow at the right)was robust enough to erode a flat surface beforedepositing climbing-ripple cross-lamination; it is alsothicker than the surrounding beds.
Fig. 9. Idealized temporal and downslope facies evo-lution. Facies 1 is deposited proximally, soon after a flowexperiences some sort of non-uniformity, such as a gra-dient change, unconfinement, flow expansion or flowthickness reduction via flow stripping. As flows pro-gressively decelerate, Facies 2 and 3 are deposited,yielding a flow with little suspended sand load. Facies 4is therefore deposited in the most distal regions whereflows decline and end. Scour depth and frequency alsodecrease distally and laterally from the axis of flow.
876 Z. R. Jobe et al.
� 2011 The Authors. Journal compilation � 2011 International Association of Sedimentologists, Sedimentology, 59, 867–898
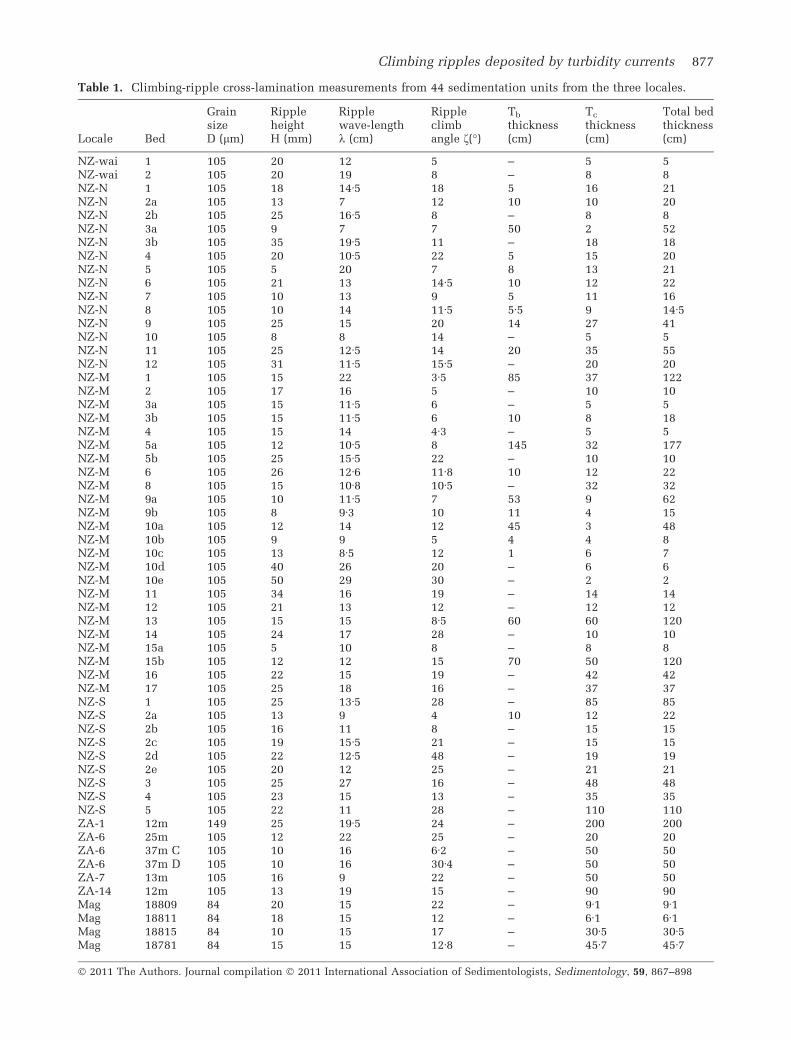
Table 1. Climbing-ripple cross-lamination measurements from 44 sedimentation units from the three locales.
Locale Bed
GrainsizeD (lm)
RippleheightH (mm)
Ripplewave-lengthk (cm)
Rippleclimbangle f(�)
Tb
thickness(cm)
Tc
thickness(cm)
Total bedthickness(cm)
NZ-wai 1 105 20 12 5 – 5 5NZ-wai 2 105 20 19 8 – 8 8NZ-N 1 105 18 14Æ5 18 5 16 21NZ-N 2a 105 13 7 12 10 10 20NZ-N 2b 105 25 16Æ5 8 – 8 8NZ-N 3a 105 9 7 7 50 2 52NZ-N 3b 105 35 19Æ5 11 – 18 18NZ-N 4 105 20 10Æ5 22 5 15 20NZ-N 5 105 5 20 7 8 13 21NZ-N 6 105 21 13 14Æ5 10 12 22NZ-N 7 105 10 13 9 5 11 16NZ-N 8 105 10 14 11Æ5 5Æ5 9 14Æ5NZ-N 9 105 25 15 20 14 27 41NZ-N 10 105 8 8 14 – 5 5NZ-N 11 105 25 12Æ5 14 20 35 55NZ-N 12 105 31 11Æ5 15Æ5 – 20 20NZ-M 1 105 15 22 3Æ5 85 37 122NZ-M 2 105 17 16 5 – 10 10NZ-M 3a 105 15 11Æ5 6 – 5 5NZ-M 3b 105 15 11Æ5 6 10 8 18NZ-M 4 105 15 14 4Æ3 – 5 5NZ-M 5a 105 12 10Æ5 8 145 32 177NZ-M 5b 105 25 15Æ5 22 – 10 10NZ-M 6 105 26 12Æ6 11Æ8 10 12 22NZ-M 8 105 15 10Æ8 10Æ5 – 32 32NZ-M 9a 105 10 11Æ5 7 53 9 62NZ-M 9b 105 8 9Æ3 10 11 4 15NZ-M 10a 105 12 14 12 45 3 48NZ-M 10b 105 9 9 5 4 4 8NZ-M 10c 105 13 8Æ5 12 1 6 7NZ-M 10d 105 40 26 20 – 6 6NZ-M 10e 105 50 29 30 – 2 2NZ-M 11 105 34 16 19 – 14 14NZ-M 12 105 21 13 12 – 12 12NZ-M 13 105 15 15 8Æ5 60 60 120NZ-M 14 105 24 17 28 – 10 10NZ-M 15a 105 5 10 8 – 8 8NZ-M 15b 105 12 12 15 70 50 120NZ-M 16 105 22 15 19 – 42 42NZ-M 17 105 25 18 16 – 37 37NZ-S 1 105 25 13Æ5 28 – 85 85NZ-S 2a 105 13 9 4 10 12 22NZ-S 2b 105 16 11 8 – 15 15NZ-S 2c 105 19 15Æ5 21 – 15 15NZ-S 2d 105 22 12Æ5 48 – 19 19NZ-S 2e 105 20 12 25 – 21 21NZ-S 3 105 25 27 16 – 48 48NZ-S 4 105 23 15 13 – 35 35NZ-S 5 105 22 11 28 – 110 110ZA-1 12m 149 25 19Æ5 24 – 200 200ZA-6 25m 105 12 22 25 – 20 20ZA-6 37m C 105 10 16 6Æ2 – 50 50ZA-6 37m D 105 10 16 30Æ4 – 50 50ZA-7 13m 105 16 9 22 – 50 50ZA-14 12m 105 13 19 15 – 90 90Mag 18809 84 20 15 22 – 9Æ1 9Æ1Mag 18811 84 18 15 12 – 6Æ1 6Æ1Mag 18815 84 10 15 17 – 30Æ5 30Æ5Mag 18781 84 15 15 12Æ8 – 45Æ7 45Æ7
Climbing ripples deposited by turbidity currents 877
� 2011 The Authors. Journal compilation � 2011 International Association of Sedimentologists, Sedimentology, 59, 867–898
conditions and the suspended load fallout ratewill decline. As a result, the deposits are likely todisplay a regular downslope series of structures(Fig. 9), initially reflecting the abrupt onset of non-uniformity and, subsequently, their gradual down-slope re-equilibration. Immediately downflowfrom the initiation of non-uniform conditions,the initially high flow velocities and initially highsuspended-load fallout rates should result indeposition of Facies 1 (Fig. 9). Further downslope,a transition to Facies 2 is expected (Fig. 9) assuspended-load fallout rates reach maximum val-ues and flow velocities rapidly decline. Sus-pended load fallout rates will be high comparedwith bedload transport rates because the flows losecapacity. Facies 3 is expected further downslope(Fig. 9) as the flows begin to re-equilibrate, sus-pended load fallout rates decline and suspended-load transport approaches capacity. Facies 4 isexpected in the most distal environments (Fig. 9)and probably records the full re-equilibration ofthe currents and slow deposition related to grad-ually changing conditions of slope and flowthickness out into the basin.
Indeed this facies progression is seen in the ZAlocale, where Facies 4 is much more common indistal areas (Hodgson et al., 2006; Jobe et al.,2008; see also ZA (South Africa) locale sectionbelow). In areas where turbidity currents arerobust, such as a channel mouth, CRCL may bedeveloped only in lateral and/or off-axis settings(Fig. 9) where flow is weak, allowing for bedformdevelopment (cf. Wynn et al., 2002). The abovediscussion assumes that flows begin with con-stant volume. However, in an environment with adistribution of flow volumes, the presence ofFacies 1 to 4 may also indicate relative flowmagnitude and suspended sediment concentra-tion. While large-volume flows may deposit allfour facies during downslope evolution, small-volume flows may only be able to deposit lowerenergy facies.
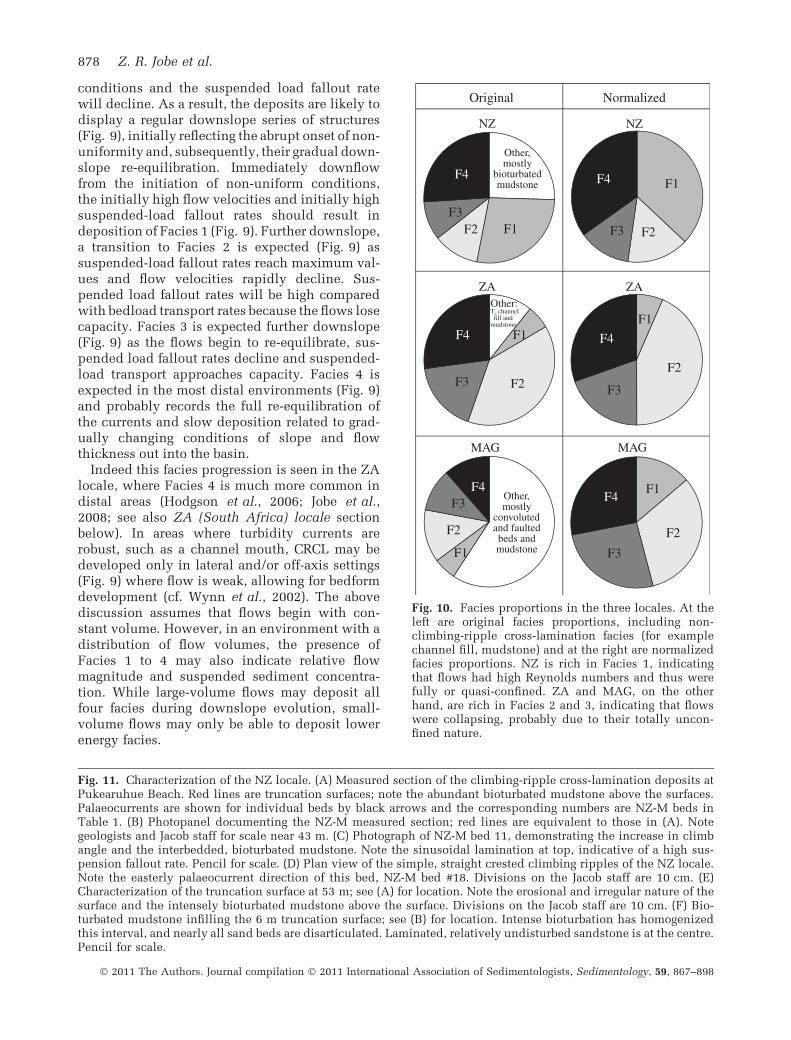
Fig. 10. Facies proportions in the three locales. At theleft are original facies proportions, including non-climbing-ripple cross-lamination facies (for examplechannel fill, mudstone) and at the right are normalizedfacies proportions. NZ is rich in Facies 1, indicatingthat flows had high Reynolds numbers and thus werefully or quasi-confined. ZA and MAG, on the otherhand, are rich in Facies 2 and 3, indicating that flowswere collapsing, probably due to their totally uncon-fined nature.
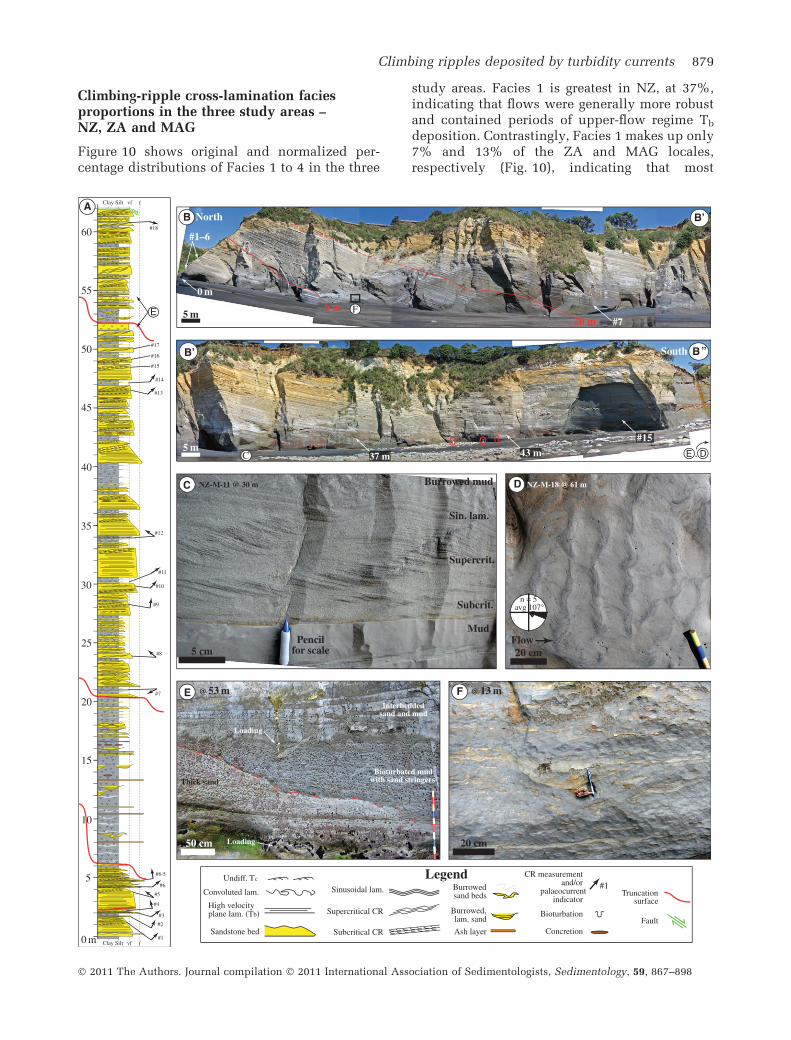
Fig. 11. Characterization of the NZ locale. (A) Measured section of the climbing-ripple cross-lamination deposits atPukearuhue Beach. Red lines are truncation surfaces; note the abundant bioturbated mudstone above the surfaces.Palaeocurrents are shown for individual beds by black arrows and the corresponding numbers are NZ-M beds inTable 1. (B) Photopanel documenting the NZ-M measured section; red lines are equivalent to those in (A). Notegeologists and Jacob staff for scale near 43 m. (C) Photograph of NZ-M bed 11, demonstrating the increase in climbangle and the interbedded, bioturbated mudstone. Note the sinusoidal lamination at top, indicative of a high sus-pension fallout rate. Pencil for scale. (D) Plan view of the simple, straight crested climbing ripples of the NZ locale.Note the easterly palaeocurrent direction of this bed, NZ-M bed #18. Divisions on the Jacob staff are 10 cm. (E)Characterization of the truncation surface at 53 m; see (A) for location. Note the erosional and irregular nature of thesurface and the intensely bioturbated mudstone above the surface. Divisions on the Jacob staff are 10 cm. (F) Bio-turbated mudstone infilling the 6 m truncation surface; see (B) for location. Intense bioturbation has homogenizedthis interval, and nearly all sand beds are disarticulated. Laminated, relatively undisturbed sandstone is at the centre.Pencil for scale.
878 Z. R. Jobe et al.
� 2011 The Authors. Journal compilation � 2011 International Association of Sedimentologists, Sedimentology, 59, 867–898
Climbing-ripple cross-lamination faciesproportions in the three study areas –NZ, ZA and MAG
Figure 10 shows original and normalized per-centage distributions of Facies 1 to 4 in the three
study areas. Facies 1 is greatest in NZ, at 37%,indicating that flows were generally more robustand contained periods of upper-flow regime Tb
deposition. Contrastingly, Facies 1 makes up only7% and 13% of the ZA and MAG locales,respectively (Fig. 10), indicating that most
Climbing ripples deposited by turbidity currents 879
� 2011 The Authors. Journal compilation � 2011 International Association of Sedimentologists, Sedimentology, 59, 867–898
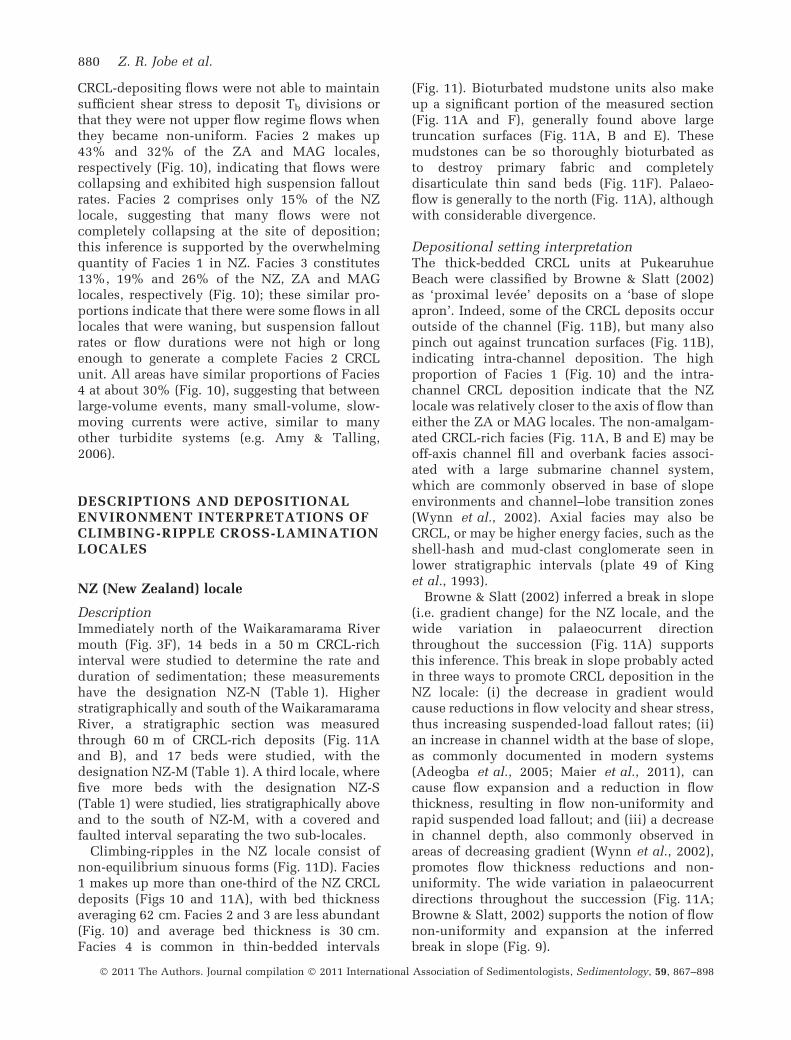
CRCL-depositing flows were not able to maintainsufficient shear stress to deposit Tb divisions orthat they were not upper flow regime flows whenthey became non-uniform. Facies 2 makes up43% and 32% of the ZA and MAG locales,respectively (Fig. 10), indicating that flows werecollapsing and exhibited high suspension falloutrates. Facies 2 comprises only 15% of the NZlocale, suggesting that many flows were notcompletely collapsing at the site of deposition;this inference is supported by the overwhelmingquantity of Facies 1 in NZ. Facies 3 constitutes13%, 19% and 26% of the NZ, ZA and MAGlocales, respectively (Fig. 10); these similar pro-portions indicate that there were some flows in alllocales that were waning, but suspension falloutrates or flow durations were not high or longenough to generate a complete Facies 2 CRCLunit. All areas have similar proportions of Facies4 at about 30% (Fig. 10), suggesting that betweenlarge-volume events, many small-volume, slow-moving currents were active, similar to manyother turbidite systems (e.g. Amy & Talling,2006).
DESCRIPTIONS AND DEPOSITIONALENVIRONMENT INTERPRETATIONS OFCLIMBING-RIPPLE CROSS-LAMINATIONLOCALES
NZ (New Zealand) locale
DescriptionImmediately north of the Waikaramarama Rivermouth (Fig. 3F), 14 beds in a 50 m CRCL-richinterval were studied to determine the rate andduration of sedimentation; these measurementshave the designation NZ-N (Table 1). Higherstratigraphically and south of the WaikaramaramaRiver, a stratigraphic section was measuredthrough 60 m of CRCL-rich deposits (Fig. 11Aand B), and 17 beds were studied, with thedesignation NZ-M (Table 1). A third locale, wherefive more beds with the designation NZ-S(Table 1) were studied, lies stratigraphically aboveand to the south of NZ-M, with a covered andfaulted interval separating the two sub-locales.
Climbing-ripples in the NZ locale consist ofnon-equilibrium sinuous forms (Fig. 11D). Facies1 makes up more than one-third of the NZ CRCLdeposits (Figs 10 and 11A), with bed thicknessaveraging 62 cm. Facies 2 and 3 are less abundant(Fig. 10) and average bed thickness is 30 cm.Facies 4 is common in thin-bedded intervals
(Fig. 11). Bioturbated mudstone units also makeup a significant portion of the measured section(Fig. 11A and F), generally found above largetruncation surfaces (Fig. 11A, B and E). Thesemudstones can be so thoroughly bioturbated asto destroy primary fabric and completelydisarticulate thin sand beds (Fig. 11F). Palaeo-flow is generally to the north (Fig. 11A), althoughwith considerable divergence.
Depositional setting interpretationThe thick-bedded CRCL units at PukearuhueBeach were classified by Browne & Slatt (2002)as ‘proximal levee’ deposits on a ‘base of slopeapron’. Indeed, some of the CRCL deposits occuroutside of the channel (Fig. 11B), but many alsopinch out against truncation surfaces (Fig. 11B),indicating intra-channel deposition. The highproportion of Facies 1 (Fig. 10) and the intra-channel CRCL deposition indicate that the NZlocale was relatively closer to the axis of flow thaneither the ZA or MAG locales. The non-amalgam-ated CRCL-rich facies (Fig. 11A, B and E) may beoff-axis channel fill and overbank facies associ-ated with a large submarine channel system,which are commonly observed in base of slopeenvironments and channel–lobe transition zones(Wynn et al., 2002). Axial facies may also beCRCL, or may be higher energy facies, such as theshell-hash and mud-clast conglomerate seen inlower stratigraphic intervals (plate 49 of Kinget al., 1993).
Browne & Slatt (2002) inferred a break in slope(i.e. gradient change) for the NZ locale, and thewide variation in palaeocurrent directionthroughout the succession (Fig. 11A) supportsthis inference. This break in slope probably actedin three ways to promote CRCL deposition in theNZ locale: (i) the decrease in gradient wouldcause reductions in flow velocity and shear stress,thus increasing suspended-load fallout rates; (ii)an increase in channel width at the base of slope,as commonly documented in modern systems(Adeogba et al., 2005; Maier et al., 2011), cancause flow expansion and a reduction in flowthickness, resulting in flow non-uniformity andrapid suspended load fallout; and (iii) a decreasein channel depth, also commonly observed inareas of decreasing gradient (Wynn et al., 2002),promotes flow thickness reductions and non-uniformity. The wide variation in palaeocurrentdirections throughout the succession (Fig. 11A;Browne & Slatt, 2002) supports the notion of flownon-uniformity and expansion at the inferredbreak in slope (Fig. 9).
880 Z. R. Jobe et al.
� 2011 The Authors. Journal compilation � 2011 International Association of Sedimentologists, Sedimentology, 59, 867–898
ZA (South Africa) locale
DescriptionFan 3 outcrops have been extensively subdivided(Johnson et al., 2001a; van der Werff & Johnson,2003; Hodgson et al., 2006), but only three mainintervals are recognized by this study: lower andupper sand-prone packages separated by a mud-prone package (Fig. 12), all of which containabundant CRCL. Due to exposure constraints (see
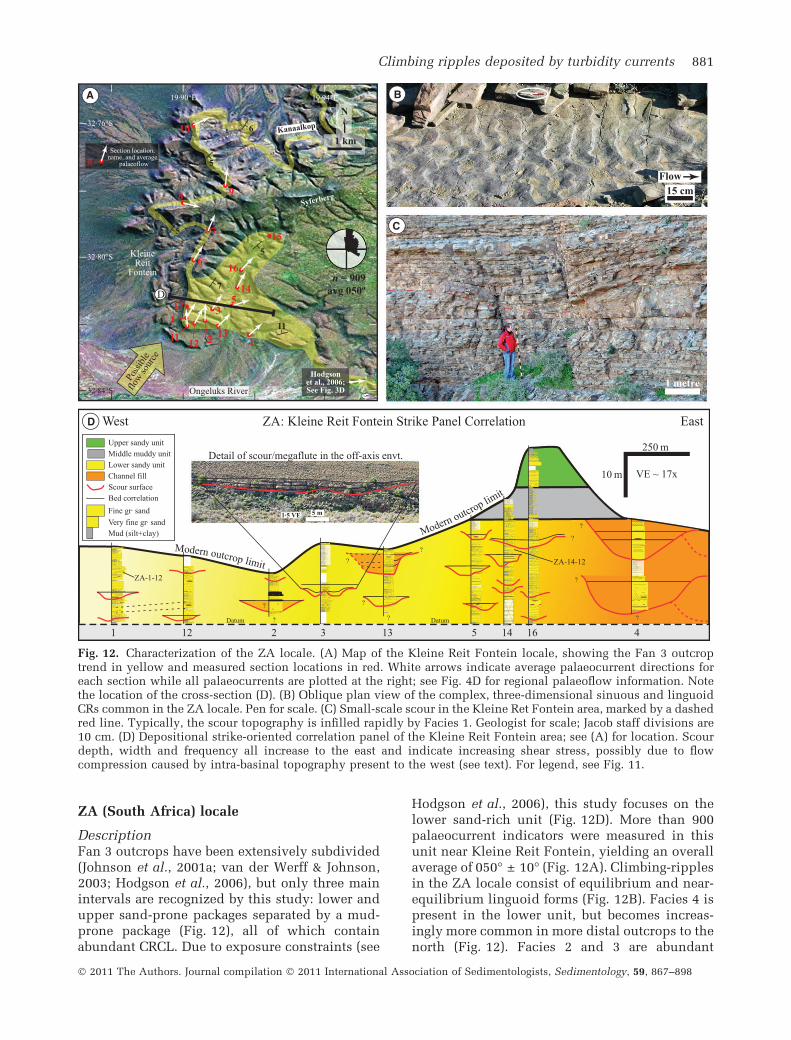
Hodgson et al., 2006), this study focuses on thelower sand-rich unit (Fig. 12D). More than 900palaeocurrent indicators were measured in thisunit near Kleine Reit Fontein, yielding an overallaverage of 050� ± 10� (Fig. 12A). Climbing-ripplesin the ZA locale consist of equilibrium and near-equilibrium linguoid forms (Fig. 12B). Facies 4 ispresent in the lower unit, but becomes increas-ingly more common in more distal outcrops to thenorth (Fig. 12). Facies 2 and 3 are abundant
Fig. 12. Characterization of the ZA locale. (A) Map of the Kleine Reit Fontein locale, showing the Fan 3 outcroptrend in yellow and measured section locations in red. White arrows indicate average palaeocurrent directions foreach section while all palaeocurrents are plotted at the right; see Fig. 4D for regional palaeoflow information. Notethe location of the cross-section (D). (B) Oblique plan view of the complex, three-dimensional sinuous and linguoidCRs common in the ZA locale. Pen for scale. (C) Small-scale scour in the Kleine Ret Fontein area, marked by a dashedred line. Typically, the scour topography is infilled rapidly by Facies 1. Geologist for scale; Jacob staff divisions are10 cm. (D) Depositional strike-oriented correlation panel of the Kleine Reit Fontein area; see (A) for location. Scourdepth, width and frequency all increase to the east and indicate increasing shear stress, possibly due to flowcompression caused by intra-basinal topography present to the west (see text). For legend, see Fig. 11.
Climbing ripples deposited by turbidity currents 881
� 2011 The Authors. Journal compilation � 2011 International Association of Sedimentologists, Sedimentology, 59, 867–898
(Figs 10 and 12D), and Facies 1 occurs only wheninfilling small-scale concave-up truncation fea-tures (Fig. 12C and D). These truncation featuresare rare in western outcrops and relatively small,averaging 10 m wide and ca 1 m deep (Fig. 12Cand D), but increase in size and frequency to theeast, averaging 30 m wide by 5 m deep in easternoutcrops (Fig. 12D); 21 measurements of trunca-tion depths show a linear eastward increasein depth of 1 m per 400 m distance (R2 = 0Æ58).Further to the east, near Ongeluks River
(Fig. 12A), morphologically similar but muchlarger erosional features are filled with massive/structureless sandstone (Fig. 12D; Morris et al.,2000; Hodgson et al., 2006). This eastward faciestransition is poorly exposed between sections 13and 4 (Fig. 12A).
Depositional setting interpretationThe facies distributions, stratal patterns andrelative location in the system indicate that theKleine Reit Fontein area represents an off-axis
882 Z. R. Jobe et al.
� 2011 The Authors. Journal compilation � 2011 International Association of Sedimentologists, Sedimentology, 59, 867–898
environment that received unconfined flows. Thepredominance of Facies 2 and 3 in ZA (Fig. 10)indicates that the flows were highly depletive.The small-scale concave-up features are inter-preted as scours (sensu Normark et al., 1979;Mutti & Normark, 1987) by the present study andhave similar geometries to ‘megaflutes’ (Elliott,2000; Pyles, 2008; Kane et al., 2009). Thesescours are interpreted to represent robust, highshear-stress portions of flows that eroded the bed,thereafter depositing Facies 1 in the newlycreated depressions. These features are thoughtto be temporary and infilled rather quickly,perhaps by no more than a few flows (for exampleFig. 12C). The large-scale erosional features filledwith structureless sandstone at Ongeluks River(Fig. 12D) are interpreted as erosionally confinedthalwegs or channels (Morris et al., 2000; Hodg-son et al., 2006) that reflect full flow confinement.The eastward transition from the CRCL-domi-nated Kleine Reit Fontein to the axial channel-lized Ongeluks River, a distance of ca 2 km(Fig. 12A and D), probably reflects the influenceof increasing confinement, shear stress and par-ticle concentration, with scour intensity steadilyincreasing eastward (Fig. 12D).
Palaeocurrent data and regional mapping showthat turbidity currents were sourced from thesouth-west, but abruptly turn northward just eastof Kleine Reit Fontein (Figs 4D and 12A; Hodgsonet al., 2006). Also, Fan 3 thins rapidly east of wellbore NS4 (Fig. 4D; Hodgson et al., 2006; Luthiet al., 2006). These architectural changes areinterpreted by Hodgson et al. (2006) and Luthi
et al. (2006) to reflect the presence of tectonicallyinduced intra-basinal sea floor topography. Thisbuttress may have acted to deflect flows north-ward and compress and re-invigorate them, caus-ing the eastward increase in confinement andscour intensity observed in the off-axis Kleine ReitFontein (Fig. 12D). In Ongeluks River outcropsnear the topographic buttress, the flows may have‘bulked up’ enough to form high-density turbiditycurrents (cf. Lowe, 1982), causing channel orthalweg incision. The tectonically induced but-tress, if growing during deposition, may accountfor the substantial thickness of CRCL depositsseen in the Kleine Reit Fontein area.
MAG (Magnolia Field, GOM) Locale
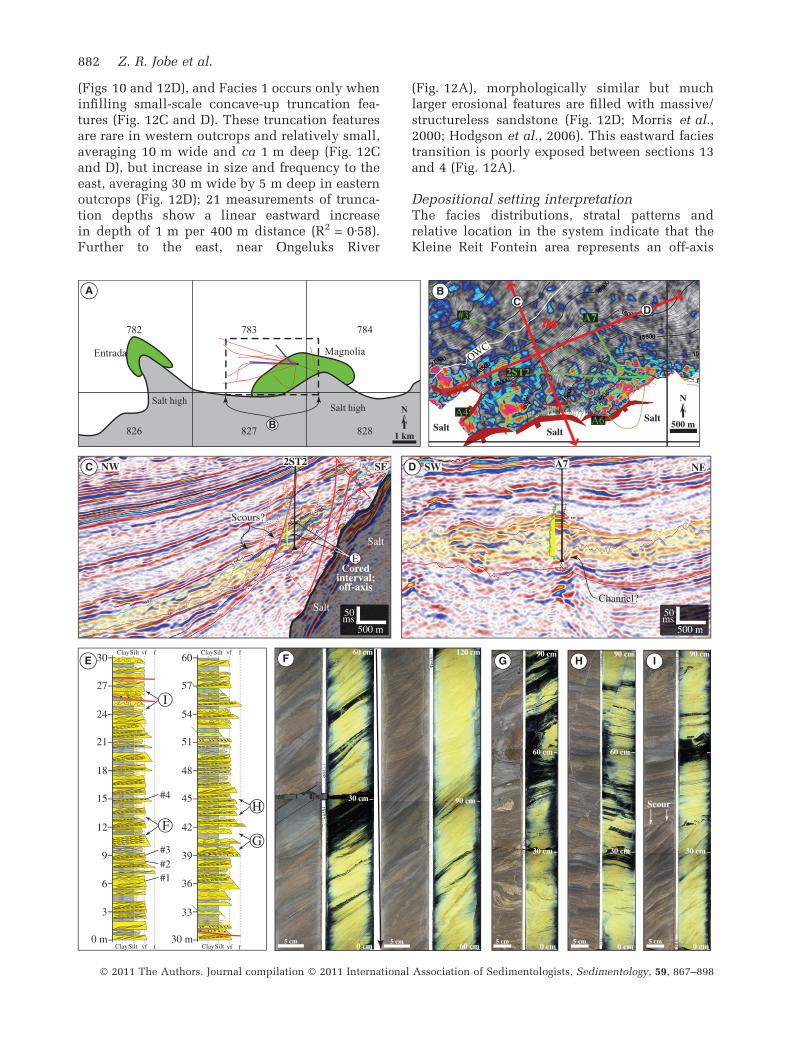
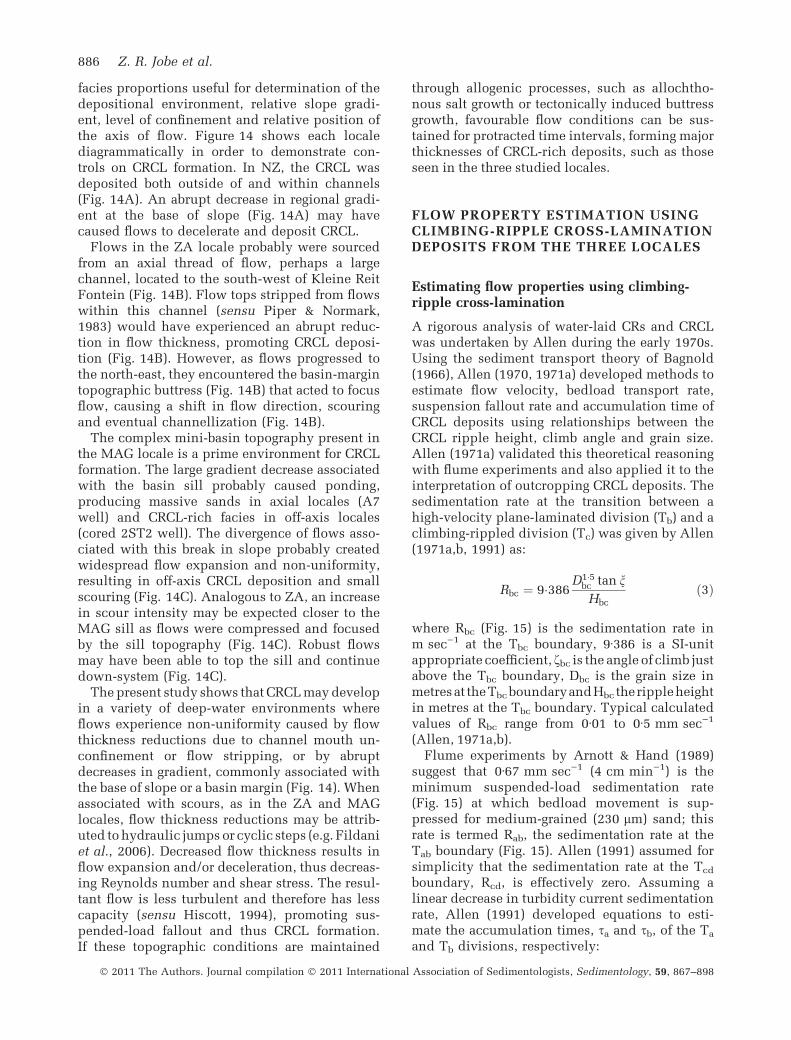
DescriptionThe Magnolia field occurs adjacent to the southernsalt-cored margin and exit point of the Titan mini-basin (Figs 3E, 13A and 13B). A dip-orientedseismic reflection profile down the axis of thebasin (Fig. 13C) reveals a ca 70 m thick mainreservoir interval thinning and partially onlappingonto the salt wall. A strike-oriented seismicreflection profile near the southern basin margin(Fig. 13D) shows chaotic high-amplitude and low-amplitude reflections and multiple truncationsurfaces in the main reservoir interval. Well logsin the cored 2ST2 well show that the mainreservoir package is composed of non-amalgam-ated sandstone–mudstone facies (Fig. 13C) whilethe same package in the A7 well is much thicker(240 m) and composed of thick, amalgamated
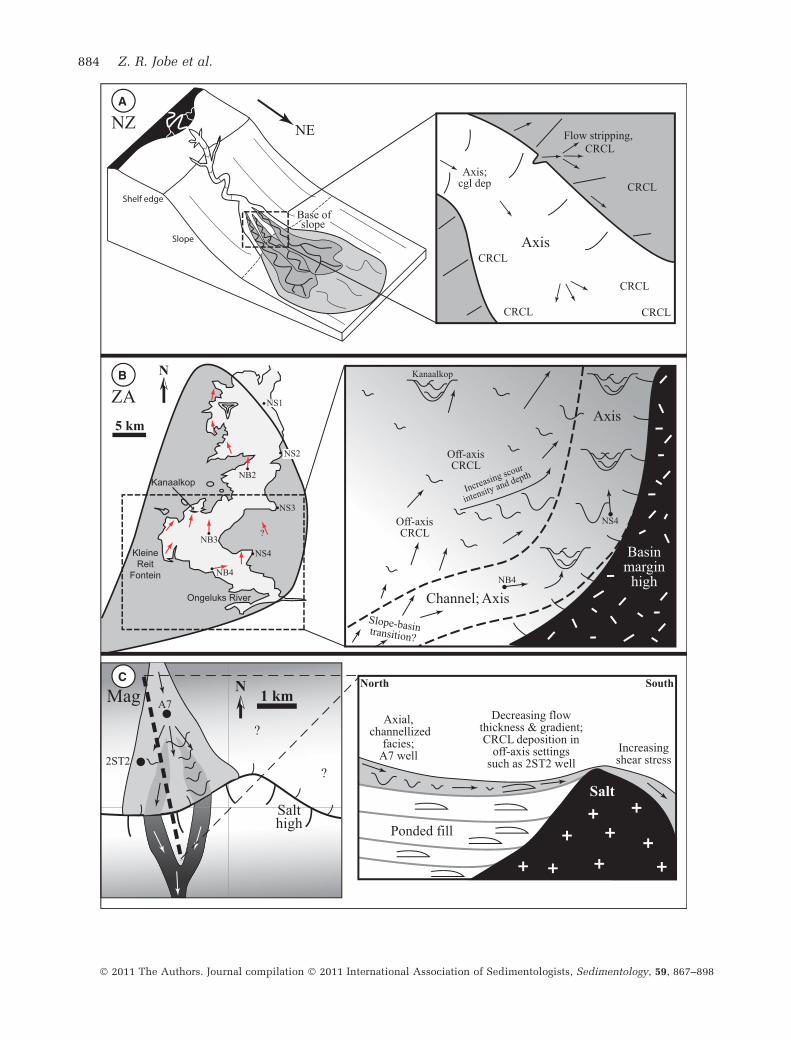
Fig. 13. Characterization of the MAG locale. (A) Map of the southern Titan mini-basin, with oil fields shown ingreen. Red lines indicate well bore penetrations of the Magnolia Field and the wells shown in (C) and (D) arehighlighted in blue. The dashed box indicates the location of (B). Numbers indicate Garden Banks block numbers. (B)Structure map of the top main reservoir overlain with the RMS amplitude of the entire main reservoir interval (highamplitude values are red, low values are blue). Note that amplitudes in Magnolia indicate fluid phase rather thanlithology; depositional elements are difficult to characterize using amplitude. The main reservoir thins southwardonto the salt high. Faults are drawn in red and generally dip to the north. Selected wells are shown in green; 2ST2 isthe cored well shown in (C) and A7 is the axial well, shown in (D). (C) Dip seismic reflection profile throughMagnolia field; the main reservoir interval is highlighted in yellow. The cored 2ST2 well displays heterogenous logresponse. Note the extensive faulting (red lines) and chaotic reflections, especially in updip locations. (D) Strikeseismic reflection profile through Magnolia near the A7 well, showing the chaotic nature of the main reservoirinterval and the log response of the interpreted axial environment. (E) The core of the main reservoir interval from the2ST2 well, composed primarily of climbing-ripple cross-lamination (CRCL) and scour fill deposits. Note theextensive slumping and faulting of the upper part of the main reservoir interval. For legend, see Fig. 11. (F) Four feet(1Æ2 m) of typical CRCL deposits in Magnolia field. The presence of CRCL and flame structures suggests rapiddeposition. Note the thick interbedded mudstones draping and preserving original ripple topography, indicatingnon-erosive flows. (G) Soft sediment deformation and convoluted lamination/bedding of the cored interval, sug-gesting a topographically complex depositional environment due to salt movement. (H) Faulting of the cored intervalas a result of syn-depositional and post-depositional salt movement. These faults have minor offsets but, nonetheless,create heterogeneity; many faults have larger offsets – see (E). (I) Mud chip-lined scour and associated dip changeobserved in the cored interval. Note the slumped and convoluted bedding overlying the scour surface, suggesting thatdepositional topography was created by the scour.
Climbing ripples deposited by turbidity currents 883
� 2011 The Authors. Journal compilation � 2011 International Association of Sedimentologists, Sedimentology, 59, 867–898
884 Z. R. Jobe et al.
� 2011 The Authors. Journal compilation � 2011 International Association of Sedimentologists, Sedimentology, 59, 867–898
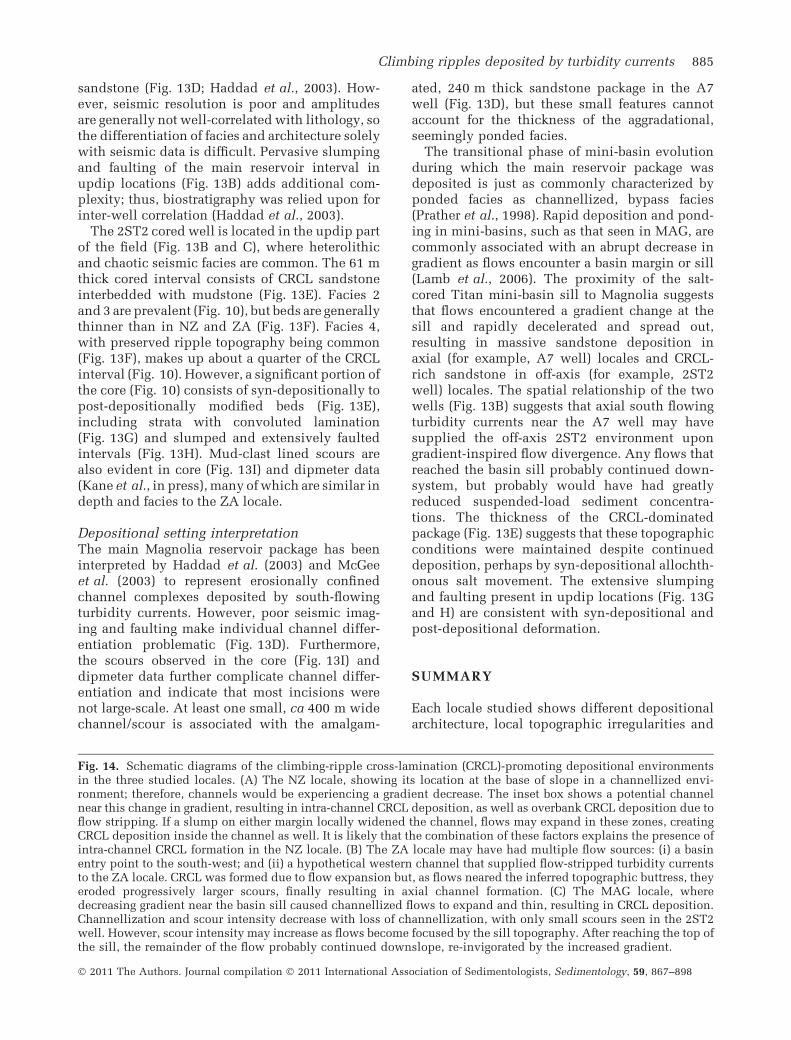
sandstone (Fig. 13D; Haddad et al., 2003). How-ever, seismic resolution is poor and amplitudesare generally not well-correlated with lithology, sothe differentiation of facies and architecture solelywith seismic data is difficult. Pervasive slumpingand faulting of the main reservoir interval inupdip locations (Fig. 13B) adds additional com-plexity; thus, biostratigraphy was relied upon forinter-well correlation (Haddad et al., 2003).
The 2ST2 cored well is located in the updip partof the field (Fig. 13B and C), where heterolithicand chaotic seismic facies are common. The 61 mthick cored interval consists of CRCL sandstoneinterbedded with mudstone (Fig. 13E). Facies 2and 3 are prevalent (Fig. 10), but beds are generallythinner than in NZ and ZA (Fig. 13F). Facies 4,with preserved ripple topography being common(Fig. 13F), makes up about a quarter of the CRCLinterval (Fig. 10). However, a significant portion ofthe core (Fig. 10) consists of syn-depositionally topost-depositionally modified beds (Fig. 13E),including strata with convoluted lamination(Fig. 13G) and slumped and extensively faultedintervals (Fig. 13H). Mud-clast lined scours arealso evident in core (Fig. 13I) and dipmeter data(Kane et al., in press), many of which are similar indepth and facies to the ZA locale.
Depositional setting interpretationThe main Magnolia reservoir package has beeninterpreted by Haddad et al. (2003) and McGeeet al. (2003) to represent erosionally confinedchannel complexes deposited by south-flowingturbidity currents. However, poor seismic imag-ing and faulting make individual channel differ-entiation problematic (Fig. 13D). Furthermore,the scours observed in the core (Fig. 13I) anddipmeter data further complicate channel differ-entiation and indicate that most incisions werenot large-scale. At least one small, ca 400 m widechannel/scour is associated with the amalgam-
ated, 240 m thick sandstone package in the A7well (Fig. 13D), but these small features cannotaccount for the thickness of the aggradational,seemingly ponded facies.
The transitional phase of mini-basin evolutionduring which the main reservoir package wasdeposited is just as commonly characterized byponded facies as channellized, bypass facies(Prather et al., 1998). Rapid deposition and pond-ing in mini-basins, such as that seen in MAG, arecommonly associated with an abrupt decrease ingradient as flows encounter a basin margin or sill(Lamb et al., 2006). The proximity of the salt-cored Titan mini-basin sill to Magnolia suggeststhat flows encountered a gradient change at thesill and rapidly decelerated and spread out,resulting in massive sandstone deposition inaxial (for example, A7 well) locales and CRCL-rich sandstone in off-axis (for example, 2ST2well) locales. The spatial relationship of the twowells (Fig. 13B) suggests that axial south flowingturbidity currents near the A7 well may havesupplied the off-axis 2ST2 environment upongradient-inspired flow divergence. Any flows thatreached the basin sill probably continued down-system, but probably would have had greatlyreduced suspended-load sediment concentra-tions. The thickness of the CRCL-dominatedpackage (Fig. 13E) suggests that these topographicconditions were maintained despite continueddeposition, perhaps by syn-depositional allochth-onous salt movement. The extensive slumpingand faulting present in updip locations (Fig. 13Gand H) are consistent with syn-depositional andpost-depositional deformation.
SUMMARY
Each locale studied shows different depositionalarchitecture, local topographic irregularities and
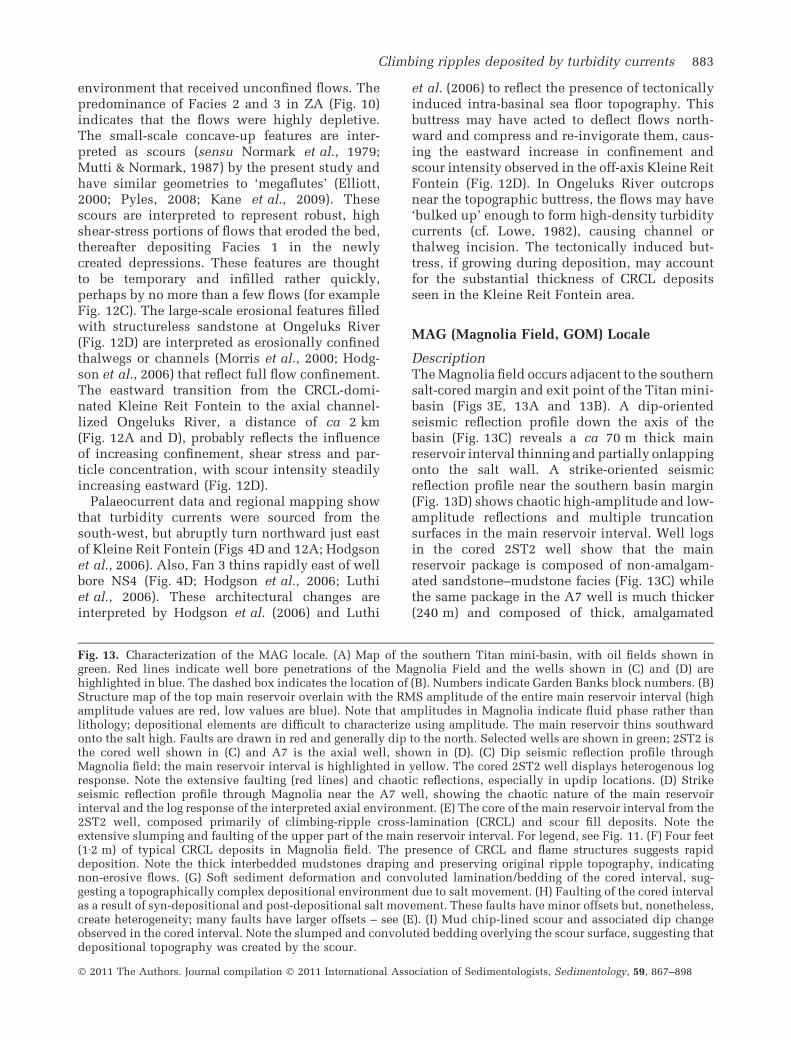
Fig. 14. Schematic diagrams of the climbing-ripple cross-lamination (CRCL)-promoting depositional environmentsin the three studied locales. (A) The NZ locale, showing its location at the base of slope in a channellized envi-ronment; therefore, channels would be experiencing a gradient decrease. The inset box shows a potential channelnear this change in gradient, resulting in intra-channel CRCL deposition, as well as overbank CRCL deposition due toflow stripping. If a slump on either margin locally widened the channel, flows may expand in these zones, creatingCRCL deposition inside the channel as well. It is likely that the combination of these factors explains the presence ofintra-channel CRCL formation in the NZ locale. (B) The ZA locale may have had multiple flow sources: (i) a basinentry point to the south-west; and (ii) a hypothetical western channel that supplied flow-stripped turbidity currentsto the ZA locale. CRCL was formed due to flow expansion but, as flows neared the inferred topographic buttress, theyeroded progressively larger scours, finally resulting in axial channel formation. (C) The MAG locale, wheredecreasing gradient near the basin sill caused channellized flows to expand and thin, resulting in CRCL deposition.Channellization and scour intensity decrease with loss of channellization, with only small scours seen in the 2ST2well. However, scour intensity may increase as flows become focused by the sill topography. After reaching the top ofthe sill, the remainder of the flow probably continued downslope, re-invigorated by the increased gradient.
Climbing ripples deposited by turbidity currents 885
� 2011 The Authors. Journal compilation � 2011 International Association of Sedimentologists, Sedimentology, 59, 867–898
facies proportions useful for determination of thedepositional environment, relative slope gradi-ent, level of confinement and relative position ofthe axis of flow. Figure 14 shows each localediagrammatically in order to demonstrate con-trols on CRCL formation. In NZ, the CRCL wasdeposited both outside of and within channels(Fig. 14A). An abrupt decrease in regional gradi-ent at the base of slope (Fig. 14A) may havecaused flows to decelerate and deposit CRCL.
Flows in the ZA locale probably were sourcedfrom an axial thread of flow, perhaps a largechannel, located to the south-west of Kleine ReitFontein (Fig. 14B). Flow tops stripped from flowswithin this channel (sensu Piper & Normark,1983) would have experienced an abrupt reduc-tion in flow thickness, promoting CRCL deposi-tion (Fig. 14B). However, as flows progressed tothe north-east, they encountered the basin-margintopographic buttress (Fig. 14B) that acted to focusflow, causing a shift in flow direction, scouringand eventual channellization (Fig. 14B).
The complex mini-basin topography present inthe MAG locale is a prime environment for CRCLformation. The large gradient decrease associatedwith the basin sill probably caused ponding,producing massive sands in axial locales (A7well) and CRCL-rich facies in off-axis locales(cored 2ST2 well). The divergence of flows asso-ciated with this break in slope probably createdwidespread flow expansion and non-uniformity,resulting in off-axis CRCL deposition and smallscouring (Fig. 14C). Analogous to ZA, an increasein scour intensity may be expected closer to theMAG sill as flows were compressed and focusedby the sill topography (Fig. 14C). Robust flowsmay have been able to top the sill and continuedown-system (Fig. 14C).
The present study shows that CRCL may developin a variety of deep-water environments whereflows experience non-uniformity caused by flowthickness reductions due to channel mouth un-confinement or flow stripping, or by abruptdecreases in gradient, commonly associated withthe base of slope or a basin margin (Fig. 14). Whenassociated with scours, as in the ZA and MAGlocales, flow thickness reductions may be attrib-uted to hydraulic jumps or cyclic steps (e.g. Fildaniet al., 2006). Decreased flow thickness results inflow expansion and/or deceleration, thus decreas-ing Reynolds number and shear stress. The resul-tant flow is less turbulent and therefore has lesscapacity (sensu Hiscott, 1994), promoting sus-pended-load fallout and thus CRCL formation.If these topographic conditions are maintained
through allogenic processes, such as allochtho-nous salt growth or tectonically induced buttressgrowth, favourable flow conditions can be sus-tained for protracted time intervals, forming majorthicknesses of CRCL-rich deposits, such as thoseseen in the three studied locales.
FLOW PROPERTY ESTIMATION USINGCLIMBING-RIPPLE CROSS-LAMINATIONDEPOSITS FROM THE THREE LOCALES
Estimating flow properties using climbing-ripple cross-lamination
A rigorous analysis of water-laid CRs and CRCLwas undertaken by Allen during the early 1970s.Using the sediment transport theory of Bagnold(1966), Allen (1970, 1971a) developed methods toestimate flow velocity, bedload transport rate,suspension fallout rate and accumulation time ofCRCL deposits using relationships between theCRCL ripple height, climb angle and grain size.Allen (1971a) validated this theoretical reasoningwith flume experiments and also applied it to theinterpretation of outcropping CRCL deposits. Thesedimentation rate at the transition between ahigh-velocity plane-laminated division (Tb) and aclimbing-rippled division (Tc) was given by Allen(1971a,b, 1991) as:
Rbc ¼ 9�386D1�5
bc tan n
Hbcð3Þ
where Rbc (Fig. 15) is the sedimentation rate inm sec)1 at the Tbc boundary, 9Æ386 is a SI-unitappropriate coefficient, fbc is the angle of climb justabove the Tbc boundary, Dbc is the grain size inmetresat theTbc boundaryandHbc therippleheightin metres at the Tbc boundary. Typical calculatedvalues of Rbc range from 0Æ01 to 0Æ5 mm sec)1
(Allen, 1971a,b).Flume experiments by Arnott & Hand (1989)
suggest that 0Æ67 mm sec)1 (4 cm min)1) is theminimum suspended-load sedimentation rate(Fig. 15) at which bedload movement is sup-pressed for medium-grained (230 lm) sand; thisrate is termed Rab, the sedimentation rate at theTab boundary (Fig. 15). Allen (1991) assumed forsimplicity that the sedimentation rate at the Tcd
boundary, Rcd, is effectively zero. Assuming alinear decrease in turbidity current sedimentationrate, Allen (1991) developed equations to esti-mate the accumulation times, sa and sb, of the Ta
and Tb divisions, respectively:
886 Z. R. Jobe et al.
� 2011 The Authors. Journal compilation � 2011 International Association of Sedimentologists, Sedimentology, 59, 867–898
sa ¼1
kln
R0 þ kzab
R0ð4Þ
sb ¼1
kln
R0 þ kzab
R0 þ kzbcð5Þ
k ¼ Rab � Rbc
zab � zbcð6Þ
where zab and zbc are the heights above the base ofthe bed of the Tab and Tbc boundaries, respec-tively (Fig. 15). R0 is the sedimentation rate at thebase of the Ta division (z = 0), Rab and Rbc are thesedimentation rates at the Tab and Tbc boundaries,respectively (Fig. 15), and k is the linear gradientof R with respect to the bed height.
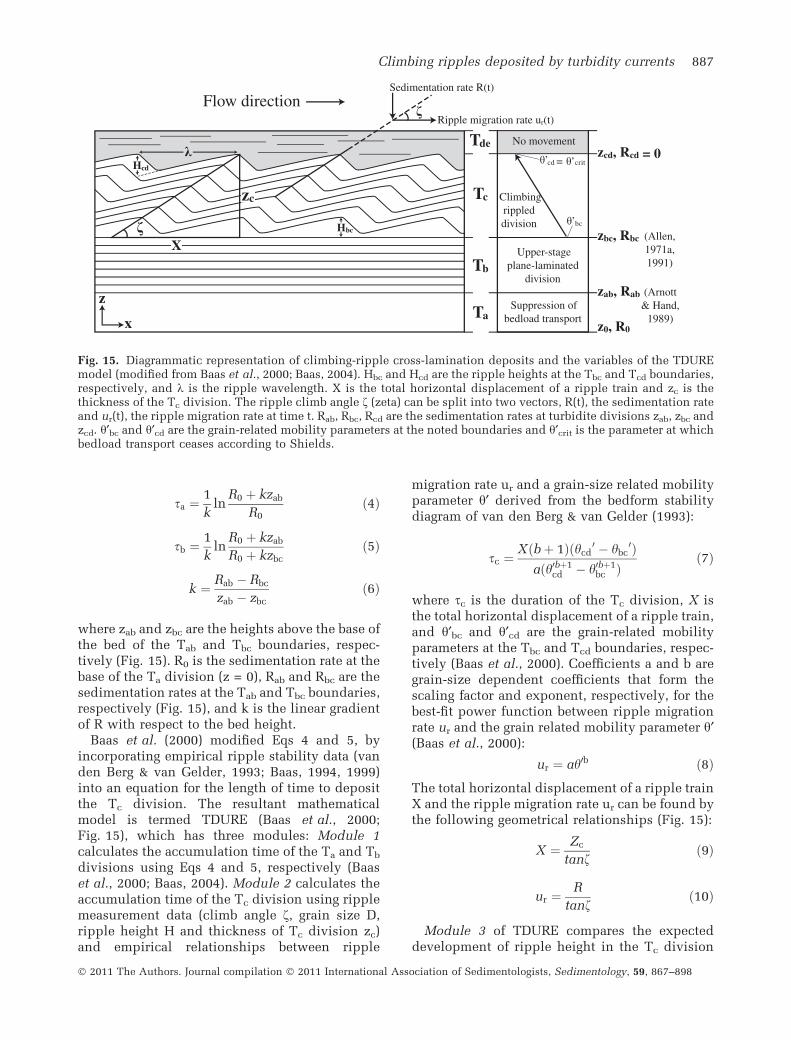
Baas et al. (2000) modified Eqs 4 and 5, byincorporating empirical ripple stability data (vanden Berg & van Gelder, 1993; Baas, 1994, 1999)into an equation for the length of time to depositthe Tc division. The resultant mathematicalmodel is termed TDURE (Baas et al., 2000;Fig. 15), which has three modules: Module 1calculates the accumulation time of the Ta and Tb
divisions using Eqs 4 and 5, respectively (Baaset al., 2000; Baas, 2004). Module 2 calculates theaccumulation time of the Tc division using ripplemeasurement data (climb angle f, grain size D,ripple height H and thickness of Tc division zc)and empirical relationships between ripple
migration rate ur and a grain-size related mobilityparameter h¢ derived from the bedform stabilitydiagram of van den Berg & van Gelder (1993):
sc ¼Xðbþ 1Þðhcd
0 � hbc0Þ
aðh0bþ1cd � h0bþ1
bc Þð7Þ
where sc is the duration of the Tc division, X isthe total horizontal displacement of a ripple train,and h¢bc and h¢cd are the grain-related mobilityparameters at the Tbc and Tcd boundaries, respec-tively (Baas et al., 2000). Coefficients a and b aregrain-size dependent coefficients that form thescaling factor and exponent, respectively, for thebest-fit power function between ripple migrationrate ur and the grain related mobility parameter h¢(Baas et al., 2000):
ur ¼ ah0b ð8ÞThe total horizontal displacement of a ripple trainX and the ripple migration rate ur can be found bythe following geometrical relationships (Fig. 15):
X ¼ Zc
tanfð9Þ
ur ¼R
tanfð10Þ
Module 3 of TDURE compares the expecteddevelopment of ripple height in the Tc division
Fig. 15. Diagrammatic representation of climbing-ripple cross-lamination deposits and the variables of the TDUREmodel (modified from Baas et al., 2000; Baas, 2004). Hbc and Hcd are the ripple heights at the Tbc and Tcd boundaries,respectively, and k is the ripple wavelength. X is the total horizontal displacement of a ripple train and zc is thethickness of the Tc division. The ripple climb angle f (zeta) can be split into two vectors, R(t), the sedimentation rateand ur(t), the ripple migration rate at time t. Rab, Rbc, Rcd are the sedimentation rates at turbidite divisions zab, zbc andzcd. h¢bc and h¢cd are the grain-related mobility parameters at the noted boundaries and h¢crit is the parameter at whichbedload transport ceases according to Shields.
Climbing ripples deposited by turbidity currents 887
� 2011 The Authors. Journal compilation � 2011 International Association of Sedimentologists, Sedimentology, 59, 867–898
with the observed change in ripple height. Thiscomparison is based on empirical relationshipsbetween the ratio of instantaneous ripple heightH(t) to the equilibrium ripple height HE (Baas,1994, 1999), the time required to reach equilib-rium sE and h¢:
HðtÞHE¼ 1� ð0�01ÞSH ð11Þ
SH ¼h0bc � h0cd
csc
� �1d s
1þ1d
c � ðsc � tÞ1þ1d
� �1þ 1
d
ð12Þ
where SH is the development stage of rippleheight, t is the development or accumulationtime, and c and d are grain-size dependentcoefficients in best-fit power functions for sE andh¢, in the form of Eq. 8. The calculated heightat the Tcd boundary Hcd (Fig. 3) can then becompared with the observed height H to confirmaccuracy of the calculations made in Module 2(Baas et al., 2000). The three modules of TDUREhave been incorporated by Baas et al. (2000) intoa spreadsheet that largely automates the afore-mentioned calculations, providing sedimentationrates R0, Rab, Rbc, accumulation times sa, sa, sc,and the expected ripple height Hcd at the Tcd
boundary for comparative purposes.
Sedimentation rates and accumulation timescalculated from the three locales
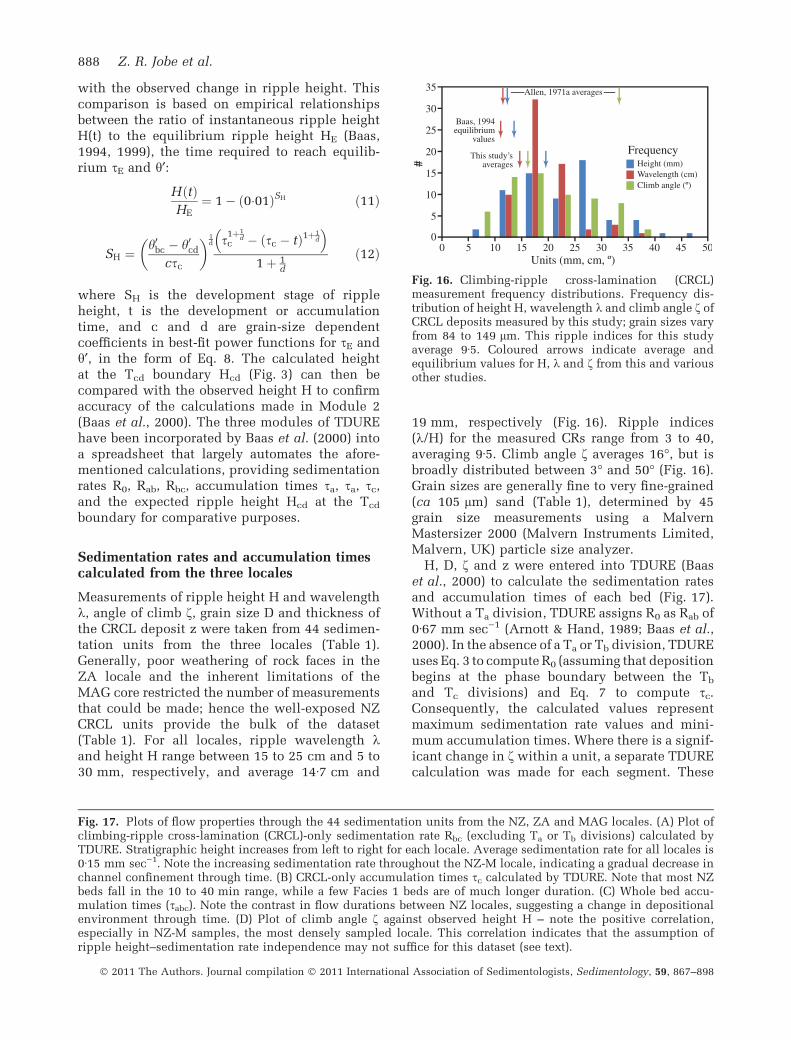
Measurements of ripple height H and wavelengthk, angle of climb f, grain size D and thickness ofthe CRCL deposit z were taken from 44 sedimen-tation units from the three locales (Table 1).Generally, poor weathering of rock faces in theZA locale and the inherent limitations of theMAG core restricted the number of measurementsthat could be made; hence the well-exposed NZCRCL units provide the bulk of the dataset(Table 1). For all locales, ripple wavelength kand height H range between 15 to 25 cm and 5 to30 mm, respectively, and average 14Æ7 cm and
19 mm, respectively (Fig. 16). Ripple indices(k/H) for the measured CRs range from 3 to 40,averaging 9Æ5. Climb angle f averages 16�, but isbroadly distributed between 3� and 50� (Fig. 16).Grain sizes are generally fine to very fine-grained(ca 105 lm) sand (Table 1), determined by 45grain size measurements using a MalvernMastersizer 2000 (Malvern Instruments Limited,Malvern, UK) particle size analyzer.
H, D, f and z were entered into TDURE (Baaset al., 2000) to calculate the sedimentation ratesand accumulation times of each bed (Fig. 17).Without a Ta division, TDURE assigns R0 as Rab of0Æ67 mm sec)1 (Arnott & Hand, 1989; Baas et al.,2000). In the absence of a Ta or Tb division, TDUREuses Eq. 3 to compute R0 (assuming that depositionbegins at the phase boundary between the Tb
and Tc divisions) and Eq. 7 to compute sc.Consequently, the calculated values representmaximum sedimentation rate values and mini-mum accumulation times. Where there is a signif-icant change in f within a unit, a separate TDUREcalculation was made for each segment. These
Fig. 16. Climbing-ripple cross-lamination (CRCL)measurement frequency distributions. Frequency dis-tribution of height H, wavelength k and climb angle f ofCRCL deposits measured by this study; grain sizes varyfrom 84 to 149 lm. This ripple indices for this studyaverage 9Æ5. Coloured arrows indicate average andequilibrium values for H, k and f from this and variousother studies.
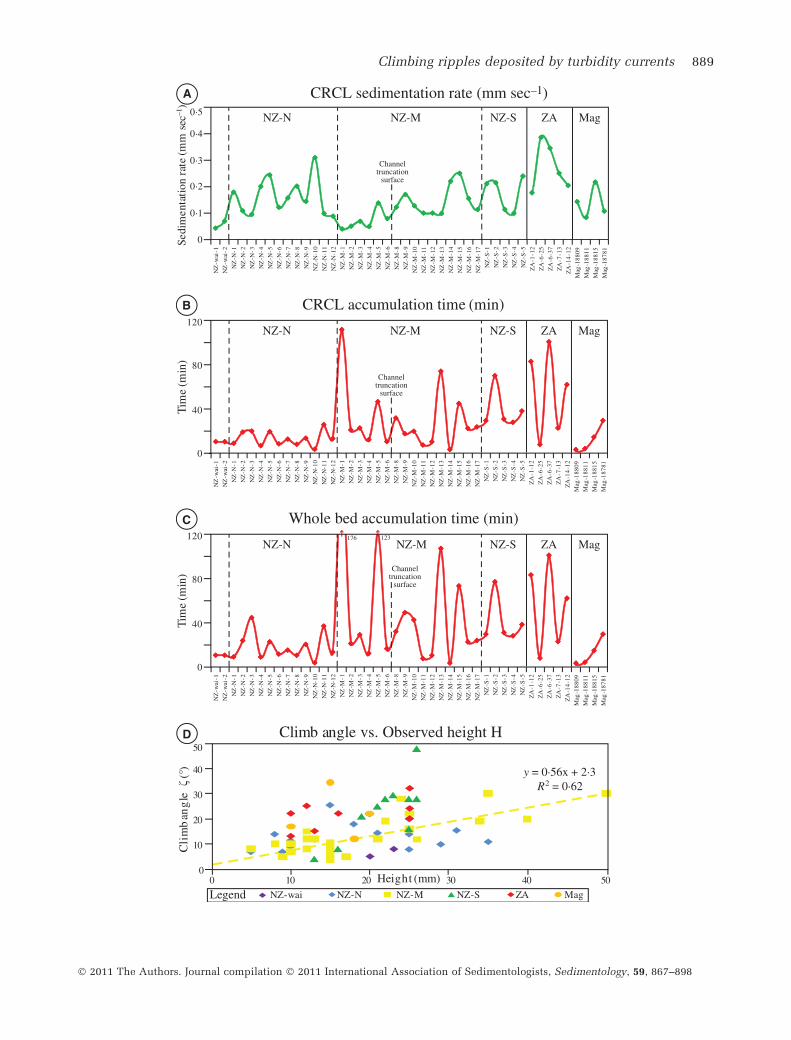
Fig. 17. Plots of flow properties through the 44 sedimentation units from the NZ, ZA and MAG locales. (A) Plot ofclimbing-ripple cross-lamination (CRCL)-only sedimentation rate Rbc (excluding Ta or Tb divisions) calculated byTDURE. Stratigraphic height increases from left to right for each locale. Average sedimentation rate for all locales is0Æ15 mm sec)1. Note the increasing sedimentation rate throughout the NZ-M locale, indicating a gradual decrease inchannel confinement through time. (B) CRCL-only accumulation times sc calculated by TDURE. Note that most NZbeds fall in the 10 to 40 min range, while a few Facies 1 beds are of much longer duration. (C) Whole bed accu-mulation times (sabc). Note the contrast in flow durations between NZ locales, suggesting a change in depositionalenvironment through time. (D) Plot of climb angle f against observed height H – note the positive correlation,especially in NZ-M samples, the most densely sampled locale. This correlation indicates that the assumption ofripple height–sedimentation rate independence may not suffice for this dataset (see text).
888 Z. R. Jobe et al.
� 2011 The Authors. Journal compilation � 2011 International Association of Sedimentologists, Sedimentology, 59, 867–898
Climbing ripples deposited by turbidity currents 889
� 2011 The Authors. Journal compilation � 2011 International Association of Sedimentologists, Sedimentology, 59, 867–898
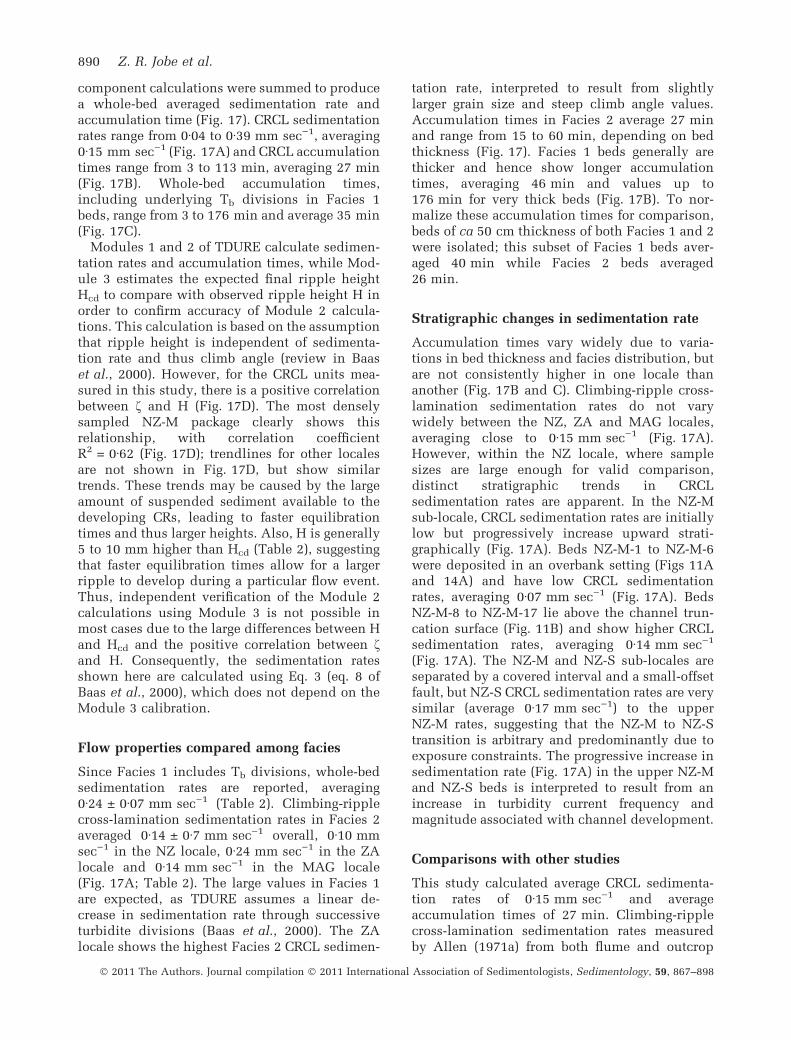
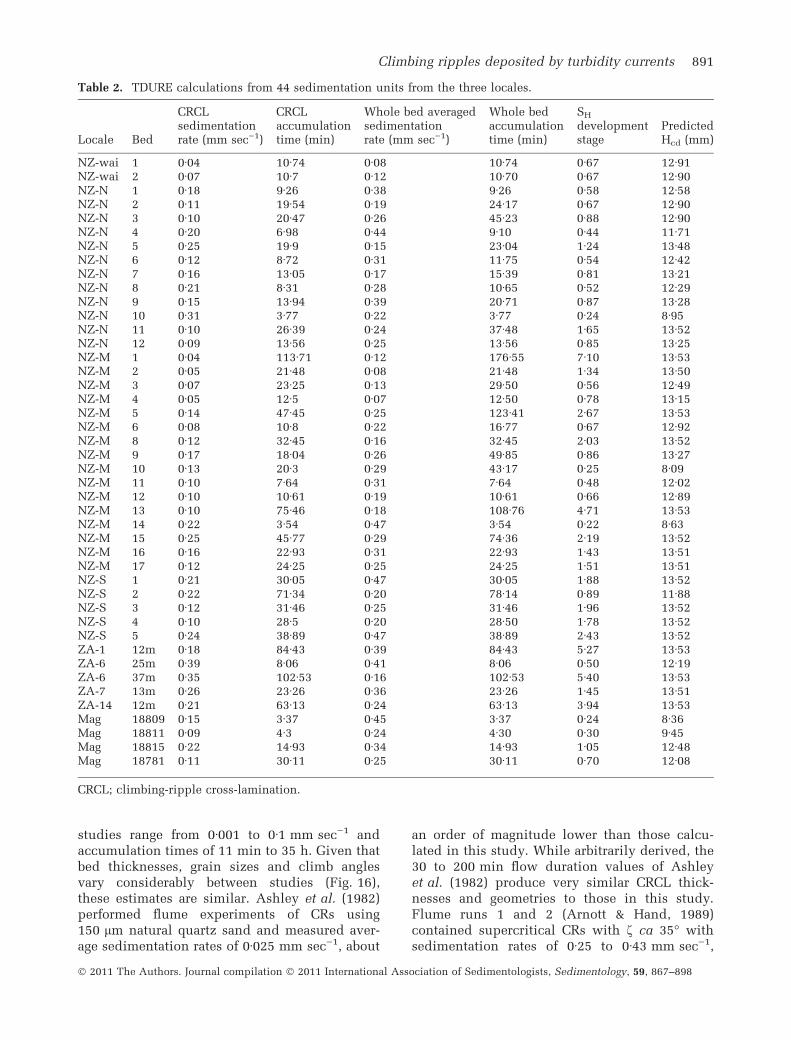
component calculations were summed to producea whole-bed averaged sedimentation rate andaccumulation time (Fig. 17). CRCL sedimentationrates range from 0Æ04 to 0Æ39 mm sec)1, averaging0Æ15 mm sec)1 (Fig. 17A) and CRCL accumulationtimes range from 3 to 113 min, averaging 27 min(Fig. 17B). Whole-bed accumulation times,including underlying Tb divisions in Facies 1beds, range from 3 to 176 min and average 35 min(Fig. 17C).
Modules 1 and 2 of TDURE calculate sedimen-tation rates and accumulation times, while Mod-ule 3 estimates the expected final ripple heightHcd to compare with observed ripple height H inorder to confirm accuracy of Module 2 calcula-tions. This calculation is based on the assumptionthat ripple height is independent of sedimenta-tion rate and thus climb angle (review in Baaset al., 2000). However, for the CRCL units mea-sured in this study, there is a positive correlationbetween f and H (Fig. 17D). The most denselysampled NZ-M package clearly shows thisrelationship, with correlation coefficientR2 = 0Æ62 (Fig. 17D); trendlines for other localesare not shown in Fig. 17D, but show similartrends. These trends may be caused by the largeamount of suspended sediment available to thedeveloping CRs, leading to faster equilibrationtimes and thus larger heights. Also, H is generally5 to 10 mm higher than Hcd (Table 2), suggestingthat faster equilibration times allow for a largerripple to develop during a particular flow event.Thus, independent verification of the Module 2calculations using Module 3 is not possible inmost cases due to the large differences between Hand Hcd and the positive correlation between fand H. Consequently, the sedimentation ratesshown here are calculated using Eq. 3 (eq. 8 ofBaas et al., 2000), which does not depend on theModule 3 calibration.
Flow properties compared among facies
Since Facies 1 includes Tb divisions, whole-bedsedimentation rates are reported, averaging0Æ24 ± 0Æ07 mm sec)1 (Table 2). Climbing-ripplecross-lamination sedimentation rates in Facies 2averaged 0Æ14 ± 0Æ7 mm sec)1 overall, 0Æ10 mmsec)1 in the NZ locale, 0Æ24 mm sec)1 in the ZAlocale and 0Æ14 mm sec)1 in the MAG locale(Fig. 17A; Table 2). The large values in Facies 1are expected, as TDURE assumes a linear de-crease in sedimentation rate through successiveturbidite divisions (Baas et al., 2000). The ZAlocale shows the highest Facies 2 CRCL sedimen-
tation rate, interpreted to result from slightlylarger grain size and steep climb angle values.Accumulation times in Facies 2 average 27 minand range from 15 to 60 min, depending on bedthickness (Fig. 17). Facies 1 beds generally arethicker and hence show longer accumulationtimes, averaging 46 min and values up to176 min for very thick beds (Fig. 17B). To nor-malize these accumulation times for comparison,beds of ca 50 cm thickness of both Facies 1 and 2were isolated; this subset of Facies 1 beds aver-aged 40 min while Facies 2 beds averaged26 min.
Stratigraphic changes in sedimentation rate
Accumulation times vary widely due to varia-tions in bed thickness and facies distribution, butare not consistently higher in one locale thananother (Fig. 17B and C). Climbing-ripple cross-lamination sedimentation rates do not varywidely between the NZ, ZA and MAG locales,averaging close to 0Æ15 mm sec)1 (Fig. 17A).However, within the NZ locale, where samplesizes are large enough for valid comparison,distinct stratigraphic trends in CRCLsedimentation rates are apparent. In the NZ-Msub-locale, CRCL sedimentation rates are initiallylow but progressively increase upward strati-graphically (Fig. 17A). Beds NZ-M-1 to NZ-M-6were deposited in an overbank setting (Figs 11Aand 14A) and have low CRCL sedimentationrates, averaging 0Æ07 mm sec)1 (Fig. 17A). BedsNZ-M-8 to NZ-M-17 lie above the channel trun-cation surface (Fig. 11B) and show higher CRCLsedimentation rates, averaging 0Æ14 mm sec)1
(Fig. 17A). The NZ-M and NZ-S sub-locales areseparated by a covered interval and a small-offsetfault, but NZ-S CRCL sedimentation rates are verysimilar (average 0Æ17 mm sec)1) to the upperNZ-M rates, suggesting that the NZ-M to NZ-Stransition is arbitrary and predominantly due toexposure constraints. The progressive increase insedimentation rate (Fig. 17A) in the upper NZ-Mand NZ-S beds is interpreted to result from anincrease in turbidity current frequency andmagnitude associated with channel development.
Comparisons with other studies
This study calculated average CRCL sedimenta-tion rates of 0Æ15 mm sec)1 and averageaccumulation times of 27 min. Climbing-ripplecross-lamination sedimentation rates measuredby Allen (1971a) from both flume and outcrop
890 Z. R. Jobe et al.
� 2011 The Authors. Journal compilation � 2011 International Association of Sedimentologists, Sedimentology, 59, 867–898
studies range from 0Æ001 to 0Æ1 mm sec)1 andaccumulation times of 11 min to 35 h. Given thatbed thicknesses, grain sizes and climb anglesvary considerably between studies (Fig. 16),these estimates are similar. Ashley et al. (1982)performed flume experiments of CRs using150 lm natural quartz sand and measured aver-age sedimentation rates of 0Æ025 mm sec)1, about
an order of magnitude lower than those calcu-lated in this study. While arbitrarily derived, the30 to 200 min flow duration values of Ashleyet al. (1982) produce very similar CRCL thick-nesses and geometries to those in this study.Flume runs 1 and 2 (Arnott & Hand, 1989)contained supercritical CRs with f ca 35� withsedimentation rates of 0Æ25 to 0Æ43 mm sec)1,
Table 2. TDURE calculations from 44 sedimentation units from the three locales.
Locale Bed
CRCLsedimentationrate (mm sec)1)
CRCLaccumulationtime (min)
Whole bed averagedsedimentationrate (mm sec)1)
Whole bedaccumulationtime (min)
SH
developmentstage
PredictedHcd (mm)
NZ-wai 1 0Æ04 10Æ74 0Æ08 10Æ74 0Æ67 12Æ91NZ-wai 2 0Æ07 10Æ7 0Æ12 10Æ70 0Æ67 12Æ90NZ-N 1 0Æ18 9Æ26 0Æ38 9Æ26 0Æ58 12Æ58NZ-N 2 0Æ11 19Æ54 0Æ19 24Æ17 0Æ67 12Æ90NZ-N 3 0Æ10 20Æ47 0Æ26 45Æ23 0Æ88 12Æ90NZ-N 4 0Æ20 6Æ98 0Æ44 9Æ10 0Æ44 11Æ71NZ-N 5 0Æ25 19Æ9 0Æ15 23Æ04 1Æ24 13Æ48NZ-N 6 0Æ12 8Æ72 0Æ31 11Æ75 0Æ54 12Æ42NZ-N 7 0Æ16 13Æ05 0Æ17 15Æ39 0Æ81 13Æ21NZ-N 8 0Æ21 8Æ31 0Æ28 10Æ65 0Æ52 12Æ29NZ-N 9 0Æ15 13Æ94 0Æ39 20Æ71 0Æ87 13Æ28NZ-N 10 0Æ31 3Æ77 0Æ22 3Æ77 0Æ24 8Æ95NZ-N 11 0Æ10 26Æ39 0Æ24 37Æ48 1Æ65 13Æ52NZ-N 12 0Æ09 13Æ56 0Æ25 13Æ56 0Æ85 13Æ25NZ-M 1 0Æ04 113Æ71 0Æ12 176Æ55 7Æ10 13Æ53NZ-M 2 0Æ05 21Æ48 0Æ08 21Æ48 1Æ34 13Æ50NZ-M 3 0Æ07 23Æ25 0Æ13 29Æ50 0Æ56 12Æ49NZ-M 4 0Æ05 12Æ5 0Æ07 12Æ50 0Æ78 13Æ15NZ-M 5 0Æ14 47Æ45 0Æ25 123Æ41 2Æ67 13Æ53NZ-M 6 0Æ08 10Æ8 0Æ22 16Æ77 0Æ67 12Æ92NZ-M 8 0Æ12 32Æ45 0Æ16 32Æ45 2Æ03 13Æ52NZ-M 9 0Æ17 18Æ04 0Æ26 49Æ85 0Æ86 13Æ27NZ-M 10 0Æ13 20Æ3 0Æ29 43Æ17 0Æ25 8Æ09NZ-M 11 0Æ10 7Æ64 0Æ31 7Æ64 0Æ48 12Æ02NZ-M 12 0Æ10 10Æ61 0Æ19 10Æ61 0Æ66 12Æ89NZ-M 13 0Æ10 75Æ46 0Æ18 108Æ76 4Æ71 13Æ53NZ-M 14 0Æ22 3Æ54 0Æ47 3Æ54 0Æ22 8Æ63NZ-M 15 0Æ25 45Æ77 0Æ29 74Æ36 2Æ19 13Æ52NZ-M 16 0Æ16 22Æ93 0Æ31 22Æ93 1Æ43 13Æ51NZ-M 17 0Æ12 24Æ25 0Æ25 24Æ25 1Æ51 13Æ51NZ-S 1 0Æ21 30Æ05 0Æ47 30Æ05 1Æ88 13Æ52NZ-S 2 0Æ22 71Æ34 0Æ20 78Æ14 0Æ89 11Æ88NZ-S 3 0Æ12 31Æ46 0Æ25 31Æ46 1Æ96 13Æ52NZ-S 4 0Æ10 28Æ5 0Æ20 28Æ50 1Æ78 13Æ52NZ-S 5 0Æ24 38Æ89 0Æ47 38Æ89 2Æ43 13Æ52ZA-1 12m 0Æ18 84Æ43 0Æ39 84Æ43 5Æ27 13Æ53ZA-6 25m 0Æ39 8Æ06 0Æ41 8Æ06 0Æ50 12Æ19ZA-6 37m 0Æ35 102Æ53 0Æ16 102Æ53 5Æ40 13Æ53ZA-7 13m 0Æ26 23Æ26 0Æ36 23Æ26 1Æ45 13Æ51ZA-14 12m 0Æ21 63Æ13 0Æ24 63Æ13 3Æ94 13Æ53Mag 18809 0Æ15 3Æ37 0Æ45 3Æ37 0Æ24 8Æ36Mag 18811 0Æ09 4Æ3 0Æ24 4Æ30 0Æ30 9Æ45Mag 18815 0Æ22 14Æ93 0Æ34 14Æ93 1Æ05 12Æ48Mag 18781 0Æ11 30Æ11 0Æ25 30Æ11 0Æ70 12Æ08
CRCL; climbing-ripple cross-lamination.
Climbing ripples deposited by turbidity currents 891
� 2011 The Authors. Journal compilation � 2011 International Association of Sedimentologists, Sedimentology, 59, 867–898
which agree well with supercritical CRs in thepresent study (for example, NZ-N-10 and ZA-6-25). The natural ‘Doheny’ turbidite studied byAllen (1991) had a sedimentation rate (Rbc) of0Æ275 mm sec)1 and a range of 20 to 52 min forthe accumulation time. For the same turbidite,Baas et al. (2000) calculated a CRCL-only sedi-mentation rate (Rbc) of 0Æ27 mm sec)1 and aCRCL accumulation time of 12 min. Baas (2004)used TDURE to perform 167 turbidite simula-tions, the accumulation time of the Tc divisionranging from 0Æ3 to 39 min and CRCL sedimen-tation rates ranging from 0Æ001 to 0Æ3 mm sec)1.Flow durations for natural turbidity currentsrange from several hours for the 1929 GrandBanks current (Heezen & Ewing, 1952) up toseveral days for currents traversing the Amazonsubmarine channel (Pirmez & Imran, 2003). It isimportant to note, however, that the accumula-tion time of a turbidite may not accurately reflectthe total duration of the depositing flow.
THE INFLUENCE OF GRAIN SIZE ON THEFORMATION OF CLIMBING RIPPLES
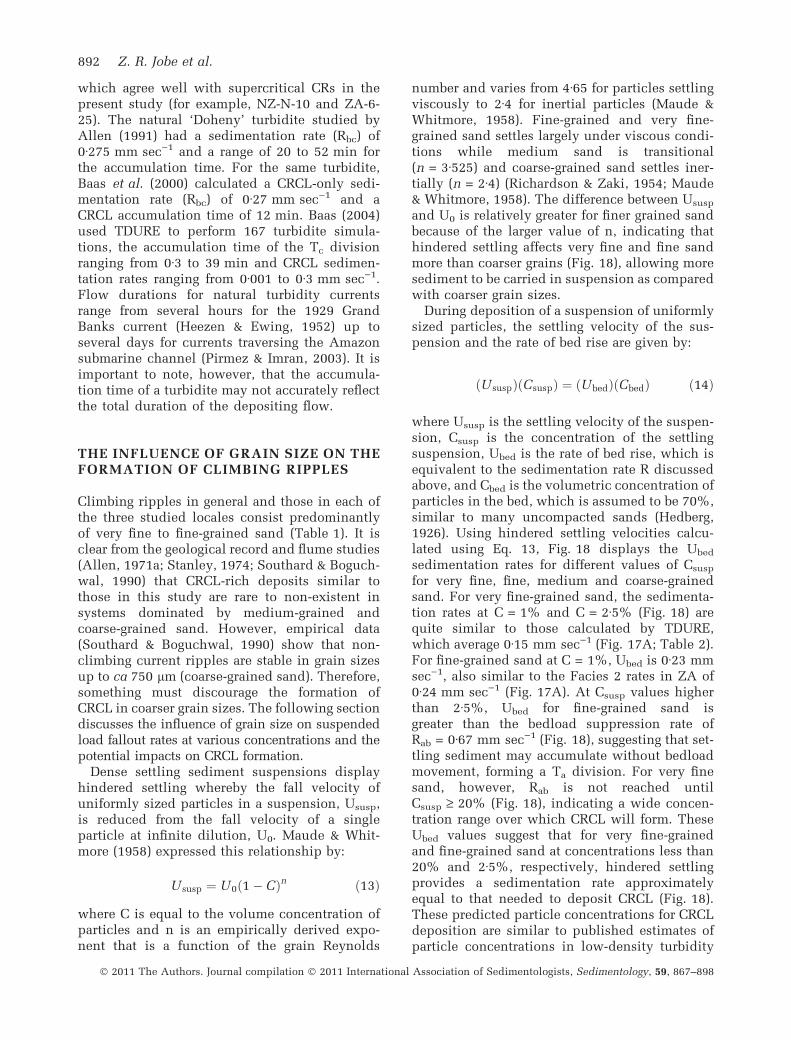
Climbing ripples in general and those in each ofthe three studied locales consist predominantlyof very fine to fine-grained sand (Table 1). It isclear from the geological record and flume studies(Allen, 1971a; Stanley, 1974; Southard & Boguch-wal, 1990) that CRCL-rich deposits similar tothose in this study are rare to non-existent insystems dominated by medium-grained andcoarse-grained sand. However, empirical data(Southard & Boguchwal, 1990) show that non-climbing current ripples are stable in grain sizesup to ca 750 lm (coarse-grained sand). Therefore,something must discourage the formation ofCRCL in coarser grain sizes. The following sectiondiscusses the influence of grain size on suspendedload fallout rates at various concentrations and thepotential impacts on CRCL formation.
Dense settling sediment suspensions displayhindered settling whereby the fall velocity ofuniformly sized particles in a suspension, Ususp,is reduced from the fall velocity of a singleparticle at infinite dilution, U0. Maude & Whit-more (1958) expressed this relationship by:
Ususp ¼ U0ð1� CÞn ð13Þ
where C is equal to the volume concentration ofparticles and n is an empirically derived expo-nent that is a function of the grain Reynolds
number and varies from 4Æ65 for particles settlingviscously to 2Æ4 for inertial particles (Maude &Whitmore, 1958). Fine-grained and very fine-grained sand settles largely under viscous condi-tions while medium sand is transitional(n = 3Æ525) and coarse-grained sand settles iner-tially (n = 2Æ4) (Richardson & Zaki, 1954; Maude& Whitmore, 1958). The difference between Ususp
and U0 is relatively greater for finer grained sandbecause of the larger value of n, indicating thathindered settling affects very fine and fine sandmore than coarser grains (Fig. 18), allowing moresediment to be carried in suspension as comparedwith coarser grain sizes.
During deposition of a suspension of uniformlysized particles, the settling velocity of the sus-pension and the rate of bed rise are given by:
ðUsuspÞðCsuspÞ ¼ ðUbedÞðCbedÞ ð14Þ
where Ususp is the settling velocity of the suspen-sion, Csusp is the concentration of the settlingsuspension, Ubed is the rate of bed rise, which isequivalent to the sedimentation rate R discussedabove, and Cbed is the volumetric concentration ofparticles in the bed, which is assumed to be 70%,similar to many uncompacted sands (Hedberg,1926). Using hindered settling velocities calcu-lated using Eq. 13, Fig. 18 displays the Ubed
sedimentation rates for different values of Csusp
for very fine, fine, medium and coarse-grainedsand. For very fine-grained sand, the sedimenta-tion rates at C = 1% and C = 2Æ5% (Fig. 18) arequite similar to those calculated by TDURE,which average 0Æ15 mm sec)1 (Fig. 17A; Table 2).For fine-grained sand at C = 1%, Ubed is 0Æ23 mmsec)1, also similar to the Facies 2 rates in ZA of0Æ24 mm sec)1 (Fig. 17A). At Csusp values higherthan 2Æ5%, Ubed for fine-grained sand isgreater than the bedload suppression rate ofRab = 0Æ67 mm sec)1 (Fig. 18), suggesting that set-tling sediment may accumulate without bedloadmovement, forming a Ta division. For very finesand, however, Rab is not reached untilCsusp ‡ 20% (Fig. 18), indicating a wide concen-tration range over which CRCL will form. TheseUbed values suggest that for very fine-grainedand fine-grained sand at concentrations less than20% and 2Æ5%, respectively, hindered settlingprovides a sedimentation rate approximatelyequal to that needed to deposit CRCL (Fig. 18).These predicted particle concentrations for CRCLdeposition are similar to published estimates ofparticle concentrations in low-density turbidity
892 Z. R. Jobe et al.
� 2011 The Authors. Journal compilation � 2011 International Association of Sedimentologists, Sedimentology, 59, 867–898
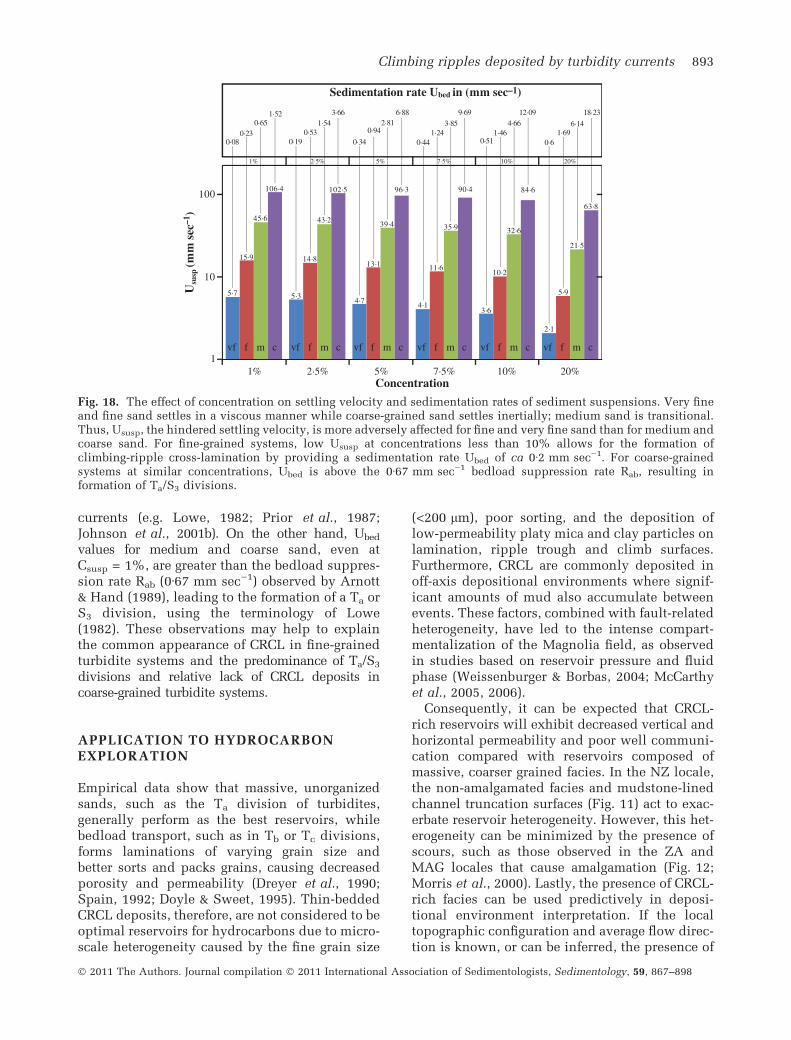
currents (e.g. Lowe, 1982; Prior et al., 1987;Johnson et al., 2001b). On the other hand, Ubed
values for medium and coarse sand, even atCsusp = 1%, are greater than the bedload suppres-sion rate Rab (0Æ67 mm sec)1) observed by Arnott& Hand (1989), leading to the formation of a Ta orS3 division, using the terminology of Lowe(1982). These observations may help to explainthe common appearance of CRCL in fine-grainedturbidite systems and the predominance of Ta/S3
divisions and relative lack of CRCL deposits incoarse-grained turbidite systems.
APPLICATION TO HYDROCARBONEXPLORATION
Empirical data show that massive, unorganizedsands, such as the Ta division of turbidites,generally perform as the best reservoirs, whilebedload transport, such as in Tb or Tc divisions,forms laminations of varying grain size andbetter sorts and packs grains, causing decreasedporosity and permeability (Dreyer et al., 1990;Spain, 1992; Doyle & Sweet, 1995). Thin-beddedCRCL deposits, therefore, are not considered to beoptimal reservoirs for hydrocarbons due to micro-scale heterogeneity caused by the fine grain size
(<200 lm), poor sorting, and the deposition oflow-permeability platy mica and clay particles onlamination, ripple trough and climb surfaces.Furthermore, CRCL are commonly deposited inoff-axis depositional environments where signif-icant amounts of mud also accumulate betweenevents. These factors, combined with fault-relatedheterogeneity, have led to the intense compart-mentalization of the Magnolia field, as observedin studies based on reservoir pressure and fluidphase (Weissenburger & Borbas, 2004; McCarthyet al., 2005, 2006).
Consequently, it can be expected that CRCL-rich reservoirs will exhibit decreased vertical andhorizontal permeability and poor well communi-cation compared with reservoirs composed ofmassive, coarser grained facies. In the NZ locale,the non-amalgamated facies and mudstone-linedchannel truncation surfaces (Fig. 11) act to exac-erbate reservoir heterogeneity. However, this het-erogeneity can be minimized by the presence ofscours, such as those observed in the ZA andMAG locales that cause amalgamation (Fig. 12;Morris et al., 2000). Lastly, the presence of CRCL-rich facies can be used predictively in deposi-tional environment interpretation. If the localtopographic configuration and average flow direc-tion is known, or can be inferred, the presence of
Fig. 18. The effect of concentration on settling velocity and sedimentation rates of sediment suspensions. Very fineand fine sand settles in a viscous manner while coarse-grained sand settles inertially; medium sand is transitional.Thus, Ususp, the hindered settling velocity, is more adversely affected for fine and very fine sand than for medium andcoarse sand. For fine-grained systems, low Ususp at concentrations less than 10% allows for the formation ofclimbing-ripple cross-lamination by providing a sedimentation rate Ubed of ca 0Æ2 mm sec)1. For coarse-grainedsystems at similar concentrations, Ubed is above the 0Æ67 mm sec)1 bedload suppression rate Rab, resulting information of Ta/S3 divisions.
Climbing ripples deposited by turbidity currents 893
� 2011 The Authors. Journal compilation � 2011 International Association of Sedimentologists, Sedimentology, 59, 867–898
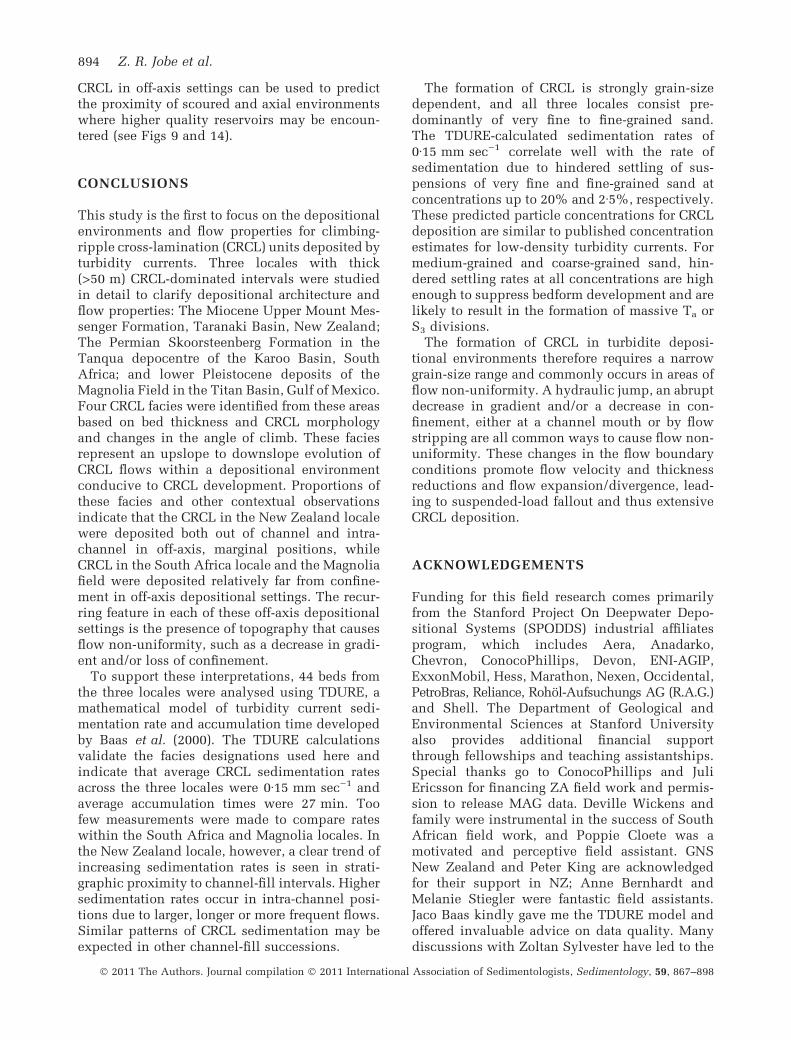
CRCL in off-axis settings can be used to predictthe proximity of scoured and axial environmentswhere higher quality reservoirs may be encoun-tered (see Figs 9 and 14).
CONCLUSIONS
This study is the first to focus on the depositionalenvironments and flow properties for climbing-ripple cross-lamination (CRCL) units deposited byturbidity currents. Three locales with thick(>50 m) CRCL-dominated intervals were studiedin detail to clarify depositional architecture andflow properties: The Miocene Upper Mount Mes-senger Formation, Taranaki Basin, New Zealand;The Permian Skoorsteenberg Formation in theTanqua depocentre of the Karoo Basin, SouthAfrica; and lower Pleistocene deposits of theMagnolia Field in the Titan Basin, Gulf of Mexico.Four CRCL facies were identified from these areasbased on bed thickness and CRCL morphologyand changes in the angle of climb. These faciesrepresent an upslope to downslope evolution ofCRCL flows within a depositional environmentconducive to CRCL development. Proportions ofthese facies and other contextual observationsindicate that the CRCL in the New Zealand localewere deposited both out of channel and intra-channel in off-axis, marginal positions, whileCRCL in the South Africa locale and the Magnoliafield were deposited relatively far from confine-ment in off-axis depositional settings. The recur-ring feature in each of these off-axis depositionalsettings is the presence of topography that causesflow non-uniformity, such as a decrease in gradi-ent and/or loss of confinement.
To support these interpretations, 44 beds fromthe three locales were analysed using TDURE, amathematical model of turbidity current sedi-mentation rate and accumulation time developedby Baas et al. (2000). The TDURE calculationsvalidate the facies designations used here andindicate that average CRCL sedimentation ratesacross the three locales were 0Æ15 mm sec)1 andaverage accumulation times were 27 min. Toofew measurements were made to compare rateswithin the South Africa and Magnolia locales. Inthe New Zealand locale, however, a clear trend ofincreasing sedimentation rates is seen in strati-graphic proximity to channel-fill intervals. Highersedimentation rates occur in intra-channel posi-tions due to larger, longer or more frequent flows.Similar patterns of CRCL sedimentation may beexpected in other channel-fill successions.
The formation of CRCL is strongly grain-sizedependent, and all three locales consist pre-dominantly of very fine to fine-grained sand.The TDURE-calculated sedimentation rates of0Æ15 mm sec)1 correlate well with the rate ofsedimentation due to hindered settling of sus-pensions of very fine and fine-grained sand atconcentrations up to 20% and 2Æ5%, respectively.These predicted particle concentrations for CRCLdeposition are similar to published concentrationestimates for low-density turbidity currents. Formedium-grained and coarse-grained sand, hin-dered settling rates at all concentrations are highenough to suppress bedform development and arelikely to result in the formation of massive Ta orS3 divisions.
The formation of CRCL in turbidite deposi-tional environments therefore requires a narrowgrain-size range and commonly occurs in areas offlow non-uniformity. A hydraulic jump, an abruptdecrease in gradient and/or a decrease in con-finement, either at a channel mouth or by flowstripping are all common ways to cause flow non-uniformity. These changes in the flow boundaryconditions promote flow velocity and thicknessreductions and flow expansion/divergence, lead-ing to suspended-load fallout and thus extensiveCRCL deposition.
ACKNOWLEDGEMENTS
Funding for this field research comes primarilyfrom the Stanford Project On Deepwater Depo-sitional Systems (SPODDS) industrial affiliatesprogram, which includes Aera, Anadarko,Chevron, ConocoPhillips, Devon, ENI-AGIP,ExxonMobil, Hess, Marathon, Nexen, Occidental,PetroBras, Reliance, Rohol-Aufsuchungs AG (R.A.G.)and Shell. The Department of Geological andEnvironmental Sciences at Stanford Universityalso provides additional financial supportthrough fellowships and teaching assistantships.Special thanks go to ConocoPhillips and JuliEricsson for financing ZA field work and permis-sion to release MAG data. Deville Wickens andfamily were instrumental in the success of SouthAfrican field work, and Poppie Cloete was amotivated and perceptive field assistant. GNSNew Zealand and Peter King are acknowledgedfor their support in NZ; Anne Bernhardt andMelanie Stiegler were fantastic field assistants.Jaco Baas kindly gave me the TDURE model andoffered invaluable advice on data quality. Manydiscussions with Zoltan Sylvester have led to the
894 Z. R. Jobe et al.
� 2011 The Authors. Journal compilation � 2011 International Association of Sedimentologists, Sedimentology, 59, 867–898
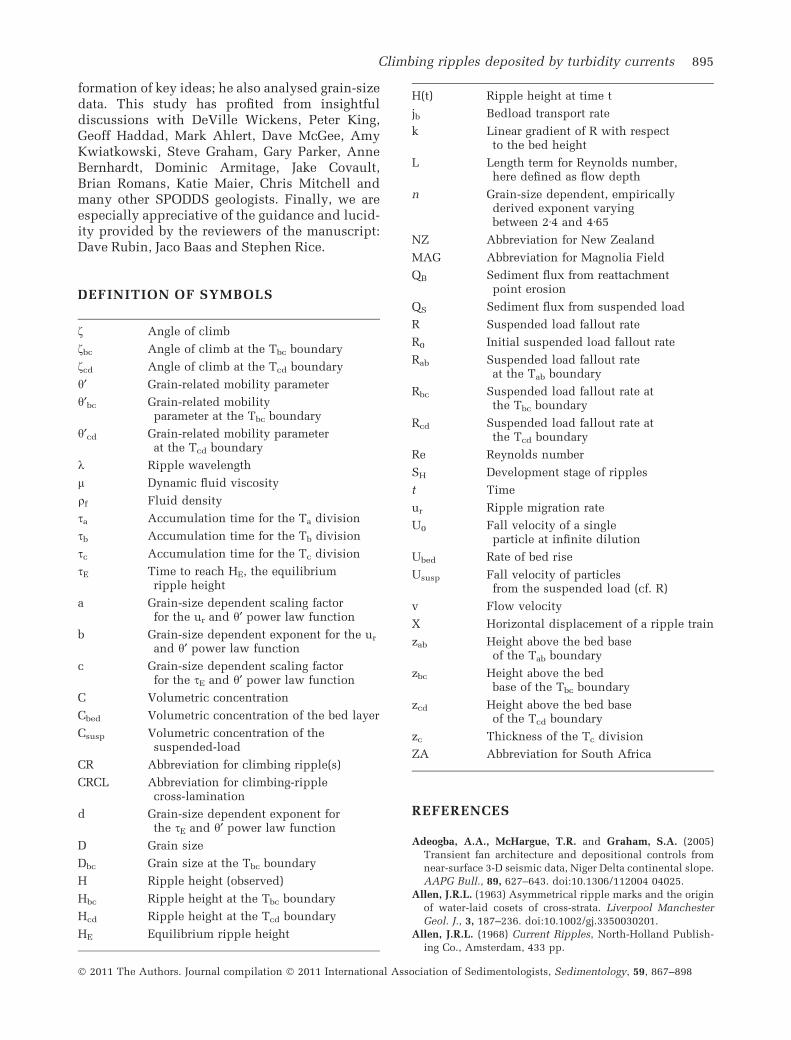
formation of key ideas; he also analysed grain-sizedata. This study has profited from insightfuldiscussions with DeVille Wickens, Peter King,Geoff Haddad, Mark Ahlert, Dave McGee, AmyKwiatkowski, Steve Graham, Gary Parker, AnneBernhardt, Dominic Armitage, Jake Covault,Brian Romans, Katie Maier, Chris Mitchell andmany other SPODDS geologists. Finally, we areespecially appreciative of the guidance and lucid-ity provided by the reviewers of the manuscript:Dave Rubin, Jaco Baas and Stephen Rice.
DEFINITION OF SYMBOLS
f Angle of climb
fbc Angle of climb at the Tbc boundary
fcd Angle of climb at the Tcd boundary
h¢ Grain-related mobility parameter
h¢bc Grain-related mobilityparameter at the Tbc boundary
h¢cd Grain-related mobility parameterat the Tcd boundary
k Ripple wavelength
l Dynamic fluid viscosity
qf Fluid density
sa Accumulation time for the Ta division
sb Accumulation time for the Tb division
sc Accumulation time for the Tc division
sE Time to reach HE, the equilibriumripple height
a Grain-size dependent scaling factorfor the ur and h¢ power law function
b Grain-size dependent exponent for the ur
and h¢ power law function
c Grain-size dependent scaling factorfor the sE and h¢ power law function
C Volumetric concentration
Cbed Volumetric concentration of the bed layer
Csusp Volumetric concentration of thesuspended-load
CR Abbreviation for climbing ripple(s)
CRCL Abbreviation for climbing-ripplecross-lamination
d Grain-size dependent exponent forthe sE and h¢ power law function
D Grain size
Dbc Grain size at the Tbc boundary
H Ripple height (observed)
Hbc Ripple height at the Tbc boundary
Hcd Ripple height at the Tcd boundary
HE Equilibrium ripple height
H(t) Ripple height at time t
jb Bedload transport rate
k Linear gradient of R with respectto the bed height
L Length term for Reynolds number,here defined as flow depth
n Grain-size dependent, empiricallyderived exponent varyingbetween 2Æ4 and 4Æ65
NZ Abbreviation for New Zealand
MAG Abbreviation for Magnolia Field
QB Sediment flux from reattachmentpoint erosion
QS Sediment flux from suspended load
R Suspended load fallout rate
R0 Initial suspended load fallout rate
Rab Suspended load fallout rateat the Tab boundary
Rbc Suspended load fallout rate atthe Tbc boundary
Rcd Suspended load fallout rate atthe Tcd boundary
Re Reynolds number
SH Development stage of ripples
t Time
ur Ripple migration rate
U0 Fall velocity of a singleparticle at infinite dilution
Ubed Rate of bed rise
Ususp Fall velocity of particlesfrom the suspended load (cf. R)
v Flow velocity
X Horizontal displacement of a ripple train
zab Height above the bed baseof the Tab boundary
zbc Height above the bedbase of the Tbc boundary
zcd Height above the bed baseof the Tcd boundary
zc Thickness of the Tc division
ZA Abbreviation for South Africa
REFERENCES
Adeogba, A.A., McHargue, T.R. and Graham, S.A. (2005)
Transient fan architecture and depositional controls from
near-surface 3-D seismic data, Niger Delta continental slope.
AAPG Bull., 89, 627–643. doi:10.1306/112004 04025.
Allen, J.R.L. (1963) Asymmetrical ripple marks and the origin
of water-laid cosets of cross-strata. Liverpool Manchester
Geol. J., 3, 187–236. doi:10.1002/gj.3350030201.
Allen, J.R.L. (1968) Current Ripples, North-Holland Publish-
ing Co., Amsterdam, 433 pp.
Climbing ripples deposited by turbidity currents 895
� 2011 The Authors. Journal compilation � 2011 International Association of Sedimentologists, Sedimentology, 59, 867–898
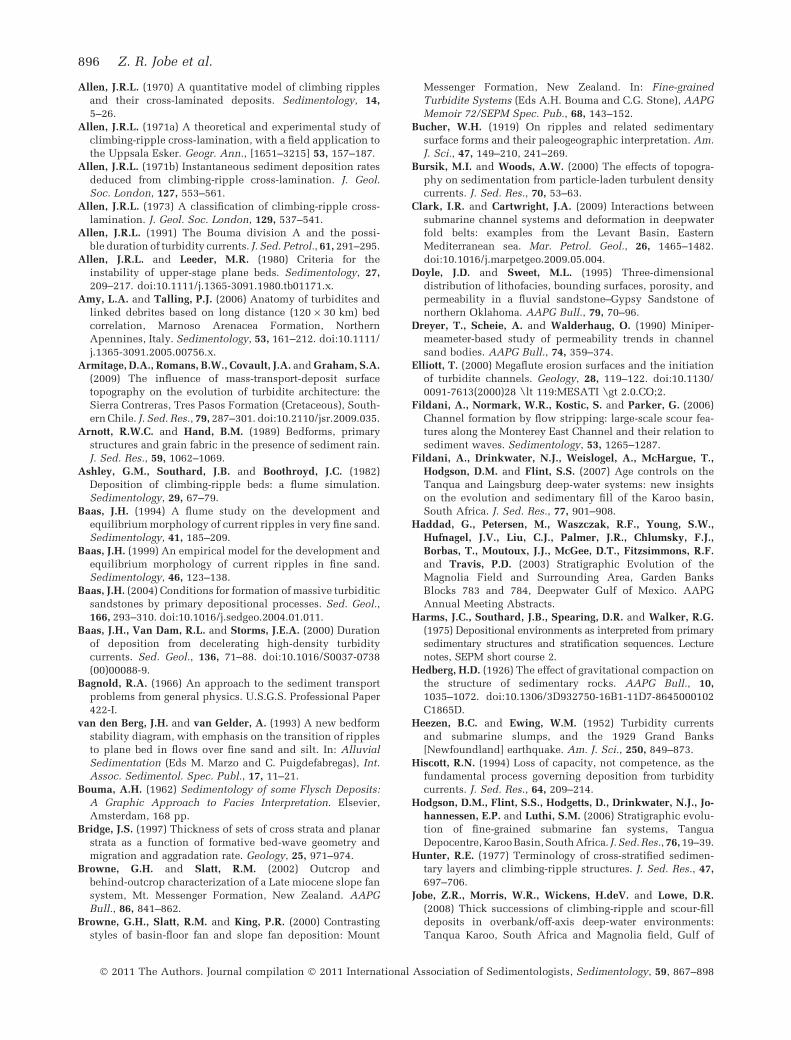
Allen, J.R.L. (1970) A quantitative model of climbing ripples
and their cross-laminated deposits. Sedimentology, 14,5–26.
Allen, J.R.L. (1971a) A theoretical and experimental study of
climbing-ripple cross-lamination, with a field application to
the Uppsala Esker. Geogr. Ann., [1651–3215] 53, 157–187.
Allen, J.R.L. (1971b) Instantaneous sediment deposition rates
deduced from climbing-ripple cross-lamination. J. Geol.Soc. London, 127, 553–561.
Allen, J.R.L. (1973) A classification of climbing-ripple cross-
lamination. J. Geol. Soc. London, 129, 537–541.
Allen, J.R.L. (1991) The Bouma division A and the possi-
ble duration of turbidity currents. J. Sed. Petrol., 61, 291–295.
Allen, J.R.L. and Leeder, M.R. (1980) Criteria for the
instability of upper-stage plane beds. Sedimentology, 27,209–217. doi:10.1111/j.1365-3091.1980.tb01171.x.
Amy, L.A. and Talling, P.J. (2006) Anatomy of turbidites and
linked debrites based on long distance (120 · 30 km) bed
correlation, Marnoso Arenacea Formation, Northern
Apennines, Italy. Sedimentology, 53, 161–212. doi:10.1111/
j.1365-3091.2005.00756.x.
Armitage, D.A., Romans, B.W., Covault, J.A. and Graham, S.A.(2009) The influence of mass-transport-deposit surface
topography on the evolution of turbidite architecture: the
Sierra Contreras, Tres Pasos Formation (Cretaceous), South-
ern Chile. J. Sed. Res., 79, 287–301. doi:10.2110/jsr.2009.035.
Arnott, R.W.C. and Hand, B.M. (1989) Bedforms, primary
structures and grain fabric in the presence of sediment rain.
J. Sed. Res., 59, 1062–1069.
Ashley, G.M., Southard, J.B. and Boothroyd, J.C. (1982)
Deposition of climbing-ripple beds: a flume simulation.
Sedimentology, 29, 67–79.
Baas, J.H. (1994) A flume study on the development and
equilibrium morphology of current ripples in very fine sand.
Sedimentology, 41, 185–209.
Baas, J.H. (1999) An empirical model for the development and
equilibrium morphology of current ripples in fine sand.
Sedimentology, 46, 123–138.
Baas, J.H. (2004) Conditions for formation of massive turbiditic
sandstones by primary depositional processes. Sed. Geol.,
166, 293–310. doi:10.1016/j.sedgeo.2004.01.011.
Baas, J.H., Van Dam, R.L. and Storms, J.E.A. (2000) Duration
of deposition from decelerating high-density turbidity
currents. Sed. Geol., 136, 71–88. doi:10.1016/S0037-0738
(00)00088-9.
Bagnold, R.A. (1966) An approach to the sediment transport
problems from general physics. U.S.G.S. Professional Paper
422-I.
van den Berg, J.H. and van Gelder, A. (1993) A new bedform
stability diagram, with emphasis on the transition of ripples
to plane bed in flows over fine sand and silt. In: Alluvial
Sedimentation (Eds M. Marzo and C. Puigdefabregas), Int.Assoc. Sedimentol. Spec. Publ., 17, 11–21.
Bouma, A.H. (1962) Sedimentology of some Flysch Deposits:
A Graphic Approach to Facies Interpretation. Elsevier,
Amsterdam, 168 pp.
Bridge, J.S. (1997) Thickness of sets of cross strata and planar
strata as a function of formative bed-wave geometry and
migration and aggradation rate. Geology, 25, 971–974.
Browne, G.H. and Slatt, R.M. (2002) Outcrop and
behind-outcrop characterization of a Late miocene slope fan
system, Mt. Messenger Formation, New Zealand. AAPG
Bull., 86, 841–862.
Browne, G.H., Slatt, R.M. and King, P.R. (2000) Contrasting
styles of basin-floor fan and slope fan deposition: Mount
Messenger Formation, New Zealand. In: Fine-grained
Turbidite Systems (Eds A.H. Bouma and C.G. Stone), AAPG
Memoir 72/SEPM Spec. Pub., 68, 143–152.
Bucher, W.H. (1919) On ripples and related sedimentary
surface forms and their paleogeographic interpretation. Am.
J. Sci., 47, 149–210, 241–269.
Bursik, M.I. and Woods, A.W. (2000) The effects of topogra-
phy on sedimentation from particle-laden turbulent density
currents. J. Sed. Res., 70, 53–63.
Clark, I.R. and Cartwright, J.A. (2009) Interactions between
submarine channel systems and deformation in deepwater
fold belts: examples from the Levant Basin, Eastern
Mediterranean sea. Mar. Petrol. Geol., 26, 1465–1482.
doi:10.1016/j.marpetgeo.2009.05.004.
Doyle, J.D. and Sweet, M.L. (1995) Three-dimensional
distribution of lithofacies, bounding surfaces, porosity, and
permeability in a fluvial sandstone–Gypsy Sandstone of
northern Oklahoma. AAPG Bull., 79, 70–96.
Dreyer, T., Scheie, A. and Walderhaug, O. (1990) Miniper-
meameter-based study of permeability trends in channel
sand bodies. AAPG Bull., 74, 359–374.
Elliott, T. (2000) Megaflute erosion surfaces and the initiation
of turbidite channels. Geology, 28, 119–122. doi:10.1130/
0091-7613(2000)28 \lt 119:MESATI \gt 2.0.CO;2.
Fildani, A., Normark, W.R., Kostic, S. and Parker, G. (2006)
Channel formation by flow stripping: large-scale scour fea-
tures along the Monterey East Channel and their relation to
sediment waves. Sedimentology, 53, 1265–1287.
Fildani, A., Drinkwater, N.J., Weislogel, A., McHargue, T.,Hodgson, D.M. and Flint, S.S. (2007) Age controls on the
Tanqua and Laingsburg deep-water systems: new insights
on the evolution and sedimentary fill of the Karoo basin,
South Africa. J. Sed. Res., 77, 901–908.
Haddad, G., Petersen, M., Waszczak, R.F., Young, S.W.,Hufnagel, J.V., Liu, C.J., Palmer, J.R., Chlumsky, F.J.,Borbas, T., Moutoux, J.J., McGee, D.T., Fitzsimmons, R.F.and Travis, P.D. (2003) Stratigraphic Evolution of the
Magnolia Field and Surrounding Area, Garden Banks
Blocks 783 and 784, Deepwater Gulf of Mexico. AAPG
Annual Meeting Abstracts.
Harms, J.C., Southard, J.B., Spearing, D.R. and Walker, R.G.(1975) Depositional environments as interpreted from primary
sedimentary structures and stratification sequences. Lecture
notes, SEPM short course 2.
Hedberg, H.D. (1926) The effect of gravitational compaction on
the structure of sedimentary rocks. AAPG Bull., 10,1035–1072. doi:10.1306/3D932750-16B1-11D7-8645000102
C1865D.
Heezen, B.C. and Ewing, W.M. (1952) Turbidity currents
and submarine slumps, and the 1929 Grand Banks
[Newfoundland] earthquake. Am. J. Sci., 250, 849–873.
Hiscott, R.N. (1994) Loss of capacity, not competence, as the
fundamental process governing deposition from turbidity
currents. J. Sed. Res., 64, 209–214.
Hodgson, D.M., Flint, S.S., Hodgetts, D., Drinkwater, N.J., Jo-hannessen, E.P. and Luthi, S.M. (2006) Stratigraphic evolu-
tion of fine-grained submarine fan systems, Tangua
Depocentre, KarooBasin,South Africa. J. Sed.Res., 76, 19–39.
Hunter, R.E. (1977) Terminology of cross-stratified sedimen-
tary layers and climbing-ripple structures. J. Sed. Res., 47,697–706.
Jobe, Z.R., Morris, W.R., Wickens, H.deV. and Lowe, D.R.(2008) Thick successions of climbing-ripple and scour-fill
deposits in overbank/off-axis deep-water environments:
Tanqua Karoo, South Africa and Magnolia field, Gulf of
896 Z. R. Jobe et al.
� 2011 The Authors. Journal compilation � 2011 International Association of Sedimentologists, Sedimentology, 59, 867–898

Mexico. AAPG Technical Program, Annual Convention, San
Antonio.
Jobe, Z.R., Bernhardt, A. and Lowe, D.R. (2010) Facies and
architectural asymmetry in a conglomerate-rich submarine
channel fill, Cerro Toro Formation, Sierra del Toro,
Magallanes Basin, Chile. J. Sed. Res., 80, 1085–1108.
doi:10.2110/jsr.2010.092.
Johnson, S.J., Flint, S.S., Hinds, D. and Wickens, H.deV.(2001a) Anatomy, geometry and sequence stratigraphy of
basin floor to slope turbidite systems, Tanqua Karoo, South
Africa. Sedimentology, 48, 987–1023.
Johnson, K.S., Paull, C.K., Barry, J.P. and Chavez, F.P. (2001b)
A decadal record of underflows from a coastal river into the
deep sea. Geology, 29, 1019–1022. doi:10.1130/0091-7613
(2001)029 \lt 1019:ADROUF \gt 2.0.CO;2.
Jopling, A.V. and Walker, R.G. (1968) Morphology and origin
of ripple-drift cross-lamination, with examples from the
Pleistocene of Massachusetts. J. Sed. Res., 38, 971–984.
Kane, I.A., McCaffrey, W.D. and Martinsen, O.J. (2009)
Allogenic vs. autogenic controls on megaflute formation.
J. Sed. Res., 79, 643–651. doi: 10.2110/jsr.2009.072.
Kane, I.A., McGee, D.T. and Jobe, Z.R. (in press) Active salt
controls on submarine channel evolution, and implications
for facies architecture: Magnolia Field, Gulf of Mexico. Geol.
Soc. London Spec. Pub.: Salt Tectonics, Sediments and
Prospectivity.
King, P.R. (2000) Tectonic reconstruction of New Zealand:
40 Ma to present. N. Z. J. Geol. Geophys., 43, 611–638.
King, P.R. and Thrasher, G.P. (1992) Post-eocene development
of the Taranaki Basin, New Zealand, convergent overprint
of a passive margin. In: Geology and Geophysics of
Continental Margins (Eds J.S. Watkins, F. Zhiqiang and K.J.
McMillen), AAPG Memoir, 53, 93–118.
King, P.R. and Thrasher, G.P. (1996) Cretaceous–Cenozoic
geology and petroleum systems of the Taranaki Basin, New
Zealand. Inst. Geol. Nucl. Sci. Monograph, 13, 243 p.
King, P.R., Scott, G.H. and Robinson, P.H. (1993) Description,
correlation and depositional history of Miocene sediments
outcropping along the North Taranaki coast. Inst. Geol.
Nucl. Sci. Monograph, 5, 145 p.
King, P.R., Browne, G.H. and Slatt, R.M. (1994) Sequence
architecture of exposed late Miocene basin floor fan and
channel-levee complexes (Mount Messenger Formation),
Taranaki Basin, New Zealand. In: Submarine Fans and
Turbidite Systems (Eds P. Weimer, A.H. Bouma and B.F.
Perkins), Gulf Coast Section SEPM 15th Annual Research
Conference, pp. 177–192. Gulf Coast Section SEPM, Hous-
ton, TX.
Kneller, B. (1995) Beyond the turbidite paradigm: physical
models for deposition of turbidites and their implications
for reservoir prediction. Geol. Soc. London Spec. Pub., 94,31–49.
Kuenen, Ph.H. (1953) Significant features of graded bedding.
Ass. Petrol. Geol. Bull., 37, 1044–1066.
Kuenen, Ph.H. (1967) Emplacement of flysch-type sand beds.
Sedimentology, 9, 203–243. doi:10.1111/j.1365-3091.1967.
tb02039.x.
Lamb, M.P., Toniolo, H. and Parker, G. (2006) Trapping of
sustained turbidity currents by intraslope minibasins.
Sedimentology, 53, 147–160.
Leeder, M. (1999) Sedimentology and Sedimentary Basins:
From Turbulence to Tectonics. Blackwell Scientific
Publications, Oxford, UK, 592 pp.
Lowe, D.R. (1982) Sediment gravity flows: II. Depositional
models with special reference to the deposits of high-
density turbidity currents. J. Sed. Petrol., 52, 279–297.
doi:10.1306/212F7F31-2B24-11D7-8648000102C1865D.
Luthi, S.M., Hodgson, D.M., Geel, C.R., Flint, S.S., Goedbloed,J.W., Drinkwater, N.J. and Johannessen, E.P. (2006) Con-
tribution of research borehole data to modelling fine-grained
turbidite reservoir analogues, Permian Tanqua–Karoo basin-
floor fans (South Africa). Petrol. Geosci., 12, 175–190.
doi:10.1144/1354-079305-693.
Maier, K.L., Fildani, A., Paull, C.K., Graham, S.A., McHargue,T., Graham, S.A., Caress, D.W. and McGann, M.M. (2011)
The elusive character of discontinuous deep-water chan-
nels: New insights from Lucia Chica channel system, off-
shore California. Geology, 39, 327–330.
Maude, A.D. and Whitmore, R.J. (1958) A generalized theory
of sedimentation. Brit. J. Appl. Phys., 9, 477–482. doi:10.1088/
0508-3443/9/12/304.
McCarthy, P., Brand, J., Paradiso, B., Ezekwe, J., Wiltgen, N.,Bridge, A., Willingham, R. and Bogaards, M. (2005)
Using geostatistical inversion of seismic and borehole data
to generate reservoir models for flow simulations of Mag-
nolia Field, deepwater Gulf of Mexico. SEG Exp. Abs., 24,1351.
McCarthy, P., Brand, J., Paradiso, B., Ezekwe, J., Wiltgen, N.,Bridge, A., Willingham, R. and Bogaards, M. (2006) Using
geostatistical inversion of seismic and borehole data to
generate reservoir models for flow simulations of Magnolia
Field, deepwater Gulf of Mexico. Sixth International
Conference and Exposition on Petroleum Geophysics,
Kolkata, India, pp. 573–576.
McGee, D.T., Fitzsimmons, R.F. and Haddad, G.A. (2003)
From fill to spill: partially confined depositional systems,
Magnolia Field, Garden Banks, Gulf of Mexico. AAPG
Annual Meeting Abstracts.
McKee, E.D. (1966) Significance of climbing-ripple structure.
U.S.G.S. Prof. Paper 550-D, D94-D103.
Morris, W.R., Scheihing, M.H., Wickens, D.V. and Bouma,A.H. (2000) Reservoir architecture of deep-water sandstones
from the Skoorsteenberg Formation, Tanqua Karoo Sub-
Basin, South Africa. In: Deep-Water Reservoirs of the World
(Eds P. Weimer, R.M. Slatt, J. Coleman, N.C. Rosen,
H. Nelson, A.H. Bouma, M.J. Styzen and D.T. Lawrence),
Gulf Coast Section, SEPM 20th Annual Research Confer-
ence, pp. 629–649. Published by Gulf Coast Section SEPM,
Houston, TX.
Mutti, E. (1977) Distinctive thin-bedded turbidite facies and
related depositional environments in the Eocene Hecho
Group (South-central Pyrenees, Spain). Sedimentology, 24,107–131.
Mutti, E. and Normark, W.R. (1987) Comparing examples of
modern and ancient turbidite systems: problems and
concepts. In: Marine Clastic Sedimentology: Concepts and
Case Studies (Eds J.K. Leggett and G.G. Zuffa), pp. 1–38.
Graham and Trotman, London.
Normark, W.R., Piper, D.J.W. and Hess, G.R. (1979) Distrib-
utary channels, sand lobes, and mesotopography of Navy
Submarine Fan, California Borderland, with applications
to ancient fan sediments. Sedimentology, 26, 749–774. doi:
10.1111/j.1365-3091.1979.tb00971.x.
Piper, D.J.W. and Normark, W.R. (1983) Turbidite
depositional patterns and flow characteristics, Navy
submarine fan, California borderland. Sedimentology, 30,681–694.
Pirmez, C. and Imran, J. (2003) Reconstruction of turbidity
currents in Amazon Channel. Mar. Petrol. Geol., 20, 823–
849. doi:10.1016/j.marpetgeo.2003.03.005.
Climbing ripples deposited by turbidity currents 897
� 2011 The Authors. Journal compilation � 2011 International Association of Sedimentologists, Sedimentology, 59, 867–898
Prather, B.E., Booth, J.R., Steffens, G.S. and Craig, P.A. (1998)
Classification, lithologic calibration, and stratigraphic suc-
cession of seismic facies of intraslope basins, deep-water
Gulf of Mexico. AAPG Bull., 82, 701–728.
Prelat, A., Hodgson, D.M. and Flint, S.S. (2009) Evolution,
architecture and hierarchy of distributary deep-water
deposits: a high-resolution outcrop investigation from the
Permian Karoo Basin, South Africa. Sedimentology, 56,2132–2154. doi:10.1111/j.1365-3091.2009.01073.x.
Prior, D.B., Bornhold, B.D., Wiseman Jr, W.J. and Lowe, D.R.(1987) Turbidity current activity in a British Columbia fjord.
Science,237,1330–1333.doi:10.1126/science.237.4820.1330.
Pyles, D.R. (2008) Multiscale stratigraphic analysis of a
structurally confined submarine fan: Carboniferous Ross
Sandstone, Ireland. AAPG Bull., 92, 557–587. doi:10.1306/
01110807042.
Raudkivi, A.J. (1963) A study of sediment ripple formation.
J. Hydraulic Eng. ASCE, 89, 15–33.
Reineck, H.E. (1961) Sedimentbewegungen an Kleinrippeln
im Watt. Senckenb. Lethaea, 42, 51–67.
Reynolds, O. (1883) An experimental investigation of the
circumstances which determine whether the motion of
water shall be direct or sinuous, and of the law of resistance
in parallel channels. Philos. Trans. R. Soc., 174, 935–982.
doi:10.1098/rstl.1883.0029.
Richardson, J.F. and Zaki, W.N. (1954) Sedimentation and
fluidisation: part 1. Trans. Inst. Chem. Eng., 32, 35–53.
Rubin, D.M. and Hunter, R.E. (1982) Bedform climbing in
theory and nature. Sedimentology, 29, 121–138.
Sorby, H.C. (1852) On the oscillation of the currents drifting the
sandstone beds of the southeast of Northumberland, and on
the general direction in the coalfield in the neighbourhood of
Edinburgh. Proc. Yorkshire Geol. Soc., 3, 112–122.
Sorby, H.C. (1859) On the structures produced by the currents
present during the deposition of stratified rocks. Geologist,
2, 137–147.
Southard, J.B. and Boguchwal, L.A. (1990) Bed configurations
in steady unidirectional water flows, part 2: Synthesis of
flume data. J. Sed. Res., 60, 658–679.
Spain, D.R. (1992) Petrophysical evaluation of a slope
fan/basin-floor fan complex: Cherry Canyon Formation, Ward
County, Texas. Ass. Petrol. Geol. Bull., 76, 805–827.
Stanley, K.O. (1974) Morphology and hydraulic significance of
climbing ripples with superimposed micro-ripple-drift
cross-lamination in lower Quaternary Lake Silts, Nebraska.
J. Sed. Res., 44, 472–483.
Sumner, E.J., Amy, L.A. and Talling, P.J. (2008) Deposit
structure and processes of sand deposition from decele-
rating sediment suspensions. J. Sed. Res., 78, 529–547.
doi:10.2110/jsr.2008.062.
Tanner, W.F. (1967) Ripple mark indices and their uses.
Sedimentology, 9, 89–104. doi:10.1111/j.1365-3091.1967.
tb01332.x.
Walker, R.L. (1963) Distinctive types of ripple-drift cross-
lamination. Sedimentology, 2, 173–188.
Walker, R.G. (1965) The origin and significance of the internal
sedimentary structures of turbidites. Proc. Yorkshire Geol.
Soc., 35, 1–32.
Walker, R.L. (1967) Turbidite sedimentary structures and
their relationship to proximal and distal depositional
environments. J. Sed. Petrol., 37, 25–43.
Walker, R.G. (1969) Geometrical analysis of ripple-drift cross-
lamination. Can. J. Earth Sci., 6, 383–391.
Weissenburger, K.S. and Borbas, T. (2004) Fluid properties,
phase and compartmentalization: Magnolia Field case
study, Deepwater Gulf of Mexico, USA. Geol. Soc. London,Spec. Pub., 237, 231–255. doi:10.1144/GSL.SP.2004.237.
01.14.
van der Werff, W. and Johnson, S. (2003) High resolution
stratigraphic analysis of a turbidite system, Tanqua Karoo
Basin, South Africa. Mar. Petrol. Geol., 20, 45–69.
Wickens, H.deV. (1994) Basin floor fan building turbidites of
the southwestern Karoo Basin, Permian Ecca Group, South
Africa. Unpublished Ph.D. thesis, University of Port
Elizabeth, South Africa, 233 pp.
Wickens, H.deV. and Bouma, A.H. (2000) The Tanqua fan
complex, Karoo basin, South Africa: outcrop analog for
fine-grained, deepwater deposits. In: Fine-Grained Turbidite
Systems (Eds A.H. Bouma and J. Stone), AAPG Memoir, 72,153–164.
Wynn, R.B., Kenyon, N.H., Masson, D.G., Stow, D.A.V. and
Weaver, P.P.E. (2002) Characterization and recognition of
deep-water channel-lobe transition zones. AAPG Bull., 86,1441–1462.
Manuscript received 14 May 2010; revisionaccepted 12 July 2011
898 Z. R. Jobe et al.
� 2011 The Authors. Journal compilation � 2011 International Association of Sedimentologists, Sedimentology, 59, 867–898