Embed Size (px)
Citation preview

Clinical decisions in the optimization Clinical decisions in the optimization process process
II. Emphasis on the avoidance of II. Emphasis on the avoidance of normal tissue complicationsnormal tissue complications
Avi EisbruchAvi Eisbruch
University of MichiganUniversity of Michigan
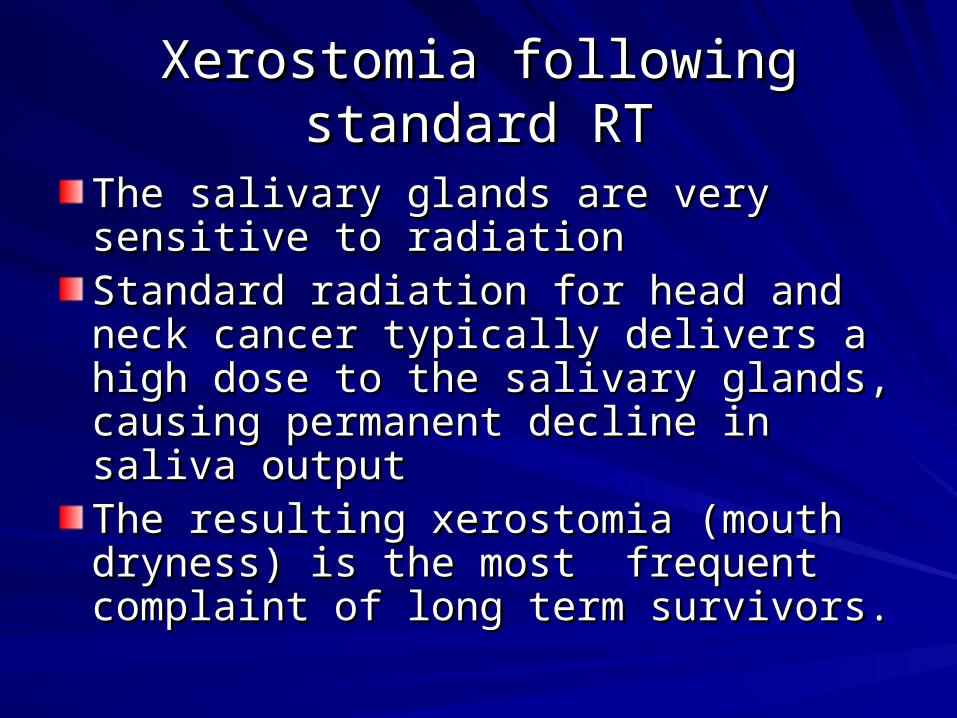
Xerostomia following standard RTXerostomia following standard RT
The salivary glands are very sensitive to The salivary glands are very sensitive to radiationradiationStandard radiation for head and neck Standard radiation for head and neck cancer typically delivers a high dose to the cancer typically delivers a high dose to the salivary glands, causing permanent salivary glands, causing permanent decline in saliva outputdecline in saliva outputThe resulting xerostomia (mouth dryness) The resulting xerostomia (mouth dryness) is the most frequent complaint of long is the most frequent complaint of long term survivors.term survivors.

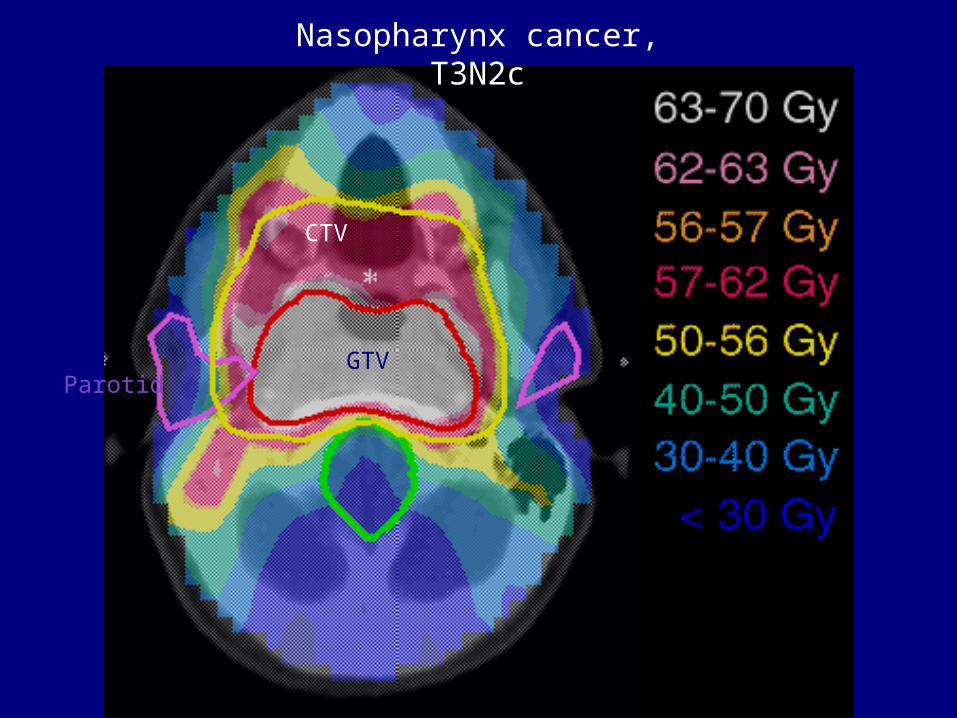
Nasopharynx cancer, T3N2c
GTV
CTV
Parotid
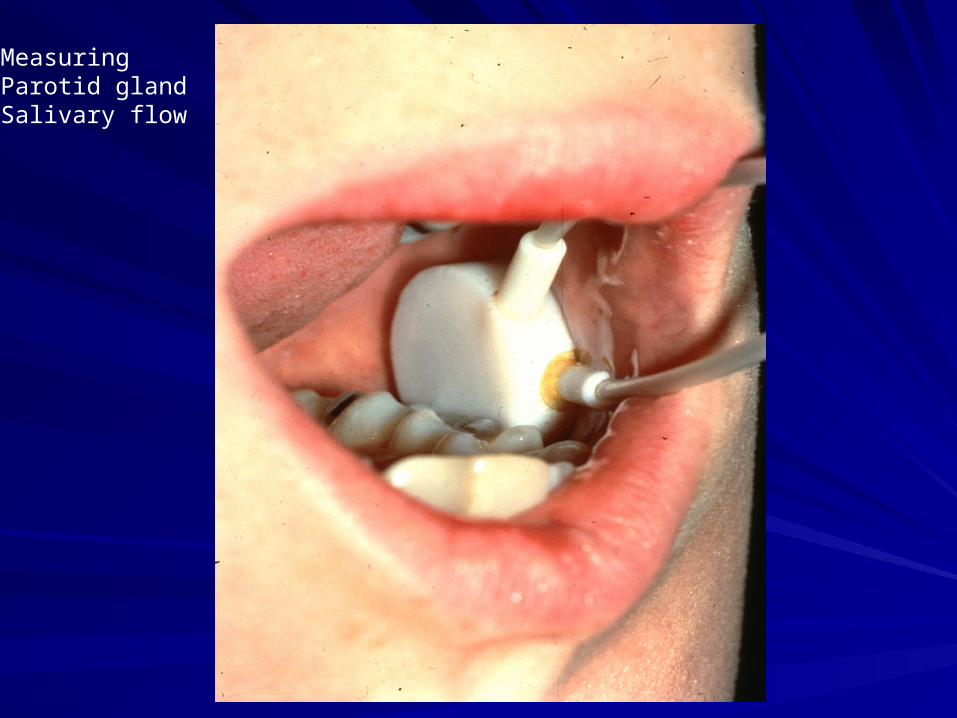
MeasuringParotid glandSalivary flow
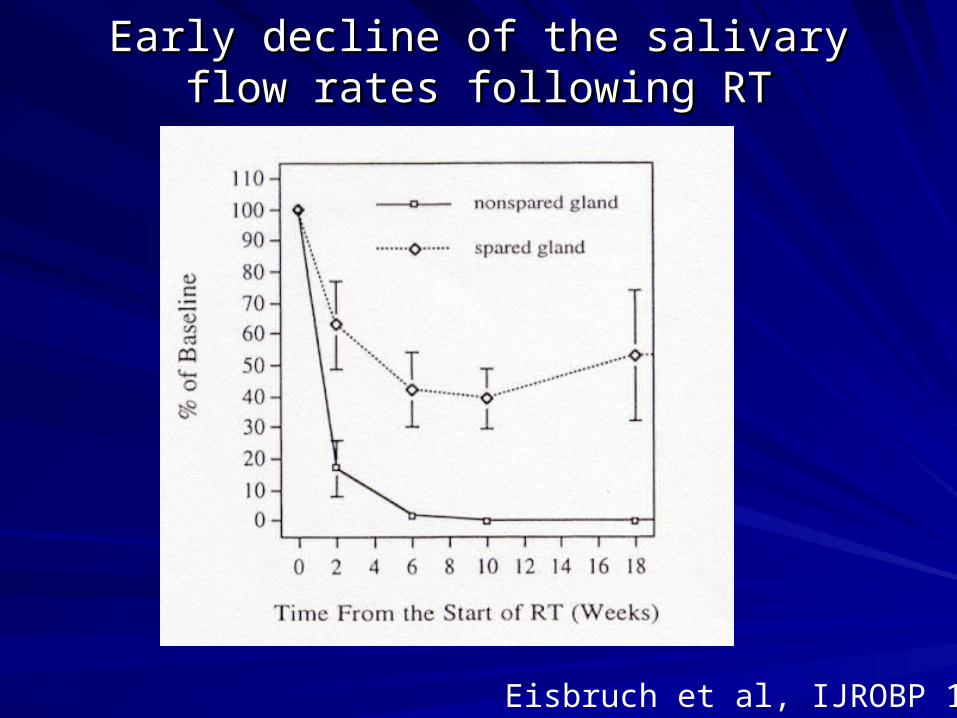
Early decline of the salivary flow rates Early decline of the salivary flow rates following RTfollowing RT
Eisbruch et al, IJROBP 1996
0
20
40
60
80
100
0 20 40 60 80 100
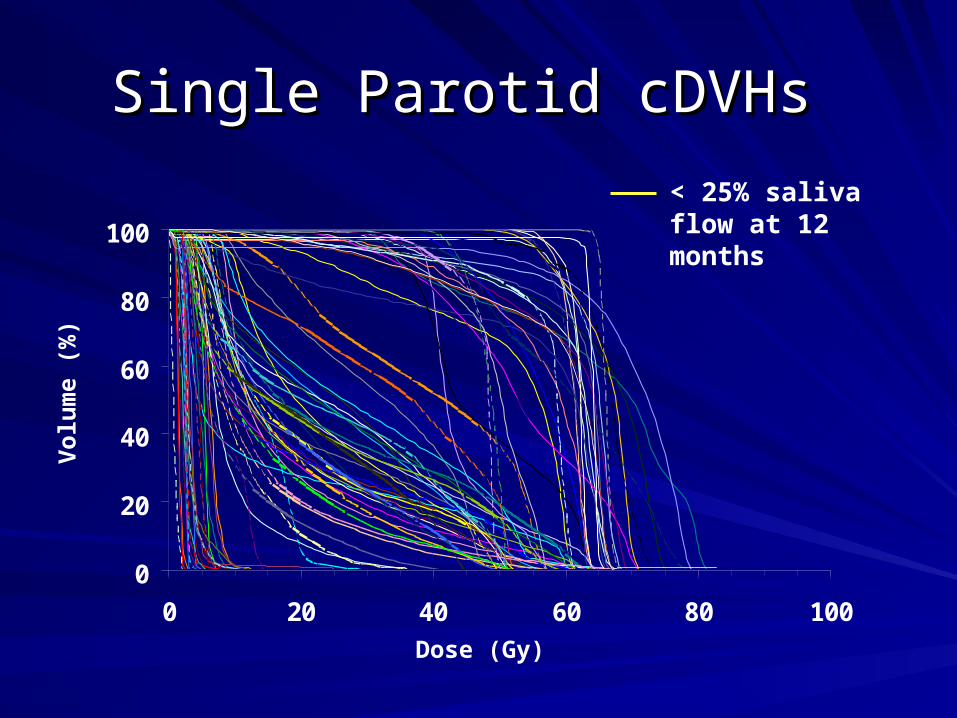
Single Parotid cDVHs Single Parotid cDVHs V
olu
me
(%)
< 25% saliva flow at 12 months
Dose (Gy)
0.0
0.1
0.2
0.3
0.4
0.5
0.6
0.7
0.8
0.9
1.0
Pre-RT 1 3 6 12 18 24
Time after RT (months)
Saliv
ary
flow
(ml/m
in)
Saliv
ary
flow
(ml/m
in)
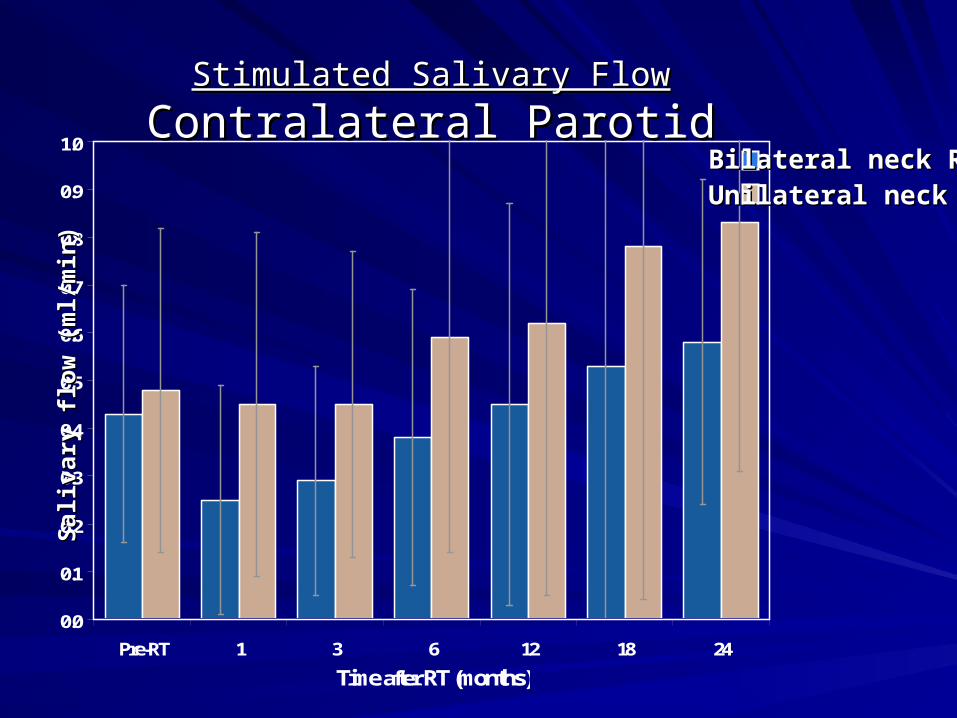
Stimulated Salivary FlowStimulated Salivary Flow
Contralateral ParotidContralateral ParotidStimulated Salivary FlowStimulated Salivary Flow
Contralateral ParotidContralateral ParotidBilateral neck RTBilateral neck RTUnilateral neck RTUnilateral neck RT
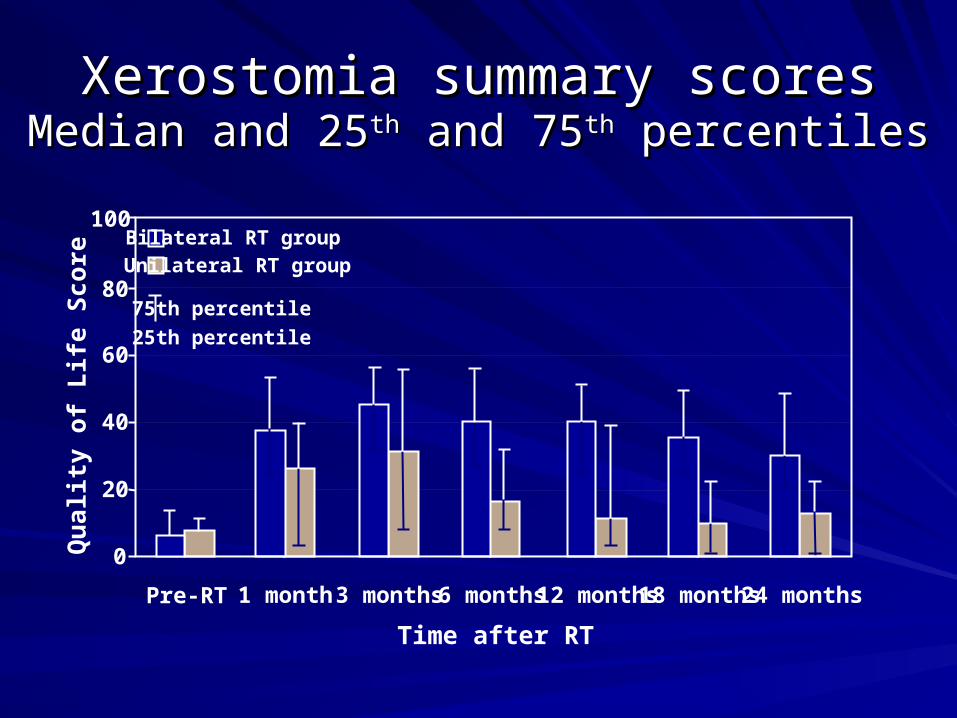
Xerostomia summary scoresXerostomia summary scoresMedian and 25Median and 25thth and 75 and 75thth percentiles percentiles
0
20
40
60
80
Pre-RT 1 month 3 months 6 months 12 months 18 months 24 months
Qua
lity
of L
ife S
core
Unilateral RT groupBilateral RT group
Time after RT
100
75th percentile
25th percentile
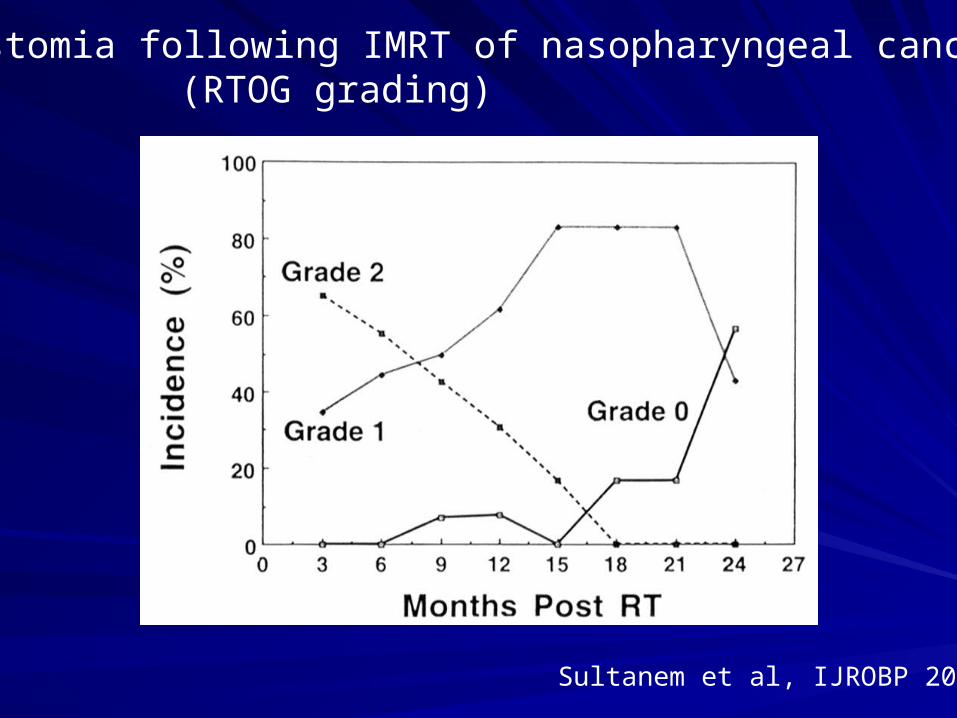
Xerostomia following IMRT of nasopharyngeal cancer (RTOG grading)
Sultanem et al, IJROBP 2000

QOLQOL
Each of the four domains of the QOL Each of the four domains of the QOL instrument (Eating, Communication, Pain, instrument (Eating, Communication, Pain, Emotion) was correlated with the Emotion) was correlated with the mild/moderate xerostomia following IMRT.mild/moderate xerostomia following IMRT.
These correlations suggests that the These correlations suggests that the efforts to reduce xerostomia through IMRT efforts to reduce xerostomia through IMRT may improve general QOL.may improve general QOL.
All is well in the xerostomia frontAll is well in the xerostomia front(once IMRT is employed)(once IMRT is employed)
Is it?Is it?

All is well in the xerostomia frontAll is well in the xerostomia front(once IMRT is employed)(once IMRT is employed)
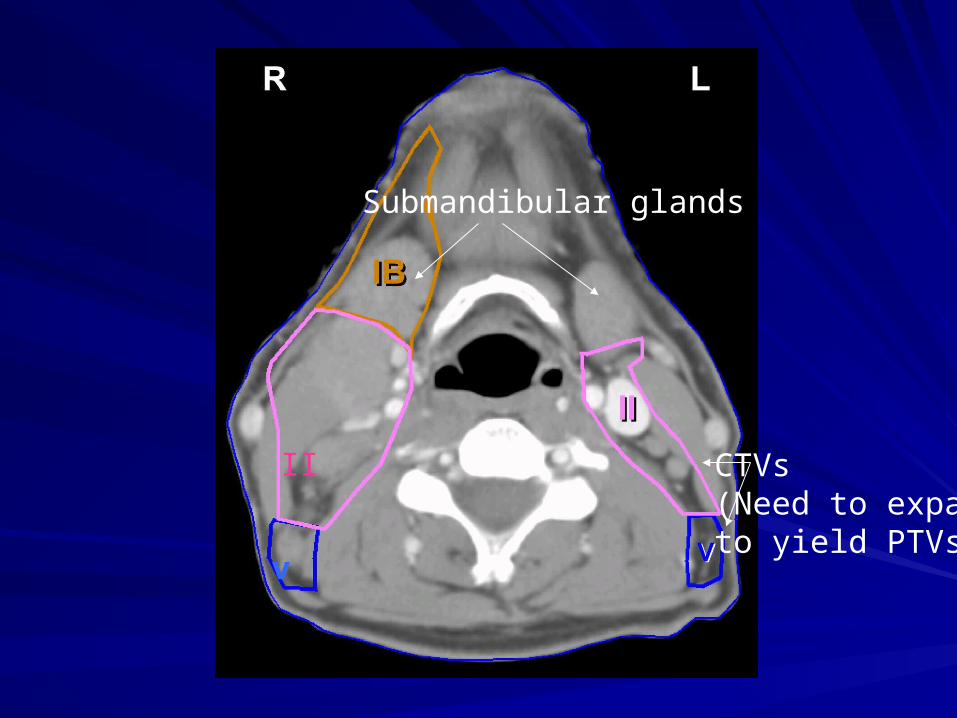
Problem No. 1: we cannot spare the Problem No. 1: we cannot spare the submandibular salivary glands when submandibular salivary glands when treating the neck bilaterally.treating the neck bilaterally.
v
II
Submandibular glands
CTVs(Need to expand to yield PTVs)
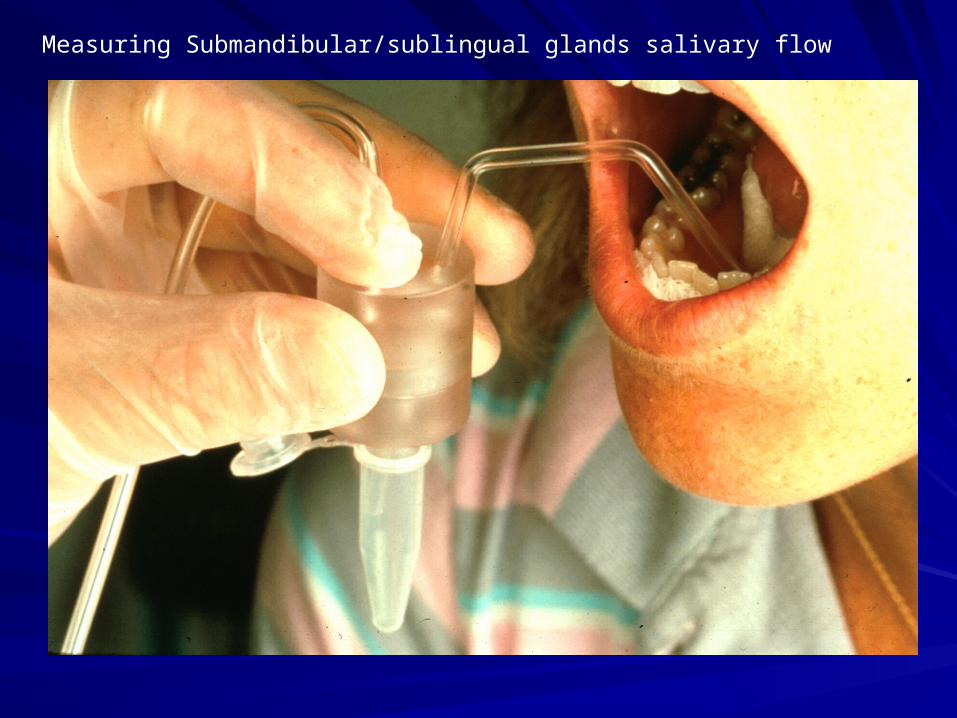
Measuring Submandibular/sublingual glands salivary flow

Saliv
ary
flow
(ml/m
in)
Saliv
ary
flow
(ml/m
in)
0.00
0.05
0.10
0.15
0.20
0.25
0.30
0.35
0.40
0.45
0.50
Pre-RT 1 3 6 12 18 24
Time after RT (months)
Stimulated Salivary FlowStimulated Salivary Flow
Submandibular GlandSubmandibular GlandStimulated Salivary FlowStimulated Salivary Flow
Submandibular GlandSubmandibular GlandBilateral neck RTBilateral neck RTUnilateral neck RTUnilateral neck RT

Limits in controlling dose Limits in controlling dose distributionsdistributions
Would proton modulated RT improve this Would proton modulated RT improve this aspect?aspect?– Protons have a dosimetric advantage over Protons have a dosimetric advantage over
photons: It is possible to determine the depth photons: It is possible to determine the depth of the energy delivered in tissue of the energy delivered in tissue
All is well in the xerostomia frontAll is well in the xerostomia frontonce IMRT is employed.once IMRT is employed.
Problem No. 2: Weak correlation Problem No. 2: Weak correlation between the amount of saliva spared between the amount of saliva spared and patients’ subjective symptoms.and patients’ subjective symptoms.
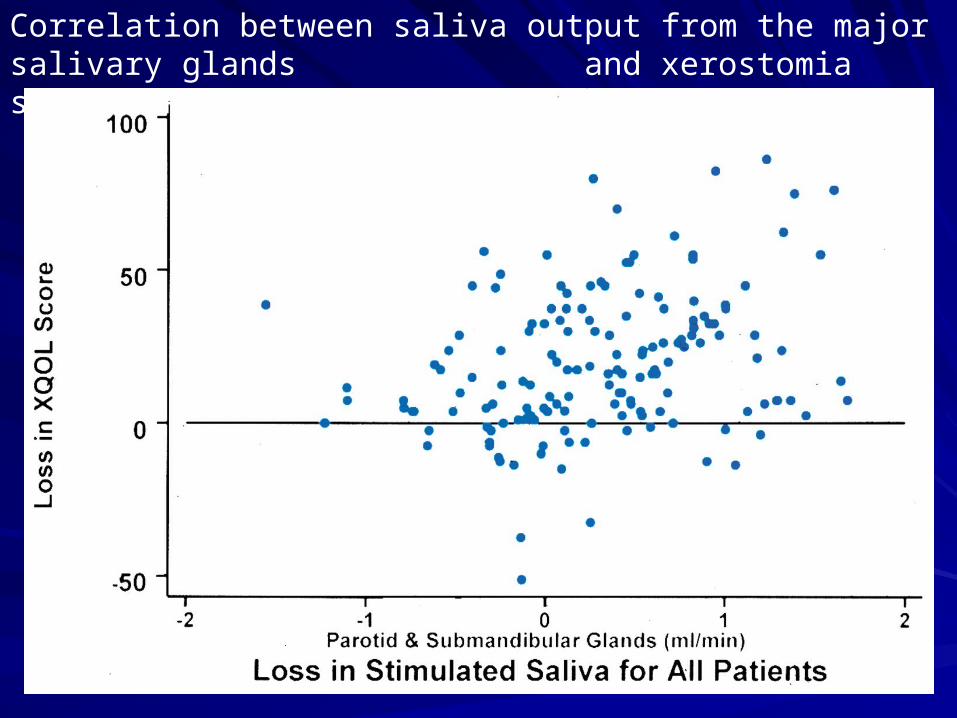
Correlation between saliva output from the major salivary glands and xerostomia scores: P=0.02; r=0.3
Weak correlation between the amount of parotid Weak correlation between the amount of parotid saliva spared and patients’ subjective symptoms.saliva spared and patients’ subjective symptoms.
Could the output of the minor salivary Could the output of the minor salivary glands be important, too?glands be important, too?
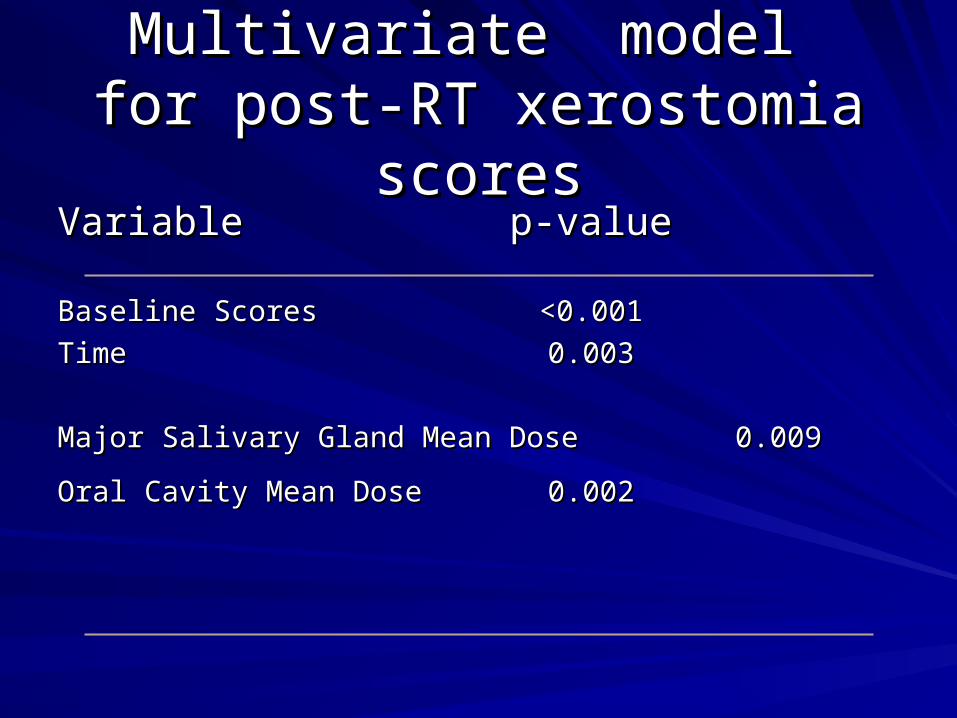
Multivariate model Multivariate model for post-RT xerostomia scoresfor post-RT xerostomia scores
Variable Variable p-valuep-value
Baseline ScoresBaseline Scores <0.001<0.001
Time Time 0.0030.003
Major Salivary Gland Mean Dose Major Salivary Gland Mean Dose 0.009 0.009
Oral Cavity Mean DoseOral Cavity Mean Dose 0.0020.002
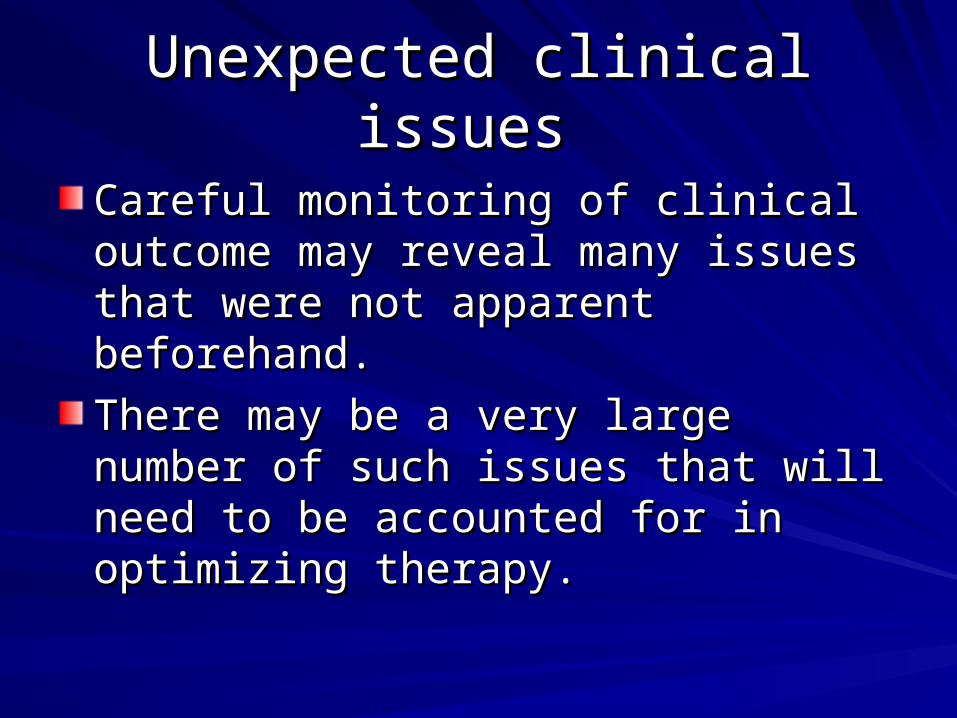
Unexpected clinical issues Unexpected clinical issues
Careful monitoring of clinical outcome may Careful monitoring of clinical outcome may reveal many issues that were not apparent reveal many issues that were not apparent beforehand.beforehand.
There may be a very large number of such There may be a very large number of such issues that will need to be accounted for in issues that will need to be accounted for in optimizing therapy. optimizing therapy.
All is well in the xerostomia frontAll is well in the xerostomia frontonce IMRT is employed.once IMRT is employed.
Problem No. 3: Uncertainties in the Problem No. 3: Uncertainties in the relationships between dose, volume, relationships between dose, volume, and reduced salivary output.and reduced salivary output.
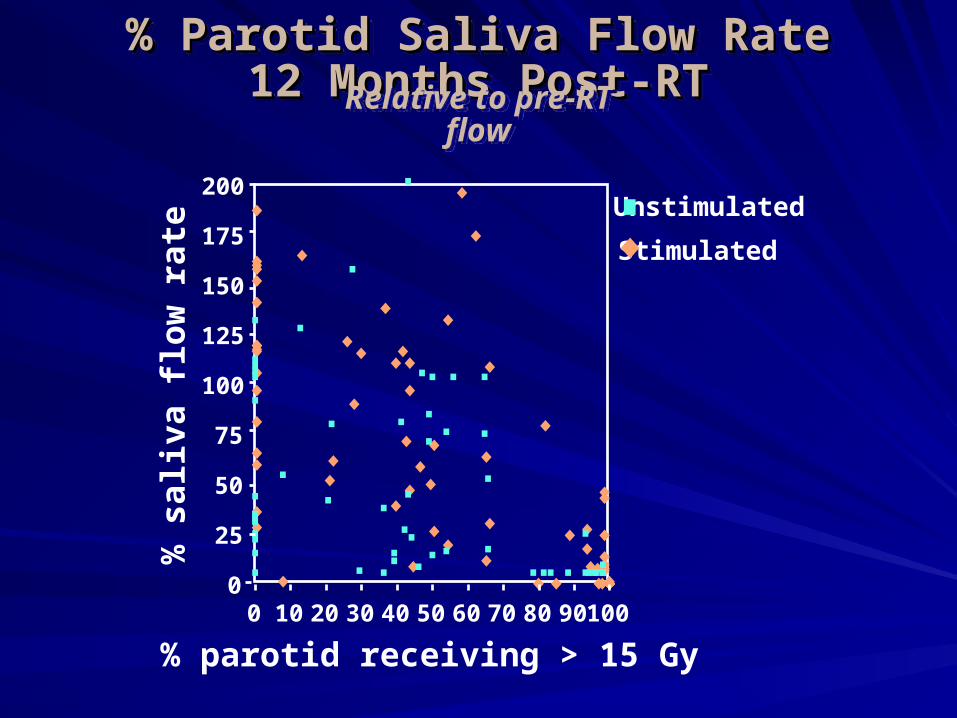
% parotid receiving > 15 Gy
0
25
50
75
100
125
150
175
200
0 10 20 30 40 50 60 70 80 90 100
Stimulated
Unstimulated%
sal
iva
flow
rate
% Parotid Saliva Flow Rate 12 Months % Parotid Saliva Flow Rate 12 Months Post-RTPost-RT
% Parotid Saliva Flow Rate 12 Months % Parotid Saliva Flow Rate 12 Months Post-RTPost-RT
Relative to pre-RT flowRelative to pre-RT flow

% parotid receiving > 30 Gy
0
25
50
75
100
125
150
175
200
0 10 20 30 40 50 60 70 80 90 100
Stimulated
Unstimulated%
sal
iva
flow
rate
% Parotid Saliva Flow Rate 12 Months % Parotid Saliva Flow Rate 12 Months Post-RTPost-RT
% Parotid Saliva Flow Rate 12 Months % Parotid Saliva Flow Rate 12 Months Post-RTPost-RT
Relative to pre-RT flowRelative to pre-RT flow
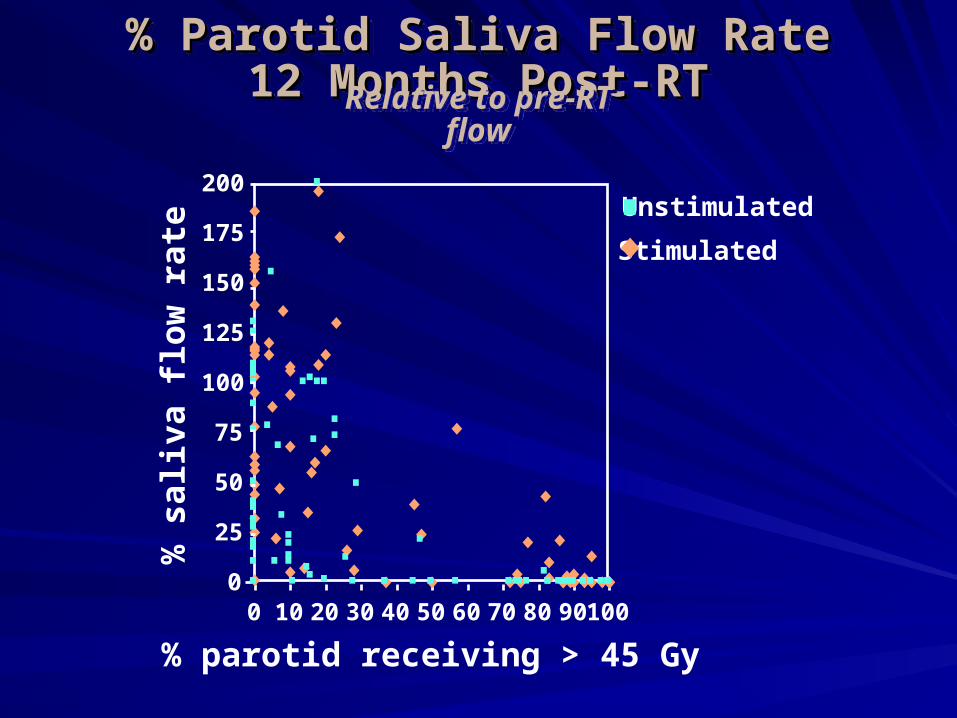
Stimulated
Unstimulated%
sal
iva
flow
rate
% parotid receiving > 45 Gy
0
25
50
75
100
125
150
175
200
0 10 20 30 40 50 60 70 80 90 100
% Parotid Saliva Flow Rate 12 Months % Parotid Saliva Flow Rate 12 Months Post-RTPost-RT
% Parotid Saliva Flow Rate 12 Months % Parotid Saliva Flow Rate 12 Months Post-RTPost-RT
Relative to pre-RT flowRelative to pre-RT flow
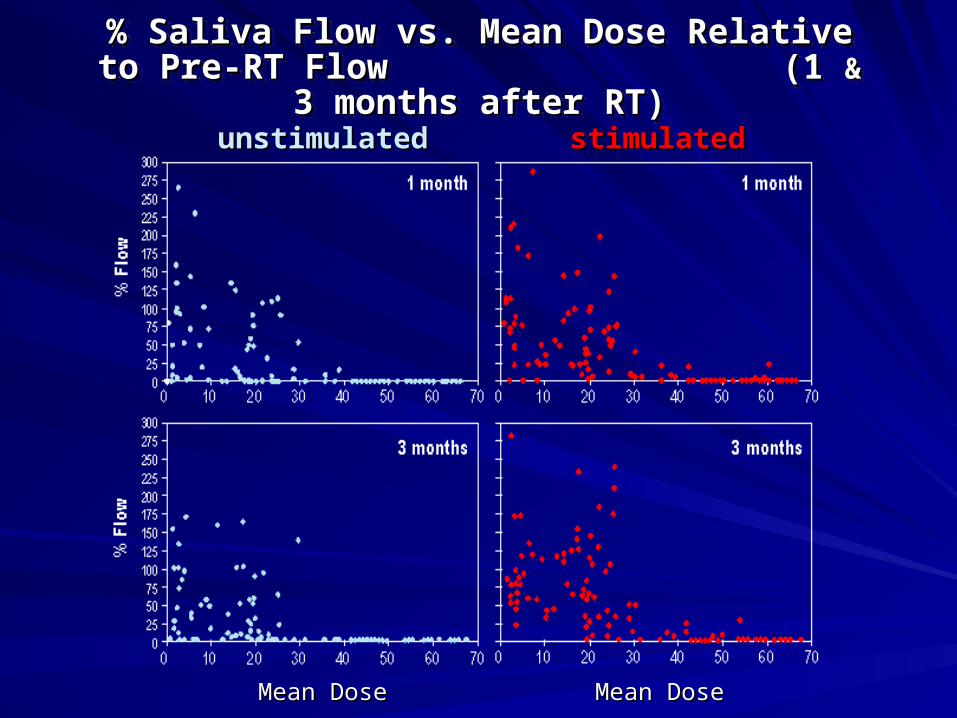
% Saliva Flow vs. Mean Dose Relative to Pre-RT Flow % Saliva Flow vs. Mean Dose Relative to Pre-RT Flow (1 (1 && 3 months after RT) 3 months after RT)
% Saliva Flow vs. Mean Dose Relative to Pre-RT Flow % Saliva Flow vs. Mean Dose Relative to Pre-RT Flow (1 (1 && 3 months after RT) 3 months after RT)
unstimulatedunstimulated stimulatedstimulated
Mean DoseMean Dose Mean DoseMean Dose
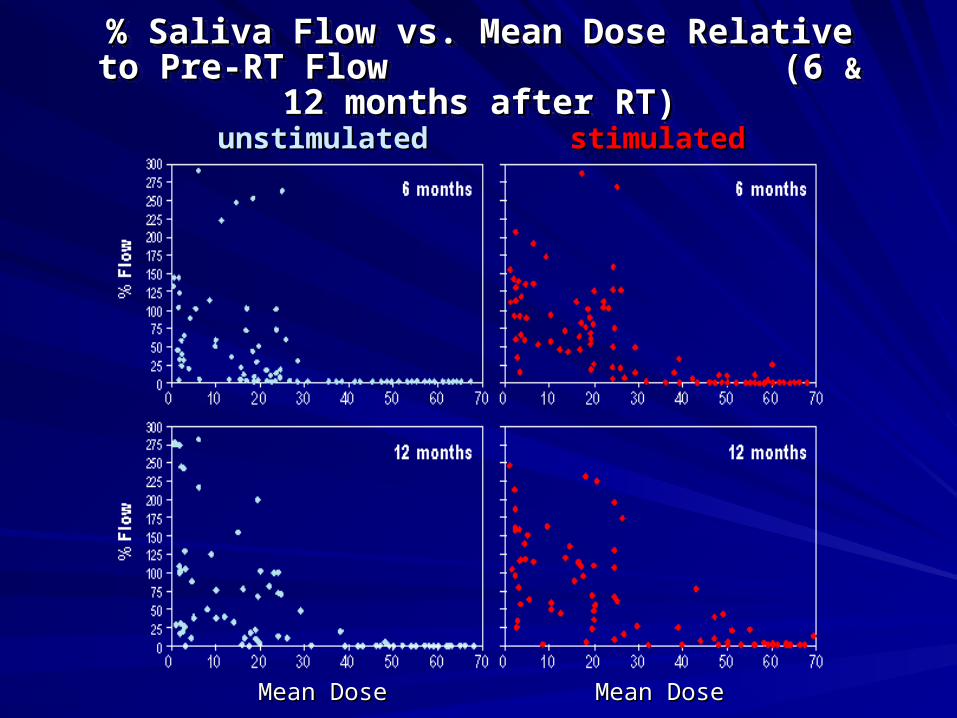
% Saliva Flow vs. Mean Dose Relative to Pre-RT Flow % Saliva Flow vs. Mean Dose Relative to Pre-RT Flow (6 (6 && 12 months after RT) 12 months after RT)
% Saliva Flow vs. Mean Dose Relative to Pre-RT Flow % Saliva Flow vs. Mean Dose Relative to Pre-RT Flow (6 (6 && 12 months after RT) 12 months after RT)
unstimulatedunstimulated stimulatedstimulated
Mean DoseMean Dose Mean DoseMean Dose

Dose, volume, and effect Dose, volume, and effect relationshipsrelationships
Each of the partial volume dose Each of the partial volume dose thersholds, as well as the mean dose thersholds, as well as the mean dose threshold, described these relationships threshold, described these relationships well.well.
In a multivariate analysis, the mean dose In a multivariate analysis, the mean dose was found to be the best descriptor.was found to be the best descriptor.

y = 0.4074x + 23.282
R2 = 0.5787
0
10
20
30
40
50
60
70
0 20 40 60 80 100
% Vol of Parotid Inside PTV
Par
oti
d M
ean
Do
se (
Gy)
Vineberg, Eisbruch, et al. IJROBP 2002

Complication Probability CurvesComplication Probability Curves
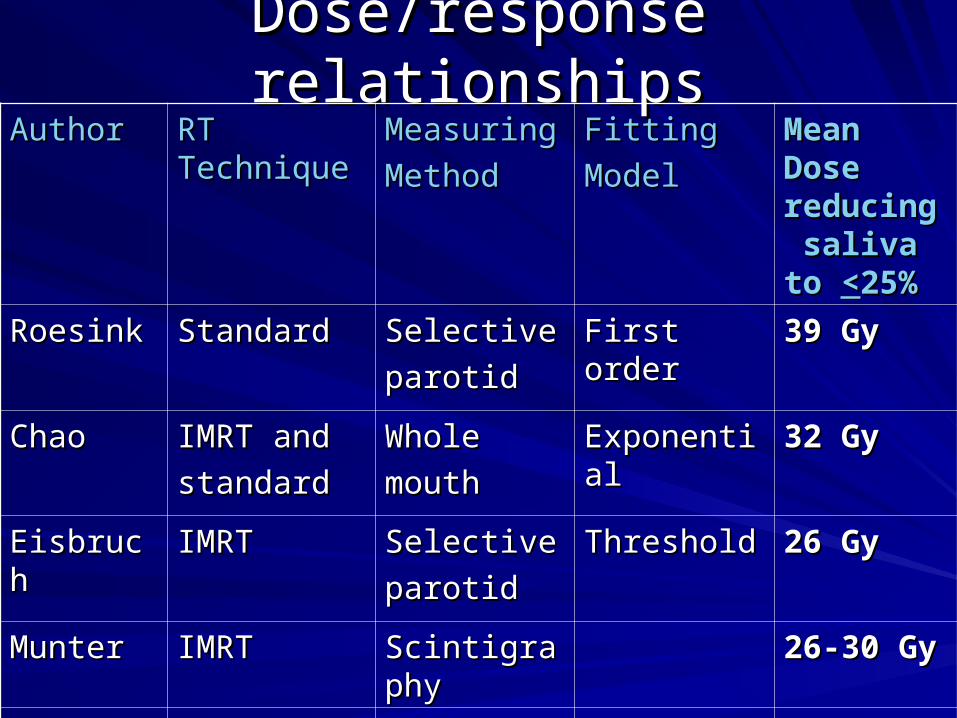
Dose/response relationshipsDose/response relationshipsAuthorAuthor RT RT
TechniqueTechniqueMeasuringMeasuring
MethodMethod
FittingFitting
ModelModel
Mean Mean Dose Dose reducing reducing saliva to saliva to <<25%25%
RoesinkRoesink StandardStandard SelectiveSelective
parotidparotid
First orderFirst order 39 Gy39 Gy
ChaoChao IMRT andIMRT and
standardstandard
WholeWhole
mouth mouth
ExponentialExponential 32 Gy32 Gy
EisbruchEisbruch IMRTIMRT SelectiveSelective
parotidparotid
ThresholdThreshold 26 Gy26 Gy
MunterMunter IMRTIMRT ScintigraphyScintigraphy 26-30 Gy26-30 Gy
MaesMaes ConformalConformal ScintigraphyScintigraphy 20 Gy20 Gy
Dose/response relationshipsDose/response relationships
What are the reasons for the wide spread What are the reasons for the wide spread of the reported mean doses causing of the reported mean doses causing significant salivary flow decline?significant salivary flow decline?

mean dose vs. % volume receiving >30 Gy
0
10
20
30
40
50
60
0 10 20 30 40
Series1
#1: Different techniques --- different dose distributions---- different relationships between the mean dose and partial volumes receiving any dose.
What are the reasons for the wide spread of dose/response results?
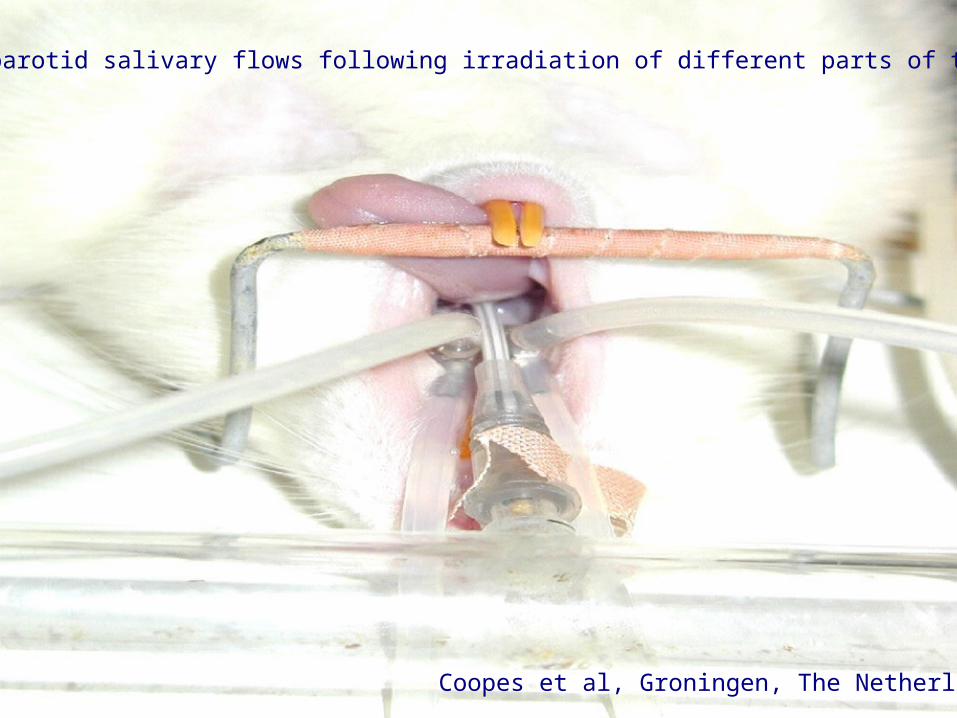
Coopes et al, Groningen, The Netherlands
Measuring rat parotid salivary flows following irradiation of different parts of the glands

Spatial dose distributionsSpatial dose distributions
Irradiating different regions of the rat parotid Irradiating different regions of the rat parotid gland yields different dose/volume/effect gland yields different dose/volume/effect relationships (Coopes et al, ESTRO 2003).relationships (Coopes et al, ESTRO 2003).
The spatial dose distribution within the The spatial dose distribution within the gland is importantgland is important
DVH-related metrics alone are not enough.DVH-related metrics alone are not enough.
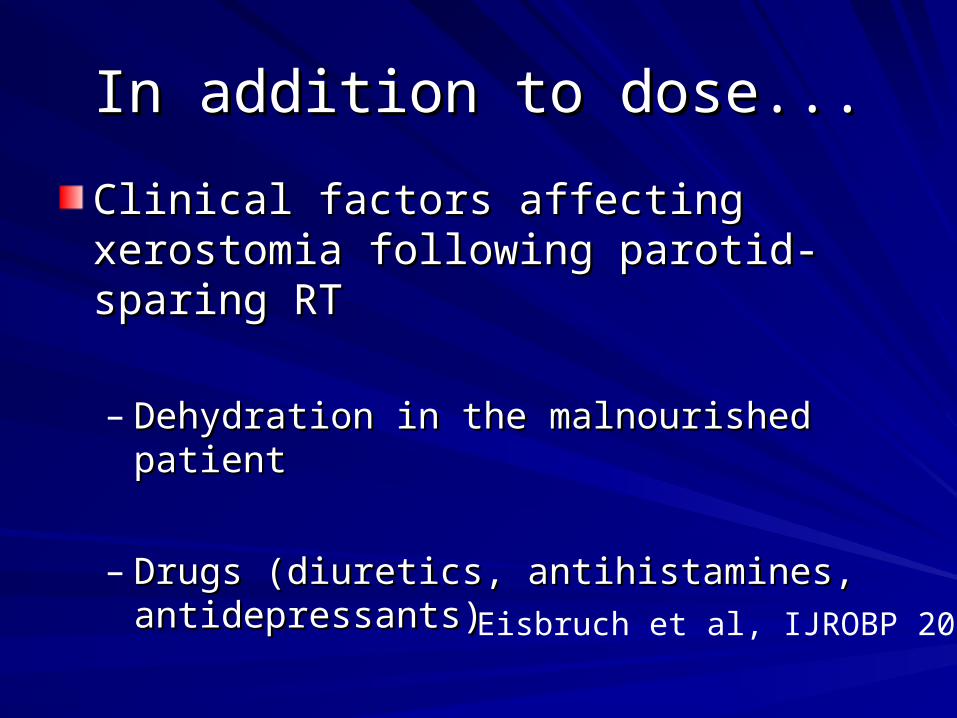
In addition to dose...In addition to dose...
Clinical factors affecting xerostomia Clinical factors affecting xerostomia following parotid-sparing RTfollowing parotid-sparing RT
– Dehydration in the malnourished patientDehydration in the malnourished patient
– Drugs (diuretics, antihistamines, Drugs (diuretics, antihistamines, antidepressants) antidepressants)
Eisbruch et al, IJROBP 2001
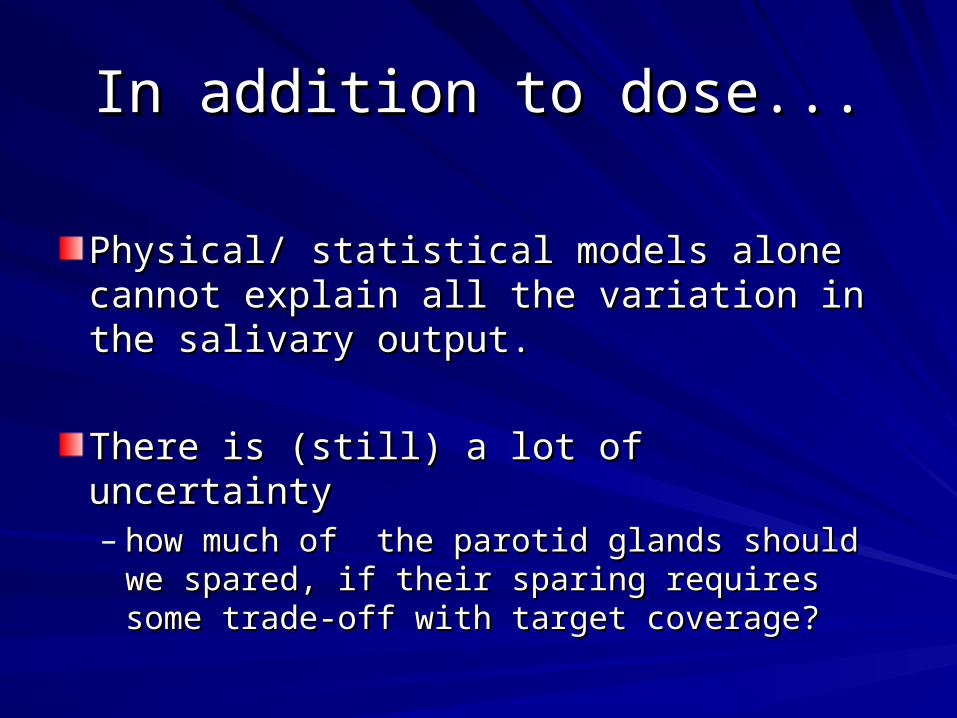
In addition to dose...In addition to dose...
Physical/ statistical models alone cannot Physical/ statistical models alone cannot explain all the variation in the salivary explain all the variation in the salivary output.output.
There is (still) a lot of uncertainty There is (still) a lot of uncertainty – how much of the parotid glands should we how much of the parotid glands should we
spared, if their sparing requires some trade-spared, if their sparing requires some trade-off with target coverage? off with target coverage?

IMRT: Lower total dose to a critical organ IMRT: Lower total dose to a critical organ means also lower dose/fraction.means also lower dose/fraction.
The biologically equivalent dose delivered The biologically equivalent dose delivered to the critical organ is lower than the to the critical organ is lower than the nominal dose.nominal dose.
For the same total maximal organ dose, For the same total maximal organ dose, IMRT is safer than standard or 3D RT .IMRT is safer than standard or 3D RT .
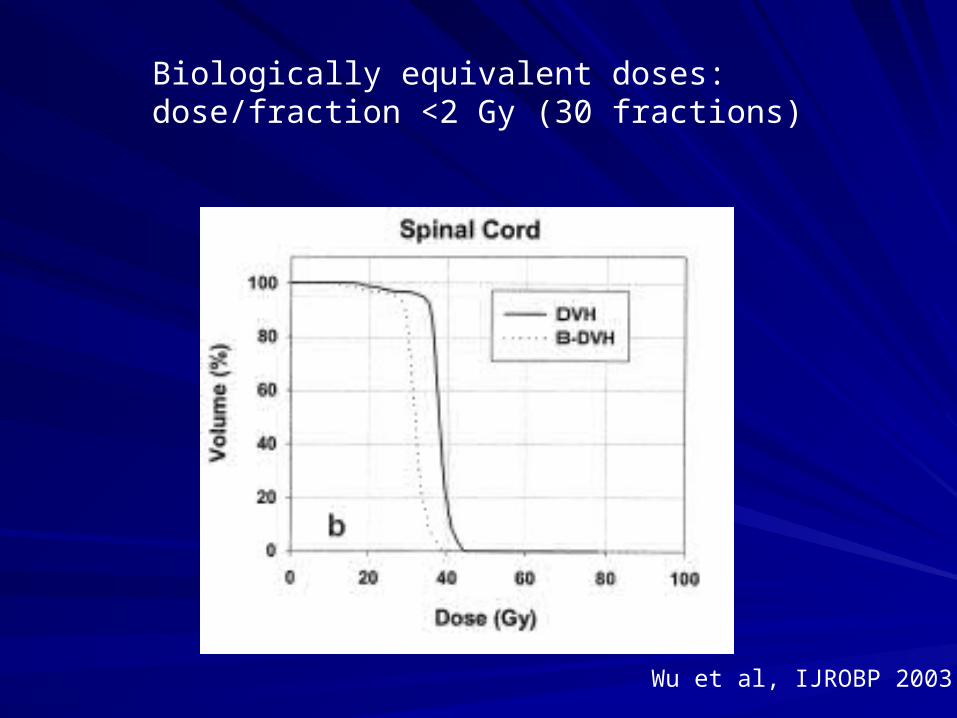
Biologically equivalent doses: dose/fraction <2 Gy (30 fractions)
Wu et al, IJROBP 2003

IMRT: Lower total dose to a critical organ IMRT: Lower total dose to a critical organ means also lower dose/fraction.means also lower dose/fraction.
Dose/response data from standard or 3D Dose/response data from standard or 3D RT, where full dose/fraction (1.8-2.0 Gy) is RT, where full dose/fraction (1.8-2.0 Gy) is delivered to the critical organ, may not be delivered to the critical organ, may not be relevant to IMRT.relevant to IMRT.
We need much more data correlating We need much more data correlating dose/response in tumor and in normal dose/response in tumor and in normal tissue before we can use IMRT optimally. tissue before we can use IMRT optimally.
Illustration of the current process Illustration of the current process of research in using IMRT to solve of research in using IMRT to solve
a clinical issuea clinical issue
Acute and late mucosal/pharyngeal Acute and late mucosal/pharyngeal toxicitytoxicity
Pharyngeal toxicity is the main barrier for Pharyngeal toxicity is the main barrier for winning the battle with head and neck winning the battle with head and neck cancer (K. Robbins, Editorial, IJROBP cancer (K. Robbins, Editorial, IJROBP 2002).2002).

Stricture
Aspiration
Videofluoroscopy after chemo-RT
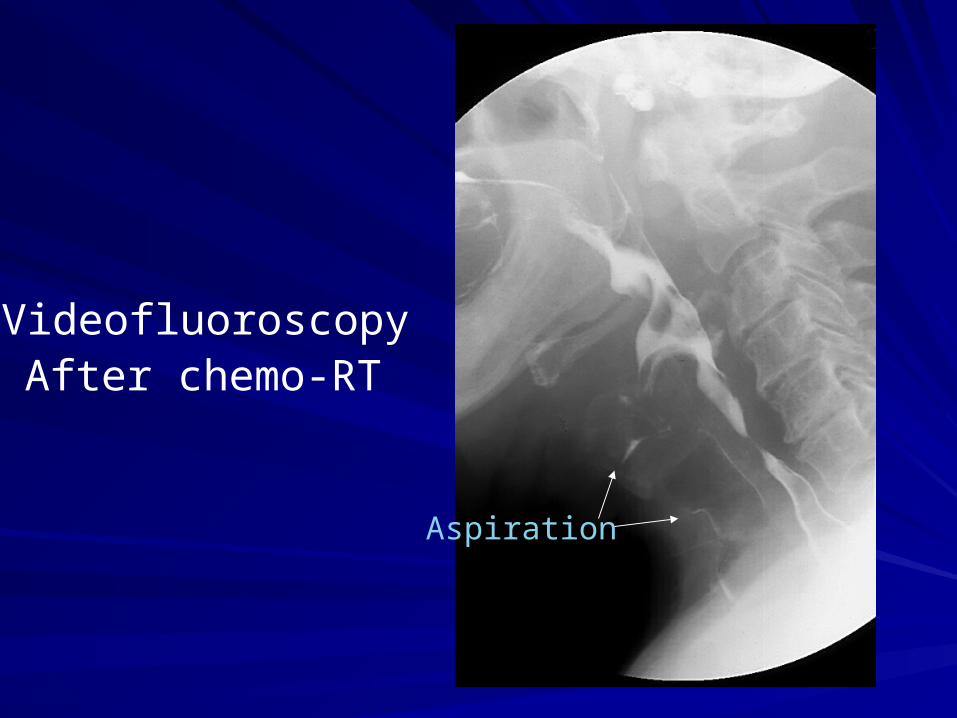
Aspiration
VideofluoroscopyAfter chemo-RT
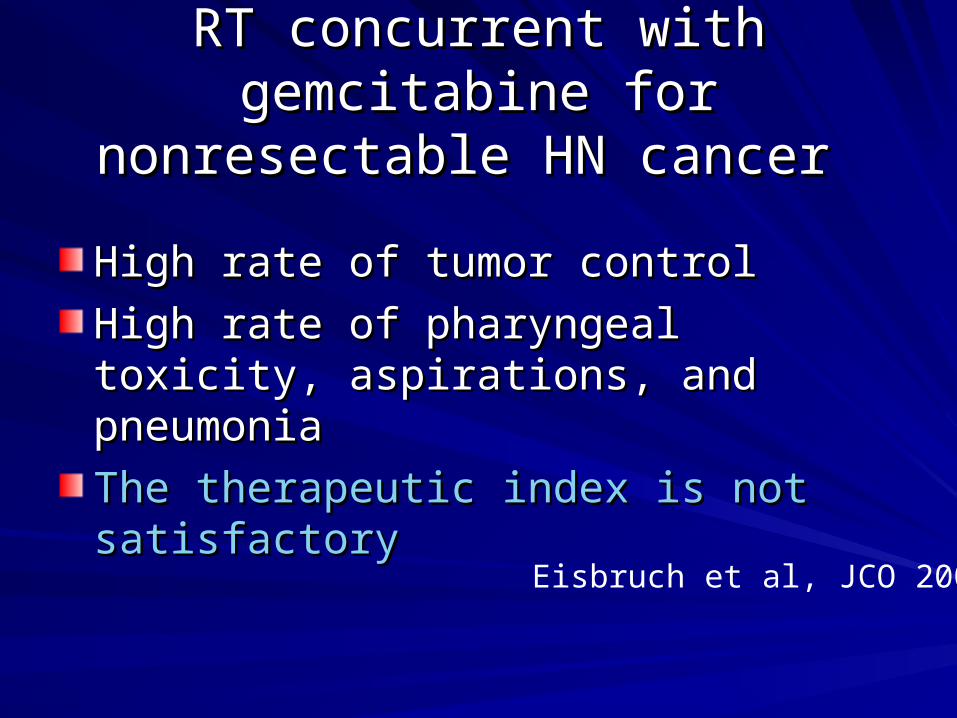
RT concurrent with gemcitabine for RT concurrent with gemcitabine for nonresectable HN cancer nonresectable HN cancer
High rate of tumor controlHigh rate of tumor control
High rate of pharyngeal toxicity, High rate of pharyngeal toxicity, aspirations, and pneumoniaaspirations, and pneumonia
The therapeutic index is not satisfactoryThe therapeutic index is not satisfactory
Eisbruch et al, JCO 2001

Improve the theraputic index by Improve the theraputic index by physical meansphysical means
IMRT must solve this problem!IMRT must solve this problem!
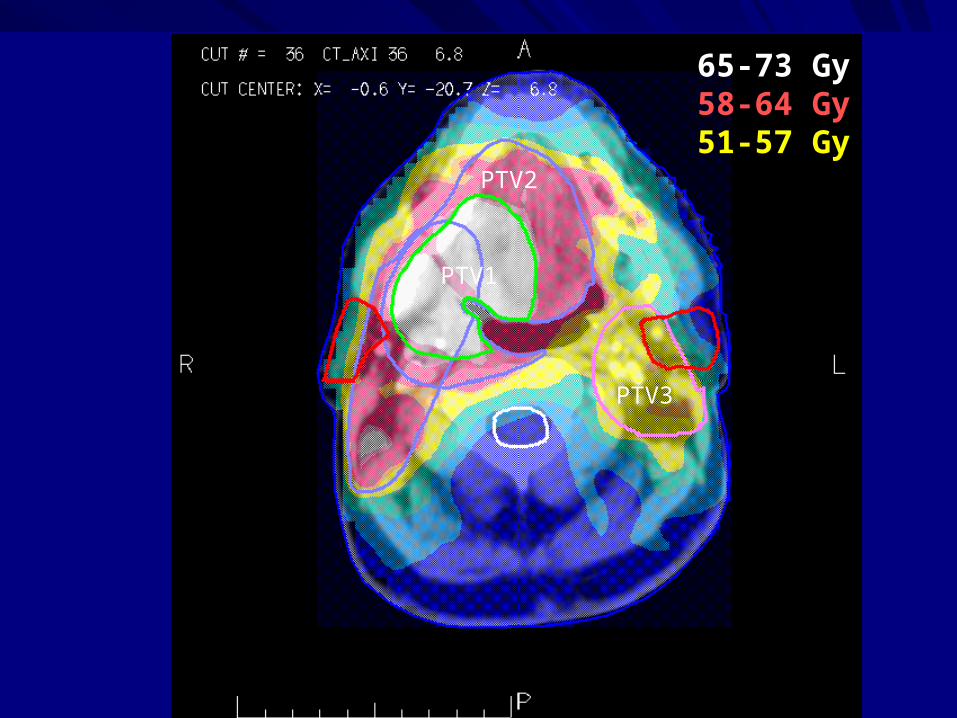
65-73 Gy58-64 Gy51-57 Gy
PTV1
PTV2
PTV3

Retrospective comparisons of pharyngeal Retrospective comparisons of pharyngeal toxicity following intensive chemo-RT: toxicity following intensive chemo-RT:
Standard RT vs. IMRTStandard RT vs. IMRT
Mittal et al (ASTRO 2001): Mittal et al (ASTRO 2001): IMRT is betterIMRT is better
Milano et al (ASCO 2003), Garden et al Milano et al (ASCO 2003), Garden et al (ASTRO 2003): (ASTRO 2003): No difference.No difference.
Can we use IMRT specifically to reduce Can we use IMRT specifically to reduce dysphagia/aspiration following intensive dysphagia/aspiration following intensive
chemo-RT?chemo-RT?
Which anatomical structures are Which anatomical structures are affected?affected?
– 36 different muscles and 10 nerves participate 36 different muscles and 10 nerves participate in swallowing and airway protectionin swallowing and airway protection
Which anatomical structures are affected?Which anatomical structures are affected?
Videofluoroscopy: Functional abnormalities Videofluoroscopy: Functional abnormalities following chemo-RTfollowing chemo-RT
– Reduced contraction of the pharyngeal Reduced contraction of the pharyngeal constrictorsconstrictors
– Reduced movement of the epiglottis to protect Reduced movement of the epiglottis to protect the airwaythe airway
– Reduced coordination between pharyngeal Reduced coordination between pharyngeal contraction, closure of the larynx, and opening contraction, closure of the larynx, and opening of the upper esophageal sphincterof the upper esophageal sphincter
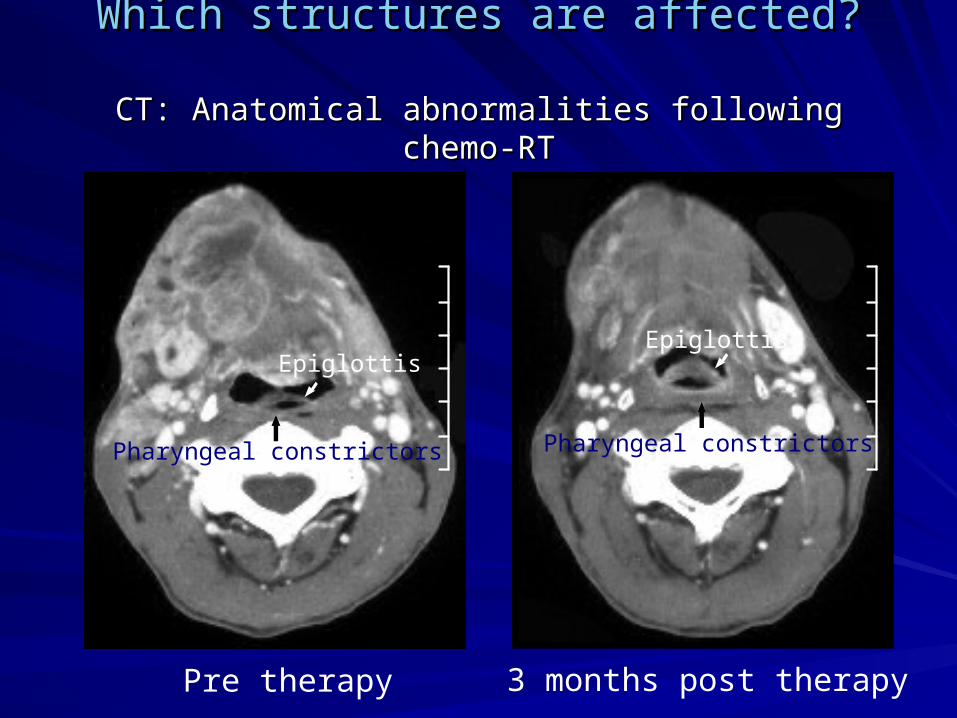
Which structures are affected?Which structures are affected?
CT: Anatomical abnormalities following chemo-RTCT: Anatomical abnormalities following chemo-RT
Pre therapy 3 months post therapy
Pharyngeal constrictors
Epiglottis
Pharyngeal constrictors
Epiglottis
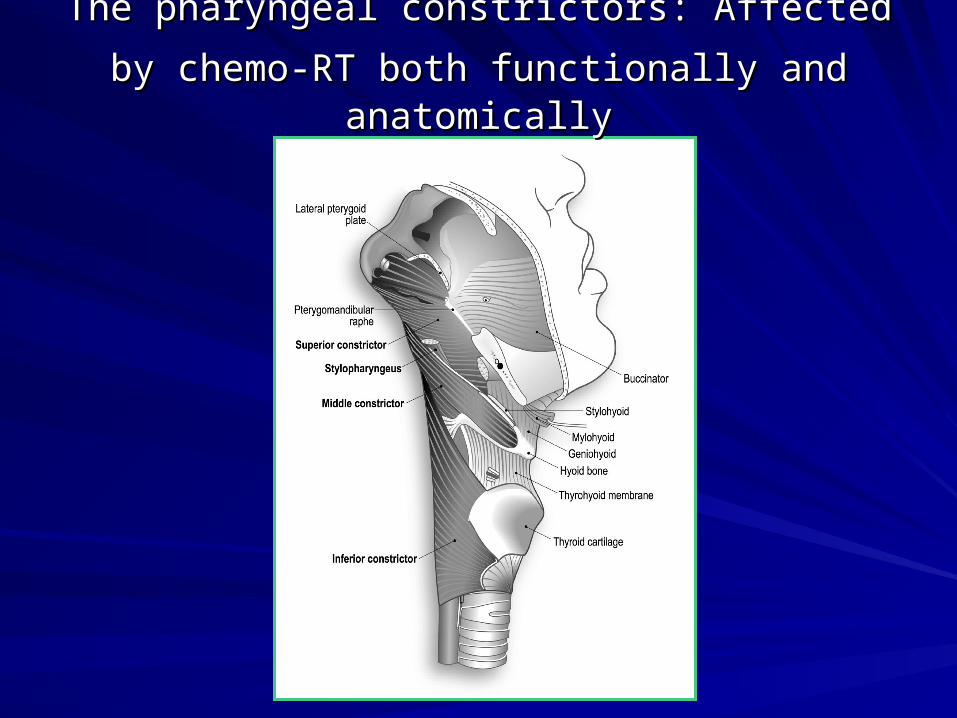
The pharyngeal constrictors: Affected by chemo-The pharyngeal constrictors: Affected by chemo-
RT both functionally andRT both functionally and anatomicallyanatomically
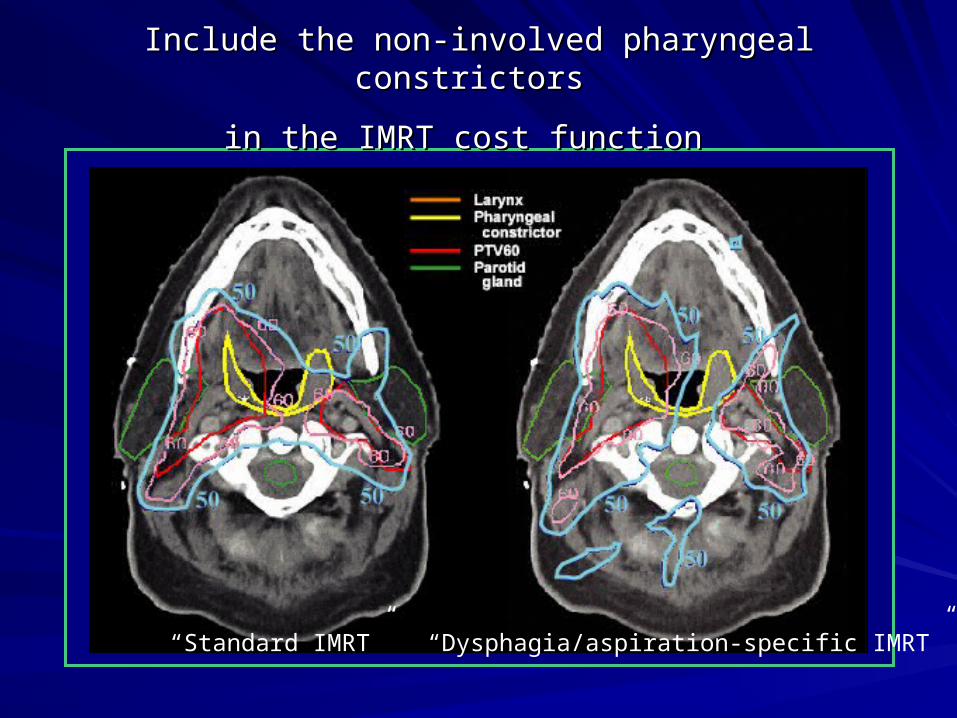
Include the non-involved pharyngeal constrictors Include the non-involved pharyngeal constrictors
in the IMRT cost functionin the IMRT cost function
“Standard IMRT” “Dysphagia/aspiration-specific IMRT”
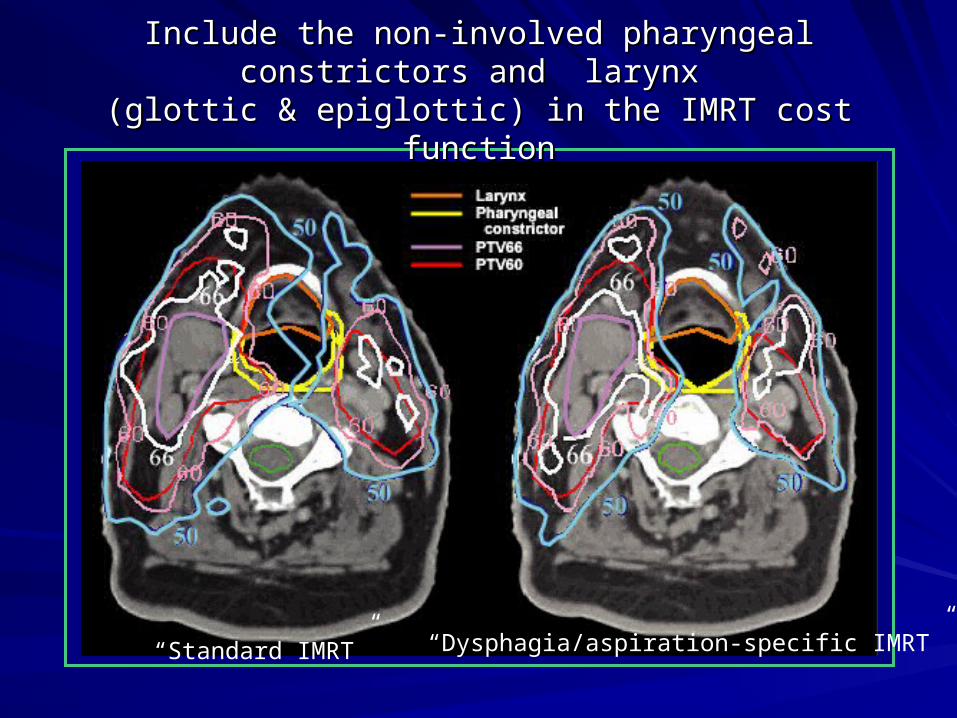
Include the non-involved pharyngeal constrictors and Include the non-involved pharyngeal constrictors and larynx larynx
(glottic & epiglottic) in the IMRT cost function(glottic & epiglottic) in the IMRT cost function
“Standard IMRT” “Dysphagia/aspiration-specific IMRT”
Reducing the dose to the Reducing the dose to the dysphagia-related structuresdysphagia-related structures
Will it help the patient swallow better?Will it help the patient swallow better?
How much one needs o reduce the dose How much one needs o reduce the dose to gain a clinical benefit?to gain a clinical benefit?
What is the important dosimetric What is the important dosimetric parameter?parameter?– Mean dose to the structure? Mean dose to the structure? – Maximal dose?Maximal dose?– Volume receiving a specified dose?Volume receiving a specified dose?
Optimization using biologic cost Optimization using biologic cost functions vs. Dose-volume functions vs. Dose-volume
Biologic cost functions use models Biologic cost functions use models describing the presumed effects of the describing the presumed effects of the non-uniform dose distribution non-uniform dose distribution – Equivalent Uniform Dose (EUD)Equivalent Uniform Dose (EUD)– Normal Tissue Complication Probability Normal Tissue Complication Probability
(NTCP)(NTCP)– Tumor Control Probability (TCP)Tumor Control Probability (TCP)

0
20
40
60
80
100
0 20 40 60 80
Dose (Gy)
Vo
lum
e (
%)
Dose
0
20
40
60
80
100
0 20 40 60 80
Dose (Gy)
Vo
lum
e (
%)
EUD
Dose
0
20
40
60
80
100
0 20 40 60 80
Dose (Gy)
Vo
lum
e (
%)
EUDDoseRelaxed Dose
0
20
40
60
80
100
0 20 40 60 80
Dose (Gy)
Vo
lum
e (
%)
EUDTCP/NTCPDoseRelaxed Dose
PTV60
IpsilateralParotid
Vineberg et al
•Achieving homogeneous target dose distributions is feasible with dose-based or biological-based optimization if enough flexibility is provided to the optimizer.
•The same tradeoffs are made between target and normal tissue, regardless of the type of cost function.
Biologic cost functions
•Once the parameters of the biologic cost function, derived from clinical data, are known with some confidence, they will be superior to dose/volume cost functions for optimization.
Biologic cost functions
ConclusionsConclusions
Data regarding the relationships between Data regarding the relationships between clinical endpoints like tumor control or clinical endpoints like tumor control or toxicity risks and the distribution of toxicity risks and the distribution of radiation doses and volumes, are essential radiation doses and volumes, are essential for an intelligent decision making or model for an intelligent decision making or model building for optimization. building for optimization.
ConclusionsConclusions
Much of these data do not yet existMuch of these data do not yet exist
Some of these data will never be available Some of these data will never be available due to their complex nature and the due to their complex nature and the inability to express them in inability to express them in physical/statistical terms.physical/statistical terms.