Embed Size (px)
Citation preview

Big Data Clinical Image Analysis
Xiao Da, MSc
Functional Neuroimaging Laboratory
Brigham and Women's Hospital
Jul. 15. 2016
From Pipeline Design to Translational Applications

Outline• Big Data in Biomedical Science why big data clinical images?
• Image Analysis Pipeline how is it possible to analyze clinical images?
• Translational Applications opens up many opportunities.
Early onset of Alzheimer's Disease & Dementia prediction
Survival and molecular subtype prediction in glioblastoma
and image guided neurosurgery
Prediction of X-linked Adrenoleukodystrophy progression
Many many more
Glioblastoma
ALD
EHR
Millions of pixels for each image
3D
4D2D
Genetic Data

Neonatal Brain Injury – why big data clinical images?
Hypoxic Ischemic Encephalopathy (HIE)- affects 2-6/1000 newborns- occurs in the first 1-2 weeks of life, short of blood/oxygen- life-threatening, often long-term neuro-cognitive deficits
Timely Diagnosis is Crucial:- ADC maps are gold-standard: HIE->low ADC values- but 30-50% inter-reader variability, because- how low is too low; how low is within normal range?
Figure from Howlett et al, Ped Res, 2013
A fundamental question:How to Quantify Normal Variations?
Research-oriented Images
- Recruit normal volunteers- invest:
$$$$$$, years,
- outcome: 10s – 100s of normal images
Clinically-acquired Images
- No recruitment needed- invest:
$, weeks (vetting normal images),
- outcome: hundreds of normal images
normative abnormal
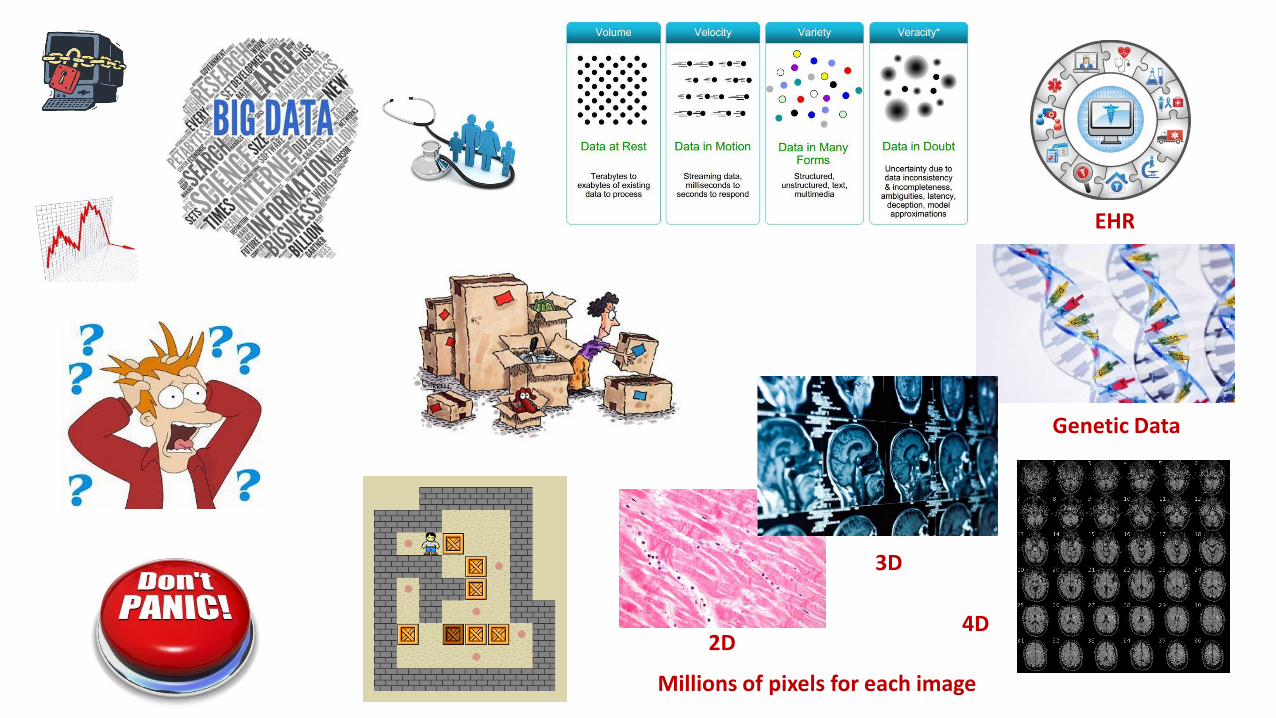
Motivating Example #1: Neuro-development

How to get and vet clinical images?
Mi2b2 engine: https://www.nmr.mgh.harvard.edu/lab/mi2b2Lead: Profs. Shawn Murphy, Randy Gollub (MGH) [Murphy et al, 2015]
N = 2,871- Scanned 2006-2013 with ADC maps
in Siemens 3T scanner- 0-6 years old at the time of scan- Radiological reports suggesting free
of abnormality
N=~100,000- Brain MRI in MGH
N = 1,648- ADC maps found and not corrupted
N = 705- ADC maps re-examined & confirmed to
be normal by a neuro-radiologist (Dr. Grant) and a neonatologist (Dr. Bates)
N = 201- Duplicates removed
- Still normal 3 years after the initial visit
To get To vet
* Ou et al, NeuroImage, 2015
Motivating Example #1: Neuro-development
Offering similar statistics to research data, and more…Motivating Example #1: Neuro-development
* Ou et al, NeuroImage, 2015
a) Whole-brain volume and ADC values, and changes
Statistically, at each age,measures from 1 atlas == measures from multiple individuals
Age-specific Normal ADC Atlases

Offering similar statistics to research data, and more…Motivating Example #1: Neuro-development
* Ou et al, NeuroImage, 2015
b) Regional and voxel-wise ADC values, and changes
measures from 1 atlas ~= measures from multiple individuals
Baseline Follow-up Jacobian (B->F)
0
1
2Case 1: Volume expanding
Case 2: Volume shrinking
*Ou, Da et al, MRM, 2014
c) Voxel-wise Spatially and Temporal Heterogeneous Changes
measures from 1 atlas > measures from multiple individuals ?

How much proportion of clinical data can we use?
Motivating Example #2: Neuro-oncology
normative abnormal
Research data Clinical data
Q: can we use abnormal images to quantify normal?
T1 with Gadolinium enhancement (T1c)
Tumor, or Normal Vessel?
A Neuro-Oncology Example
…
Where does a normal brain enhance?
- Normal people rarely undergo T1c- Tumor patients undergo T1c

Clinical Data from abnormal patients to quantify normalConstructing normal-appearing atlases from an abnormality-bearing cohort?
T1 with Gadolinium enhancement (T1c)
Tumor, or Normal Vessel?
…
Where does a normal brain enhance?
?
•Ou, Da et al, manuscript in preparation, 2016•* Atlases: https://www.nitrc.org/projects/stamp_atlases
Solution: Using the normative regions only for atlas construction
3D view(projection)
T1 with Gadolinium enhancement (T1c)
Tumor, or Normal Vessel?
tumor
Normalvessel
- Normal people rarely undergo T1c- Tumor patients undergo T1c
Motivating Example #2: Neuro-oncology

As long as we can analyze clinical images…

Analyzing Clinical Images: an Unmet Need
• Research-Oriented Images
- single site/scanner/sequence
- hundreds
- homogeneous FOV/contrast
- homogeneous age/disease
Pipelines: FSL, SPM, FreeSurfer, …
• Clinically-Acquired Images
- multi-site/scanner/sequence
- tens of thousands ++ (big data)
- diverse FOV/contrast
- diverse age/diseases
Pipeline: ?

Outline• Big Data in Biomedicine why big data clinical images?
• Image Analysis Pipeline how is it possible to analyze clinical images?
• Translational Applications opens up many opportunities.
Early onset of Alzheimer's Disease & Dementia prediction
Survival and molecular subtype prediction in glioblastoma
and image guided neurosurgery
Prediction of X-linked Adrenoleukodystrophy progression
Many many more
Glioblastoma
ALD

Technically, where do we start?
• Recall, In Medicine
Residents learn from existing patients Doctors see new patients
- how do structures look like in MRI? - structural annotation
- how do lesions look like in MRI? - disease diagnosis
- how early changes imply prognosis? - prognosis prediction
• So, in image analysis
Knowledge Translation
Training Guidance

Pipeline Design• Dicom Unpacking
• Field of View Normalization
• Skull Stripping
• Automatic Structural Annotation
• Multi-modal/channel Fusion
• Spatial Normalization, Density and Morphometry
• Atlas Construction (atlas-based detection)
• Longitudinal Change Quantification
• Disease Pattern Classification/Early Onset Prediction
• Quality Check
• ROI Statistical Analysis
• More
Ocean Water
Fresh Water

Multi-Atlas Skull Stripping
STAMP (STandardized Abnormality-free Multi-Parametric) atlases
*Ou, Da et al, manuscript to be submitted, 2016
Our Pipeline
*Ou, Da et al, Major Revision, 2016
FOV Normalization
3 tissue types2 hemispheres4 lobes151 structures
*Doshi et al, 2013, 2016
Structural Annotation
Quality Check
*Da et al, NeuroImage:Clinical, 2014
Disease Pattern Classification
Dicom Unpacking
*Ou, Da et al, 2014
Longitudinal Change Quantification
*Akbari, Da et al, 2016
Neurosurgery Navigation
Multi-ModalFusion
ROI Stat Analysis
*Ou et al, 2014, Davatzikos 2001
Spatial Normalization, Density and Morphometry

Pipeline’s Features:
• MGH/BCH Neuro-Development Data: 0-6 yo neuro-development from clinical big data, HIE characterization
• MGH Neuro-Oncology Datasets: TIV/CED/NHX clinical trials for brain tumor patients
• MGH Neurology Datasets: ALD and Stroke
• NiCK: Neurocognitive assessment and MRI analysis of children and young adults with chronic kidney disease
• PNC: Philadelphia Neurological Cohort study on healthy children and adolescents (Satterthwaite et al, 2013)
• ADNI: Alzheimer’s Disease Neuroimaging Initiative (Mueller et al, 2005)
• HANDLS: Healthy Aging in Neighborhoods of Diversity across the Life Span
• ACCORD: Action to Control Cardiovascular Risk in Diabetes (Buse et al, 2007)
• CARDIA: Coronary Artery Risk Development in young Adults (Hughes et al, 1987)
• SPRINT: Systolic Blood Pressure Intervention Trial
• WHIMS: Women's Health Initiative Memory Study (Shumaker et al, 1998)
• …… ……
Successful Applications (8000+ images in 10+ NIH studies, trials):
- Publicly-available;- Generally applicable: multi-site/vendor/scanner,
across age, health conditions,research and clinical images;
- Accurate and robust
Examples: people used our pipeline as basis for
Computational Psychiatry & Psychology
Neuro-Development and Neuro-Cognition
Oncology (Brain, Breast, Prostate)
Human brain
Other animals
* R01EB014947 * U01CA154601 * R01EB009234 * R01NS042645 * R01AG014971 * R01MH070365 * P41RR013642 * R01CA104976 * U24CA189523 * R01CA197000 * K23MH098130 * R00HD061485 ……

Outline• Big Data in Biomedicine why big data clinical images?
• Image Analysis Pipeline how is it possible to analyze clinical images?
• Translational Applications opens up many opportunities.
Early onset of Alzheimer's Disease & Dementia prediction
Survival and molecular subtype prediction in glioblastoma
and image guided neurosurgery
Prediction of X-linked Adrenoleukodystrophy progression
Many many more
Glioblastoma
ALD

Alzheimer's Disease
200 subjects
Mild Cognitive Impairment 381 subjects
Cognitive Normal 232 subjects
Cognitive Scores(ADAS-Cog)
APOE ε4
CSF Biomarkers 192 MCITau Beta Amyloid
Prediction of early onset of AD

Imaging + Genetics, Predicting Conversion to Alzheimer
Normal Aging
Mild Cognitive Impairment (MCI)
Alzheimer’s Disease (AD)
stable or even reversible
Challenge: Convert or not?
Approach: all 4 sets of biomarkers
Multi-site/scanner ADNI data (N=813)AD: 200; CN: 232; MCI: 381
Findings:
Imaging marker ~= cognition test scores < combined
CSF markers improve imaging marker? No.
Imaging + cognitive tests good enough. ApoE improves? No.
Da et al, NeuroImage: Clinical, 2014

The only editorial highlighted article since the debut of NeuroImage: Clinical
Oral Presentation, RSNA 2013

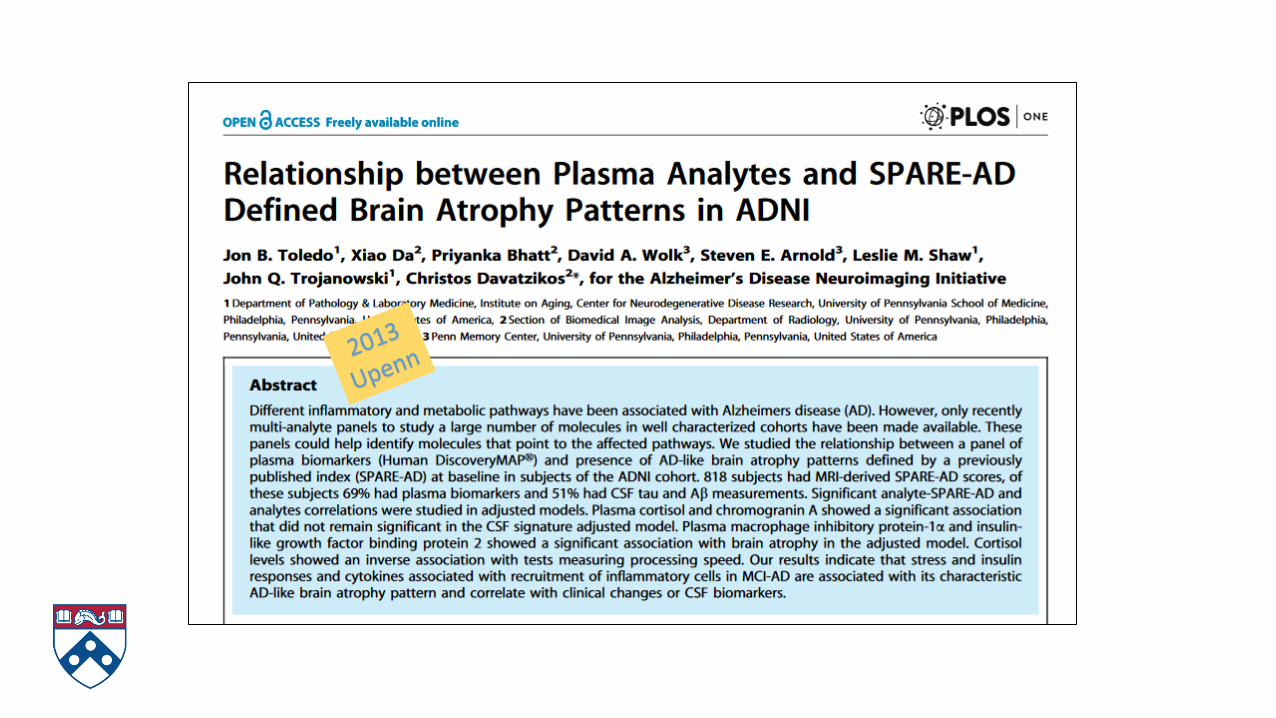
How is the Relationship between Plasma Analytes and Brain Atrophy?
FDR Corrected p < 0.05

Outline• Big Data in Biomedicine why big data clinical images?
• Image Analysis Pipeline how is it possible to analyze clinical images?
• Translational Applications opens up many opportunities.
Early onset of Alzheimer's Disease & Dementia prediction
Survival and molecular subtype prediction in glioblastoma
and image guided neurosurgery
Prediction of X-linked Adrenoleukodystrophy progression
Many many more
Glioblastoma
ALD

Brain Tumor, Specifically Glioblastoma
• Glioma: 80% of brain cancer cases
• Glioblastoma Multiforme: Grade IV, 54% of Glioma
• GBM: 50(90)% die < 1(3) yr, median ~15 months

Challenges
• Spatial heterogeneity of tumors
• Genetically diverse
• Rely on relatively simple MRI measures
• Need accurate and reproducible biomarkers to enter routine clinical practice to predict the overall survival and molecular subtypes based on gene expression

Advanced Medical Image Analysis
Imaging: multi-modal, structural and mechanisticsMRI T1, T1c, T2, FLAIRDTI Diffusion: cellularity (cell density)DSC Perfusion: blood volume, blood flowDCE Permeability: vascular integrityMRS MR Spectroscopy: metabolism
Fundamentals:- Tumor is angiogenesis dependent- Imaging tumor microvasculature- Imaging tumor heterogeneity
Molecular Subtyping
Feature Extraction
Feature Selection
Machine Learning
Images Predicting Survival + Molecular Subtypes

• Imaging patterns predict patient survival by machine learning techniques
• Distinctive imaging phenotypes associated with GBM subtypes for tumor physiology and gene expression
• Integration of imaging markers (infiltration, cell density, microvascularity, and blood–brain barrier compromise) forms very accurate predictive biomarkers
• Informatics-derived imaging biomarkers of molecular composition will improve the diagnosis and evaluate treatment response over time and in response to targeted agents???
Conclusion

Leading Journal of Neuro Oncology and Cancer Research
Integra Foundation Award, CNS 2015

Multiparametric Images Guiding Neurosurgery

Editor’s Choice

Outline• Big Data in Biomedicine why big data clinical images?
• Image Analysis Pipeline how is it possible to analyze clinical images?
• Translational Applications opens up many opportunities.
Early onset of Alzheimer's Disease & Dementia prediction
Survival and molecular subtype prediction in glioblastoma
and image guided neurosurgery
Prediction of X-linked Adrenoleukodystrophy progression
Many many more
Glioblastoma
ALD
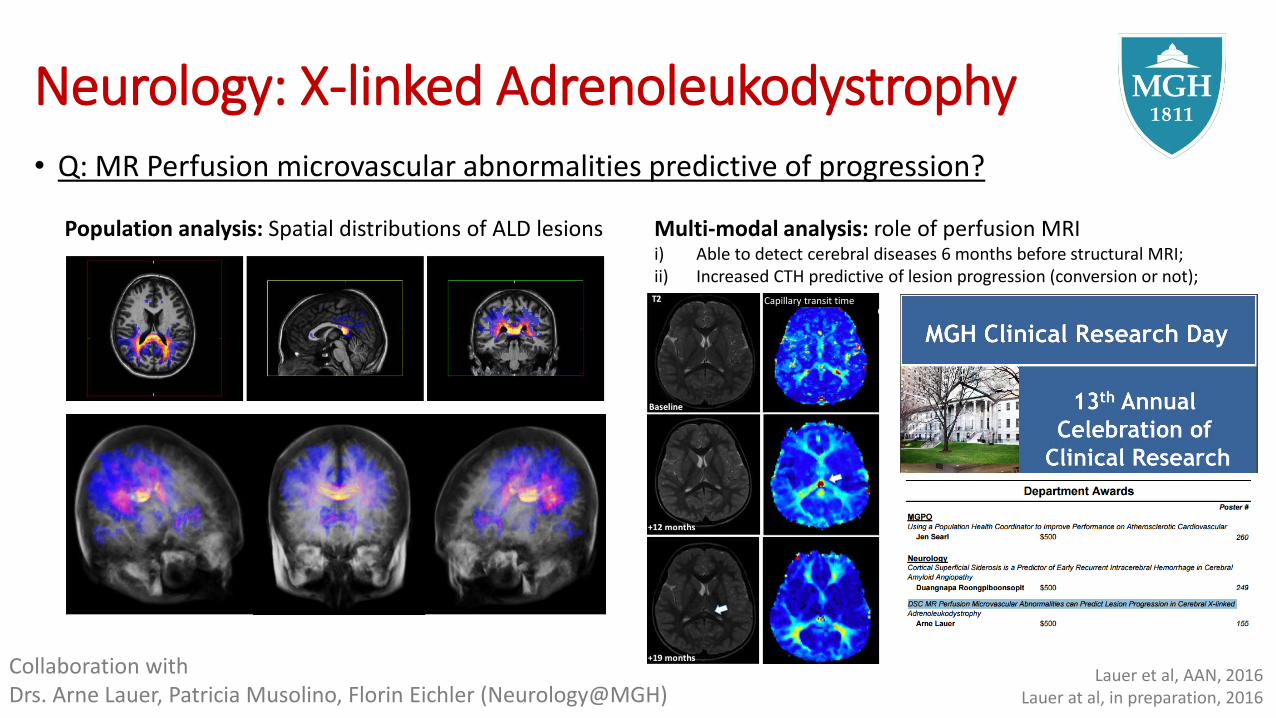
• Q: MR Perfusion microvascular abnormalities predictive of progression?
Neurology: X-linked Adrenoleukodystrophy
Multi-modal analysis: role of perfusion MRIi) Able to detect cerebral diseases 6 months before structural MRI;ii) Increased CTH predictive of lesion progression (conversion or not);
Population analysis: Spatial distributions of ALD lesions
Collaboration with Drs. Arne Lauer, Patricia Musolino, Florin Eichler (Neurology@MGH)
Lauer et al, AAN, 2016Lauer at al, in preparation, 2016
Capillary transit time

Outline• Big Data in Biomedicine why big data clinical images?
• Image Analysis Pipeline how is it possible to analyze clinical images?
• Translational Applications opens up many opportunities.
Early onset of Alzheimer's Disease & Dementia prediction
Survival and molecular subtype prediction in glioblastoma
and image guided neurosurgery
Prediction of X-linked Adrenoleukodystrophy progression
Many many more
Glioblastoma
ALD

Pattern Recognition for disease classification
Many many more
MGH GBM atlas VS Penn GBM atlas
Longitudinal change of tumor
OCT VS 13T
7T MRI
Functional near-infrared spectroscopyBrain Imaging
DCE MRI evaluating the treatment of Breast MetsPET enables visualization of drug delivery in GBM
Perfusion MRI guides therapy
Multiparametric MRI predictspseudo progression and recurrence

Many many moreNeurodegeneration Neuro-oncology
Neuropsychiatry
Metabolic DiseaseBrain Development

Far far away from solving the problem,but, a good step
Research-oriented images Clinically-acquired images
Reality HopeOpportunity

40

Thank you!MGH & BWH & McLean
Supervisors
Jayashree Kalpathy-Cramer
Elizabeth Gerstner
Yangming Ou
Bruce Rosen
Colleagues (Neurology)
Arne Lauer
Patricia Musolino
Florin Eichler
Colleagues (Radiology)
Otto Rapalino
Teammates
Yi-fen Yen
Xuezhu Cai
Kourosh Jafari Khouzani
Vyashak Chandra
John Evans
Artem Mamonov
Jonathan Cardona
Andrew Beers
University of Pennsylvania
Supervisors
Christos Davatzikos
Kilian Pohl
Colleagues (Breast Cancer)
Mitch Schnall
Susan Weinstein
Emily Conant
Sarah Englander
Jia Wu
Despina Kontos
Colleagues (Alzheimer's)
John Q. Trojanowski
Jon B. Toledo
David A. Wolk
Colleagues (Brain Tumor)
M. Sean Grady
Donald M. O'Rourke
Michel Bilello
Luke Macyszyn
Ragini Verma
Ali Gooya
Teammates
Yangming Ou
Andrea Schuh
Aris Sotiras
Guray Erus
Jimit Doshi
Hamed Akbari
Harsha Battapady
Vanessa Clark
Harini Eavani
Bilwaj Gaonkar
Meng-Kang Hsieh
Madhura Ingalhalikar
Dongjin Kwon
Erdem Varol
Dong Hye Ye
Aoyan Dong
Ke Zeng
Mohamad Habes
Vanessa Wallace
Colleagues (BWH)
Andrey Fedorov
Steve Pieper
Colleagues (McLean)
Yunjie Tong
Tufts
Advisors
Sergio Fantini
Angelo Sassaroli
University of Maryland
Shari Waldstein
Stanford
Kilian PohlDongjin Kwon
UCLA
Luke MacyszynBilwaj Gaonkar


![[TUT]MTK Android (Sp Flash Tool ) Tutorial - Xda-Developers](https://img.pdfslide.net/doc/110x75/552b69da550346a1478b466a/tutmtk-android-sp-flash-tool-tutorial-xda-developers.jpg)


![[GUIDE] Link2SD for Dummies _ Samsung Galaxy Young - Xda-Developers](https://img.pdfslide.net/doc/110x75/55cf981e550346d03395b3ef/guide-link2sd-for-dummies-samsung-galaxy-young-xda-developers.jpg)