Embed Size (px)
Citation preview

THE OCULAR SURFACE / APRIL 2005, VOL. 3, NO. 2 / www.theocularsurface.com 81
Assessment of Tear Film Dynamics:Quantification Approach
ALAN TOMLINSON, PHD, DSC, FCOPTOM, AND SANTOSH KHANAL, BSC
Accepted for publication February 2005
From the Department of Vision Sciences, Glasgow Caledonian University,Glasgow, Scotland, UK
Single copy reprint requests to: Professor Alan Tomlinson (address below).
Corresponding author: Professor Alan Tomlinson, Glasgow Caledonian University,Department of Vision Sciences, Cowcaddens Road, Glasgow G4 0BA, UK. Tel. No.0141 331 3380; Fax No. 0141 331 3387; Email: [email protected].
The authors have no financial interest in any concept or product men-tioned in this article.
Abbreviations are printed in boldface where they first appear with theirdefinitions.
©2005 Ethis Communications, Inc. The Ocular Surface ISSN: 1542-0124. Tomlinson A, Khanal S. Assessment of Tear Film Dynamics:Quantification Approach. 2005;3(2):81-95.
Clinical Science
A
GARY N. FOULKS, MD, SECTION EDITOR
ABSTRACT The dynamics of the tear film are reviewed withspecific reference to the biophysical aspects: distribution, turn-over and elimination through evaporation, drainage, and absorp-tion. The review concentrates on quantitative assessments andis confined to aspects of the dynamics that can be fully anddirectly measured. The techniques of fluorophotometry, fluo-rescein clearance, lacrimal scintigraphy, evaporimetry and os-mometry are described. Reports in the literature for values oftear turnover (flow), evaporation and osmolarity for normal anddry eyes are collated. Indices of tear film dynamics based onthese measurements, including tear function index, total tearflow, and osmolarity, are discussed in relation to their potentialin the differential diagnosis of dry eye and new referent valuesfor the disease suggested. The limitations of derivation andapplication of these indices are discussed.
KEYWORDS absorption, distribution, evaporation, osmolarity,tear dynamics, tear indices, tear turnover
I. INTRODUCTIONcomplete tear film is essential for the health andfunction of the eye. Normal tear film dynamicsrequire adequate production of tears, retention on
the ocular surface, and balanced elimination. Disruptionof any of these components can lead to the condition ofdry eye. This review will focus on the biophysical aspectsof tears. The approach will be essentially quantitative and
will concentrate on the aspects of tear film dynamics thatcan be most fully and directly measured; therefore, it willconsider the distribution, turnover (and drainage), evapo-ration, and absorption of tears (Figure 1). It will addresslaboratory techniques for the assessment of the tear filmrather than the more conventional clinical approachesfound in much of the literature. In addition, the dynamicbalance of these elements will be considered through asingle parameter—that of tear film osmolarity. Consider-ation will be given to this and other indices of tear filmdynamics. The indices will be used in an attempt to definedynamics in the normal healthy eye and differentiate themfrom those in the dry eye.
II. TEAR DISTRIBUTIONTears are produced principally by the lacrimal gland
under the influence of the parasympathetic and sympa-thetic nerves.1 Traditional methods of measuring tear pro-duction are based on absorption of tears2 by Schirmerstrips3 or cotton threads.4 Both tests are poor quantifiersof tear production; the Schirmer test is marred by low speci-ficity and sensitivity,2,5 and the exact parameter measuredwith the cotton thread test has been questioned.6 Althoughsuch tests have clinical utility, particularly in the diagnosisof aqueous deficienct dry eye from the normal,7 they offeronly an indirect measure of tear production8 and are oflimited use in the quantification of tear dynamics.
The distribution of tear fluid on the ocular surface is de-pendent on the lid blink.9 Lid closure on blinking proceedsfrom the temporal to the nasal side of the eye, spreading tearsacross the ocular surface and facilitating drainage throughthe lacrimal puncta.10 The interblink time in normal indi-viduals averages 4 ± 2 secs and is significantly decreased inpatients with dry eye (1.5 ± 0.9 secs),9 the blink rate beingincreased in dry eye patients to maximize the tear supply tothe ocular surface.11 In concentrated, close reading tasks, theblink rate drops under relaxed conditions by about one half(from 22.4 ± 8.9/mins to 10.5 ± 6.5/mins).12
The distribution of tear film can be observed dynami-cally with use of thin film interferometry. This technique,originated by Doane,13,14 allows observation of the in vivotear film through the application of the principle of thinfilm interferometry. Interference fringes are produced bylight reflected at the air-lipid and at the lipid-aqueous

THE OCULAR SURFACE / APRIL 2005, VOL. 3, NO. 2 / www.theocularsurface.com82
boundaries of the tear film, due to the changes in refrac-tive index. Specular reflection from the lipid layer pre-cludes a clear view of the aqueous layer of the precornealtear film, although where the lipid layer is very thin orabsent, fringes can be observed from the aqueous phase.15
Lipid layer interferometry was developed through thework of McDonald,16 Hamano et al,17 Norn,18 andGuillon.19 A dynamic interferometry system was first de-scribed by Doane.13 A number of clinical instruments havebeen developed based on this optical principle, includingthe Tearscope described by Guillon and Guillon,20 andinstruments developed by Doane13 and by Gotoand Tseng.21,22 A number of qualitative grad-ing systems for the tear film have been proposedfor these instruments.20,23,24 These are usefulfor looking at structure of the tear film, and theyoffer some insight into its stability.24 Significantdifferences in appearance (and grade) have beenobserved in dry eye conditions, with the partialor complete absence of the lipid layer being afeature (Figures 2 and 3).25
The development of a quantitative approachto the analysis of interferometric images fromthe tear film of normal and dry eye patients owesmuch to the work of Goto and Tseng.22 Gotoand Tseng, with the use a kinetic analysis of se-quential interference images, were able to recordthe lipid spread time of tears in normal and dryeye patients. This spread time, defined by theinterval necessary for the lipid film to reach astable interference image, was 2.17 ± 1.09 secsin the aqueous tear deficiency state, significantlyslower than that recorded for normal eyes (0.36± 0.22 secs [Figures 2 and 3]).21,22 Because ofthis slower spread time, the resultant lipid filmwas found to be thicker on the inferior cornea
than on the superior cornea,22 the thickness being mea-sured from a “look-up” simulated color chart obtained fromthe reflectance of thin film interference generated by a whitelight source.26 Tear film particle movement, as an indica-tor of the time necessary to obtain stability of the tear filmafter the blink, had previously been used by Owens andPhilips.27 Almost 90% of Goto and Tseng’s patients withaqueous tear deficiency showed vertical streaking, ratherthan a normal horizontal propagation of the interferomet-ric pattern on the superior cornea.22 Owens and Philipsmeasured the displacement of tear film particles just aftera blink and found the time necessary to reach zero veloc-ity (tear stabilization time) to be 1.05 ± 0.3 secs.27 Theobserved particles were thought to be accumulations ofnewly secreted lipid from the meibomian glands.
A commercial thin film interferometer (DR-1, KowaCo Ltd, Japan) was developed by Yokoi and Komuro.28 Inthis apparatus, the specular reflection from the tear sur-face is imaged with a video camera, observed on a TVmonitor, and recorded digitally. Yokoi et al have devel-oped a classification system for grading interference pat-
OUTLINE
I. IntroductionII. Tear distributionIII. Tear turnover and drainage
A. FluorophotometryB. Fluorescein clearance testsC. Lacrimal scintigraphy
IV. Absorption of tears into the ocular tissueV. Evaporation of the tear filmVI. Tear film osmolarityVII. Tear film dynamics and ageVIII. Indices of tear film dynamics
A. Tear function index for tear film dynamicsB. Total tear flow as an index of tear dynamicsC. Tear osmolarity as an index of tear film dynamicsD. Other indices of tear film dynamics
IX. Conclusion
Figure 2. Series of thin film interferometry images obtained by the dynamictechnique of Doane13 from a normal asymptomatic subject. The images areobtained at 1 sec intervals, following a blink. The lipid layer of the normal tearfilm reaches a relatively stable pattern within the first second after the blink(consistent with the lipid spread time measurements of Goto and Tseng22).This pattern is then stable for about 6 secs.
Figure 1. Diagrammatic representation of the input and output com-ponents of the tear system.
TEAR FILM DYNAMICS / Tomlinson and Khanal
THE OCULAR SURFACE / APRIL 2005, VOL. 3, NO. 2 / www.theocularsurface.com 83
terns observed from the tear film23;their research has shown that thickerlipid layers are associated with greatertear film stability.28 Grading systemshave also been developed by Guillonand Guillon,20 by Mathers et al,29 byForst,30 and by Thai et al.24 Mostgrading systems assess the uniformityof the interference fringe pattern; thechange in color and loss of uniformityin distribution indicate tear film in-stability. Such patterns are found morecommonly in dry eyes,28,30 whichshow reduced break-up times, a thin-ner lipid layer, and reduced stability.
Assessment of the reflected imagesfrom the cornea and tear film havebeen used to assess tear film qualityand stabilization following the blink.Nemeth et al employed a high-speedvideotopographic technique to assessthe regularity indices (surface regu-larity index [SRI]), and (surfaceasymmetry index [SAI]) in the timeinterval following a blink.31 They observed that the SRIand SAI decreased in the first few seconds after a blink,which implied that, after eyelid opening, it took the tearfilm some time to build up and reach its highest regularityand optical quality. In healthy eyes, tear film build-up timeaveraged 5-7 secs after the blink. A similar measurementwas observed in dry eye patients.
Surface regularity indices have been used by others32 toassess the severity of keratoconjunctivitis sicca, with the Tomeycomputerized videokeratoscopy instrument. The SRI, SAI andthe irregular astigmatism index (IAI) were found to be sig-nificantly correlated with the results of standard diagnostictests (i.e., symptoms, tear break-up time, Schirmer I test, fluo-rescein staining score, and best corrected visual acuity).32
These studies suggest that videotopographic techniques offerthe possibility of quantitative measurement of tear film dy-namics that may have clinical value in the management ofocular surface disorders.31,32
III. TEAR TURNOVER AND DRAINAGEA. Fluorophotometry
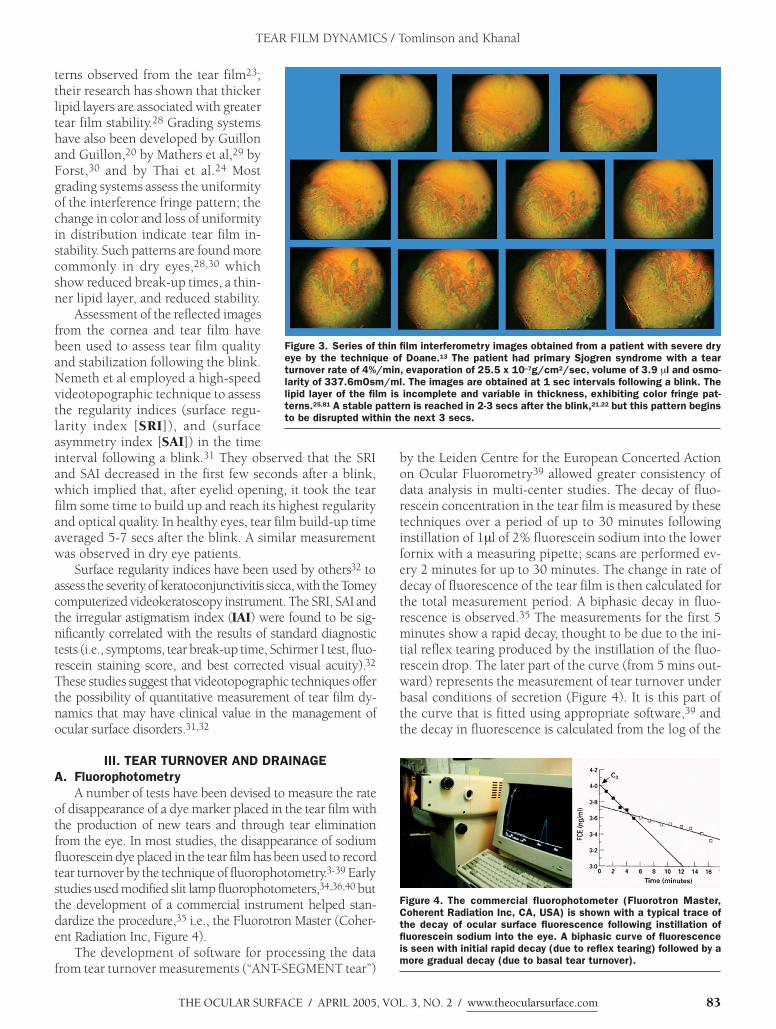
A number of tests have been devised to measure the rateof disappearance of a dye marker placed in the tear film withthe production of new tears and through tear eliminationfrom the eye. In most studies, the disappearance of sodiumfluorescein dye placed in the tear film has been used to recordtear turnover by the technique of fluorophotometry.3-39 Earlystudies used modified slit lamp fluorophotometers,34,36,40 butthe development of a commercial instrument helped stan-dardize the procedure,35 i.e., the Fluorotron Master (Coher-ent Radiation Inc, Figure 4).
The development of software for processing the datafrom tear turnover measurements (“ANT-SEGMENT tear”)
by the Leiden Centre for the European Concerted Actionon Ocular Fluorometry39 allowed greater consistency ofdata analysis in multi-center studies. The decay of fluo-rescein concentration in the tear film is measured by thesetechniques over a period of up to 30 minutes followinginstillation of 1!l of 2% fluorescein sodium into the lowerfornix with a measuring pipette; scans are performed ev-ery 2 minutes for up to 30 minutes. The change in rate ofdecay of fluorescence of the tear film is then calculated forthe total measurement period. A biphasic decay in fluo-rescence is observed.35 The measurements for the first 5minutes show a rapid decay, thought to be due to the ini-tial reflex tearing produced by the instillation of the fluo-rescein drop. The later part of the curve (from 5 mins out-ward) represents the measurement of tear turnover underbasal conditions of secretion (Figure 4). It is this part ofthe curve that is fitted using appropriate software,39 andthe decay in fluorescence is calculated from the log of the
Figure 4. The commercial fluorophotometer (Fluorotron Master,Coherent Radiation Inc, CA, USA) is shown with a typical trace ofthe decay of ocular surface fluorescence following instillation offluorescein sodium into the eye. A biphasic curve of fluorescenceis seen with initial rapid decay (due to reflex tearing) followed by amore gradual decay (due to basal tear turnover).
Figure 3. Series of thin film interferometry images obtained from a patient with severe dryeye by the technique of Doane.13 The patient had primary Sjogren syndrome with a tearturnover rate of 4%/min, evaporation of 25.5 x 10⁻⁷g/cm2/sec, volume of 3.9 !l and osmo-larity of 337.6mOsm/ml. The images are obtained at 1 sec intervals following a blink. Thelipid layer of the film is incomplete and variable in thickness, exhibiting color fringe pat-terns.25,81 A stable pattern is reached in 2-3 secs after the blink,21,22 but this pattern beginsto be disrupted within the next 3 secs.
TEAR FILM DYNAMICS / Tomlinson and Khanal

THE OCULAR SURFACE / APRIL 2005, VOL. 3, NO. 2 / www.theocularsurface.com84
curve obtained from the formula below to obtain the basaltear turnover rate;
T0(t0) = 100 [Ct(t0) – Ct(t0+1)] (%/min)Ct(t0)
Where Ct(t) = fluorescein concentration in tear film attime t(min).
Assuming a monophasic decay of fluorescence from 5mins post-instillation with a decay time constant " (min-1)
Ct(t) = Ct (0).e"t (ng/ml)
the following is obtained:
Tt(t0) = 100 (l – e"t) (%/min)
This gives a measurement of the tear turnover recordedin % per minute. In order to express the turnover value interms of the !l/min (sometimes called “flow”), it is neces-sary to either assume a value for the tear volume (typically7!l40) or to measure the volume from the initial dilutionof the instilled sodium fluorescein in the tears. Initial di-lution is calculated by back extrapolation to time zero ofthe initial fluorescence decay. In this technique, it is themonophasic decay of fluorescence inthe first 5 minutes after instillation ofthe fluorescein that is deter-mined.39,41 Tear volume is derivedfrom the formula40:
Vt = (Cd.Cm-1.k-1-1) Vd
Where Cd = Fluorescein concentra-tion in the drop
Cm = Initial fluorescein concentrationcalculated by back extrapolationwith the Fluorotron in ng/ml.
k = Correction factor (k = 250) forthe limited spatial resolution ofthe Fluorotron
Vd = Drop volume in ml.
The turnover in !l/min is then cal-culated from the product of tear turn-over in %/min and tear volume. Thevalues reported for tear turnover (%/min) and tear flow (!l/min) in a num-ber of studies using the commercialfluorophotometer are collated in Table1.38,40,42-47 Values in this Table are fornormal eyes and those with differentcategories of dry eye. The data re-ported for normals in the majority ofstudies range from 10-20 %/min,which equates to a tear flow rate ofjust over 1!l/min.38-40,42,44,45 In con-
trast, Mathers et al46 found normal tear turnover in theorder of 7%/min or 0.19!l/min, values not dissimilar tothose found for dry eyes. The difference in values fornormals still remains to be reconciled,47 but later reportsby this group suggest a difference in their calculations pro-ducing higher values in the range of 0.34-0.49 !l/min47,48
The values reported for tear turnover rate in dry eye(aqueous tear deficiency with or without meibomiangland dysfunction) are in the order of a half to a fifth ofthose for normals found by other researchers37,38 andin our laboratory (Khanal S, Tomlinson A, unpublisheddata). Therefore, tear turnover is an ideal measurementfor the differential diagnosis of dry eye, particularly inthose cases with some element of aqueous deficiency inthe etiology.
B. Fluorescein clearance testsBecause fluorophotometry with the commercial instru-
ment is costly and time-consuming,49 simpler clinical testshave been developed which use the same principle of dyedisappearance.50-52 The technique developed by Xu andTsubota52 is a modification of the Schirmer test with anes-thesia. The tear clearance rate is obtained after a 10!l dropof 0.5% fluorescein and 0.4% oxybuprocaine has beeninstilled into the conjunctival sac and the subjects have
Table 1. Tear Turnover Rate. Shows values of tear turnover rate for normaland dry eyes reported in the literature (1992–2004), as measuredby the technique of fluorophotometry. Patients classified as dry eyegenerally have some degree of aqueous tear deficiency and thosewith MGD (meibomian gland dysfunction) an element of evaporativedry eye.
Report Type/No subjects Tear Flow (ml/min) TTR (%/min)
Kok et al42 Normals (n=25) 1.06 ± 0.34* 15.2 ± 4.9
Van Best et al39 Normals (n=48) 1.15 ± 0.31 16.4 ± 4.4
Goebbels et al38 Normals (n=20) 1.20 ± 0.5 22.2 ± 0.9
Sahlin, Chen43 Normals (n=43) 0.76 ± 0.22* 10.9 ± 3.1
Tomlinson et al6 Normals (n=20) 1.47 ± 0.77* 21.4 ± 11.1
Tomlinson et al44 Normals (n=9) 1.16 ± 0.47* 16.6 ± 6.7
Keijser et al45 Normals (n=16) 1.00 ± 0.46* 14.3 ± 6.5
Mathers et al46 Normals (n=72) 0.19 ± 0.19 7 ± 4
Goebbels et al38 Dry eye (n=20) 0.20 ± 0.2 6 ± 6
Mathers et al46 Dry eye (n=37 0.12 ± 0.1 5 ± 3MGD (n=109) 0.14 ± 0.1 7 ± 6
Khanal,Tomlinson Dry eye (n=8) 0.55 ± 0.1 8 ± 3(Current report) MGD (n=6) 0.72 ± 0.4 11 ± 6
TTR= tear turnover rate*Tear flow values estimated from turnover on the basis of a tear volume = 7ml
TEAR FILM DYNAMICS / Tomlinson and Khanal

THE OCULAR SURFACE / APRIL 2005, VOL. 3, NO. 2 / www.theocularsurface.com 85
been instructed to open their eyes for 5 minutes. A stan-dard Schirmer strip is inserted into both eyes, which arethen closed for another 5 minutes. The length of the wetportion is measured, and the intensity of the staining iscompared with the standard color plate for the Schirmertest with anesthesia or the tear clearance rate. The tearclearance rate is determined by the rate at which the colorof the 0.5% fluorescein faded and was graded as 1, 1/2, 1/4, 1/8, 1/16, 1/32, 1/64, 1/128, or 1/256.52 A significantcorrelation was found between the tear clearance and thebasal tear turnover rate and tear flow obtained with fluoro-photometry.52 Each grade of tear clearance showed a 12.5%increase in basal tear turnover rate (i.e. 3.6%/min) and atear flow change of 0.38!l/min.
Afonso et al described an alternative fluorescein clear-ance test in which a CytoFluor II fluorophotometer mea-sured fluorescein concentration in tear samples collectedfrom the inferior tear meniscus 15 minutes after the instil-lation of a 5!l drop of 2% sodium fluorescein.7 This fluo-rescein clearance test showed a greater predictive valuefor symptomatic dry eye (ocular irritation) than theSchirmer I test.53 A fluorescein concentration of 274 units/!l eliminated 80% of normal subjects (specificity) and iden-tified 85% of the abnormal subjects (sensitivity). But theCytoFluron technique still requires an elaborate system oftear collection for analysis with the fluorophotometer andis not readily available in a clinical situation.
Macri et al described an alternative clinical assessmentof fluorescein clearance rate that eliminated the need forthe fluorophotometer.50 In this procedure, the color of thetear meniscus in the lateral third of the lower lid was com-pared visually with one of the colors of a standardizedvisual scale. A score of 3 on the 6-point scale correspondedto a fluorophotometric value of 274 fluorescein units/!l,which had been shown previously to be the threshold be-tween normality and abnormality52; values above 4 indi-cated delayed tear fluorescein clearance and dry eye. Thefluorescein clearance test with the standardized visual scaleshowed a strong correlation with irritation symptoms, cor-neal fluorescein, and Schirmer I test scores and meibomiangland and eyelid pathology.50 The sensitivity of the fluo-rescein clearance test was found to be 67% in diagnosingmeibomian gland dysfunction and 95% in diagnosingaqueous tear deficiency; the specificity was 97%. The di-agnostic precision of the fluorescein clearance test was 78%for meibomian gland dysfunction and 94% for aqueoustear deficiency.50
The tear turnover measured by any of the dye disap-pearance tests, while partially dependent on the rate oftear production, is not a direct or independent measure ofthat production facility.8 In fact, tear turnover is more adirect measurement of tear elimination from the eye bydrainage through the lacrimal drainage system.43 Tear turn-over is not limited by the drainage ability of the lacrimalsystem, which has a mean capacity of 50!l/min,43 wellabove the 1!l/min of recorded turnover in normal eyesunder basal conditions (Table 1).
C. Lacrimal ScintigraphyAnother technique for measurement of tear turnover
and direct observation of tear drainage uses a radioactivedye placed in the tear film. The technique of lacrimalscintillography (or scintigraphy) was first described byRossomondo et al in 1972.53 In this technique, a radioac-tive tracer, such as technetium 99 (99M Tc), is introducedinto the lower marginal tear strip (0.013 mls54). The dis-tribution of the tracer is imaged serially by a gamma cam-era (Ohio Nuclear Series 100) as it passes down the lacri-mal drainage system (Figure 5A and 5B). Images are typi-cally taken every 10 seconds for 1 minute and then at lessfrequent intervals until all of the tracer has drained intothe nasal cavity. The system has been used to quantify tearturnover from the eye and drainage through the lacrimalsystem.54-56 Drainage through the system is not linear, asa significant number of normal nasolacrimal ducts offerphysiological obstruction to tear flow (Figure 5C).55
A number of models have been used to analyze flow ordrainage from the system.56 Hilditch et al have observedthat in the asymptomatic lacrimal system, variable tear flowis a normal feature of the drainage facility.56 Therefore,such systems cannot be analyzed by a linear compartmen-tal model. Hilditch et al have proposed a compartmentalmodel for the analysis of lacrimal scintigraphy data, in-corporating separate components for the conjunctival sac,lacrimal sac, the nasal lacrimal duct, and the nasal cav-ity.56 Although most quantitative lacrimal scintigraphymeasurements describe the transit time of the radioactivetracer through the system, this compartmental model hasbeen used to estimate tear flow.56 On the assumption thatthe slow component of clearance from the conjunctivalsac represents the net fractional turnover of that compart-ment, and taking a compartmental volume of 7!l, a meantear flow of 0.45!l/min is estimated.
An alternative calculation based on the four compart-mental model estimates tear flow in the order of 1 to 8!l/min.56 Using a single compartment model for decay of theradioactive tracer on the conjunctival surface, Craig andTomlinson recorded mean values of reflex and basal turn-over of 3.33 ± 1.95!l/min and 0.56 ± 0.32!l /min bygamma scintigraphy.57 Lacrimal scintigraphy, despite itsadvantage in providing visual evidence of the drainagethrough the lacrimal drainage system, is extremely expen-sive, with its dependence on the availability of a gamma cam-era, and Institutional Review Board approval is required forthe use of radioactive substances in normal eyes. As a result,this technique has not been widely used since the introduc-tion of the commercial fluorophotometer systems.
The mechanism of lacrimal drainage and the influence ofblinking on the mechanics of the system have been observedby high-speed photography58 and by intracanalicular pres-sure measurements.59,60 An anatomical approach has beenadopted by Paulsen et al, who studied 31 lacrimal systemsobtained from the heads of adults during surgical procedureson cadavers.61 They observed that the surrounding vascularplexus of the lacrimal sac and the nasal lacrimal duct is com-
TEAR FILM DYNAMICS / Tomlinson and Khanal

THE OCULAR SURFACE / APRIL 2005, VOL. 3, NO. 2 / www.theocularsurface.com86
parable to a “cavernous body.” While regulating the bloodflow, the specialized blood vessels of this body permit open-ing and closing of the lumen of the lacrimal passage, which iseffected by the bulging and subsiding of the cavernous body.Thus, it regulates tear outflow from the eye.61 Attempts havebeen made to quantify the regulation of tear outflow by mea-surement of the transit time of a fluorescein drop from theconjunctival sac into the inferior meatus of the nose.62 Appli-cation of a decongestant drug or placement of a foreign bodyon the ocular surface both prolonged the dye transit timesignificantly, indicating a restriction in drainage through thelacrimal system in these conditions. Paulsen et al concludedthat the cavernous body of the lacrimal sac and nasal lacri-mal duct63 plays an important role in the physiology of tearoutflow regulation; it is subject to autonomic control and isintegrated into a complex neural reflex feedback mechanismbetween the blood vessels, the cavernous body, and the ocu-lar surface.62
IV. ABSORPTION OF TEARS INTOTHE OCULAR TISSUE
Another method by which tears can be eliminated fromthe eye is by absorption into the tissues of the ocular surfaceand the drainage system. The possibility has been suggestedthat tear fluid is absorbed by the epithelial lining of the drain-age system before it reaches the nose.64It has been shown inan animal model that lipophilic substances are absorbed fromthe tear fluid by the epithelium of the nasolacrimal duct63
and that the cavernous body surrounding this duct may playa role in drainage of absorbed fluid.65 No quantification offluid volume eliminated by this route has been reported.However, tears absorbed in the blood vessels of the cavern-ous body may, because these vessels connect to the bloodvessels of the outer eye, act in a biofeedback mechanism fortear production.65,66
Observations of the absorption of tear film onto theanterior ocular surface have been made in relation to stud-ies of corneal permeability.67,68 The proportion absorbed
in the absence of compromised corneal function appearsto be small at 0.24! ± 0.13% of the dye instilled in the eye(Paugh JR: personal communication). Reports of absorp-tion of tear fluid into the ocular surface during measure-ments of tear turnover by fluorophotometry are contra-dictory. Measurement of corneal or conjunctival absorp-tion is dependent on the observations of the absorption ofthe dye tracer used in fluorophotometry. The assumptionis made that the rate of absorption of tear fluid is the sameas the rate of absorption of the fluorescein dye. This is
Figure 6. The effect of absorption of the fluorescein into the sur-face observed with the fluorophotometer is to decrease the appar-ent decay rate of fluorescence in the latter stages of measurement(A). The effect is demonstrated by the turnover rates obtained in aseries of eyes in which measurements were taken from the nakedcornea (with Fluorosoft, a lower molecular weight fluorescein), fromcorneas wearing hydrogel contact lenses, which absorbed theFluorosoft dye, and from corneas with hydrogel lenses, which didnot absorb a high molecular weight FITC- Dextran dye (B). Absorp-tion of the Fluorosoft dye into the hydrogel lens reduced the appar-ent rate of tear turnover in the center plot.
TEAR FILM DYNAMICS / Tomlinson and Khanal
Figure 5. Shows the gamma camera (A) used in the recording of intensity of a radioactive dye at various stages as it passes through thelacrimal system (B). In many cases of normal systems, the tracer does not proceed beyond the lacrimal sac (C).55,57

THE OCULAR SURFACE / APRIL 2005, VOL. 3, NO. 2 / www.theocularsurface.com 87
unlikely, given the different molecu-lar size of the two solutions. Surfaceabsorption of fluorescein duringfluorophotometry can have markedeffects on the apparent rate of decayof fluorescence from the tear film. Ab-sorption and retention of fluoresceindye on the ocular surface will artifi-cially raise the fluorescence values ob-tained over the later period of mea-surement (beyond 15 minutes postinstillation), thus decreasing the slopeof the curve and apparent rate of tearturnover (Figure 6). Miller has ob-served that this retention of fluoresceincould increase the time necessary toremove 95% of the initial fluorescein concentration on theeye (T95) by a factor of 2.69 The tear elimination times forsodium fluorescein is about 20 minutes, whereas values forthe FITC-Dextran (with a molecular size that cannot be ab-sorbed by the ocular surface) are in the order of 11 min-utes.69
The effect of absorption of the dye marker influorophotometric measurement of tear turnover has beenillustrated by recent experiments with absorption of dyeinto a contact lens on the eye.70 In an experiment in whichlower molecular weight fluorescein (Fluorosoft; MW630Da) is absorbed into a soft contact lens, the apparenttear turnover rate was reduced by almost half comparedto values for the naked cornea or for those obtained withhigh molecular weight FITC-Dextran (MW 70,000Da [Fig-ure 6]). The FITC-Dextran is not absorbed into the con-tact lens. These findings are at odds with a previous re-port of MacDonald and Maurice71 that disappearance offluorescein into the ocular tissue increased the apparentrate of fluorescein decay, compared to that measured witha high molecular rhodamine dextran tracer which was notabsorbed into the ocular surface.
V. EVAPORATION OF THE TEAR FILMEvaporation from the ocular surface is very effectively
reduced by the lipid barrier composed of polar lipids.72
In conditions of 30% humidity at temperatures of 34ºC,the evaporation of water from an open bath is 160 x 10-
7g/cm2/sec.73 The polar lipids of the ocular tear film re-duces this by about 80-90% in the normal eye. Evapora-tion of fluid from the ocular tear film have been measuredby numerous investigators since the first report in 1980by Hamano et al.74 Their original device was disruptive tothe tear film, as it required the measurement chamber to beplaced close to the ocular surface, thus preventing normalblinking and tear redistribution. In 1982, Tomlinson andCedarstaff employed the technique of resistance hygrometryto measure tear film evaporation within a goggle, a techniquethat allowed the normal blink mechanism to apply.75 Thistechnique was based on the principle that the increase inelectrical resistance of air passed over the eye was a direct
measure of the increase in fluid content (humidity) of thatair, due to evaporation from the surfaces within the goggle.
The technique of measuring the humidity of air insidea sealed goggle has also been employed by Rolando andRefojo (1983),76 Tsubota and Yamada (1990),77 andMathers et al (1993).78 Recently the technique was fur-ther refined by Goto et al, who used microbalance tech-nology to allow “continuous readings” of tear film evapo-ration.79 The measurement of the vapor pressure gradientcalculated from the relative humidity and temperature attwo points above an evaporating ocular tear film is a tech-nique developed later by Trees and Tomlinson in 199080
and subsequently used in our laboratory (Figure 7).44,80,81
Tear film evaporation rate has been reported in differ-ent units by various researchers80-83; most use units ofx10-7g/cm2/sec, but others report values in g/m2/hr. Thisdifference may be resolved and all values rendered to thesame units (x10-7g/cm2/sec) by dividing values in g/m2/hr by a factor of 3.6. The values of evaporation rates re-corded for normal and dry eyes are collated in Table 2.Evaporation rate is also reported in units of !l/min by someresearchers.79,82 The evaporation rate in !l/min is numeri-cally equal to 1/100 of the value of the evaporation ratestated in units of 10-7g/cm2/sec when the area of the evapo-rating ocular surface is 167mm2. The use of different tech-niques for measurement of tear film evaporation makes itdifficult to compare findings in normal and dry eyes amongdifferent studies because the absolute values recorded aretechnique-dependent. However, there is a pattern to theobservations reported in the literature, with significantincreases from normal tear film evaporation seen in pa-tients with both aqueous tear deficiency dry eye andmeibomian gland dysfunction (Table 2).46,47,76-78,82,84
Strictly, these comparative differences are of diagnostic sig-nificance only where values in normals and dry eye arerecorded by the same technique in the same laboratory.
Mishima and Maurice in 1961 were the first to establishthat the lipid layer retarded evaporation in an animal modelof the rabbit eye.85 Iwata et al developed another in vitrorabbit model with a cornea covered with a chamber throughwhich dry air was passed; from the weight of water collected,
Figure 7. Tear film evaporation rate measured by a modified ServoMed EP-3 (Kinna, Sweden)evaporimeter. This technique involves the measurement of vapor pressure gradient from record-ings of relative humidity and temperature at two points above the ocular surface.80
TEAR FILM DYNAMICS / Tomlinson and Khanal

THE OCULAR SURFACE / APRIL 2005, VOL. 3, NO. 2 / www.theocularsurface.com88
they determined the evaporative rate as 10.1 x 10⁻⁷g/cm2/sec.86 They found that a four-fold increase in evaporationoccurred with the removal of the rabbit’s tear film lipid layer.
A similar increase in human tear film evaporation wasmeasured by Craig and Tomlinson in patients with incom-plete or absent lipid layers.81 Evaporation measurement isimportant in the differential diagnosis of dry eye. A numberof studies, as well as findings in our laboratory, report mea-surement of tear film evaporation in aqueous deficient andmeibomian gland dysfunction patients.46,47,76-78,82,84 In mostcases, the evaporation rate is greater in the dry eye than in thenormal eye, as the increased water loss from the tear filmcontributes to the dry eye condition. In one study, almost90% of the dry eye patients showed lower readings of tearfilm evaporation than normals.77 This was explained by con-sidering the relative contribution of tear evaporation to teardynamics in the dry eye condition; the proportional lossthrough evaporation in the dry eye was greater than innormals, although the actual water loss (in absolute terms)was decreased compared to normal values. Mathers in a com-
prehensive review of evaporation from the ocular surface hasdiscussed the contribution of evaporation to the total tearflow in the eye.82 In the normal eye (Table 2), the actual lossof fluid from the eye by evaporation is approximately 10-15% of the tear flow or turnover of the system, i.e., averaging0.13!l/min for a tear flow in the order of 1!l/min (Table 1).Dependent on the value accepted for tear turnover rate innormals, the proportion lost through evaporation increases, par-ticularly in the reports of Mathers et al,47,48 where the turnoverrate is measure at 0.2 to 0.49 !l/min. (This issue is further ad-dressed in Section VIII. Indices of tear film dynamics.)
VI. TEAR FILM OSMOLARITYAttempts to quantify tear film dynamics are frustrated
by the lack of direct and independent measurements oflacrimal production, limiting this review to considerationof tear distribution and turnover, evaporation, and drain-age. Knowledge of the elimination that occurs (loss due todrainage and evaporation) gives an estimate of the tear pro-duction, although we lack knowledge of the amount of tear
fluid absorbed into the ocular tissues.Tear osmolarity provides a single mea-surement that may reflect the balanceof input and output from tear dynam-ics. Osmolarity is the end product ofvariations in tear dynamics. Normal ho-meostasis requires regulated tear flow,the primary driver of which is osmolar-ity.87 Tear hyperosmolarity is the pri-mary cause of discomfort, ocular sur-face damage, and inflammation in dryeye.88-92 Therefore, tear film osmo-larity is attractive as a single param-eter of tear film dynamics.
Measurements of osmolarity areobtained from small (0.2 !l) samplesof tears taken from the lower meniscusand placed in a freezing point depres-sion osmometer (Clifton TechnicalPhysics, Hartford, NY, [Figure8]).81,87,88 This osmometer has beenaccepted as the “gold standard” in thediagnosis of dry eye 90,93; a clinical cut-off of 312mOsm is suggested as the di-agnostic level for aqueous deficient andevaporative dry eye.90 Hyperosmolaritycauses surface damage in animal mod-els of aqueous deficient and evapora-tive dry eye92,94; corneal epithelial cellsare damaged by hyperosmolarity invitro92,95 and in vivo.96 The measure-ment of tear film osmolarity from asample taken from the inferior tearmeniscus has been questioned by Bronet al, who suggest that the osmolarityof the precorneal tear film may be higherthan that of the meniscus because the
Table 2. Tear Evaporation Rate. Shows values of tear evaporation rate fornormal and dry eyes reported in the literature (1992 – 2004). Mea-surements are by various techniques. Patients classified as dryeye (DE) generally have some degree of aqueous tear deficiencyand those with MGD (meibomian gland dysfunction) an element ofevaporative dry eye.
Type/ Evaporation EvaporationReport Number subjects x 10–7g/cm–2/s (ml/min)
Tsubota,Yamada77 Normals (n=40) 15.6 ± 3.8 0.16 ± 0.04
Mathers et al46 Normals (n=72) 15.1 ± 8.6 0.15 ± 0.09
Mathers 83 Normals (n=20) 14.8 ± 6 0.15 ± 0.07
Shimazaki et al84 Normals (n=24) 13.1 ± 6 0.13 ± 0.05
Mathers, Daley47 Normals (n=34) 13.0 ± 6 0.13 ± 0.05
Tomlinson et al43 Normals (n=9) 7.2 ± 3 0.07 ± 0.03
Goto et al79 Normals (n=22) 4.1 ± 1.4 0.04 ± 0.01
Mathers et al46 DE (n=37) 23.9 ± 17.5 0.24 ± 0.18MGD (n=109) 22.8 ± 16.3 0.23 ± 0.16
Mathers83 DE/MGD (n=20) 59.1 ± 28 0.58 ± 0.23MGD (n=24) 49.9 ± 21 0.49 ± 0.29
Shimazaki et al84 MGD (n=37) 14.8 ± 1.5 0.15 ± 0.15
Mathers, Daley47 DE (n=22) 25.0 ± 35 0.25 ± 0.04
Goto et al79 MGD (n=21) 7.6 ± 2.8 0.08 ± 0.03
Tsubota, Yamada77 DE (n=72) 9.5 ± 5.6 0.10 ± 0.06
Khanal, Tomlinson DE (n=8) 14.6 ± 11.3 0.15 ± 0.11(Current report) MGD (n=6) 20.6 ± 7.9 0.21 ± 0.02
TEAR FILM DYNAMICS / Tomlinson and Khanal

THE OCULAR SURFACE / APRIL 2005, VOL. 3, NO. 2 / www.theocularsurface.com 89
preocular tear film may be “compartmentalized” and suscep-tible to greater evaporative fluid loss.97 However, Benjaminand Hill found that the tear fluid from the conjunctival sachad significantly higher osmolarity than that from the infe-rior tear prism.98
The sampling of tear film osmolarity with an instru-ment such as the Clifton freezing point pressure techniqueis technically difficult and requires considerable expertiseto achieve consistency in measurement.99-101 Alternativetechniques have been used to obtain osmolarity values forhuman tear fluid.101-103 The widespread clinical use ofosmometry will require a simpler, quicker and less exper-tise-dependent technique for measurement.104
A number of workers have reported values for tear filmosmolarity in normals and in various dry eye states (Table3). Although there is some overlap in the values betweennormal and dry eye, those for dry eye are higher and os-molarity offers a means for the general diagnosis of dryeye.46,88,90,105 This will be discussed again later.
VII. TEAR FILM DYNAMICS AND AGEChanges with age in the aspects of tear film dynamics
considered in this review have been addressed by a numberof researchers. It is attractive in hypotheses of dry eye to haveage-related changes, even in asymptomatic individuals, whichmay contribute to the increased prevalence of dry eye withage. Mathers et al have shown significant correlations withage for tear evaporation, flow, volume and osmolarity in anextensive series of normal and dry eye patients.106 But fornormal (asymptomatic of dry eye) populations, age does notappear to be significantly related to changes in evaporation,osmolarity, lipid structure, break-up time, or tear productionrates.57 In other studies, age-related changes have not beenfound for tear evaporation,76,107 turnover,43 osmolality,105
or lipid layer.18 At present, it is difficult to resolve these con-flicting reports. It is possible that work that shows age-re-lated effects for tear parameters measured on consecutive pa-tients in a corneal service of a hospital46 may be susceptibleto the participation bias observed by Schein et al108 in dryeye studies of clinic-based popoulations. However, this couldbe true of other studies as well.43,76 However this issue isresolved, and despite the fact that the prevalence of dry eyeconditions increases in older age groups, it is important toaccount for the overwhelming majority of older individualswho do not develop dry eye.
VIII. INDICES OF TEAR FILM DYNAMICSIt would be useful in the study of dry eye to be able to
describe and quantify tear film dynamics in a single indexthat determines the balance of input and output of thesystem (Figure 1). Such an index could define the imbal-ance that leads to the condition of dry eye. The majorityof the output, and by implication the input, of the lacri-mal system can be determined through measurement oftear turnover and water loss by evaporation. The degreeof elimination due to absorption is more difficult to as-sess. Also the measurement of tear production is difficult
to measure independently and directly.8 Tear film distri-bution on the surface of the eye at this time can only beassessed qualitatively. Despite these difficulties, attemptshave been made to derive indices to describe the tear filmdynamics.
A. Tear function index for tear film dynamicsOne of the earliest indices for tear film dynamics was
the Tear Function Index (TFI) devised by Xu et al.8 Thisindex combined values obtained for tear secretion (fromthe Schirmer test with anesthesia) with measurements fordrainage (turnover as measured by the fluorescein clear-ance test52) in the following formula:
TFI = Schirmer value with anesthesia8,9
Tear clearance rate
This index considered two of the three main factorsdetermining tear dynamics,8 namely, secretion and drain-age; it has been argued that tear secretion is the most im-portant determinant of tear dynamics.8 Moreover, as tearsecretion could not be measured independently and di-rectly, the Schirmer test result had to represent the pro-duction component of dynamics.8
The ability of the TFI to discriminate between normaland dry eye patients, with and without Sjogren syndrome,was found to be considerably better than the Schirmertest or the tear clearance rate values alone.1 A value of thelog to the base 2 of the TFI below 96 gave a sensitivity andspecificity in the diagnosis of dry eye of 67.4% and 60%,respectively. For a value of the log of the TFI below 34,sensitivity and specificity for Sjogren syndrome dry eyewere 78.9% and 91.8%, respectively.8 The major deficiencyof the TFI as an index of tear dynamics is that it fails totake into account the elimination of tear fluid from theeye through evaporation. Evaporation is a key variable indifferentiating some groups of dry eye.48
B. Total tear flow as an index of tear dynamicsRecently, Mathers has suggested an index that captures
the principal sources of elimination of tear fluid from theeye.87 It takes values for drainage, as measured by tear turn-over rate and surface fluid loss by evaporation. Mathers’ in-dex represents “total tear flow” expressed in !l/min, which isobtained by combining rates for evaporation and tear turn-over. As the drainage facility is not necessarily affected in dryeye states,43 the tear flow is determined from tear turnoverrate (effectively a measurement of drainage).43 The combina-tion of tear turnover and evaporation rates gives an estima-tion of the tear production facility of the eye.87 Therefore,dry eye may result when tear flow (turnover) is reduced dueto tear production deficiency (aqueous deficient dry eye) or ahigh level of evaporation (evaporative dry eye) as a result ofmeibomian gland dysfunction or blepharitis. In the assess-ment of the balance of production and outflow from the eye,the proportion of elimination due to evaporation as a part ofthe total tear flow is an essential consideration.
TEAR FILM DYNAMICS / Tomlinson and Khanal

THE OCULAR SURFACE / APRIL 2005, VOL. 3, NO. 2 / www.theocularsurface.com90
In Table 4, the values for tear turn-over and evaporation rates and the to-tal tear flow have been collated from allthe literature between 1992 and 2004,and also for Mathers publications (1993to 2004). The numbers shown in Table4 are weighted averages of the publishedvalues. This approach has been takenbecause the values recorded for tearturnover in normals (Table 1) byMathers and co-workers in some re-ports46,82 are considerably below thoserecorded by others. This affects any at-tempt to define the differences betweennormals and dry eye patients in termsof this Index.
Mathers has reported that approxi-mately one-third of the resting tear flow evaporates in thenormal eye.82,87 This increases to 75% of the total tear flowin the dry eye,87 although the total tear flow in normals anddry eye patients recorded by Mathers is similar at around 0.5!l/min. In a later paper, Mathers reported a percentage lossof tear fluid from the eye through evaporation to be around55% in dry eyes.82 Despite the difference in measurement oftear flow (turnover) rates between Mathers’ group and otherworkers, the total tear flow combined with evaporation as aproportional value still provides a useful index in differenti-ating dry eye. In Table 4, if all the literature is considered, theproportion of evaporation to total tear flow is 14% for normalsand more than 60% for dry eye—regardless of whether thedry eye is due to aqueous deficiency or meibomian glanddysfunction. Mathers’ data (Table 4) suggests that normalshave a proportional value of evaporation to total tear flow ofaround 44% compared to over 60% for the aque-ous deficient dry eye and meibomian gland dys-function groups. Therefore, irrespective of whetherdry eye is due to aqueous tear deficiency ormeibomian gland dysfunction/blepharitis (evapo-rative dry eye), a dry eye syndrome may be indi-cated if the total tear flow is less than 0.5 !l/min,or the proportion of loss due to evaporation, com-pared to the total tear flow, is greater than 50%.
The importance of tear evaporation measure-ment in the definition of dry eye is illustratedby a recent re-analysis by Mathers and Choi48
of the data from the Iowa study, which formedthe basis for earlier papers.82,87 In this later re-port, they applied cluster analysis with hierar-chial clustering (Ward minimum variancemethod109) to determine groupings that corre-sponded to clinically relevant and identifiablediagnoses. Diagnoses of physiologic dry eye andseborrheic or obstructive meibomian gland dys-function were based on physiological param-eters. Using this approach, the subjects in thestudy were divided into nine categories on thebasis of only 5 of the 13 physiological variables.
Interestingly, evaporation was found to be a key variablein differentiating some clusters, suggesting that it is a keyprocess and plays an important role in ocular surface dis-ease.48,78,108 There appears to be no real substitute forevaporation in the ultimate classifications that Mathers hasreported.48
C. Tear osmolarity as an index of tear film dynamicsThe use of a single value for tear osmolarity as an index is
attractive, as it represents the end product of changes in teardynamics.87 However, the use of this value is complicated bythe overlap in values obtained between normal subjects andthose with keratoconjunctivitis sicca; significant overlap oc-curs in values of tear osmolarity between 293 and 320mOsm/L.88 This complicates the choice of a referent value for thediagnosis for dry eye. Farris and Gilbard deliberately chose
TEAR FILM DYNAMICS / Tomlinson and Khanal
Table 3. Tear Osmolarity. Shows values for osmolarity for nor-mal and keratoconjunctivitis sicca patients measured byfreezing point depression nanoliter osmometry. KCS pa-tients classified as dry eye (DE) generally have some de-gree of aqueous tear deficiency and in, extreme cases, pri-mary Sjogren syndrome. Those with meibomian gland dys-function (MGD) have an element of evaporative dry eye.
Tear Film Osmolarity (mOsm/L)
Report Normal KCS (DE, MGD, SS)
Gilbard et al90 302 ± 6 (n=31) 343 ± 32 (DE=38)
Farris et al88 304 ± 8 (n=180) 326 ± 20 (DE=111)
Mathers et al45 303 ± 10 (n=72) 313 ± 9 (DE=37)314 ± 10 (MGD=109)
Craig et al105 305 ± 7 (n=25) 323 ± 15 (DE=17)331 ± 21 (SS=30)
Khanal and Tomlinson 323 ± 17 (DE=8)(Current report) 321 ± 12 (MGD=6)
Figure 8. Freezing point depression osmometry with the Clifton Technical Physics device.(A) Nanoliter samples of tears from the interior tear prism are placed below heavy oil in theapertures of the ‘freezing plate’ by a micromanipulator (B). Cooling of the plate by theinstrument allows direct reading of the osmolality from the instrument at the point atwhich the samples freeze (C).

THE OCULAR SURFACE / APRIL 2005, VOL. 3, NO. 2 / www.theocularsurface.com 91
312mOsm/L to provide maximum sensitivity in diagnosis,88
preferring some possible overdiagnosis to the underdiagnosisthat might result from using maximum specificity. Others havesuggested other referent values for dry eye. Craig has sug-gested values over 320mOsm/L.25 Mathers and Choi sug-gested values = 318mOsm/L48 as the definition for physi-ologic dry eye by a criterion of one standard deviation fromthe mean in their cluster analysis of patients with the condi-tion.108 If the 95% confidence intervals are applied to thedata shown in Table 3, it will be seen that the overlap be-tween normal patients and those with some form of dry eye(Figure 9) is not great. However, it is more difficult to differ-entiate the dry eye subgroups using osmolarity, i.e.,to differ-entiate between aqueous deficient dry eye and meibomiangland dysfunction,46, and between aqueous deficient dry eyewith and without primary Sjogren syndrome.105 It is per-haps not surprising that there is clearer differentiation, byosmolarity, between normal and dry eye than between cat-egories of dry eye, given that osmolarity is the “average” end
product of the disease process and that this end point may besimilar irrespective of the process by which it is achieved.
D. Other indices of tear film dynamicsOther reported indices for tear physiology incorporate
different parameters than those considered in this review anduse techniques of derivation that involve more sophisticatedstatistical analyses. In a study of tear physiology in patientswith rheumatoid arthritis (with and without primary Sjogrensyndrome, Craig25,105 employed discriminant function analy-sis110,111 in an attempt to predict the disease status on thebasis of tear parameters. The initial analysis incorporated tearosmolarity, evaporation, grade of lipid layer structure, break-up time, symptoms, Schirmer test, and rose bengal staining.The development of a discriminant function on the basis ofthese parameters allowed the correct grouping of subjectsinto normals and rheumatoid arthritis (with and without pri-mary Sjogren syndrome) in over 93% of patients. However,this analysis did incorporate two tests, the Schirmer test and
Figure 9. Osmolarity values for normal and dry eye subjects reported in the literature (values shown are for the 95% confidence intervals)for normals. DE = aqueous tear deficiency, MGD = meibomian gland dysfunction, and SS = Sjogren syndrome. (Khanal and Tomlinson,unpublished data, and references45,88,90,105).
TEAR FILM DYNAMICS / Tomlinson and Khanal
Table 4. Total Tear Flow: An Index of Tear Dynamics. The table shows the weighted, average values for rates of tearturnover, evaporation and total tear flow in normal and dry eyes reported in all the literature from 1992–2004and in papers published by Mathers and co-workers (1993–2004). The proportional values of evaporation tototal tear flow for each subject group and data set are calculated. Patients classified as dry eye (DE) generallyhave some degree of aqueous tear deficiency and those with meibomian gland dysfunction (MGD) an elementof evaporative dry eye.
Total Tear Flow*Tear Turnover/ Evaporation (Drainage + Evaporation) Evaporation/
Source of data Drainage (!l/min) (!l/min) (!l/min) Total Tear Flow (%)
Literature 1992-2000 6,38,39,42-47,77,79,83,84
Normals 0.82 0.13 0.95 14 DE 0.15 0.22 0.37 60 MGD 0.14 0.23 0.37 62
Mathers, 1993-2004 46,47,83
Normals 0.19 0.15 0.34 44 DE 0.20 0.24 0.34 67 MGD 0.14 0.23 0.37 62
* Mathers87

THE OCULAR SURFACE / APRIL 2005, VOL. 3, NO. 2 / www.theocularsurface.com92
rose bengal staining, commonly employed by clinicians inthe independent clinical classification of the groups. A dis-criminant analysis with a step-wise variable selection wasperformed without these clinical tests or symptoms in-cluded to determine the most influential objective tearphysiology parameters for predicting group assignment.25
Two functions were derived; Function 1 had the best com-bination of parameters, which were osmolarity, evapora-tion rate, and grade of lipid layer structure. The discrimi-nant function equation is:
Function 1 = 0.06 osmolarity + 0.23 evaporation rate +0.13 lipid grade – 20.61
The overall accuracy in classifying 72 subjects with thisdiscriminant function was 68% when the following cut-offvalues were used: <0.4 for controls =0.4 to 0.5 for rheuma-toid arthritis alone; and >0.5 for rheumatoid arthritis withprimary Sjogren syndrome. Osmolarity was the single bestpredictor, with an overall accuracy of 54%. In distinguishingbetween normal subjects and those with rheumatoid arthri-tis alone, the sensitivity of the discriminant function was 96%and the specificity 87%. For correctly identifying subjectswith rheumatoid arthritis alone, the sensitivity of the func-tion was 60% and the specificity was 81%. For identifyingSjogren syndrome subjects alone, the sensitivity was 41%and the specificity, 84%. The sensitivity of the function waspoorer for diagnosing the rheumatic conditions because ofthe spread of data and the greater degree of overlap betweenthe tear characteristics of the two rheumatic groups. The tearcharacteristics of these two patient groups were more similarto each other than they were to normals.
Clearly, in order to obtain true values for sensitivityand specificity of any discriminant function, it is neces-sary to test the function on independent samples of dryeye and normal patients. It would be instructive to applydiscriminant function analysis to the data obtained for theaspects of tear film dynamics discussed in this review,namely tear turnover rate, tear evaporation rate, and tearosmolarity. Discriminant function analysis is the most ap-propriate technique for discriminating between patientson the basis of measurement where the clinical classifica-tion of the patients is already known.112 In order to dothis, a significant patient sample is required with a fulldata set for all of the parameters. Such data is not cur-rently available to the authors.
Mathers et al46 have applied another form of multivariateanalysis, step-wise linear regression,111 to define a multiplelinear regression model for aspects of tear physiology mea-sured during their seminal study in Iowa of normal and dryeye patients. They used regression analysis to predict osmo-larity and tear evaporation. A regression model for tear os-molarity based on the results on the Schirmer test, evapora-tion rate, gland drop-out, lipid volume, and tear volume (fromfluorophotometry), and age of subject accounted for 47% ofthe variance in tear osmolarity.46
The other form of statistical analysis, cluster analysis,
applied to this same data by Mathers and Choi48 employedhierarchial clustering of the physiological variables thathad been measured. Potential age effects in the physiologi-cal variables had been removed by local polynomial re-gression. This analysis created new classifications that par-tially corresponded to clinically relevant and identifiablediagnoses. The 513 subjects in the study were divided intonine categories on the basis of only 5 of the total of 13variables that had been measured; these variables weregland drop-out, lipid viscosity, evaporation rate, Schirmertest value, and lipid volume. This cluster analysis suggestedthat tear data can be used to classify subjects with similarcharacteristics that have clinical relevance and statisticalvalidity.48 Mathers and Choi argue that the approach placesocular surface disease classification on a stronger scien-tific footing, although the use of cluster analysis is un-usual in a situation where a pre-existing classification ofpatients is available. The range of measurements consid-ered by them goes beyond the basic parameters of tearfilm dynamics discussed in this review, but it would be ofinterest to apply their analysis to data sets of tear turn-over, evaporation rate, and osmolarity.
IX. CONCLUSIONThe diagnosis of dry eye by the assessment of tear film
dynamics has a number of problems associated with it; theseinclude the difficulties of clinical measurements, validity ofany index in the differential diagnosis of dry eye, and the in-ability to capture other aspects of dry eye etiology that are notdirectly associated with the mechanisms of tear dynamics.
The preferred “quantification approach” to tear film dy-namics in this paper involves measurements that are techni-cally difficult to achieve, expensive, and time-consuming, anddo not lend themselves readily to simple clinical assessment.The techniques for measurement of tear turnover rate (byfluorophotometry), tear film evaporation (by evaporimetry)and tear osmolarity by freezing point depression) give themost direct and quantifiable measures of tear film dynamicsavailable to date, but all suffer from the limitations notedabove. Alternative clinical tests are available for two of thesemeasures. Tear distribution has been measured and observedusing a simple clinical device of the Tearscope56 (Keeler,Windsor, UK). Tear turnover can be measured more rapidlyand cost-effectively by the tear clearance tests50,52 with a stan-dardized visual scale for evaluation of tear fluorescein clear-ance.50 These tests are simple and easy to use and have highcorrelations with fluorophotometry results.50,52
Tear evaporation is more difficult to measure with a sur-rogate clinical test. The patency of the meibomian glands ofthe lid, which produce the lipid secretions and which inhibittear evaporation, may be assessed by a slit lamp examinationof the gland orifices,113 by an estimate of gland drop-out withtransillumination of the lower lid,114 or by meibometry, atechnique for assessment of the lipid obtained from the lowerlid.115 However, these clinical tests are not quantifiable asdirect measures of fluid loss in the same way as tear evapora-tion rate. A measure of tear film osmolarity by a rapid and
TEAR FILM DYNAMICS / Tomlinson and Khanal

THE OCULAR SURFACE / APRIL 2005, VOL. 3, NO. 2 / www.theocularsurface.com 93
less expertise-dependent technique must await developmentof new clinically applicable instruments. Such instrumentsare in development,102,104 but are not currently available tosupersede the Clifton nanometer freezing point depressionosmometer. It is true that surface damage in vivo can be pro-duced by hyperosmolarity,96 and correlations between hyper-osmolarity and ocular surface damage have been found.116-
118 However, methods of grading surface damage throughstaining per se are not sufficiently exact to substitute for mea-surement of osmolarity.
The validity of any index for tear film dynamics needsto be validated in the differential diagnosis of dry eye. Thevalidity of the TFI devised by Xu et al,8 demonstrated rela-tively high sensitivities and specificities for diagnoses com-pared to tear clearance and the Schirmer test values alone.However, their assessment of specificity and sensitivityappears to have been carried out on the sample for whichthe cut-off values were originally determined. To assessthe validity of this or any other index, such as total tearflow or osmolarity, assessment must be carried out on anindependent sample of normal and dry eye patients.
Any index of tear film dynamics is necessarily one thatattempts to quantify measures of tear production and elimi-nation and is a somewhat mechanistic index of tear physiol-ogy. As a result, it does not capture the other aspects of theetiologies for dry eye, such as dysfunctional neurology,1 hor-monal influences,119 or the inflammatory nature of the con-dition.120 However, it has the utility that it addresses the es-sential feature of the disease, that of the imbalance of tearphysiology and the resultant “dryness” of the eye.
REFERENCES1. Dartt DA. Dysfunctional neural regulation of lacrimal gland
secretion and its role in the pathogenesis of dry eye syndromes.The Ocular Surface 2004;2:76-88
2. Mishima S, Gasset A, Klyce S, Baum J. Determination of tearvolume and tear flow. Invest Opthalmol 1966;5:264-76
3. Grayson M. The dry eye. St. Louis, CV Mosby, 19794. Hamano H, Hori M, Hamano T, et al. A new method for mea-
suring tears. CLAO J 1983; 9:281-95. Clinch TE, Benedetto DA, Felberg NT, Laibson PR. Schirmer’s
test. A closer look. Arch Ophthalmol 1983;101:1383-66. Tomlinson A, Blades KJ, Pearce EI. What does the phenol red
thread test actually measure? Optom Vis Sci 2001;78:142-67. Afonso AA, Monroy D, Stern ME, et al. Correlation of tear
fluorescein clearance and Schirmer test scores with ocular ir-ritation symptoms. Ophthalmology 1999;106:803-10
8. Xu KP, Yagi Y, Toda I, Tsubota K. Tear function index. A newmeasure of dry eye. Arch Ophthalmol 1995;113:84-8
9. Tsubota K. Tear dynamics and dry eye. Prog Retin Eye Res1998;17:565-96
10. Doane MG. Interactions of eyelids and tears in corneal wet-ting and the dynamics of the normal human eyeblink. Am JOphthalmol 1980;89:507-16
11. Nakamori K, Odawara M, Nakajima T, et al. Blinking is con-trolled primarily by ocular surface conditions. Am JOphthalmol 1997; 124:24-30
12. Tsubota K, Nakamori K. Effects of ocular surface area and blinkrate on tear dynamics. Arch Ophthalmol 1995;113:155-158
13. Doane MG. An instrument for in vivo tear film interferometry.Optom Vis Sci 1989; 66:383-8
14. Doane MG. Turnover and drainage of tears. Ann Ophthalmol1984; 16:111-4
15. Doane MG, Lee ME. Tear film interferometry as a diagnostictool for evaluating normal and dry-eye tear film. Adv ExpMed Biol 1998;438:297-307
16. McDonald JE. Surface phenomena of the tear film. Am JOphthalmol 1969;67:56-64
17. Hamano H, Hori M, Kawabe H, et al. Bio-differential interfer-ence microscope observation on anterior segment of the eye;first report–observations of pre-corneal tear film. J Jpn Con-tact Lens Soc 1979;21:229-38
18. Norn MS. Semi-quantitative interference study of fatty layer ofpre-corneal film. Acta Ophthalmol (Copenh) 1979;57:766-74
19. Guillon JP. Tear film photography and contact lens wear. J BrContact Lens Assoc 1982; 5:84-7
20. Guillon JP, Guillon. The role of tears in contact lens perfor-mance and its measurement, in Guillon M, Ruben M (eds).Contact Lens Practice. Chapman and Hall Medical, London,1994; p 462
21. Goto E, Tseng SC. Differentiation of lipid tear deficiency dryeye by kinetic analysis of tear interference images. ArchOphthalmol 2003;121:173-80
22. Goto E, Tseng SC. Kinetic analysis of tear interference imagesin aqueous tear deficiency dry eye before and after punctalocclusion. Invest Ophthalmol Vis Sci 2003;44:1897-1905
23. Yokoi N, Takehisa Y, Kinoshita S. Correlations of tear lipidlayer interference patterns with the diagnosis and severity ofdry eye. Am J Ophthalmol 1996;122:818-24
24. Thai LC, Tomlinson A, Doane MG. Effect of contact lens ma-terials on tear physiology. Optom Vis Sci 2004;81:194-204
25. Craig JP. Tear physiology in normal and dry eye. PhD Thesis,Glasgow Caledonian University, 1995, pp174-193.
26. King-Smith PE, Fink BA, Fogt N. Three interferometric meth-ods for measuring the thickness of layers of the tear film. OptomVis Sci 1999;76:19-32
27. Owens H, Philips J. Spreading of the tears after a blink. Velocityand stabilization time in healthy eyes.Cornea 2001;20:484-7
28. Yokoi N, Komuro A. Non-invasive methods of assessing thetear film. Exp Eye Res 2004;78:399-407
29. Mathers WD, Lane JA, Zimmerman B. Assessment of the tearfilm using tandem scanning confocal microscopy. Cornea 1997;16:162-8
30. Forst G. Using the interference method in the evaluation ofthe tear film. Optom Today 1998; 38:35-39
31. Nemeth J, Erdelyi B, Csakany B, et al. High-speedvideotopographic measurement of tear film build up time. In-vest Ophthalmol Vis Sci 2002;43:1783-90
32. de Paiva CS, Lindsey JL, Pflugfelder SC. Assessing the severityof keratitis sicca with videokeratoscopic indices. Ophthalmol-ogy 2003;110:1102-9
33. Norn MS. Tear secretion in normal eyes. Estimated by a newmethod: the lacrimal streak dilution test. Acta Ophthalmologica1965; 43:567-73
TEAR FILM DYNAMICS / Tomlinson and Khanal

THE OCULAR SURFACE / APRIL 2005, VOL. 3, NO. 2 / www.theocularsurface.com94
34. Furukawa RE, Polse KA. Changes in tear flow accompanyingageing. Am J Optom Physiol Opt 1978;55:69-74
35. van Best JA, Oosterhuis JA. Computer fluorophotometry. DocOphthalmol 1983;56;89-97
36. Webber WRS, Jones DP, Wright P. Fluorophotometric mea-surements of tear turnover rate in normal healthy person: evi-dence for a circadian rhythm. Eye 1987;1:615-20
37. Occhipinti JR, Mosier MA, La Motte J, Monji GT.Fluorophotometric measurement of human tear turnover rate.Curr Eye Res 1988;7:995-1000
38. Goebbels M, Goebbels G, Breitbach R, Spitznas M. Tear secre-tion in dry eyes as assessed by objective fluorophotometry. GerJ Ophthalmol 1992;1:350-3
39. van Best JA, Benilez Del Castillo JM, Coulangeon LM. Mea-surement of basal tear turnover using a standardized protocol.European concerted action on ocular fluormetry. Graefes ArchClin Exp Ophthalmol 1995;233:1-7
40. Mishima S. Some physiological aspects of the precorneal tearfilm. Arch Ophthalmol 1965;73:233-41
41. Kuppens EV, Stolwijk TR, de Keizer RJW, van Best JA. Basaltear turnover and topical timolol in glaucoma patients andhealthy controls by fluorophotometry. Invest Ophthalmol VisSci 1992;33:3442-8
42. Kok JH, Voets EP, van Best JA, Kilstra A. Fluorophotometricassessment of tear turnover under rigid contact lenses. Cor-nea 1992;11:515-7
43. Sahlin S, Chen E. Evaluation of the lacrimal drainage functionby the drop test. Am J Ophthalmol 1996;122:701-8
44. Tomlinson A, Pearce EI, Simmons PA, et al. Effect of oral con-traceptives on tear physiology. Ophthalmic Physiol Opt2001;21:9-16
45. Keijser S, van Best JA, van der Lelij A, Jager MJ. Reflex andsteady state tears in patients with latent stromal herpetic kerati-tis. Invest Ophthalmol Vis Sci 2002;43:87-91
46. Mathers WD, Lane JA, Sutphin JE, Zimmerman MB. Modelfor ocular tear film function. Cornea 1996;15:110-9
47. Mathers WD, Daley TE. Tear flow and evaporation in patientswith and without dry eye. Ophthalmology 1996;103:664-9
48. Mathers WD, Choi D. Cluster analysis of patients with ocularsurface disease, blepharitis and dry eye. Arch Ophthalmol2004;122:1700-4
49. Pearce EI, Keenan BP, McRory C. An improvedfluorophotometric method for tear turnover assessment.Optom Vis Sci 2001;78:30-6
50. Macri A, Rolando M, Pflugfelder S. A standardized visual scalefor evaluation of tear fluorescein clearance. Ophthalmology2000;107:1338-43
51. de Paiva CS, Pflugfelder SC. Tear clearance implications forocular surface health. Exp Eye Res 2004;78:395-7
52. Xu K, Tsubota K. Correlation of tear clearance rate andfluorophotometric assessment of tear turnover. Br J Ophthalmol1995;79:1042-5
53. Rossomondo RM, Carlton WH, Trublood JH, Thomas RP. Anew method of evaluating lacrimal drainage. Arch Ophthalmol1972;88:523-5
54. Hurwitz JJ, Maisey MN, Welham RA. Quantitative lacrimalscintillography. I. Method and physiological application. Br J
Ophthalmol 1975;59:308-1255. Chavis RM, Welham RA, Maisey MN. Quantitative lacrimal
scintillography. Arch Ophthalmol 1978;96:2066-856. Hilditch TE, Kwok CS, Amanat LA. Lacrimal scintigraphy. I. Com-
partmental analyzis of data. Br J Ophthalmol 1983;67:713-957. Craig JP, Tomlinson A. Age and gender effects on the normal
tear film. Adv Exp Med Biol 1998;438:411-558. Doane MG. Blinking and the mechanics of the lacrimal drain-
age system. Ophthalmology 1981;88:844-5159. Hill JC, Bethell W, Smirmaul HJ. Lacrimal drainage: A dynamic
evaluation. Part I. Mechanics of tear transport. Can JOphthalmol 1974;9:411-6
60. Wilson G, Merrill R. The lacrimal drainage system: pressurechanges in the canaliculus. Am J Optom Physiol Optics1976;53:55-9
61. Paulsen FP, Thale AB, Hallmann UJ, et al. The cavernous bodyof the human efferent tear ducts: function in tear outflowmechanism. Invest Ophthalmol Vis Sci 2000;41:965-70
62. Ayub M, Thale AB, Hedderich J, et al. The cavernous body ofthe human efferent tear ducts contributes to regulation of tearoutflow. Invest Ophthalmol Vis Sci 2003:44:4900-7
63. Paulsen FP, Foge M, Thale A, et al. Animal model for the ab-sorption of lipophilic substances from tear fluid by the epithe-lium of the nasolacrimal ducts. Invest Ophthalmol Vis Sci2002;43:3137-43
64. Rohen J. [Morphologic studies of function of lid apparatus inhumans]. Morph Jahrbuch 1953;93:42-97
65. Paulsen F, Thale A, Kohla G, et al. Functional anatomy of hu-man lacrimal duct epithelium. Anat Embryol 1998;198:1-12
66. Paulsen FP, Schaudig H, Thale AB, et al. Drainage of tears:impact on the ocular surface and lacrimal system. The OcularSurface 2003;1:180-91
67. Joshi A, Maurice DM, Paugh JR. A new method for determin-ing corneal epithelial barrier to fluorescein in humans. InvestOphthalmol Vis Sci 1996;37:1008-16
68. Goebbels M, Spitznas M. Corneal epithelial permeability ofdry eyes before and after treatment with artificial tears. Oph-thalmology 1992;99:873-8
69. Miller KL. Tear-film considerations with and without contact-lenswear. PhD Thesis, University of California, Berkeley, 2002; p 29
70. Thai LC, Tomlinson A, Pearce EI. Tear film changes in theinitial and mid term adaptation to contact lens wear (abstract).TheOcular Surface 2005; 3:S119
71. MacDonald EA, Maurice DM. Loss of fluorescein across theconjunctiva. Exp Eye Res 1991;53:427-30
72. McCulley JP, Shine WE. Changing concepts in the diagnosisand management of blepharitis. Cornea 2000;19:650-8
73. Hisatake K, Tanaka S, Aizawa Y. Evaporation rate of water in avessel. J Appl Phys 1993;73:7395-401
74. Hamano H, Hori M, Kawabe H, et al. Modification of the su-perficial layer of the tear film by the secretion of the meibomianglands. Folio Ophthalmol Japonica 1980;31:353-60
75. Tomlinson A, Cedarstaff TH. Tear evaporation from the hu-man eye:The effects of contact lens wear. J Br Contact LensAssoc 1982; 5:141-50
76. Rolando M, Refojo MF. Tear evaporimeter for measuring wa-ter evaporation rate from the tear film under controlled condi-
TEAR FILM DYNAMICS / Tomlinson and Khanal

THE OCULAR SURFACE / APRIL 2005, VOL. 3, NO. 2 / www.theocularsurface.com 95
tions in humans. Exp Eye Res 1983;36:25-3377. Tsubota K, Yamada M. Tear evaporation from the ocular sur-
face. Invest Ophthalmol Vis Sci 1992; 33:2942-5078. Mathers WD, Binarao G, Petroll M. Ocular water evaporation and
the dry eye. A new measuring device. Cornea 1993;12:335-4079. Goto E, Endo K, Suzuki A, et al. Tear evaporation dynamics in
normal subjects and subjects with obstructive meibomian glanddysfunction. Invest Ophthalmol Vis Sci 2003;44:533-9
80. Trees G, Tomlinson A. Effect of artificial tear solutions and salineon tear film evaporation. Optom Vis Sci 1990;67:886-90
81. Craig JP, Tomlinson A. Importance of the lipid layer in human tearfilm stability and evaporation. Optom Vis Sci 1997;74:8-13
82. Mathers W. Evaporation from the ocular surface. Exp Eye Res2004;78:389-94
83. Mathers WD. Ocular evaporation in meibomian gland dys-function and dry eye. Ophthalmology 1993;100:347-51
84. Shimazaki J, Sakata M, Tsubota K. Ocular surface changes anddiscomfort in patients with meibomian gland dysfunction. ArchOphthalmol 1995;113:1266-70
85. Mishima S, Maurice DE. The oily layer of the tear film and evapo-ration from the corneal surface. Exp Cell Res 1961;1:39-45
86. Iwata S, Lemp M, Holly FJ, Dohlman CH. Evaporation rate ofwater from the pre-corneal tear film and cornea in the rabbit.Invest Ophthalmol 1969;8:613-9
87. Mathers WD. Why the eye becomes dry: a cornea and lacri-mal gland feedback model. CLAO J 2000;26:159-65
88. Farris RL, Gilbard JP, Stuchell RN, Mandel ID. Diagnostic testsin keratoconjunctivitis sicca. CLAO J 1983;9:23-8
89. Lemp MA. Report of the National Institute/Industry workshopon the clinical trials in dry eyes. CLAO J 1995;21:221-32
90. Gilbard JP, Farris RL, Santamaria J 2nd. Osmolarity of tearmicrovolumes in keratoconjunctivitis sicca. Arch Ophthalmol1978;96:677-81
91. Gilbard JP, Rossi SR, Gray KL. A new rabbit model for kerato-conjunctivitis sicca. Invest Ophthalmol Vis Sci 1987;28:225-8
92. Gilbard JP, Rossi SR, Heyda KG. Tear film and ocular surfacechanges after closure of the meibomian gland orifices in therabbit. Ophthalmology 1989;96:1180-6
93. Farris RL. Tear osmolarity—a new gold standard? Adv ExpMed Biol 1994;350:495-503
94. Gilbard JP, Rossi SR, Gray KL, et al. Tear film osmolarity andocular surface disease in two rabbit models for keratoconjunc-tivitis sicca. Invest Ophthalmol Vis Sci 1988;29:374-8
95. Gilbard JP, Carter JB, Sang DN, et al. Morphologic effect ofhyperosmolarity on rabbit corneal epithelium. Ophthalmol-ogy 1984;91:1205-12
96. Huang AJ, Belldegrun R, Hanninen L, et al. Effects of hyper-tonic solutions on conjunctival epithelium and mucinlike gly-coprotein discharge. Cornea 1989;8:15-20.
97. Bron AJ, Tiffany JM, Yokoi N, Gouveia SM. Using osmolarityto diagnose dry eye: a compartmental hypothesis and reviewof our assumptions. Adv Exp Med Biol2002; 506(Pt B):1087-1095.
98. Benjamin WJ, Hill RM. Tonicity of human tear fluid sampledfrom the cul-de-sac. Br J Ophthalmol 1989;73:624-7
99. White KM, Benjamin WJ, Hill RM. Human basic tear fluidosmolality. Part I. Importance of sample collection strategy.
Acta Ophthalmol (Copenh) 1993;71:524-9100. White KM, Benjamin WJ, Hill RM. Human basic tear fluid
osmolality. II. Importance of processing strategy. ActaOphthalmol (Copenh) 1993;71:530-8
101. Nelson JD, Wright JC. Tear film osmolality determination: anevaluation of potential errors in measurement. Curr Eye Res1986;5:677-81
102. Emond PL, Corbett CJ. A new method for measuring hu-man basic tear fluid osmolality. Adv Exp Med Biol1998;438:879-82
103. Pensyl CD, Benjamin WJ. Vapour pressure osmometry: mini-mum sample microvolumes. Acta Ophthalmol(Scand) 1999;77:27-30
104. Sullivan B. Clinical results of a first generation lab – on-chipnanolitre tear film osmometer (abstract). The Ocular Surface2005;3:S31.
105. Craig JP, Tomlinson A. Tear physiology in rheumatoid arthritis(abstract). Invest Ophthalmol Vis Sci 1995;36:S1043
106. Mathers WD, Lane JA, Zimmerman MB. Tear film changeswith normal aging. Cornea 1996; 15:229-35
107. Tomlinson A, Geisbrecht J. The ageing tear film. J Br ContactLens Assoc 1993;16:67-9
108. Schein OD, Tielsch JM, Munoz B, et al. Relation between signsand symptoms of dry eye in the elderly. Ophthalmology1997;104:1395-1401
109. Ward JH. Hierarchial groups to optimize an objective func-tion. J Am Stat Assoc 1963;58:236-44
110. Trabachmick BG, Fiddell L. Discriminant function analysis,IN Rothman JL (ed). Using Multivariatic Statistics, New York,NY, Harper Collins, 1989, ed 2, pp528-31
111. Fisher RA. Use of multiple measurements in taxonomic prob-lems. Ann Eugen Land 1936;7:179
112. Everitt BS, Divan G. Applied multivariate data analyzis. Ed-ward Arnold, London, 1991
113. Pflugfelder SC, Tseng SC, Sanabria O, et al. Evaluation of sub-jective assessments and objective diagnostic tests for diagnos-ing tear-film disorders known to cause ocular irritation. Cor-nea 1998; 17:38-56
114. Mathers WD, Daley TE, Verdick R. Video imaging of themeibomian gland. Arch Ophthalmol 1994;112:448-9
115. Yokoi N, Mossa F, Tiffany JM, Bron AJ. Assessment ofmeibomian gland function in dry eye using meibometry. ArchOphthalmol 1999;117:723-9
116. Iester M, Orsoni GJ, Gamba G, et al. Improvement of theocular surface using hypotonic 0.4% hyaluronic acid drops inkeratoconjunctivitis sicca. Eye 2000;14:892-8
117. Thomas ML, Szeto VR, Gan CM, Polse KA. Sequential stain-ing: the effects of sodium fluorescein, osmolarity and pH onhuman corneal epithelium. Optom Vis Sci, 1997; 74:207-210.
118. Gilbard JP, Farris RL. Tear osmolarity and ocular surface dis-ease in keratoconjunctivitis sicca. Arch Ophthalmol1979;97:1642-6
119. Sullivan DA. Tearful relationships? Sex, hormones, the lacri-mal gland and aqueous deficient dry eye. The Ocular Surface2004;2:92-107
120. Stern ME, Pflugfelder SC. Inflammation in dry eye. The Ocu-lar Surface 2004;2:124-30
TEAR FILM DYNAMICS / Tomlinson and Khanal


![Regularizationoflinearill-posedproblemsinvolving … · 6 P.MATHÉETAL. Forthesubsequenterroranalysis,thefollowingpropertyofaregularizationprovesimportant, againwereferto[21,22]](https://img.pdfslide.net/doc/110x75/607dced164ad90007c6345cf/regularizationoflinearill-posedproblemsinvolving-6-pmathetal-forthesubsequenterroranalysisthefollowingpropertyofaregularizationprovesimportant.jpg)