Embed Size (px)
Citation preview
December 31, 2017
ANNUAL REPORT
Clipper Fund
CLIPPER FUNDSM Cautionary Statement Davis Advisors is committed to communicating with our investment partners as candidly as possible because we believe our investors benefit from understanding our investment philosophy and approach. Our views and opinions regarding the investment prospects of our portfolio holdings include “forward looking statements” which may or may not be accurate over the long term. While we believe we have a reasonable basis for our appraisals and we have confidence in our opinions, actual results may differ materially from those we anticipate. These opinions are current as of the date of this report but are subject to change. The information provided in this report should not be considered a recommendation to buy, sell, or hold any particular security. You can identify forward looking statements by words like “believe,” “expect,” “anticipate,” or similar expressions when discussing prospects for particular portfolio holdings and/or of the Fund. We cannot assure future results and achievements. You should not place undue reliance on forward looking statements, which speak only as of the date of this report. We disclaim any obligation to update or alter any forward looking statements, whether as a result of new information, future events, or otherwise. This material must be preceded or accompanied by a prospectus. Please read the prospectus carefully for a discussion of investment objectives, risks, fees, and expenses. Current performance may be lower or higher than the performance quoted herein. You may obtain a current copy of the Fund’s Prospectus or more current performance information by calling Investor Services at 1-800-432-2504 or on Clipper Fund’s website (www.clipperfund.com).
CLIPPER FUNDSM Table of Contents
Shareholder Letter ................................................................................................................................. 2
Management’s Discussion of Fund Performance .................................................................................. 13
Fund Overview ...................................................................................................................................... 15
Expense Example .................................................................................................................................. 17
Schedule of Investments ........................................................................................................................ 18
Statement of Assets and Liabilities ........................................................................................................ 20
Statement of Operations ........................................................................................................................ 21
Statements of Changes in Net Assets .................................................................................................... 22
Notes to Financial Statements ............................................................................................................... 23
Financial Highlights .............................................................................................................................. 29
Report of Independent Registered Public Accounting Firm .................................................................. 30
Federal Income Tax Information ........................................................................................................... 31
Privacy Notice and Householding ......................................................................................................... 32
Trustees and Officers ............................................................................................................................. 33 This Annual Report is authorized for use by existing shareholders. Prospective shareholders must receive a current Clipper Fund Prospectus, which contains more information about investment strategies, risks, fees, and expenses. Please read the prospectus carefully before investing or sending money. Shares of Clipper Fund are not deposits or obligations of any bank, are not guaranteed by any bank, are not insured by the FDIC or any other agency, and involve investment risks, including possible loss of the principal amount invested. Portfolio Proxy Voting Policies and Procedures The Fund has adopted Portfolio Proxy Voting Policies and Procedures under which the Fund votes proxies relating to securities held by the Fund. A description of the Fund’s Portfolio Proxy Voting Policies and Procedures is available (i) without charge, upon request, by calling the Fund toll-free at 1-800-432-2504, (ii) on the Fund’s website at www.clipperfund.com, and (iii) on the SEC’s website at www.sec.gov. In addition, the Fund is required to file Form N-PX, with its complete proxy voting record for the 12 months ended June 30th, no later than August 31st of each year. The Fund’s Form N-PX filing is available (i) without charge, upon request, by calling the Fund toll-free at 1-800-432-2504, (ii) on the Fund’s website at www.clipperfund.com, and (iii) on the SEC’s website at www.sec.gov. Form N-Q The Fund files its complete schedule of portfolio holdings with the SEC for the first and third quarters of each fiscal year on Form N-Q. The Fund’s Form N-Q is available without charge, upon request, by calling 1-800-432-2504, on the Fund’s website at www.clipperfund.com, and on the SEC’s website at www.sec.gov. The Fund’s Form N-Q may be reviewed and copied at the SEC’s Public Reference Room in Washington, D.C., and information on the operation of the Public Reference Room may be obtained by calling 1-800-SEC-0330.
Not a part of Annual Report to Fund shareholders
CLIPPER FUNDSM Shareholder Letter Summary
In 2017, Clipper Fund returned 17.7%.1
Clipper Fund has outperformed the S&P 500 Index for the last three and five years.1
Over the most recent one, three and five year periods, a $10,000 investment in the Fund grew to $11,769, $14,482 and $20,945, respectively.
1
At a time when active investment strategies are out of favor, historical data indicates active managers may be poised for a rebound.
Our Portfolio is positioned to take advantage of select opportunities in today’s market including global leaders selling at bargain prices, dominant lesser known businesses in necessary economic niches, blue chips of tomorrow, and beneficiaries of short-term misperceptions.
Our Portfolio is also positioned to avoid potential losses facing the index if the prices of an overvalued but widely owned group of companies we refer to as dividend darlings decline in the years ahead.
The average annual total returns for Clipper Fund for periods ending December 31, 2017 are: 1 year, 17.69%; 5 years, 15.94%; and 10 years, 6.71%. The performance presented represents past performance and is not a guarantee of future results. Total return assumes reinvestment of dividends and capital gain distributions. Investment return and principal value will vary so that, when redeemed, an investor’s shares may be worth more or less than their original cost. The total annual operating expense ratio as of the most recent prospectus was 0.72%. The total annual operating expense ratio may vary in future years. Current performance may be higher or lower than the performance quoted. For most recent month-end performance, visit clipperfund.com or call 800-432-2504. The Fund received favorable class action settlements from companies that it no longer owns. These settlements had a material impact on the investment performance of the Fund in 2009. This was a one-time event that is unlikely to be repeated.
This report includes candid statements and observations regarding investment strategies, individual securities, and economic and market conditions; however, there is no guarantee that these statements, opinions or forecasts will prove to be correct. Equity markets are volatile and an investor may lose money. Past performance is not a guarantee of future results. 1 Past performance is not a guarantee of future results. Investments cannot be made directly in an index.
2
Not a part of Annual Report to Fund shareholders
CLIPPER FUNDSM Shareholder Letter – (Continued) Results of Our Investment Discipline Our investment discipline has built wealth for shareholders over the long term.
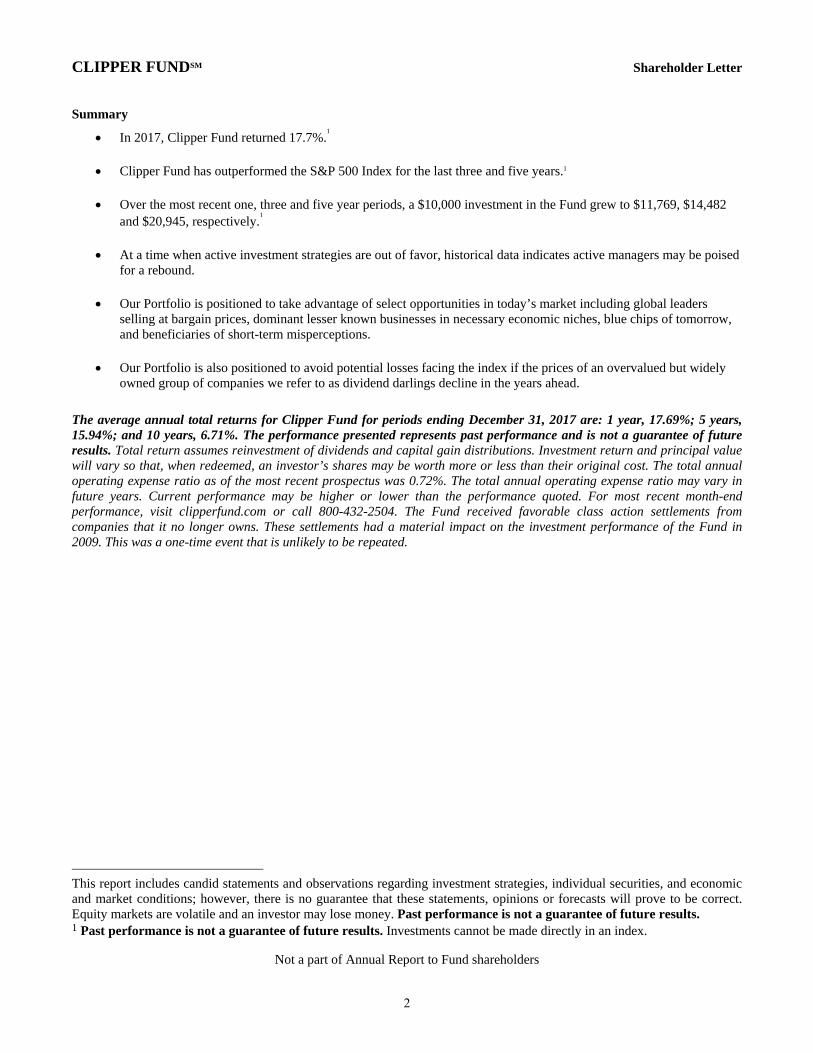
2 In 2017, Clipper Fund continued its long record of building shareholder wealth generating an absolute return of almost 18%. As shown in the chart below, the value of an initial $10,000 investment has increased in all periods shown since we assumed management of the Fund.
3 On a relative basis, our results have also beaten the market over the last five years. However, while the value of each dollar invested in Clipper Fund has more than doubled since we were entrusted with management of the Fund in January 2006, we still have ground to make up on a relative basis and intend to build on our improved results in the years ahead.2 Our confidence in our time-tested approach is reflected by our investment of more than $145 million in Clipper Fund alongside our shareholders.
4 While our disciplined investment approach will not always be rewarded by the market over shorter periods, this active management strategy has produced positive returns for Clipper shareholders in the one, five and 10 year periods, and relative outperformance over the last five years. The cornerstones of our discipline include rigorous research, focused investing, low expenses, alignment of interests, and a willingness to stand apart from the crowd.
2 Past performance is not a guarantee of future results. Investments cannot be made directly in an index. 3 As of December 31, 2017. Clipper Fund was managed from inception, February 29, 1984, until December 31, 2005 by another Adviser. Davis Selected Advisers, L.P. took over management of the Fund on January 1, 2006. Past performance is not a guarantee of future results. 4 As of December 31, 2017.
3
Not a part of Annual Report to Fund shareholders
CLIPPER FUNDSM Shareholder Letter – (Continued)
Why Now May Be a Good Time to Invest in an Actively Managed Fund like Clipper Fund
A Google search for “the death of active management” produces 1.8 million results. With more than $1 trillion flowing into passive funds and ETFs and $1.1 trillion removed from active managers over the last decade, the tide of investors shifting from active to passive investment strategies has become a tsunami.
5 This wave has been driven by the widespread acceptance
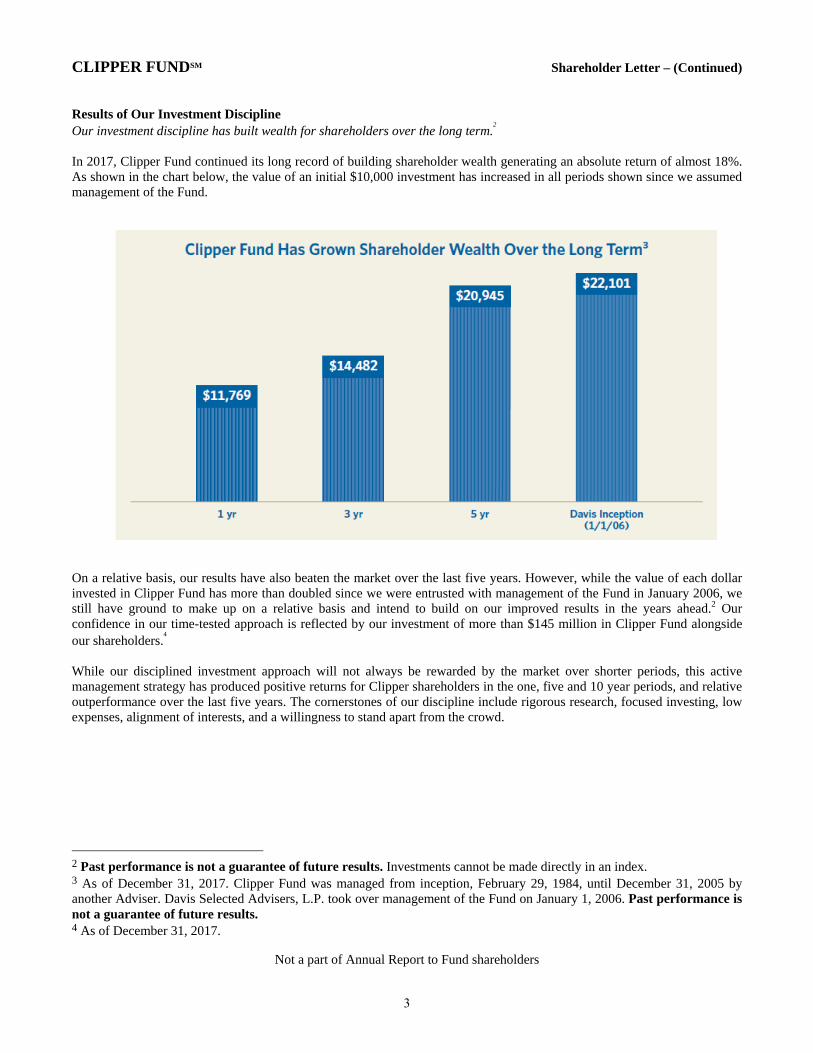
of data showing the S&P 500 Index has outperformed the average active manager over the long term. While the data itself is true, the results are misleading in three important ways. First, active and passive strategies have historically moved in a cycle. During parts of this cycle such as in the last decade or so, passive strategies have tended to outperform active management. However, during other parts of the cycle, even average active managers outperform the index, often for long periods of time. For example, the chart below tracks the percentage of large cap active managers that outperformed the S&P 500 Index over five-year time periods since 1975. The gold circles represent inflection points where the number of active managers outperforming the market began to increase. Underperformance of active strategies is near an all-time high. If the cycle were to continue, this may point to potential wisdom of moving toward active management.
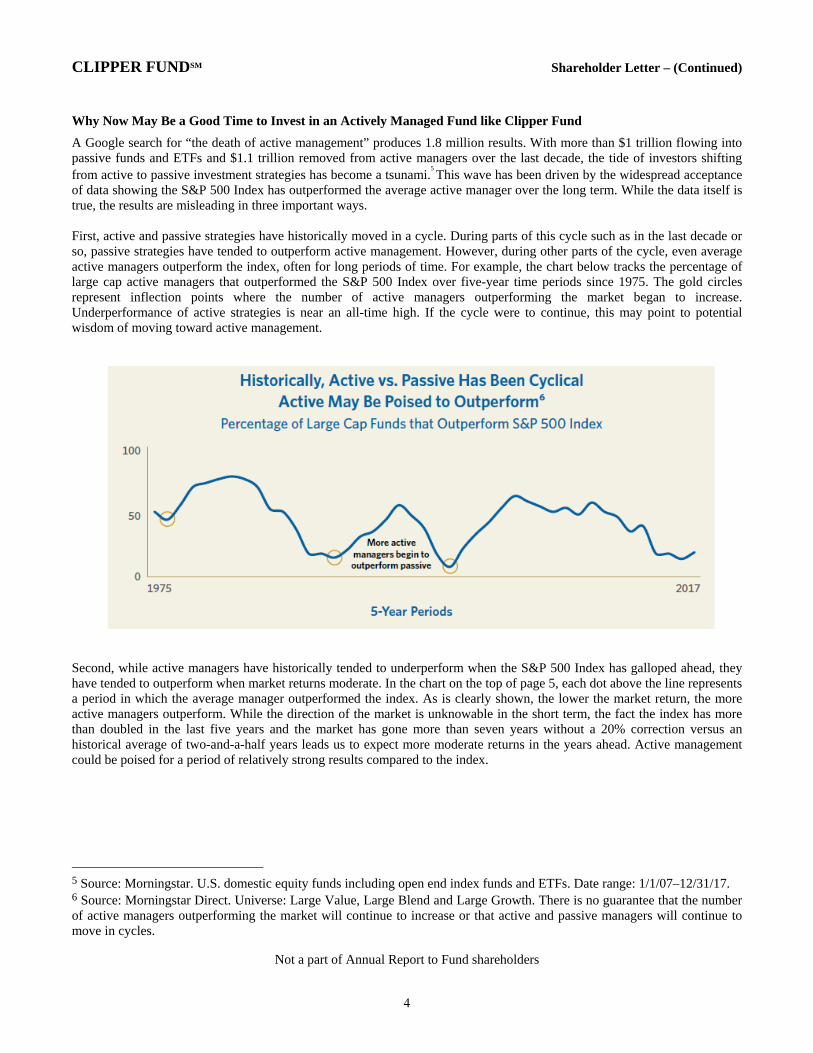
6 Second, while active managers have historically tended to underperform when the S&P 500 Index has galloped ahead, they have tended to outperform when market returns moderate. In the chart on the top of page 5, each dot above the line represents a period in which the average manager outperformed the index. As is clearly shown, the lower the market return, the more active managers outperform. While the direction of the market is unknowable in the short term, the fact the index has more than doubled in the last five years and the market has gone more than seven years without a 20% correction versus an historical average of two-and-a-half years leads us to expect more moderate returns in the years ahead. Active management could be poised for a period of relatively strong results compared to the index.
5 Source: Morningstar. U.S. domestic equity funds including open end index funds and ETFs. Date range: 1/1/07–12/31/17. 6 Source: Morningstar Direct. Universe: Large Value, Large Blend and Large Growth. There is no guarantee that the number of active managers outperforming the market will continue to increase or that active and passive managers will continue to move in cycles.
4
Not a part of Annual Report to Fund shareholders
CLIPPER FUNDSM Shareholder Letter – (Continued) 7
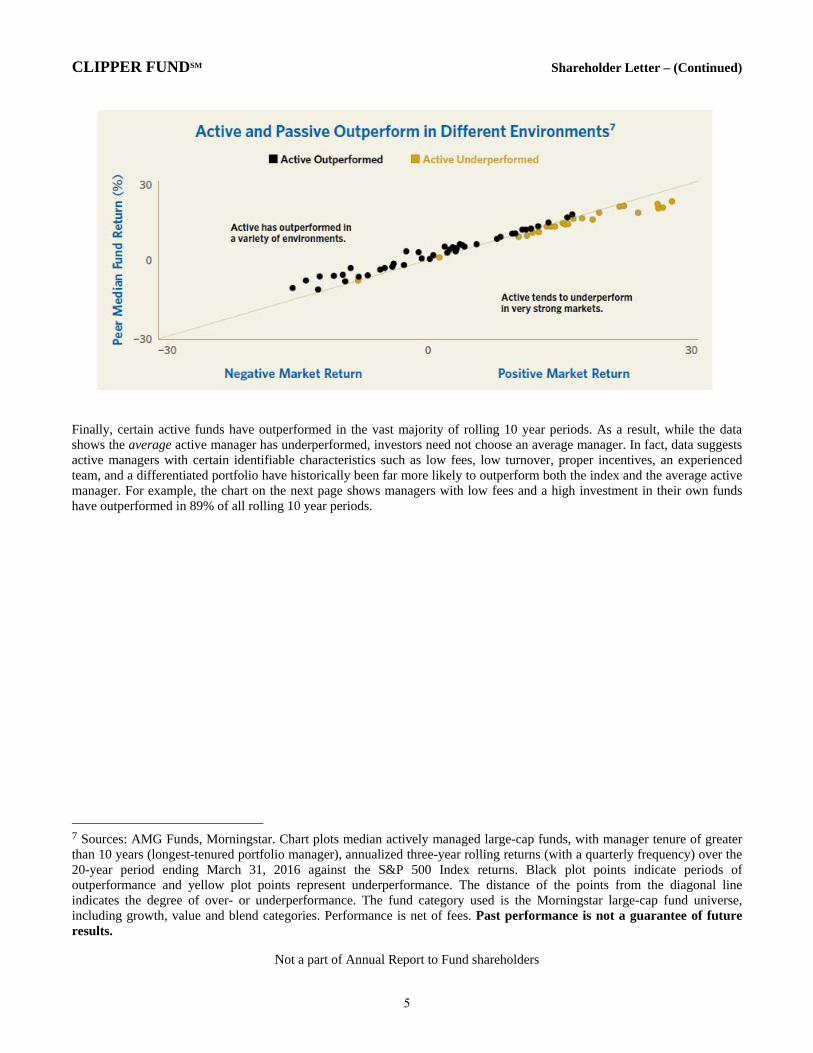
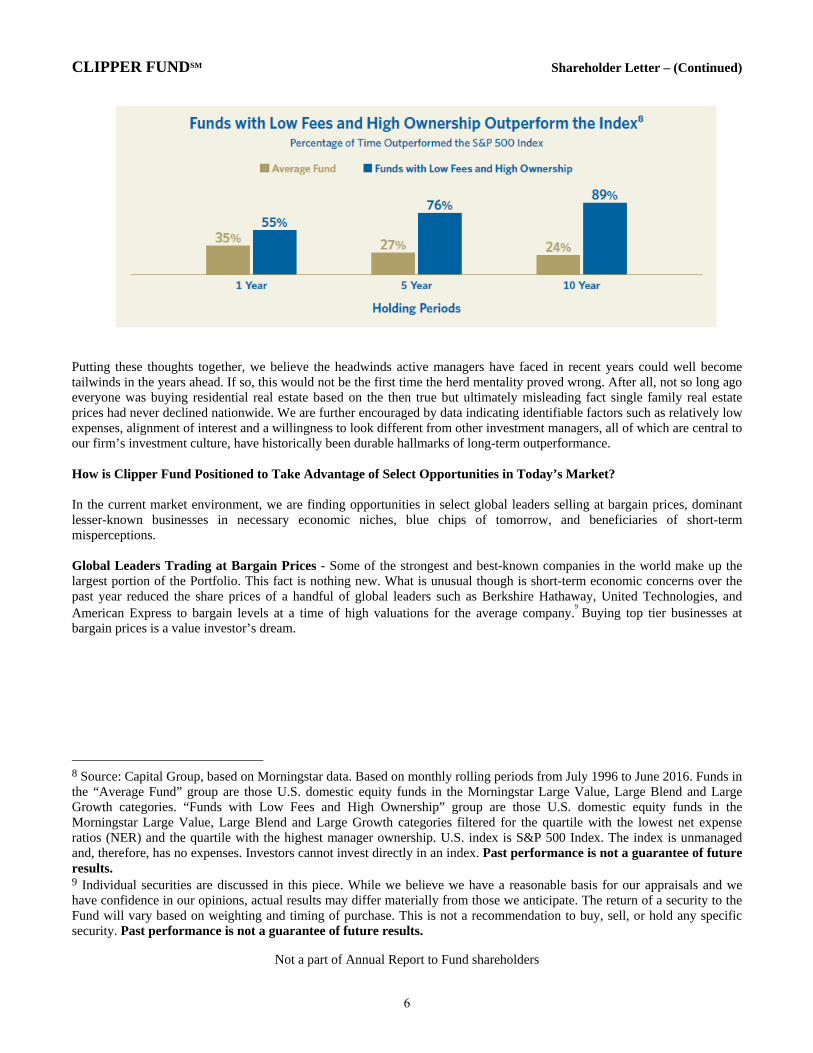
Finally, certain active funds have outperformed in the vast majority of rolling 10 year periods. As a result, while the data shows the average active manager has underperformed, investors need not choose an average manager. In fact, data suggests active managers with certain identifiable characteristics such as low fees, low turnover, proper incentives, an experienced team, and a differentiated portfolio have historically been far more likely to outperform both the index and the average active manager. For example, the chart on the next page shows managers with low fees and a high investment in their own funds have outperformed in 89% of all rolling 10 year periods.
7 Sources: AMG Funds, Morningstar. Chart plots median actively managed large-cap funds, with manager tenure of greater than 10 years (longest-tenured portfolio manager), annualized three-year rolling returns (with a quarterly frequency) over the 20-year period ending March 31, 2016 against the S&P 500 Index returns. Black plot points indicate periods of outperformance and yellow plot points represent underperformance. The distance of the points from the diagonal line indicates the degree of over- or underperformance. The fund category used is the Morningstar large-cap fund universe, including growth, value and blend categories. Performance is net of fees. Past performance is not a guarantee of future results.
5
Not a part of Annual Report to Fund shareholders
CLIPPER FUNDSM Shareholder Letter – (Continued)
8 Putting these thoughts together, we believe the headwinds active managers have faced in recent years could well become tailwinds in the years ahead. If so, this would not be the first time the herd mentality proved wrong. After all, not so long ago everyone was buying residential real estate based on the then true but ultimately misleading fact single family real estate prices had never declined nationwide. We are further encouraged by data indicating identifiable factors such as relatively low expenses, alignment of interest and a willingness to look different from other investment managers, all of which are central to our firm’s investment culture, have historically been durable hallmarks of long-term outperformance. How is Clipper Fund Positioned to Take Advantage of Select Opportunities in Today’s Market? In the current market environment, we are finding opportunities in select global leaders selling at bargain prices, dominant lesser-known businesses in necessary economic niches, blue chips of tomorrow, and beneficiaries of short-term misperceptions. Global Leaders Trading at Bargain Prices - Some of the strongest and best-known companies in the world make up the largest portion of the Portfolio. This fact is nothing new. What is unusual though is short-term economic concerns over the past year reduced the share prices of a handful of global leaders such as Berkshire Hathaway, United Technologies, and American Express to bargain levels at a time of high valuations for the average company.
9 Buying top tier businesses at
bargain prices is a value investor’s dream.
8 Source: Capital Group, based on Morningstar data. Based on monthly rolling periods from July 1996 to June 2016. Funds in the “Average Fund” group are those U.S. domestic equity funds in the Morningstar Large Value, Large Blend and Large Growth categories. “Funds with Low Fees and High Ownership” group are those U.S. domestic equity funds in the Morningstar Large Value, Large Blend and Large Growth categories filtered for the quartile with the lowest net expense ratios (NER) and the quartile with the highest manager ownership. U.S. index is S&P 500 Index. The index is unmanaged and, therefore, has no expenses. Investors cannot invest directly in an index. Past performance is not a guarantee of future results. 9 Individual securities are discussed in this piece. While we believe we have a reasonable basis for our appraisals and we have confidence in our opinions, actual results may differ materially from those we anticipate. The return of a security to the Fund will vary based on weighting and timing of purchase. This is not a recommendation to buy, sell, or hold any specific security. Past performance is not a guarantee of future results.
6
Not a part of Annual Report to Fund shareholders
CLIPPER FUNDSM Shareholder Letter – (Continued) Dominant Lesser-Known Businesses - Clipper Fund also invests in a group of lesser-known businesses that dominate dull but necessary niches in the global economy. Whether they participate in unglamorous industries or are headquartered in different countries, these businesses are not household names to U.S. investors. As a result, their shares often trade at a discount to better-known companies despite having the same qualities of market dominance and durability as the global leaders described above. Such companies include Johnson Control’s leadership in fire and security, building controls, and car batteries; Liberty Global’s strength in European cable TV and broadband; LafargeHolcim’s dominance of the world cement industry; and Safran’s leadership in jet engines (the company has been an equal but less well-known partner of General Electric for more than 30 years). These companies combine the relevance and resilience of blue chip businesses with below-average valuations.
Blue Chips of Tomorrow - Another theme is fast-moving companies that use innovation to disrupt the economics of larger but less agile competitors. Similar to evolution, capitalism is a process of constant change that rewards businesses that can adapt. Over the decades, we have seen many examples of today’s disrupters emerge as tomorrow’s blue chips. Several of Clipper Fund’s core holdings reflect this dynamic. Amazon has not only revolutionized the retail business, but also the information and technology industry through Amazon Web Services (AWS). Alphabet (the parent company of Google) began by making the world’s information accessible through the internet and emerged as the largest and most profitable advertising firm in the world, the brains behind the vast majority of all smart phones, a leader in internet video, and the emerging leader in artificial intelligence and self-driving cars. Beneficiaries of Short-Term Misperceptions - Short-sighted investors often avoid companies that face short-term problems, creating an opportunity for long-term investors willing to look beyond today’s headlines. In banking, for example, memories of the financial crisis of 2008-2009 combined with subsequent anti-banking rhetoric and media coverage have blinded investors to the fact carefully selected banks are both cheap and safe, in our opinion. Contrary to popular perception, many top tier banks are not only reporting record earnings but are also far better capitalized than at any time in the last 50 years. While unloved now, we believe the leading financial companies we own will be big contributors to Clipper Fund’s future returns as the reality of their strong economic fundamentals and rising dividends eclipse current investor perceptions.
Similarly, over the past year, investors fled the energy sector in response to the dramatic (and unsustainable) collapse of oil prices. While oil prices are unknowable in the short term, they must exceed the cost of replacing reserves over time. This simple fact should eventually lead to higher energy prices and should drive future returns for the well-positioned, low-cost producers the Fund holds. As a result, we repositioned the energy portion of the Portfolio. We own a select group of innovative and well-positioned energy companies with the capital allocation discipline, management experience and low-cost, long-lived reserves to allow them to increase production for decades to come. Our holdings include Apache and Occidental Petroleum.
All in all, the carefully selected businesses that make up Clipper Fund combine above-average resiliency and growth with below-average prices.
Where do we see the biggest risks? Being selective when choosing which companies to own can be a big driver of performance over the long term. However, choosing which companies not to own can be equally important. For example, in the early 2000s avoiding most of the overvalued tech and telecom darlings that collapsed when the internet bubble burst proved a prudent strategy. Although these bubbles seem obvious in retrospect, investing in such companies at the time often seems safe because their prices have gone up for so long and the press is filled with flattering reports. In other words, investors often feel safest when risks are greatest. From the 1990s internet mania to the 2007 housing boom, what looked like a sure thing at the time ended up a speculative bubble. When these bubbles burst, disciplined investors who resisted the siren song of the market darlings tend to outperform as the stocks they avoided drag down the averages.
7
Not a part of Annual Report to Fund shareholders
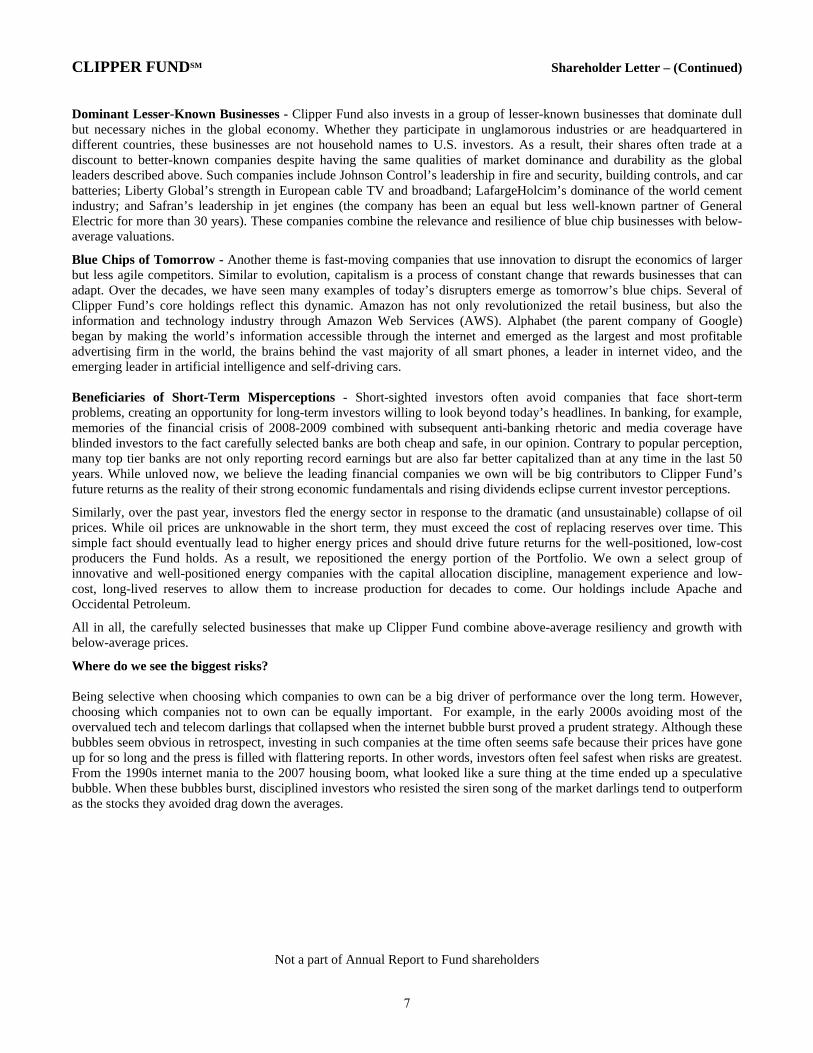
CLIPPER FUNDSM Shareholder Letter – (Continued) Today, we see a bubble emerging in many popular dividend-paying stocks, often referred to as dividend darlings. Although many of these are well known and substantial companies, their prices have been bid up to bubble valuations by investors whose thirst for short-term income has blinded them to these companies’ deteriorating fundamentals. For example, the 25 most widely held dividend paying stocks currently have a combined market capitalization of more than $4 trillion and trade at almost a 20% premium to the market. Such high valuations are usually reserved for companies that can grow faster than average. However, as the chart below shows, these businesses have been shrinking not growing over the last five years. As a result, the companies have been able to maintain their earnings and dividends only by cutting costs, reducing investments in future growth (such as R&D and advertising) and increasing their payout ratio (the percentage of earnings that must be distributed to maintain the companies’ dividends). Such trends are not sustainable. We believe investors like us with the discipline to avoid such popular but overvalued companies will be rewarded with improved relative returns as this dividend bubble deflates.
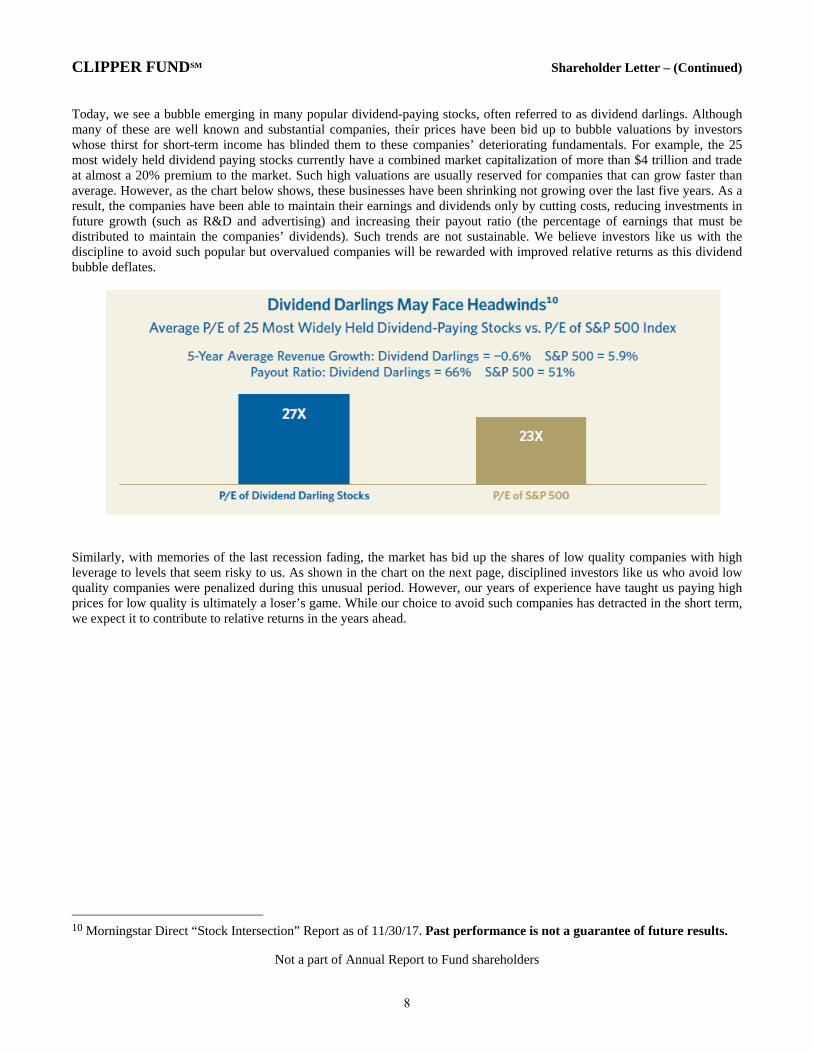
10 Similarly, with memories of the last recession fading, the market has bid up the shares of low quality companies with high leverage to levels that seem risky to us. As shown in the chart on the next page, disciplined investors like us who avoid low quality companies were penalized during this unusual period. However, our years of experience have taught us paying high prices for low quality is ultimately a loser’s game. While our choice to avoid such companies has detracted in the short term, we expect it to contribute to relative returns in the years ahead.
10 Morningstar Direct “Stock Intersection” Report as of 11/30/17. Past performance is not a guarantee of future results.
8
Not a part of Annual Report to Fund shareholders
CLIPPER FUNDSM Shareholder Letter – (Continued)
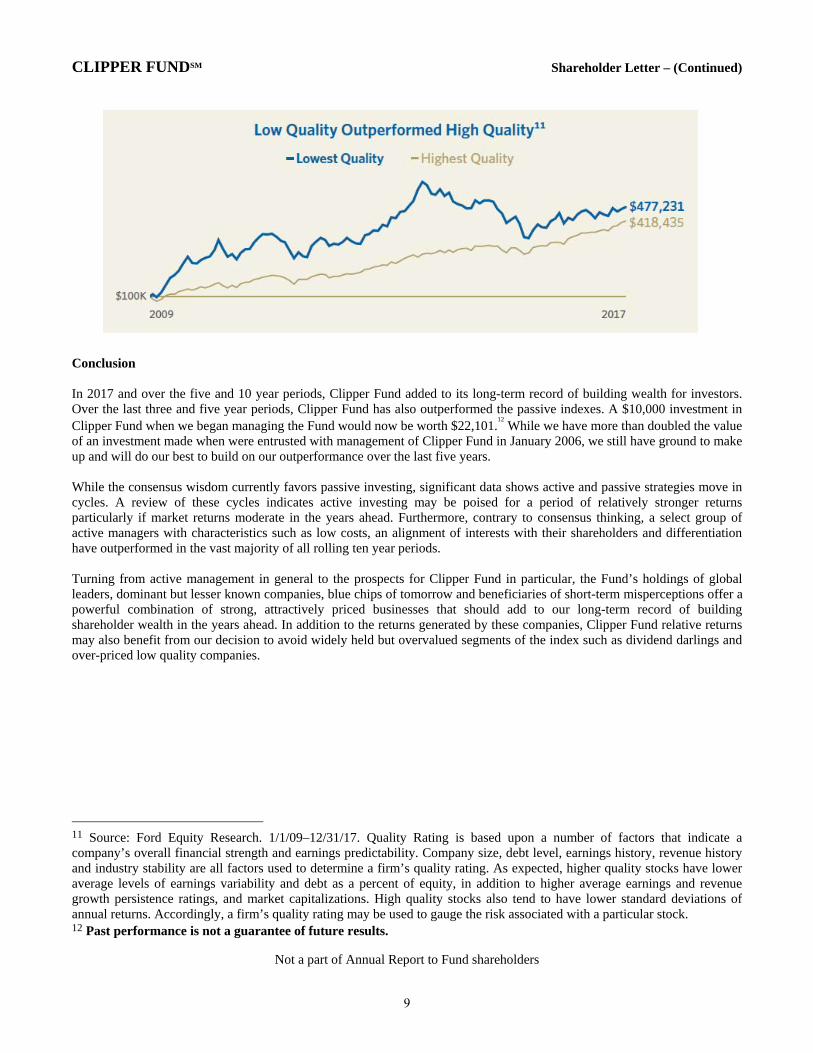
11 Conclusion In 2017 and over the five and 10 year periods, Clipper Fund added to its long-term record of building wealth for investors. Over the last three and five year periods, Clipper Fund has also outperformed the passive indexes. A $10,000 investment in Clipper Fund when we began managing the Fund would now be worth $22,101.
12 While we have more than doubled the value
of an investment made when were entrusted with management of Clipper Fund in January 2006, we still have ground to make up and will do our best to build on our outperformance over the last five years. While the consensus wisdom currently favors passive investing, significant data shows active and passive strategies move in cycles. A review of these cycles indicates active investing may be poised for a period of relatively stronger returns particularly if market returns moderate in the years ahead. Furthermore, contrary to consensus thinking, a select group of active managers with characteristics such as low costs, an alignment of interests with their shareholders and differentiation have outperformed in the vast majority of all rolling ten year periods. Turning from active management in general to the prospects for Clipper Fund in particular, the Fund’s holdings of global leaders, dominant but lesser known companies, blue chips of tomorrow and beneficiaries of short-term misperceptions offer a powerful combination of strong, attractively priced businesses that should add to our long-term record of building shareholder wealth in the years ahead. In addition to the returns generated by these companies, Clipper Fund relative returns may also benefit from our decision to avoid widely held but overvalued segments of the index such as dividend darlings and over-priced low quality companies.
11 Source: Ford Equity Research. 1/1/09–12/31/17. Quality Rating is based upon a number of factors that indicate a company’s overall financial strength and earnings predictability. Company size, debt level, earnings history, revenue history and industry stability are all factors used to determine a firm’s quality rating. As expected, higher quality stocks have lower average levels of earnings variability and debt as a percent of equity, in addition to higher average earnings and revenue growth persistence ratings, and market capitalizations. High quality stocks also tend to have lower standard deviations of annual returns. Accordingly, a firm’s quality rating may be used to gauge the risk associated with a particular stock. 12 Past performance is not a guarantee of future results.
9
Not a part of Annual Report to Fund shareholders
CLIPPER FUNDSM Shareholder Letter – (Continued) As always, we recognize and expect the years ahead will include times of market corrections and disruptions. While unpleasant, such periods are inevitable and generally create opportunities for investors with the judgment and experience to take advantage of them. In short, at a time when pundits and commentators are making the case experience and judgment do not matter and the best investors can hope for is an average result, we strongly disagree. We believe a carefully selected Portfolio of durable, well-managed businesses with competitive advantages, selling at a discount to true value and overseen by a seasoned team with a long track record of generating proven results will produce a better-than-average outcome. In investing, as in any other profession, skill matters. Since we assumed management of Clipper Fund in 2006, we have continued Clipper Funds long record of building wealth for our shareholders. With more than $145 million invested alongside our shareholders, we have every incentive and intention to build on this record in the years and decades ahead.
13 We value the trust you have placed in us and look forward to continuing our investment journey together. Sincerely,
Christopher C. Davis Danton G. Goei President & Portfolio Manager Portfolio Manager February 2, 2018
13 As of December 31, 2017.
10
Not a part of Annual Report to Fund shareholders
CLIPPER FUNDSM Shareholder Letter – (Continued) This report is authorized for use by existing shareholders. A current Clipper Fund prospectus must accompany or precede this material if it is distributed to prospective shareholders. You should carefully consider the Fund’s investment objective, risks, fees, and expenses before investing. Read the prospectus carefully before you invest or send money. This report includes candid statements and observations regarding investment strategies, individual securities, and economic and market conditions; however, there is no guarantee that these statements, opinions or forecasts will prove to be correct. These comments may also include the expression of opinions that are speculative in nature and should not be relied on as statements of fact.
Objective and Risks. Clipper Fund’s investment objective is long-term capital growth and capital preservation. There can be no assurance that the Fund will achieve its objective. The Fund invests primarily in equity securities issued by large companies with market capitalizations of at least $10 billion. Some important risks of an investment in the Fund are: common stock risk: an adverse event may have a negative impact on a company and could result in a decline in the price of its common stock; depositary receipts risk: depositary receipts may trade at a discount (or premium) to the underlying security and may be less liquid than the underlying securities listed on an exchange; fees and expenses risk: the Fund may not earn enough through income and capital appreciation to offset the operating expenses of the Fund; financial services risk: investing a significant portion of assets in the financial services sector may cause the Fund to be more sensitive to systemic risk, regulatory actions, changes in interest rates, non-diversified loan portfolios, credit, and competition; focused portfolio risk: investing in a limited number of companies causes changes in the value of a single security to have a more significant effect on the value of the Fund’s total portfolio; foreign country risk: foreign companies may be subject to greater risk as foreign economies may not be as strong or diversified; As of December 31, 2017, the Fund had approximately 13.8% of assets invested in foreign companies; foreign currency risk: the change in value of a foreign currency against the U.S. dollar will result in a change in the U.S. dollar value of securities denominated in that foreign currency; headline risk: the Fund may invest in a company when the company becomes the center of controversy. The company’s stock may never recover or may become worthless; large-capitalization companies risk: companies with $10 billion or more in market capitalization generally experience slower rates of growth in earnings per share than do mid- and small-capitalization companies; manager risk: poor security selection may cause the Fund to underperform relevant benchmarks; mid- and small-capitalization companies risk: companies with less than $10 billion in market capitalization typically have more limited product lines, markets and financial resources than larger companies, and may trade less frequently and in more limited volume; and stock market risk: stock markets have periods of rising prices and periods of falling prices, including sharp declines. See the prospectus for a complete description of the principal risks. Davis Advisors is committed to communicating with our investment partners as candidly as possible because we believe our investors benefit from understanding our investment philosophy and approach. Our views and opinions include “forward-looking statements” which may or may not be accurate over the long term. Forward-looking statements can be identified by words like “believe,” “expect,” “anticipate,” or similar expressions. You should not place undue reliance on forward-looking statements, which are current as of the date of this report. We disclaim any obligation to update or alter any forward-looking statements, whether as a result of new information, future events, or otherwise. While we believe we have a reasonable basis for our appraisals and we have confidence in our opinions, actual results may differ materially from those we anticipate.
11
Not a part of Annual Report to Fund shareholders
CLIPPER FUNDSM Shareholder Letter – (Continued) The information provided in this material should not be considered a recommendation to buy, sell, or hold any particular security. As of December 31, 2017, the top ten holdings of Clipper Fund were:
Alphabet Inc.* 8.40% Berkshire Hathaway Inc., Class A 7.98% Amazon.com, Inc. 7.58% Capital One Financial Corp. 6.34% United Technologies Corp. 6.19% Wells Fargo & Co. 6.11% Bank of New York Mellon Corp. 5.97% Markel Corp. 4.94% Johnson Controls International PLC 4.80% Apache Corp. 4.75%
*Alphabet Inc. holding includes Class A and Class C. Clipper Fund has adopted a Portfolio Holdings Disclosure policy that governs the release of non-public portfolio holding information. This policy is described in the prospectus. Holding percentages are subject to change. Visit clipperfund.com or call 800-432-2504 for the most current public portfolio holdings information.
We gather our index data from a combination of reputable sources, including, but not limited to, Thomson Financial, Lipper and index websites.
The S&P 500 Index is an unmanaged index of 500 selected common stocks, most of which are listed on the New York Stock Exchange. The Index is adjusted for dividends, weighted towards stocks with large market capitalizations and represents approximately two-thirds of the total market value of all domestic common stocks. Investments cannot be made directly in an index.
After April 30, 2018, this material must be accompanied by a supplement containing performance data for the most recent quarter end.
Shares of the Clipper Fund are not deposits or obligations of any bank, are not guaranteed by any bank, are not insured by the FDIC or any other agency, and involve investment risks, including possible loss of the principal amount invested.
12/17 Davis Distributors, LLC, 2949 East Elvira Road, Suite 101, Tucson, AZ 85756, 800-432-2504, clipperfund.com
12
CLIPPER FUNDSM Management’s Discussion of Fund Performance
Performance Overview
Clipper Fund underperformed the Standard & Poor’s 500® Index (“S&P 500®”) for the twelve-month period ended December 31, 2017 (the “period”). The Fund delivered a total return of 17.69%, versus a 21.83% return for the S&P 500®. Only two sectors1 within the S&P 500® reported negative performance, Telecommunication Services and Energy (both down 1%). The third-weakest, but still positive, performing sector was Real Estate (up 11%). The sectors within the S&P 500® that reported the strongest performance were Information Technology (up 39%), Materials (up 24%), and Financials (up 23%).
Detractors from Performance
The Fund’s holdings in the Energy sector were the most significant detractor from performance2 on an absolute basis. The Fund’s Energy holdings were down about 13%, compared to down 1% for the S&P 500®. The Fund suffered from an overweight position (average weighting of 10%, versus 6% for the S&P 500®) in a weak performing sector. Apache3 (down 32%), a top ten holding, was the overall top detractor for other period. Encana (down less than 1%) was also a weak performing security during the period. The Fund no longer owns Encana. When compared to the S&P 500®, the Fund suffered from being significantly underweight in the strongest-performing sector, Information Technology (average weighting of 7%, versus 22%). The Fund’s Information Technology holdings underperformed the Information Technology sector holdings of the S&P 500® (up 32%, compared to up 39%). Alibaba (down 7%) was a key detractor from performance. An additional detractor from performance was Valeant Pharmaceuticals (down 39%) from the Health Care sector. The Fund no longer holds Valeant Pharmaceuticals. The Fund’s Industrials holdings underperformed those of the S&P 500® (up 18%, as compared to up 21%). Johnson Controls (down 5%) was a weak performing security. While no Materials sector holdings were among the top ten detractors for the period, the Fund suffered from weak stock selection in this strong performing sector (up 13%, compared to up 24% for the S&P 500®). Given the strong market over the period, the Fund’s 4% average weighting in Cash & Equivalents hindered performance.
Contributors to Performance
The Fund’s holdings in the Financials sector made a significant contribution to performance. The Fund’s Financials holdings were up 24%, compared to up 23% for the S&P 500®. A number of Financials securities were key contributors to performance, including American Express (up 36%), Berkshire Hathaway (up 22%), the Fund’s second-largest holding, Capital One Financial (up 26%), Markel (up 26%), and JPMorgan Chase (up 27%). Returns from holdings in the Consumer Discretionary sector made a substantial contribution to performance on both an absolute and relative basis. Returns from the Fund’s Consumer Discretionary sector holdings were up 37%, compared to up 23% for the S&P 500®. Amazon (up 56%), the Fund’s third-largest holding, was the overall top contributor for the period. The Fund’s Health Care holdings outperformed those of the S&P 500® (up 27%, versus up 22%). UnitedHealth Group (up 34%) helped performance. The Fund no longer owns UnitedHealth Group or any other Health Care companies. Other contributors during the period included Safran (up 44%) and United Technologies (up 19%) from the Industrials sector, and Alphabet (up 34%) from the Information Technology sector. Alphabet was the largest position at the end of the period.
Clipper Fund’s investment objective is to seek long-term capital growth and capital preservation. There can be no assurance that the Fund will achieve its objective. Clipper Fund’s principal risks are: common stock risk, depositary receipts risk, fees and expenses risk, financial services risk, focused portfolio risk, foreign country risk, foreign currency risk, headline risk, large-capitalization companies risk, manager risk, mid- and small-capitalization companies risk, and stock market risk. See the prospectus for a full description of each risk.
Clipper Fund focuses its investments in fewer companies, and it may be subject to greater risks than a more diversified fund that is not allowed to focus its investments in a few companies. The Fund’s investment performance, both good and bad, is expected to reflect the economic performance of its more focused portfolio.
Past performance does not guarantee future results, Fund prices fluctuate, and the value of an investment may be worth more or less than the purchase price. Data provided in this performance overview is for the twelve-month period ended December 31, 2017, unless otherwise noted. Return figures for underlying Fund positions reflect the return of the security from the beginning of the period or the date of first purchase if subsequent thereto through the end of the period or the date the position is completely liquidated. The actual contribution to the Fund will vary based on a number of factors (e.g., trading activity, weighting). Portfolio holding information is as of the end of the twelve-month period, December 31, 2017, unless otherwise noted. 1 The companies included in the Standard & Poor’s 500® Index are divided into eleven sectors. One or more industry groups make up a sector. For
purposes of measuring concentration, the Fund generally classifies companies at the industry group or industry level. See the SAI for additional information regarding the Fund’s concentration policy.
2 A company’s or sector’s contribution to or detraction from the Fund’s performance is a product both of its appreciation or depreciation and its weighting within the Fund. For example, a 5% holding that rises 20% has twice as much impact as a 1% holding that rises 50%.
3 This Management Discussion of Fund Performance discusses a number of individual companies. The information provided in this report does not provide information reasonably sufficient upon which to base an investment decision and should not be considered a recommendation to purchase, sell, or hold any particular security. The Schedule of Investments lists the Fund’s holdings of each company discussed.
13
CLIPPER FUNDSM Management’s Discussion of Fund Performance – (Continued)
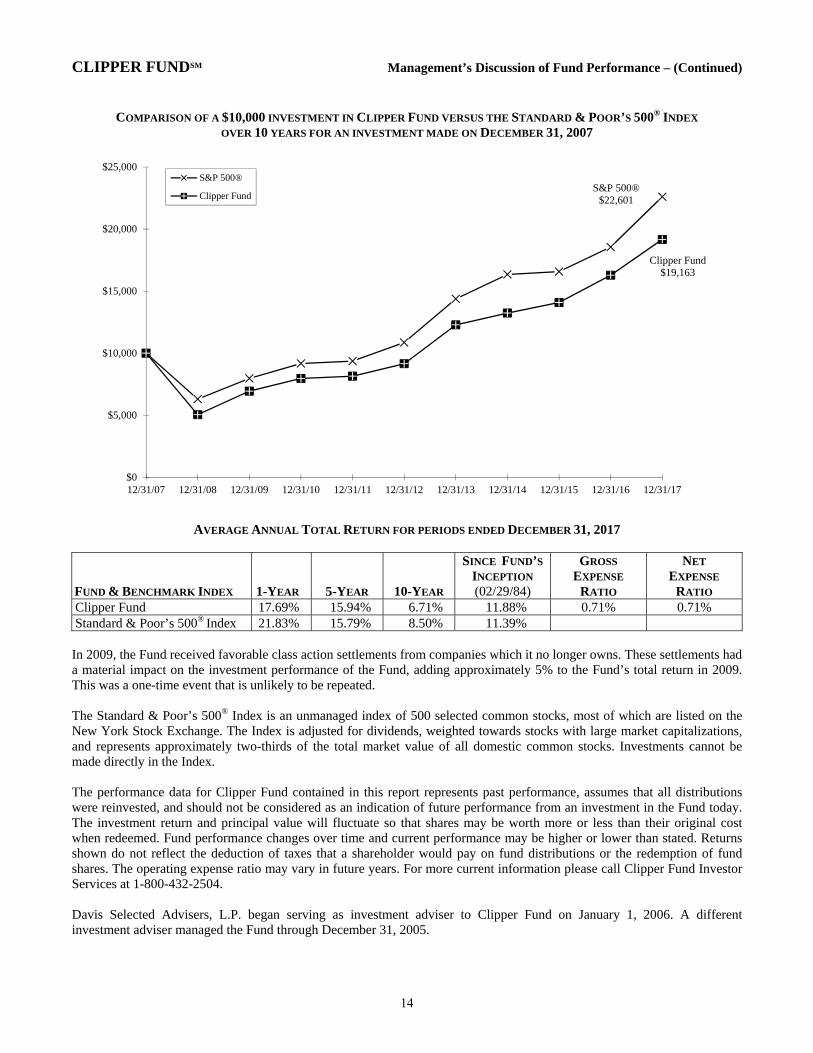
COMPARISON OF A $10,000 INVESTMENT IN CLIPPER FUND VERSUS THE STANDARD & POOR’S 500® INDEX
OVER 10 YEARS FOR AN INVESTMENT MADE ON DECEMBER 31, 2007
AVERAGE ANNUAL TOTAL RETURN FOR PERIODS ENDED DECEMBER 31, 2017
FUND & BENCHMARK INDEX 1-YEAR 5-YEAR 10-YEAR
SINCE FUND’S
INCEPTION (02/29/84)
GROSS EXPENSE
RATIO
NET EXPENSE
RATIO Clipper Fund 17.69% 15.94% 6.71% 11.88% 0.71% 0.71% Standard & Poor’s 500® Index 21.83% 15.79% 8.50% 11.39%
In 2009, the Fund received favorable class action settlements from companies which it no longer owns. These settlements had a material impact on the investment performance of the Fund, adding approximately 5% to the Fund’s total return in 2009. This was a one-time event that is unlikely to be repeated. The Standard & Poor’s 500® Index is an unmanaged index of 500 selected common stocks, most of which are listed on the New York Stock Exchange. The Index is adjusted for dividends, weighted towards stocks with large market capitalizations, and represents approximately two-thirds of the total market value of all domestic common stocks. Investments cannot be made directly in the Index. The performance data for Clipper Fund contained in this report represents past performance, assumes that all distributions were reinvested, and should not be considered as an indication of future performance from an investment in the Fund today. The investment return and principal value will fluctuate so that shares may be worth more or less than their original cost when redeemed. Fund performance changes over time and current performance may be higher or lower than stated. Returns shown do not reflect the deduction of taxes that a shareholder would pay on fund distributions or the redemption of fund shares. The operating expense ratio may vary in future years. For more current information please call Clipper Fund Investor Services at 1-800-432-2504. Davis Selected Advisers, L.P. began serving as investment adviser to Clipper Fund on January 1, 2006. A different investment adviser managed the Fund through December 31, 2005.
S&P 500® $22,601
Clipper Fund$19,163
$0
$5,000
$10,000
$15,000
$20,000
$25,000
12/31/07 12/31/08 12/31/09 12/31/10 12/31/11 12/31/12 12/31/13 12/31/14 12/31/15 12/31/16 12/31/17
S&P 500®
Clipper Fund
14
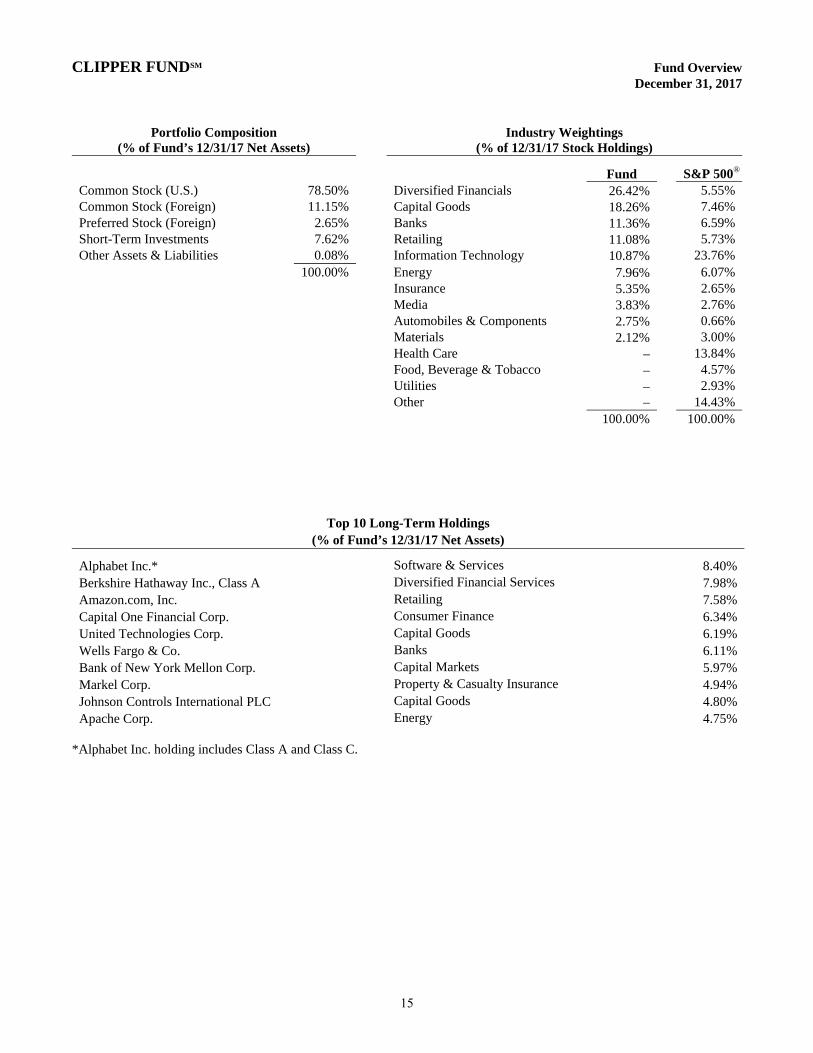
CLIPPER FUNDSM Fund Overview December 31, 2017
Portfolio Composition Industry Weightings (% of Fund’s 12/31/17 Net Assets) (% of 12/31/17 Stock Holdings)
Fund S&P 500®
Common Stock (U.S.) 78.50% Diversified Financials 26.42% 5.55% Common Stock (Foreign) 11.15% Capital Goods 18.26% 7.46% Preferred Stock (Foreign) 2.65% Banks 11.36% 6.59% Short-Term Investments 7.62% Retailing 11.08% 5.73% Other Assets & Liabilities 0.08% Information Technology 10.87% 23.76% 100.00% Energy 7.96% 6.07% Insurance 5.35% 2.65% Media 3.83% 2.76% Automobiles & Components 2.75% 0.66% Materials 2.12% 3.00% Health Care – 13.84% Food, Beverage & Tobacco – 4.57% Utilities – 2.93% Other – 14.43% 100.00% 100.00%
Top 10 Long-Term Holdings (% of Fund’s 12/31/17 Net Assets)
Alphabet Inc.* Software & Services 8.40% Berkshire Hathaway Inc., Class A Diversified Financial Services 7.98% Amazon.com, Inc. Retailing 7.58% Capital One Financial Corp. Consumer Finance 6.34% United Technologies Corp. Capital Goods 6.19% Wells Fargo & Co. Banks 6.11% Bank of New York Mellon Corp. Capital Markets 5.97% Markel Corp. Property & Casualty Insurance 4.94% Johnson Controls International PLC Capital Goods 4.80% Apache Corp. Energy 4.75%
*Alphabet Inc. holding includes Class A and Class C.
15
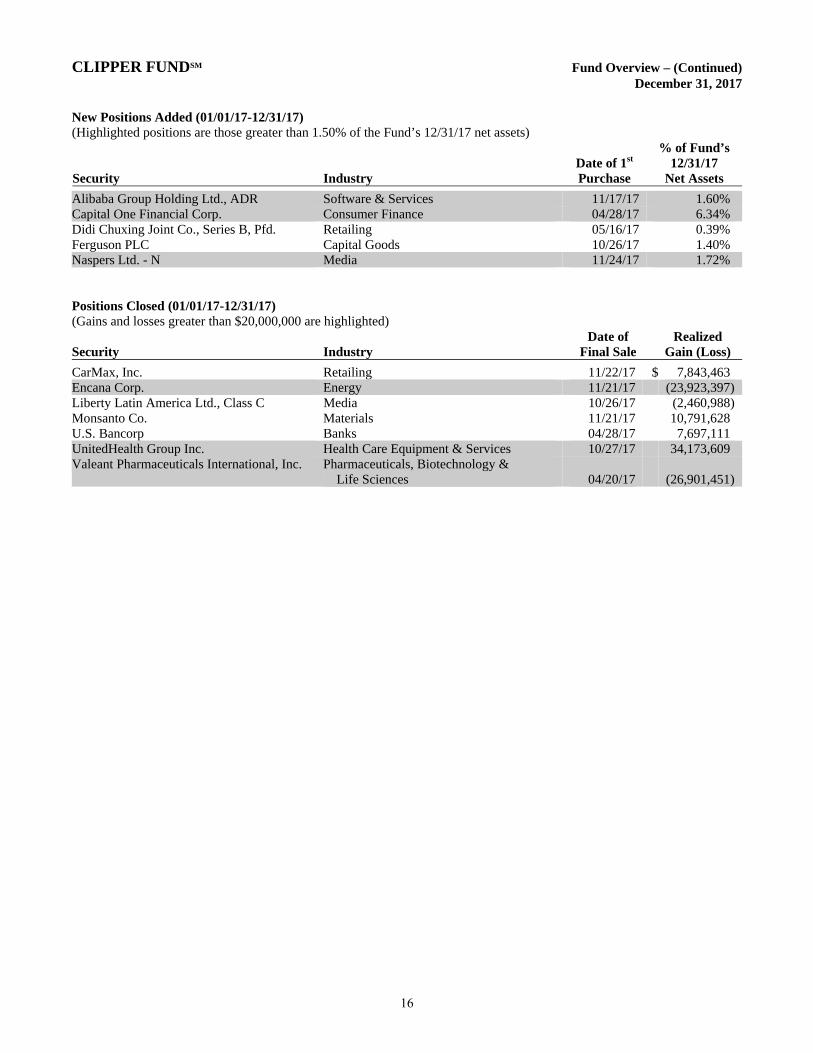
CLIPPER FUNDSM Fund Overview – (Continued) December 31, 2017 New Positions Added (01/01/17-12/31/17) (Highlighted positions are those greater than 1.50% of the Fund’s 12/31/17 net assets)
Security Industry Date of 1st Purchase
% of Fund’s 12/31/17
Net Assets
Alibaba Group Holding Ltd., ADR Software & Services 11/17/17 1.60% Capital One Financial Corp. Consumer Finance 04/28/17 6.34% Didi Chuxing Joint Co., Series B, Pfd. Retailing 05/16/17 0.39% Ferguson PLC Capital Goods 10/26/17 1.40% Naspers Ltd. - N Media 11/24/17 1.72% Positions Closed (01/01/17-12/31/17) (Gains and losses greater than $20,000,000 are highlighted)
Security Industry Date of
Final Sale Realized
Gain (Loss)
CarMax, Inc. Retailing 11/22/17 $ 7,843,463 Encana Corp. Energy 11/21/17 (23,923,397) Liberty Latin America Ltd., Class C Media 10/26/17 (2,460,988) Monsanto Co. Materials 11/21/17 10,791,628 U.S. Bancorp Banks 04/28/17 7,697,111 UnitedHealth Group Inc. Health Care Equipment & Services 10/27/17 34,173,609 Valeant Pharmaceuticals International, Inc. Pharmaceuticals, Biotechnology &
Life Sciences 04/20/17 (26,901,451)
16
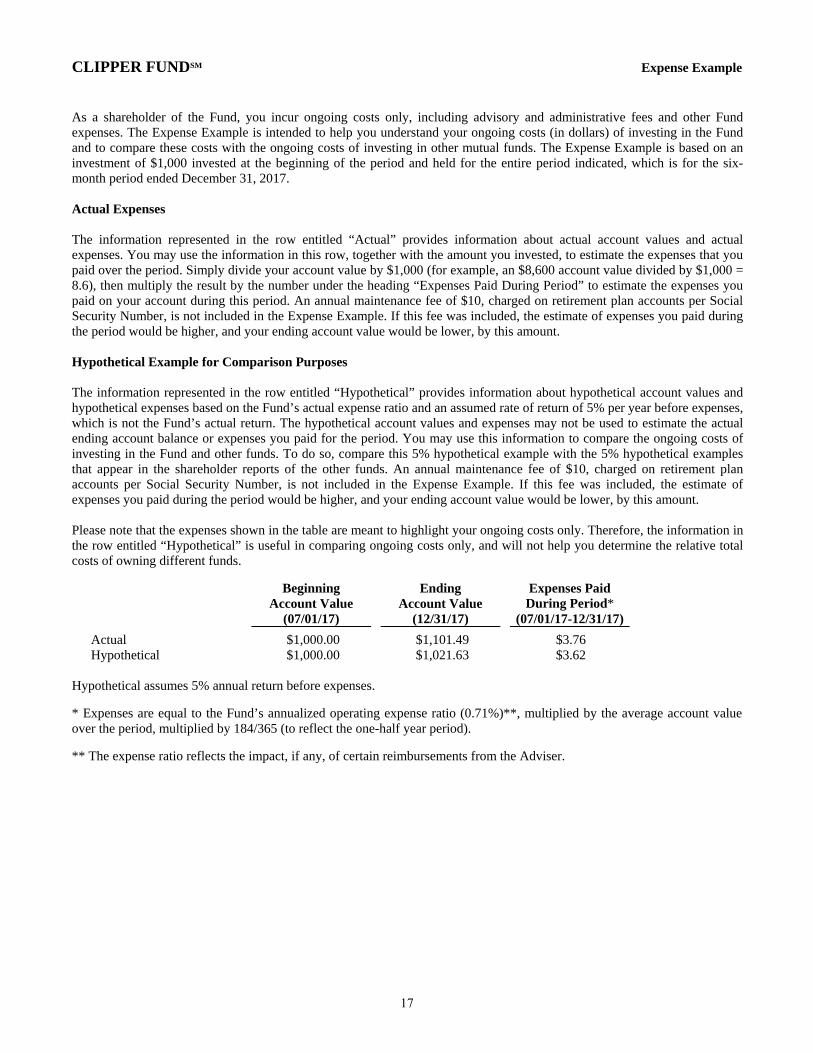
CLIPPER FUNDSM Expense Example As a shareholder of the Fund, you incur ongoing costs only, including advisory and administrative fees and other Fund expenses. The Expense Example is intended to help you understand your ongoing costs (in dollars) of investing in the Fund and to compare these costs with the ongoing costs of investing in other mutual funds. The Expense Example is based on an investment of $1,000 invested at the beginning of the period and held for the entire period indicated, which is for the six-month period ended December 31, 2017. Actual Expenses The information represented in the row entitled “Actual” provides information about actual account values and actual expenses. You may use the information in this row, together with the amount you invested, to estimate the expenses that you paid over the period. Simply divide your account value by $1,000 (for example, an $8,600 account value divided by $1,000 = 8.6), then multiply the result by the number under the heading “Expenses Paid During Period” to estimate the expenses you paid on your account during this period. An annual maintenance fee of $10, charged on retirement plan accounts per Social Security Number, is not included in the Expense Example. If this fee was included, the estimate of expenses you paid during the period would be higher, and your ending account value would be lower, by this amount. Hypothetical Example for Comparison Purposes The information represented in the row entitled “Hypothetical” provides information about hypothetical account values and hypothetical expenses based on the Fund’s actual expense ratio and an assumed rate of return of 5% per year before expenses, which is not the Fund’s actual return. The hypothetical account values and expenses may not be used to estimate the actual ending account balance or expenses you paid for the period. You may use this information to compare the ongoing costs of investing in the Fund and other funds. To do so, compare this 5% hypothetical example with the 5% hypothetical examples that appear in the shareholder reports of the other funds. An annual maintenance fee of $10, charged on retirement plan accounts per Social Security Number, is not included in the Expense Example. If this fee was included, the estimate of expenses you paid during the period would be higher, and your ending account value would be lower, by this amount. Please note that the expenses shown in the table are meant to highlight your ongoing costs only. Therefore, the information in the row entitled “Hypothetical” is useful in comparing ongoing costs only, and will not help you determine the relative total costs of owning different funds.
Beginning Account Value
(07/01/17)
Ending Account Value
(12/31/17)
Expenses Paid During Period*
(07/01/17-12/31/17)
Actual $1,000.00 $1,101.49 $3.76 Hypothetical $1,000.00 $1,021.63 $3.62
Hypothetical assumes 5% annual return before expenses.
* Expenses are equal to the Fund’s annualized operating expense ratio (0.71%)**, multiplied by the average account value over the period, multiplied by 184/365 (to reflect the one-half year period).
** The expense ratio reflects the impact, if any, of certain reimbursements from the Adviser.
17
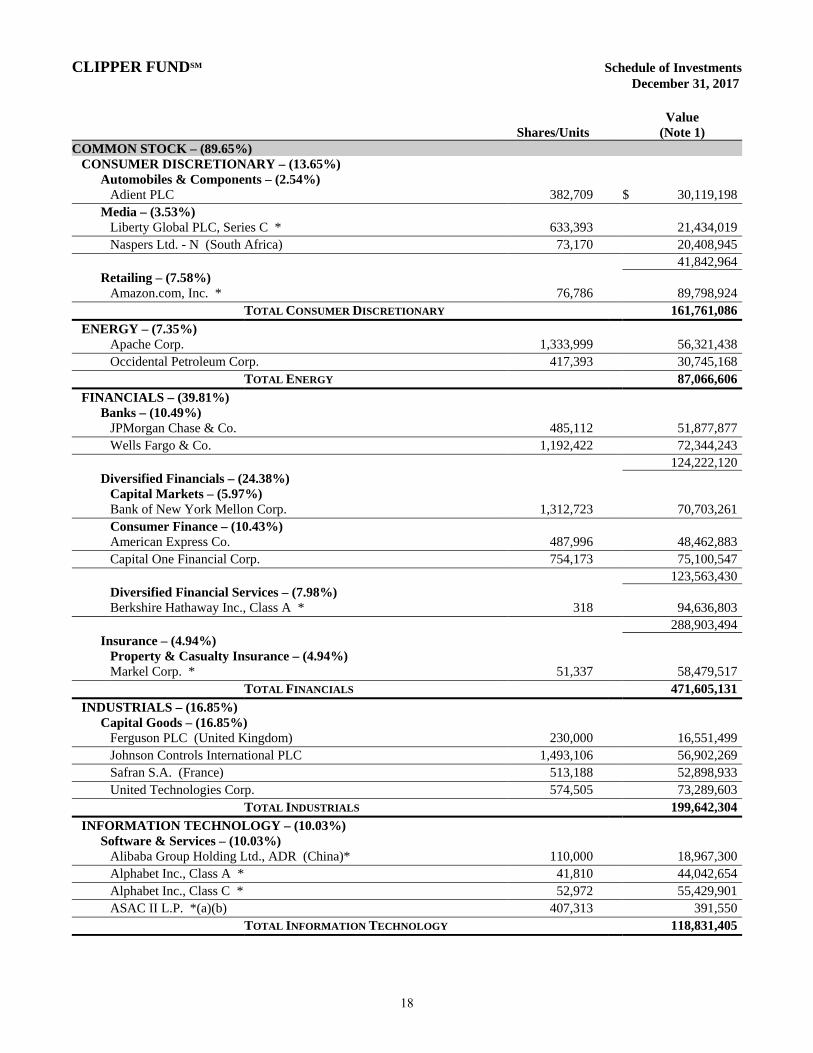
CLIPPER FUNDSM Schedule of Investments December 31, 2017
Shares/Units Value
(Note 1) COMMON STOCK – (89.65%) CONSUMER DISCRETIONARY – (13.65%) Automobiles & Components – (2.54%) Adient PLC 382,709 $ 30,119,198 Media – (3.53%) Liberty Global PLC, Series C * 633,393 21,434,019 Naspers Ltd. - N (South Africa) 73,170 20,408,945 41,842,964 Retailing – (7.58%) Amazon.com, Inc. * 76,786 89,798,924 TOTAL CONSUMER DISCRETIONARY 161,761,086
ENERGY – (7.35%) Apache Corp. 1,333,999 56,321,438 Occidental Petroleum Corp. 417,393 30,745,168 TOTAL ENERGY 87,066,606
FINANCIALS – (39.81%) Banks – (10.49%) JPMorgan Chase & Co. 485,112 51,877,877 Wells Fargo & Co. 1,192,422 72,344,243 124,222,120 Diversified Financials – (24.38%) Capital Markets – (5.97%) Bank of New York Mellon Corp. 1,312,723 70,703,261 Consumer Finance – (10.43%) American Express Co. 487,996 48,462,883 Capital One Financial Corp. 754,173 75,100,547 123,563,430 Diversified Financial Services – (7.98%) Berkshire Hathaway Inc., Class A * 318 94,636,803 288,903,494 Insurance – (4.94%) Property & Casualty Insurance – (4.94%) Markel Corp. * 51,337 58,479,517 TOTAL FINANCIALS 471,605,131
INDUSTRIALS – (16.85%) Capital Goods – (16.85%) Ferguson PLC (United Kingdom) 230,000 16,551,499 Johnson Controls International PLC 1,493,106 56,902,269 Safran S.A. (France) 513,188 52,898,933 United Technologies Corp. 574,505 73,289,603 TOTAL INDUSTRIALS 199,642,304
INFORMATION TECHNOLOGY – (10.03%) Software & Services – (10.03%) Alibaba Group Holding Ltd., ADR (China)* 110,000 18,967,300 Alphabet Inc., Class A * 41,810 44,042,654 Alphabet Inc., Class C * 52,972 55,429,901 ASAC II L.P. *(a)(b) 407,313 391,550 TOTAL INFORMATION TECHNOLOGY 118,831,405
18
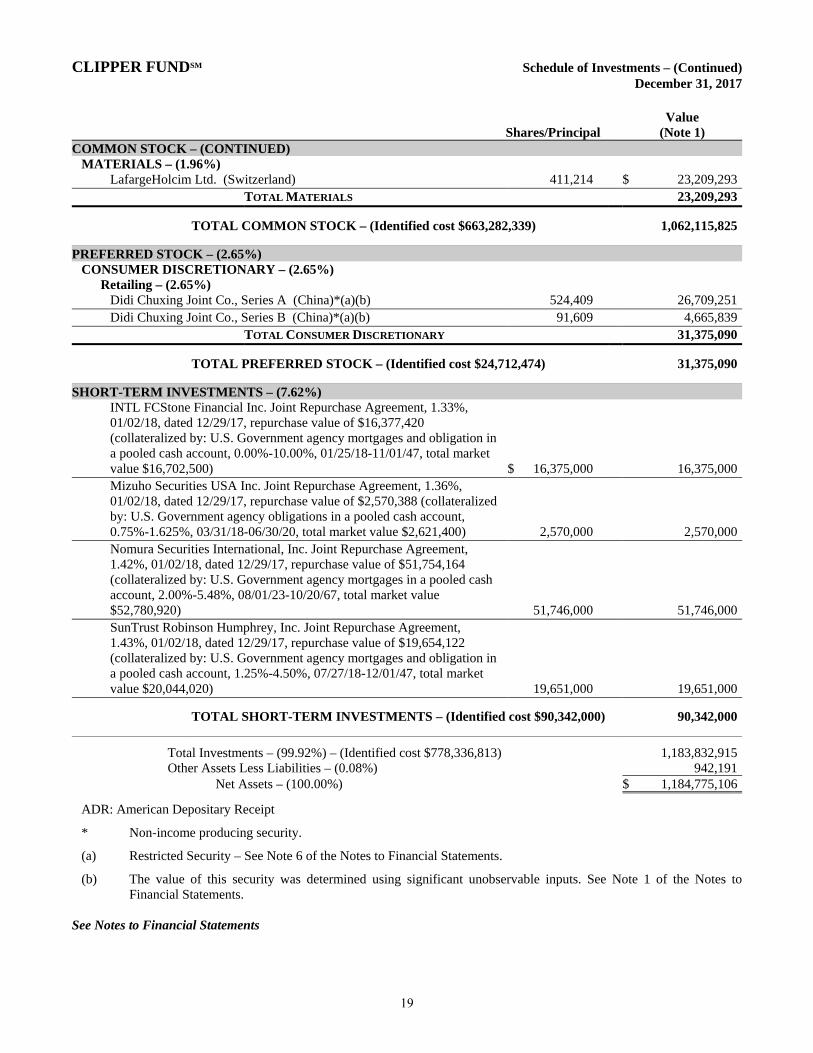
CLIPPER FUNDSM Schedule of Investments – (Continued) December 31, 2017
Shares/Principal Value
(Note 1) COMMON STOCK – (CONTINUED) MATERIALS – (1.96%) LafargeHolcim Ltd. (Switzerland) 411,214 $ 23,209,293 TOTAL MATERIALS 23,209,293
TOTAL COMMON STOCK – (Identified cost $663,282,339) 1,062,115,825
PREFERRED STOCK – (2.65%) CONSUMER DISCRETIONARY – (2.65%) Retailing – (2.65%) Didi Chuxing Joint Co., Series A (China)*(a)(b) 524,409 26,709,251 Didi Chuxing Joint Co., Series B (China)*(a)(b) 91,609 4,665,839 TOTAL CONSUMER DISCRETIONARY 31,375,090
TOTAL PREFERRED STOCK – (Identified cost $24,712,474) 31,375,090
SHORT-TERM INVESTMENTS – (7.62%)
INTL FCStone Financial Inc. Joint Repurchase Agreement, 1.33%, 01/02/18, dated 12/29/17, repurchase value of $16,377,420 (collateralized by: U.S. Government agency mortgages and obligation in a pooled cash account, 0.00%-10.00%, 01/25/18-11/01/47, total market value $16,702,500) $ 16,375,000 16,375,000
Mizuho Securities USA Inc. Joint Repurchase Agreement, 1.36%, 01/02/18, dated 12/29/17, repurchase value of $2,570,388 (collateralized by: U.S. Government agency obligations in a pooled cash account, 0.75%-1.625%, 03/31/18-06/30/20, total market value $2,621,400) 2,570,000 2,570,000
Nomura Securities International, Inc. Joint Repurchase Agreement, 1.42%, 01/02/18, dated 12/29/17, repurchase value of $51,754,164 (collateralized by: U.S. Government agency mortgages in a pooled cash account, 2.00%-5.48%, 08/01/23-10/20/67, total market value $52,780,920) 51,746,000 51,746,000
SunTrust Robinson Humphrey, Inc. Joint Repurchase Agreement, 1.43%, 01/02/18, dated 12/29/17, repurchase value of $19,654,122 (collateralized by: U.S. Government agency mortgages and obligation in a pooled cash account, 1.25%-4.50%, 07/27/18-12/01/47, total market value $20,044,020) 19,651,000 19,651,000
TOTAL SHORT-TERM INVESTMENTS – (Identified cost $90,342,000) 90,342,000
Total Investments – (99.92%) – (Identified cost $778,336,813) 1,183,832,915 Other Assets Less Liabilities – (0.08%) 942,191 Net Assets – (100.00%) $ 1,184,775,106
ADR: American Depositary Receipt
* Non-income producing security.
(a) Restricted Security – See Note 6 of the Notes to Financial Statements.
(b)
The value of this security was determined using significant unobservable inputs. See Note 1 of the Notes to Financial Statements.
See Notes to Financial Statements
19
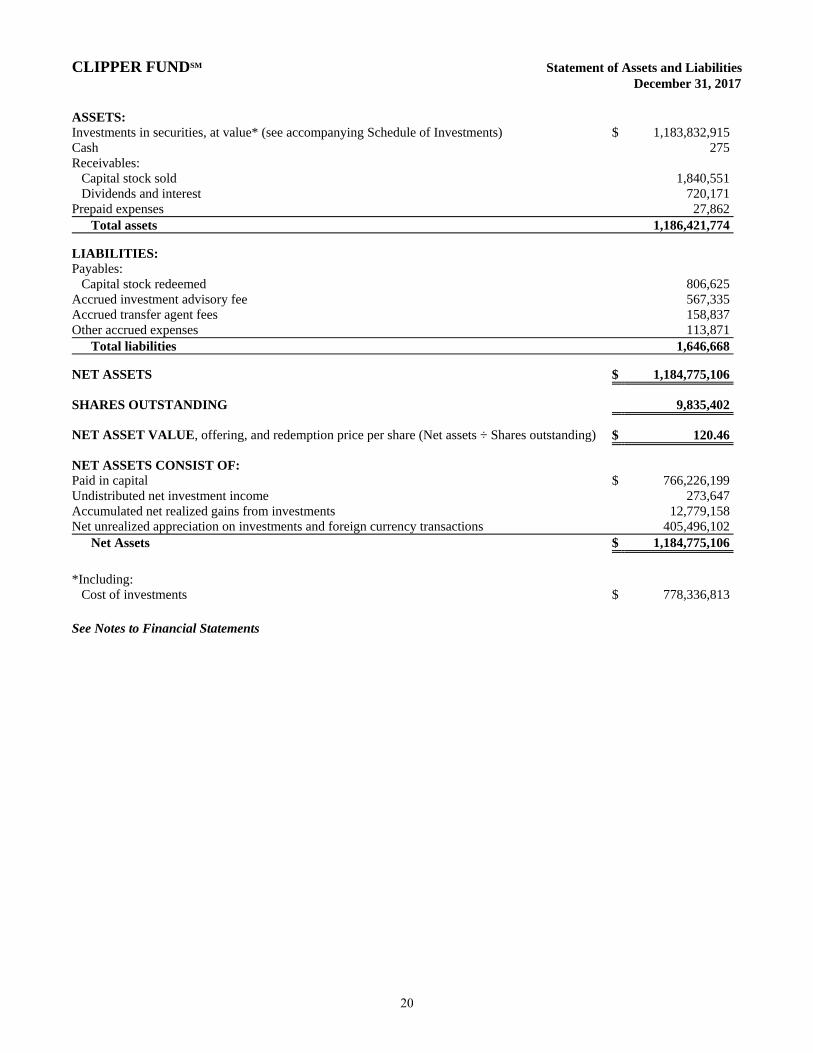
CLIPPER FUNDSM Statement of Assets and Liabilities December 31, 2017 ASSETS: Investments in securities, at value* (see accompanying Schedule of Investments) $ 1,183,832,915Cash 275Receivables: Capital stock sold 1,840,551 Dividends and interest 720,171Prepaid expenses 27,862 Total assets 1,186,421,774
LIABILITIES: Payables: Capital stock redeemed 806,625Accrued investment advisory fee 567,335Accrued transfer agent fees 158,837Other accrued expenses 113,871 Total liabilities 1,646,668
NET ASSETS $ 1,184,775,106
SHARES OUTSTANDING 9,835,402
NET ASSET VALUE, offering, and redemption price per share (Net assets ÷ Shares outstanding) $ 120.46
NET ASSETS CONSIST OF: Paid in capital $ 766,226,199Undistributed net investment income 273,647Accumulated net realized gains from investments 12,779,158Net unrealized appreciation on investments and foreign currency transactions 405,496,102 Net Assets $ 1,184,775,106
*Including: Cost of investments $ 778,336,813 See Notes to Financial Statements
20
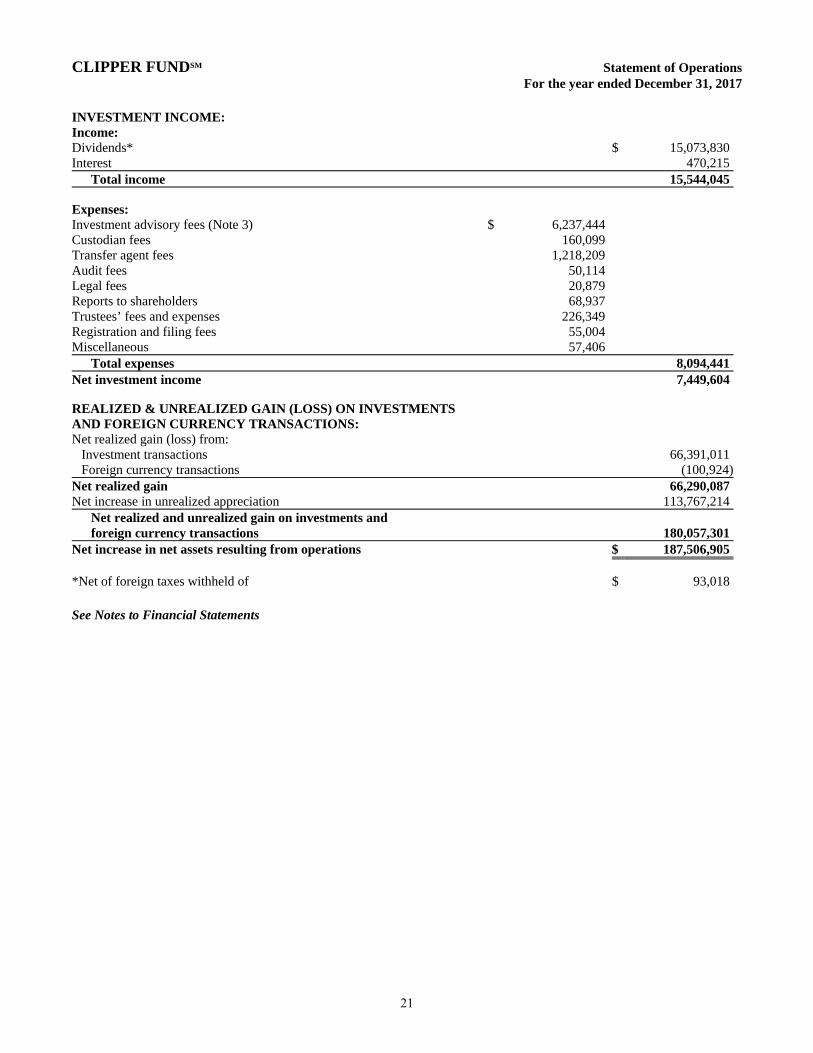
CLIPPER FUNDSM Statement of Operations For the year ended December 31, 2017 INVESTMENT INCOME: Income: Dividends* $ 15,073,830Interest 470,215 Total income 15,544,045 Expenses: Investment advisory fees (Note 3) $ 6,237,444 Custodian fees 160,099 Transfer agent fees 1,218,209 Audit fees 50,114 Legal fees 20,879 Reports to shareholders 68,937 Trustees’ fees and expenses 226,349 Registration and filing fees 55,004 Miscellaneous 57,406 Total expenses 8,094,441Net investment income 7,449,604 REALIZED & UNREALIZED GAIN (LOSS) ON INVESTMENTS AND FOREIGN CURRENCY TRANSACTIONS: Net realized gain (loss) from: Investment transactions 66,391,011 Foreign currency transactions (100,924)Net realized gain 66,290,087Net increase in unrealized appreciation 113,767,214
Net realized and unrealized gain on investments and foreign currency transactions 180,057,301
Net increase in net assets resulting from operations $ 187,506,905 *Net of foreign taxes withheld of $ 93,018 See Notes to Financial Statements
21
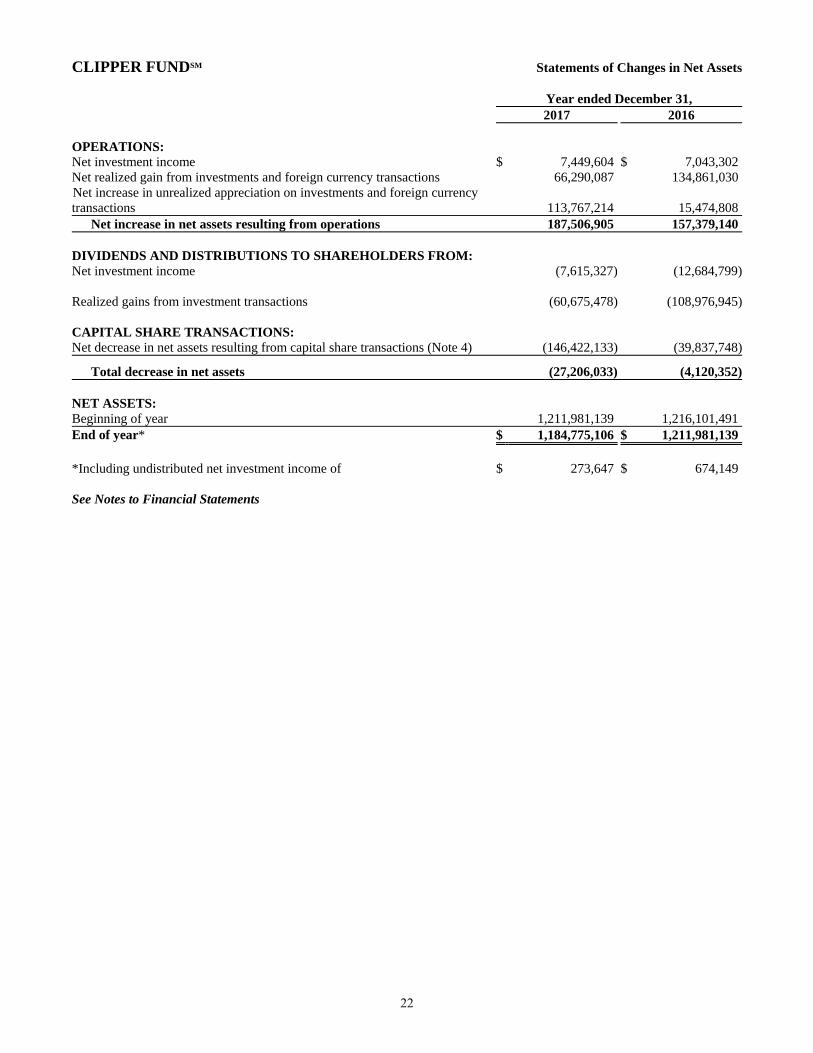
CLIPPER FUNDSM Statements of Changes in Net Assets
Year ended December 31, 2017 2016
OPERATIONS: Net investment income $ 7,449,604 $ 7,043,302Net realized gain from investments and foreign currency transactions 66,290,087 134,861,030 Net increase in unrealized appreciation on investments and foreign currency transactions 113,767,214 15,474,808 Net increase in net assets resulting from operations 187,506,905 157,379,140 DIVIDENDS AND DISTRIBUTIONS TO SHAREHOLDERS FROM: Net investment income (7,615,327) (12,684,799) Realized gains from investment transactions (60,675,478) (108,976,945) CAPITAL SHARE TRANSACTIONS: Net decrease in net assets resulting from capital share transactions (Note 4) (146,422,133) (39,837,748)
Total decrease in net assets (27,206,033) (4,120,352) NET ASSETS: Beginning of year 1,211,981,139 1,216,101,491End of year* $ 1,184,775,106 $ 1,211,981,139 *Including undistributed net investment income of $ 273,647 $ 674,149 See Notes to Financial Statements
22
CLIPPER FUNDSM Notes to Financial Statements December 31, 2017 NOTE 1 - SUMMARY OF SIGNIFICANT ACCOUNTING POLICIES Clipper Funds Trust, a Delaware statutory trust (“Trust”), on behalf of Clipper Fund (“Fund”), a series of the Trust, is registered under the Investment Company Act of 1940, as amended, as a non-diversified, open-end management investment company. The Fund follows the reporting guidance of the Financial Accounting Standards Board (“FASB”) Accounting Standards Codification Topic 946, Financial Services – Investment Companies. The Fund’s investment objective is long-term capital growth and capital preservation. Davis Selected Advisers, L.P. (“Davis Advisors” or “Adviser”), the Fund’s investment adviser, seeks to invest the Fund’s assets primarily in common stocks of large companies (generally, companies with market capitalizations of $10 billion or more at the time of initial purchase) that are trading at prices below the Adviser’s estimate of their intrinsic values. The following is a summary of significant accounting policies consistently followed by the Fund in the preparation of its financial statements. Security Valuation - The Fund calculates the net asset value of its shares as of the close of the New York Stock Exchange (“Exchange”), normally 4:00 P.M. Eastern time, on each day the Exchange is open for business. Securities listed on the Exchange (and other national exchanges including NASDAQ) are valued at the last reported sales price on the day of valuation. Listed securities for which no sale was reported on that date are valued at the last quoted bid price. Securities traded on foreign exchanges are valued based upon the last sales price on the principal exchange on which the security is traded prior to the time when the Fund’s assets are valued. Securities (including restricted securities) for which market quotations are not readily available or securities whose values have been materially affected by what the Adviser identifies as a significant event occurring before the Fund’s assets are valued but after the close of their respective exchanges will be fair valued using a fair valuation methodology applicable to the security type or the significant event as previously approved by the Fund’s Pricing Committee and Board of Trustees. The Pricing Committee considers all facts it deems relevant that are reasonably available, through either public information or information available to the Adviser’s portfolio management team, when determining the fair value of a security. To assess the appropriateness of security valuations, the Adviser may consider (i) comparing prior day prices and/or prices of comparable securities; (ii) comparing sale prices to the prior or current day prices and challenge those prices exceeding certain tolerance levels with the third-party pricing service or broker source; (iii) new rounds of financing; (iv) the performance of the market or the issuer’s industry; (v) the liquidity of the security; (vi) the size of the holding in a fund; and/or (vii) any other appropriate information. The determination of a security’s fair value price often involves the consideration of a number of subjective factors and is therefore subject to the unavoidable risk that the value assigned to a security may be higher or lower than the security’s value would be if a reliable market quotation of the security was readily available. Fair value determinations are subject to review, approval, and ratification by the Fund’s Board of Trustees at its next regularly scheduled meeting covering the calendar quarter in which the fair valuation was determined. Fair valuation methods used by the Fund may include, but are not limited to, valuing securities initially at cost (excluding commissions) and subsequently adjusting the value due to: additional transactions by the issuer, changes in company specific fundamentals and changes in the value of similar securities. Values may be further adjusted for any discounts related to security-specific resale restrictions. Short-term securities purchased within 60 days to maturity are valued at amortized cost, which approximates market value. The Fund’s valuation procedures are reviewed and subject to approval by the Board of Trustees. There have been no significant changes to the fair valuation procedures during the period. Fair Value Measurements - Fair value is defined as the price that the Fund would receive upon selling an investment in an orderly transaction to an independent buyer in the principal market for the investment. Various inputs are used to determine the fair value of the Fund’s investments. These inputs are summarized in the three broad levels listed below.
Level 1 – quoted prices in active markets for identical securities Level 2 – other significant observable inputs (including quoted prices for similar investments, interest rates, prepayment speeds, credit risk, etc.) Level 3 – significant unobservable inputs (including the Fund’s own assumptions in determining the fair value of
investments) The inputs or methodologies used for valuing securities are not necessarily an indication of the risks associated with investing in those securities nor can it be assured that the Fund can obtain the fair value assigned to a security if it were to sell the security.
23
CLIPPER FUNDSM Notes to Financial Statements – (Continued) December 31, 2017 NOTE 1 - SUMMARY OF SIGNIFICANT ACCOUNTING POLICIES – (CONTINUED) Fair Value Measurements - (Continued)
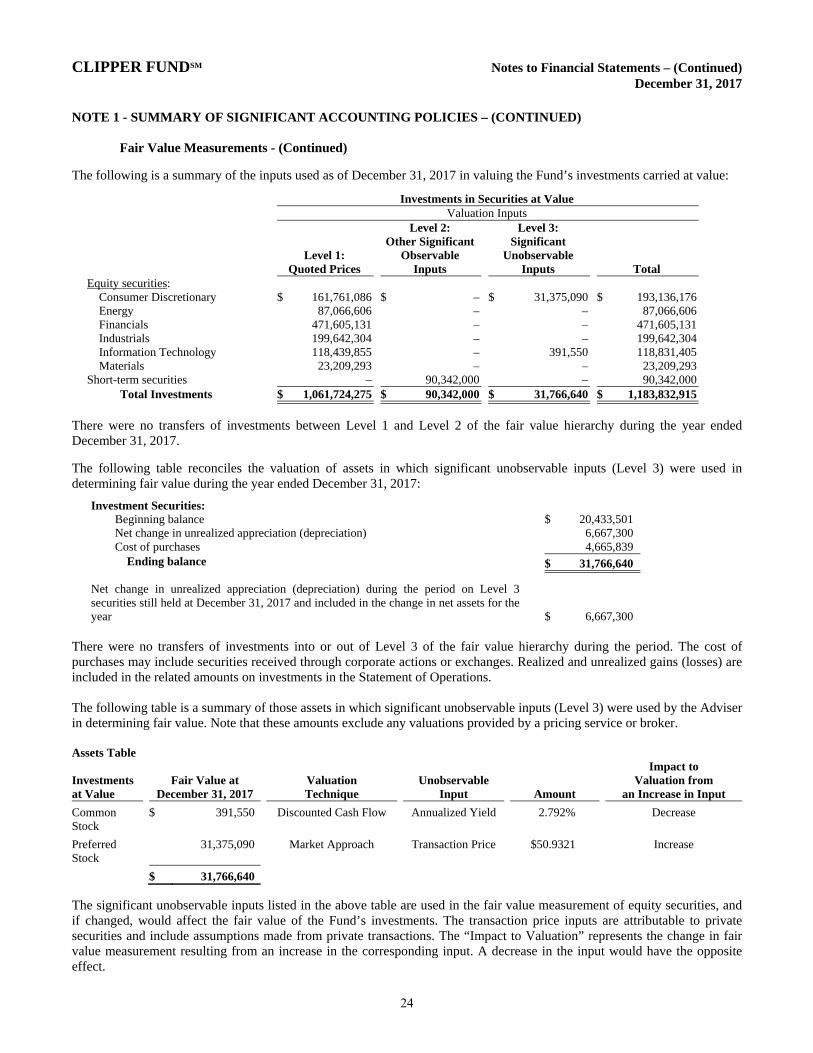
The following is a summary of the inputs used as of December 31, 2017 in valuing the Fund’s investments carried at value:
Investments in Securities at Value Valuation Inputs Level 2: Level 3: Other Significant Significant Level 1: Observable Unobservable Quoted Prices Inputs Inputs Total
Equity securities: Consumer Discretionary $ 161,761,086 $ – $ 31,375,090 $ 193,136,176Energy 87,066,606 – – 87,066,606Financials 471,605,131 – – 471,605,131Industrials 199,642,304 – – 199,642,304Information Technology 118,439,855 – 391,550 118,831,405Materials 23,209,293 – – 23,209,293
Short-term securities – 90,342,000 – 90,342,000 Total Investments $ 1,061,724,275 $ 90,342,000 $ 31,766,640 $ 1,183,832,915
There were no transfers of investments between Level 1 and Level 2 of the fair value hierarchy during the year ended December 31, 2017.
The following table reconciles the valuation of assets in which significant unobservable inputs (Level 3) were used in determining fair value during the year ended December 31, 2017:
Investment Securities: Beginning balance $ 20,433,501 Net change in unrealized appreciation (depreciation) 6,667,300 Cost of purchases 4,665,839 Ending balance $ 31,766,640
Net change in unrealized appreciation (depreciation) during the period on Level 3 securities still held at December 31, 2017 and included in the change in net assets for the year
$ 6,667,300 There were no transfers of investments into or out of Level 3 of the fair value hierarchy during the period. The cost of purchases may include securities received through corporate actions or exchanges. Realized and unrealized gains (losses) are included in the related amounts on investments in the Statement of Operations. The following table is a summary of those assets in which significant unobservable inputs (Level 3) were used by the Adviser in determining fair value. Note that these amounts exclude any valuations provided by a pricing service or broker. Assets Table Impact to Investments Fair Value at Valuation Unobservable Valuation from at Value December 31, 2017 Technique Input Amount an Increase in Input
Common Stock
$ 391,550 Discounted Cash Flow
Annualized Yield 2.792% Decrease
Preferred Stock
31,375,090 Market Approach Transaction Price $50.9321 Increase
$ 31,766,640
The significant unobservable inputs listed in the above table are used in the fair value measurement of equity securities, and if changed, would affect the fair value of the Fund’s investments. The transaction price inputs are attributable to private securities and include assumptions made from private transactions. The “Impact to Valuation” represents the change in fair value measurement resulting from an increase in the corresponding input. A decrease in the input would have the opposite effect.
24
CLIPPER FUNDSM Notes to Financial Statements – (Continued) December 31, 2017 NOTE 1 - SUMMARY OF SIGNIFICANT ACCOUNTING POLICIES – (CONTINUED) Master Repurchase Agreements - The Fund, along with other affiliated funds, may transfer uninvested cash balances into one or more master repurchase agreement accounts. These balances are invested in one or more repurchase agreements, secured by U.S. Government securities. A custodian bank holds securities pledged as collateral for repurchase agreements until the agreements mature. Each agreement requires that the market value of the collateral be sufficient to cover payments of interest and principal; however, in the event of default by the other party to the agreement, retention of the collateral may be subject to legal proceedings. Currency Translation - The market values of all assets and liabilities denominated in foreign currencies are recorded in the financial statements after translation to the U.S. Dollar based upon the mean between the bid and offered quotations of the currencies against U.S. Dollars on the date of valuation. The cost basis of such assets and liabilities is determined based upon historical exchange rates. Income and expenses are translated at average exchange rates in effect as accrued or incurred. Foreign Currency - The Fund may enter into forward purchases or sales of foreign currencies to hedge certain foreign currency denominated assets and liabilities against declines in market value relative to the U.S. Dollar. Forward currency contracts are marked-to-market daily and the change in market value is recorded by the Fund as an unrealized gain or loss. When the forward currency contract is closed, the Fund records a realized gain or loss equal to the difference between the value of the forward currency contract at the time it was opened and value at the time it was closed. Investments in forward currency contracts may expose the Fund to risks resulting from unanticipated movements in foreign currency exchange rates or failure of the counter-party to the agreement to perform in accordance with the terms of the contract. There were no forward contracts entered into by the Fund. Reported net realized foreign exchange gains or losses arise from the sales of foreign currencies, currency gains or losses realized between the trade and settlement dates on security transactions, the difference between the amounts of dividends, interest, and foreign withholding taxes recorded on the Fund’s books, and the U.S. Dollar equivalent of the amounts actually received or paid. Net unrealized foreign exchange gains or losses arise from changes in the value of assets and liabilities other than investments in securities at fiscal year end, resulting from changes in the exchange rate. The Fund includes foreign currency gains and losses realized on the sales of investments together with market gains and losses on such investments in the Statement of Operations. Federal Income Taxes - It is the Fund’s policy to comply with the requirements of the Internal Revenue Code applicable to regulated investment companies, and to distribute substantially all of its taxable income, including any net realized gains on investments not offset by loss carryovers, to shareholders. Therefore, no provision for federal income or excise tax is required. The Adviser analyzed the Fund’s tax positions taken on federal and state income tax returns for all open tax years and concluded that as of December 31, 2017, no provision for income tax is required in the Fund’s financial statements related to these tax positions. The Fund’s federal and state (Arizona) income and federal excise tax returns for tax years for which the applicable statutes of limitations have not expired are subject to examination by the Internal Revenue Service and state department of revenue. The earliest tax year that remains subject to examination by these jurisdictions is 2014.
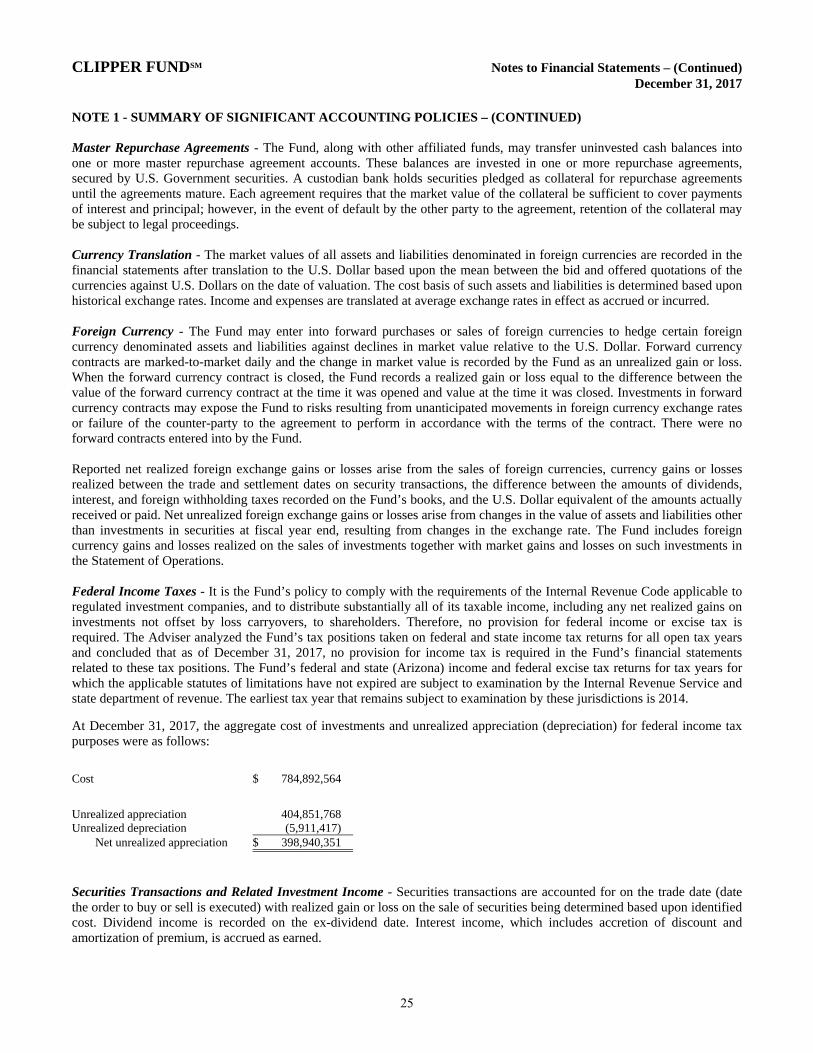
At December 31, 2017, the aggregate cost of investments and unrealized appreciation (depreciation) for federal income tax purposes were as follows:
Cost $ 784,892,564
Unrealized appreciation 404,851,768 Unrealized depreciation (5,911,417)
Net unrealized appreciation $ 398,940,351
Securities Transactions and Related Investment Income - Securities transactions are accounted for on the trade date (date the order to buy or sell is executed) with realized gain or loss on the sale of securities being determined based upon identified cost. Dividend income is recorded on the ex-dividend date. Interest income, which includes accretion of discount and amortization of premium, is accrued as earned.
25
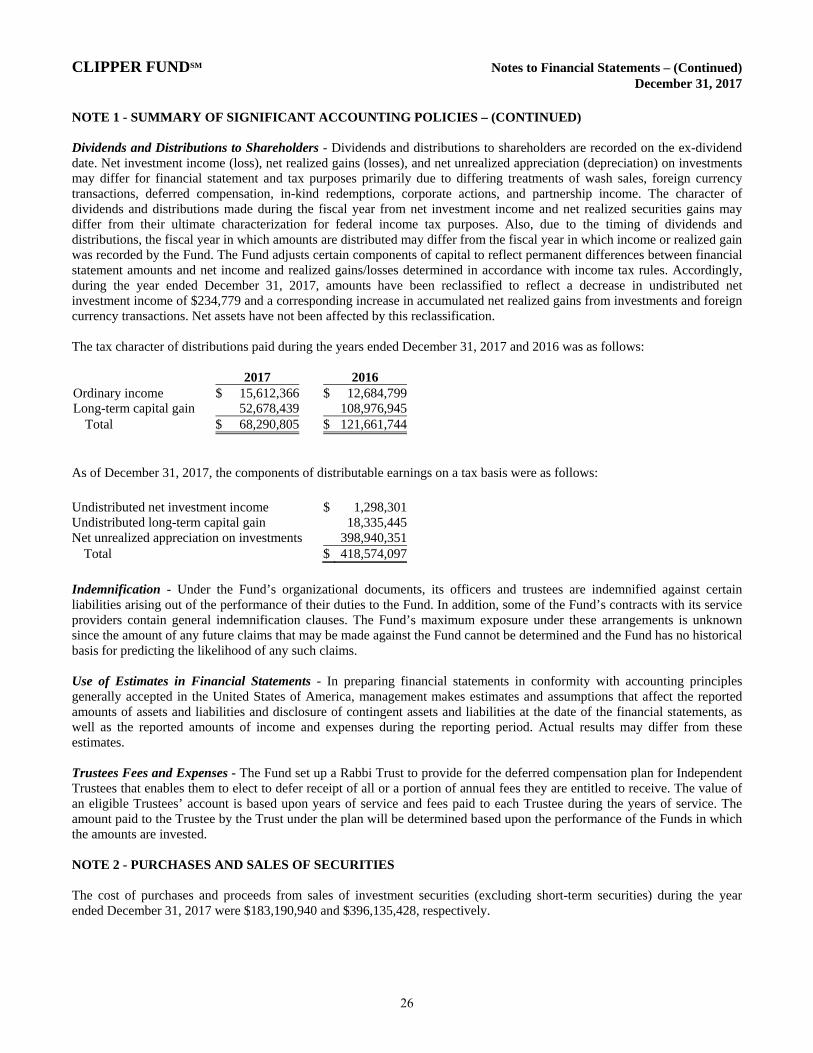
CLIPPER FUNDSM Notes to Financial Statements – (Continued) December 31, 2017 NOTE 1 - SUMMARY OF SIGNIFICANT ACCOUNTING POLICIES – (CONTINUED) Dividends and Distributions to Shareholders - Dividends and distributions to shareholders are recorded on the ex-dividend date. Net investment income (loss), net realized gains (losses), and net unrealized appreciation (depreciation) on investments may differ for financial statement and tax purposes primarily due to differing treatments of wash sales, foreign currency transactions, deferred compensation, in-kind redemptions, corporate actions, and partnership income. The character of dividends and distributions made during the fiscal year from net investment income and net realized securities gains may differ from their ultimate characterization for federal income tax purposes. Also, due to the timing of dividends and distributions, the fiscal year in which amounts are distributed may differ from the fiscal year in which income or realized gain was recorded by the Fund. The Fund adjusts certain components of capital to reflect permanent differences between financial statement amounts and net income and realized gains/losses determined in accordance with income tax rules. Accordingly, during the year ended December 31, 2017, amounts have been reclassified to reflect a decrease in undistributed net investment income of $234,779 and a corresponding increase in accumulated net realized gains from investments and foreign currency transactions. Net assets have not been affected by this reclassification. The tax character of distributions paid during the years ended December 31, 2017 and 2016 was as follows:
2017 2016Ordinary income $ 15,612,366 $ 12,684,799Long-term capital gain 52,678,439 108,976,945
Total $ 68,290,805 $ 121,661,744
As of December 31, 2017, the components of distributable earnings on a tax basis were as follows:
Undistributed net investment income $ 1,298,301Undistributed long-term capital gain 18,335,445Net unrealized appreciation on investments 398,940,351
Total $ 418,574,097
Indemnification - Under the Fund’s organizational documents, its officers and trustees are indemnified against certain liabilities arising out of the performance of their duties to the Fund. In addition, some of the Fund’s contracts with its service providers contain general indemnification clauses. The Fund’s maximum exposure under these arrangements is unknown since the amount of any future claims that may be made against the Fund cannot be determined and the Fund has no historical basis for predicting the likelihood of any such claims. Use of Estimates in Financial Statements - In preparing financial statements in conformity with accounting principles generally accepted in the United States of America, management makes estimates and assumptions that affect the reported amounts of assets and liabilities and disclosure of contingent assets and liabilities at the date of the financial statements, as well as the reported amounts of income and expenses during the reporting period. Actual results may differ from these estimates. Trustees Fees and Expenses - The Fund set up a Rabbi Trust to provide for the deferred compensation plan for Independent Trustees that enables them to elect to defer receipt of all or a portion of annual fees they are entitled to receive. The value of an eligible Trustees’ account is based upon years of service and fees paid to each Trustee during the years of service. The amount paid to the Trustee by the Trust under the plan will be determined based upon the performance of the Funds in which the amounts are invested. NOTE 2 - PURCHASES AND SALES OF SECURITIES The cost of purchases and proceeds from sales of investment securities (excluding short-term securities) during the year ended December 31, 2017 were $183,190,940 and $396,135,428, respectively.
26
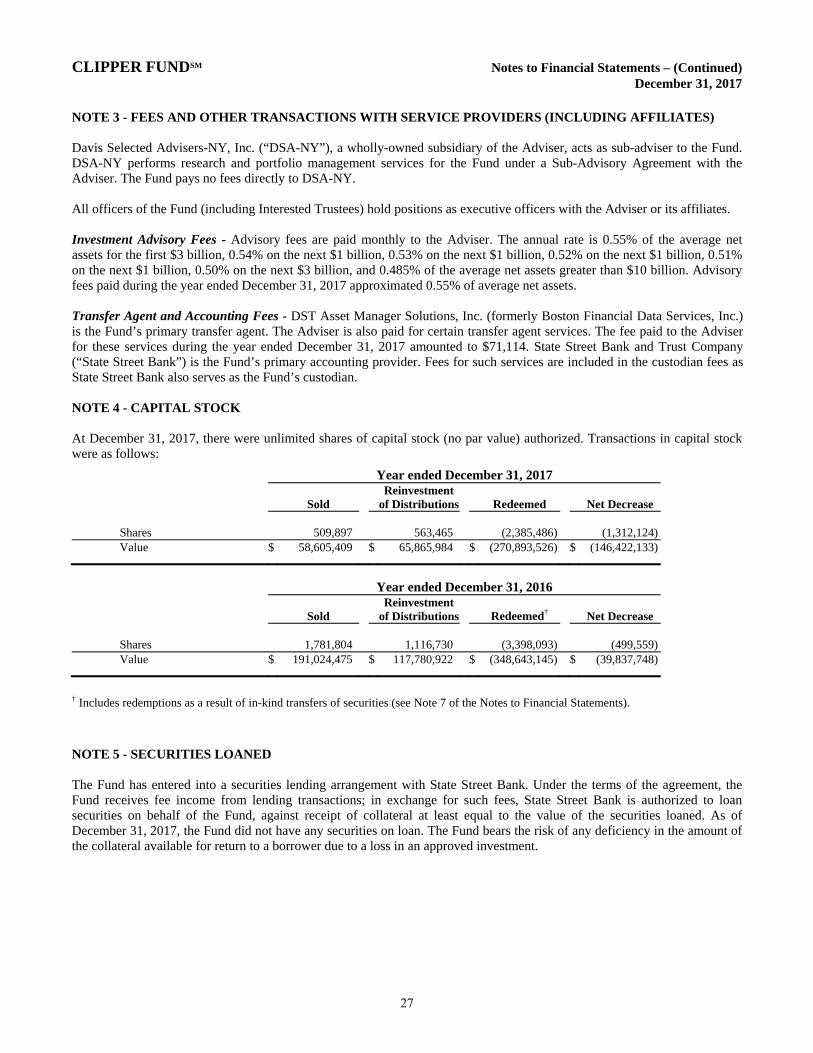
CLIPPER FUNDSM Notes to Financial Statements – (Continued) December 31, 2017 NOTE 3 - FEES AND OTHER TRANSACTIONS WITH SERVICE PROVIDERS (INCLUDING AFFILIATES) Davis Selected Advisers-NY, Inc. (“DSA-NY”), a wholly-owned subsidiary of the Adviser, acts as sub-adviser to the Fund. DSA-NY performs research and portfolio management services for the Fund under a Sub-Advisory Agreement with the Adviser. The Fund pays no fees directly to DSA-NY. All officers of the Fund (including Interested Trustees) hold positions as executive officers with the Adviser or its affiliates. Investment Advisory Fees - Advisory fees are paid monthly to the Adviser. The annual rate is 0.55% of the average net assets for the first $3 billion, 0.54% on the next $1 billion, 0.53% on the next $1 billion, 0.52% on the next $1 billion, 0.51% on the next $1 billion, 0.50% on the next $3 billion, and 0.485% of the average net assets greater than $10 billion. Advisory fees paid during the year ended December 31, 2017 approximated 0.55% of average net assets. Transfer Agent and Accounting Fees - DST Asset Manager Solutions, Inc. (formerly Boston Financial Data Services, Inc.) is the Fund’s primary transfer agent. The Adviser is also paid for certain transfer agent services. The fee paid to the Adviser for these services during the year ended December 31, 2017 amounted to $71,114. State Street Bank and Trust Company (“State Street Bank”) is the Fund’s primary accounting provider. Fees for such services are included in the custodian fees as State Street Bank also serves as the Fund’s custodian. NOTE 4 - CAPITAL STOCK At December 31, 2017, there were unlimited shares of capital stock (no par value) authorized. Transactions in capital stock were as follows:
Year ended December 31, 2017
Sold Reinvestment
of Distributions Redeemed Net Decrease
Shares 509,897 563,465 (2,385,486) (1,312,124) Value $ 58,605,409 $ 65,865,984 $ (270,893,526) $ (146,422,133)
Year ended December 31, 2016
Sold Reinvestment
of Distributions Redeemed† Net Decrease
Shares 1,781,804 1,116,730 (3,398,093) (499,559) Value $ 191,024,475 $ 117,780,922 $ (348,643,145) $ (39,837,748)
† Includes redemptions as a result of in-kind transfers of securities (see Note 7 of the Notes to Financial Statements).
NOTE 5 - SECURITIES LOANED The Fund has entered into a securities lending arrangement with State Street Bank. Under the terms of the agreement, the Fund receives fee income from lending transactions; in exchange for such fees, State Street Bank is authorized to loan securities on behalf of the Fund, against receipt of collateral at least equal to the value of the securities loaned. As of December 31, 2017, the Fund did not have any securities on loan. The Fund bears the risk of any deficiency in the amount of the collateral available for return to a borrower due to a loss in an approved investment.
27
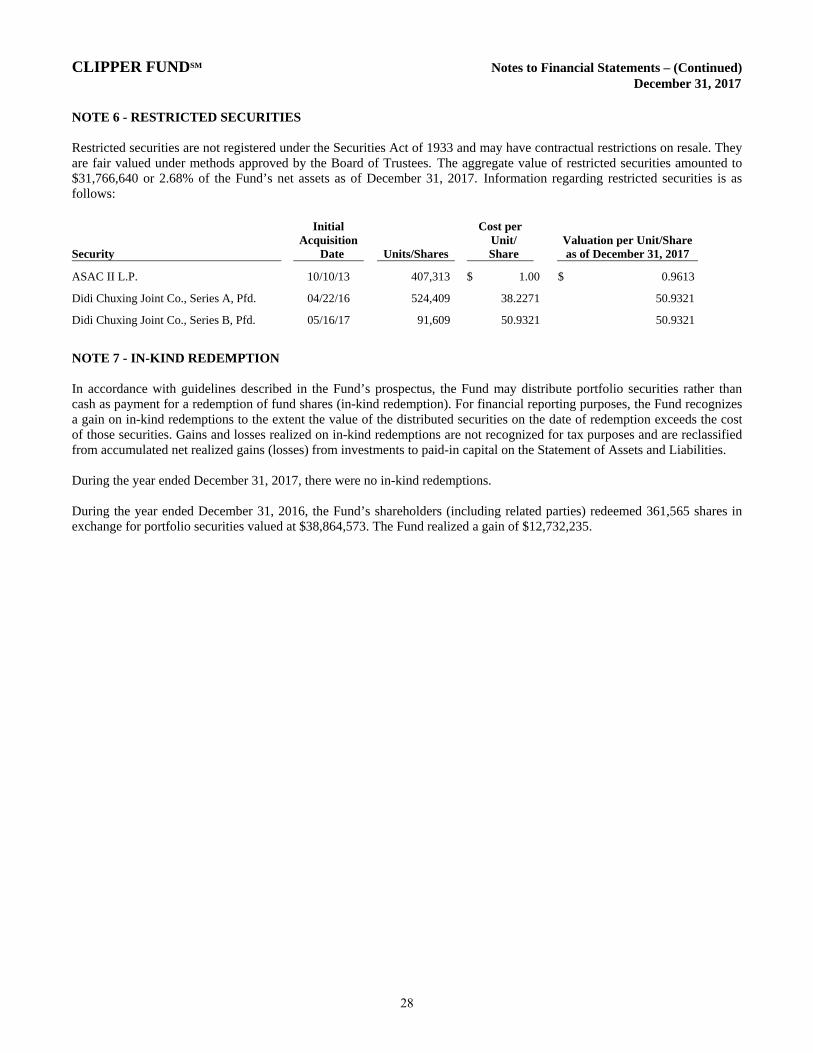
CLIPPER FUNDSM Notes to Financial Statements – (Continued) December 31, 2017 NOTE 6 - RESTRICTED SECURITIES Restricted securities are not registered under the Securities Act of 1933 and may have contractual restrictions on resale. They are fair valued under methods approved by the Board of Trustees. The aggregate value of restricted securities amounted to $31,766,640 or 2.68% of the Fund’s net assets as of December 31, 2017. Information regarding restricted securities is as follows:
Security
Initial Acquisition
Date
Units/Shares
Cost per Unit/ Share
Valuation per Unit/Share as of December 31, 2017
ASAC II L.P. 10/10/13 407,313 $ 1.00 $ 0.9613
Didi Chuxing Joint Co., Series A, Pfd. 04/22/16 524,409 38.2271 50.9321
Didi Chuxing Joint Co., Series B, Pfd. 05/16/17 91,609 50.9321 50.9321
NOTE 7 - IN-KIND REDEMPTION In accordance with guidelines described in the Fund’s prospectus, the Fund may distribute portfolio securities rather than cash as payment for a redemption of fund shares (in-kind redemption). For financial reporting purposes, the Fund recognizes a gain on in-kind redemptions to the extent the value of the distributed securities on the date of redemption exceeds the cost of those securities. Gains and losses realized on in-kind redemptions are not recognized for tax purposes and are reclassified from accumulated net realized gains (losses) from investments to paid-in capital on the Statement of Assets and Liabilities. During the year ended December 31, 2017, there were no in-kind redemptions. During the year ended December 31, 2016, the Fund’s shareholders (including related parties) redeemed 361,565 shares in exchange for portfolio securities valued at $38,864,573. The Fund realized a gain of $12,732,235.
28
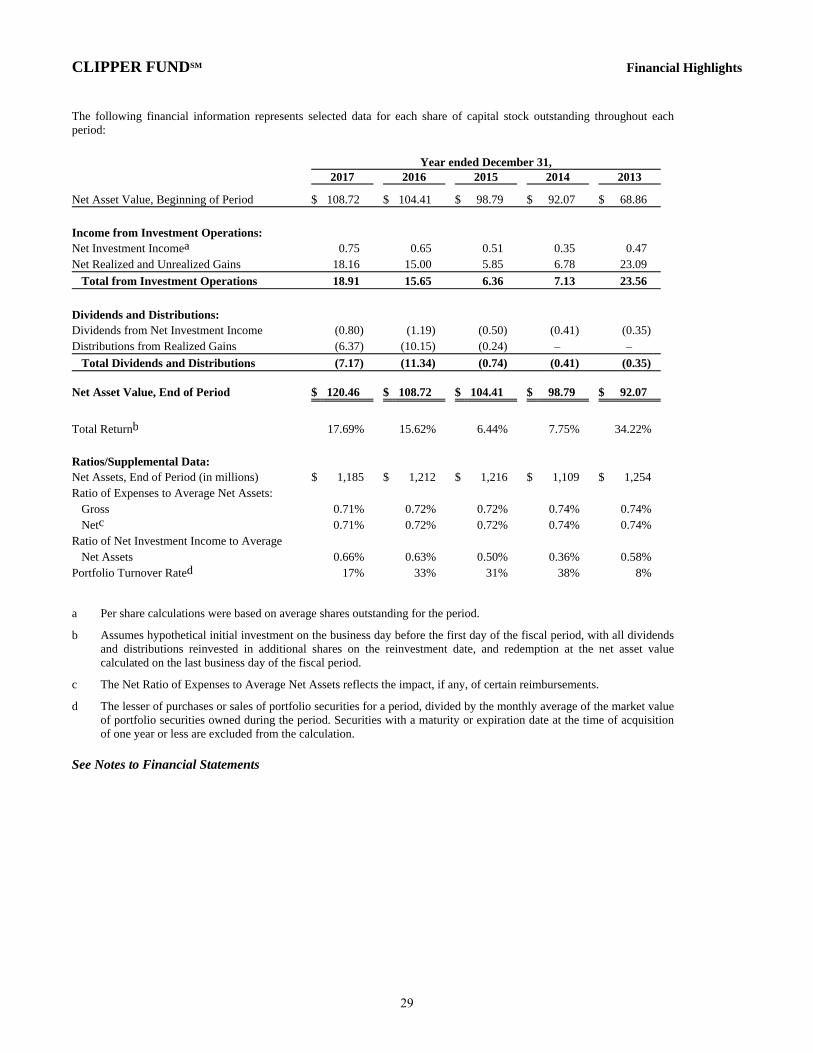
CLIPPER FUNDSM Financial Highlights The following financial information represents selected data for each share of capital stock outstanding throughout eachperiod:
Year ended December 31, 2017 2016 2015 2014 2013
Net Asset Value, Beginning of Period $ 108.72 $ 104.41 $ 98.79 $ 92.07 $ 68.86
Income from Investment Operations:
Net Investment Incomea 0.75 0.65 0.51 0.35 0.47
Net Realized and Unrealized Gains 18.16 15.00 5.85 6.78 23.09
Total from Investment Operations 18.91 15.65 6.36 7.13 23.56
Dividends and Distributions:
Dividends from Net Investment Income (0.80) (1.19) (0.50) (0.41) (0.35)
Distributions from Realized Gains (6.37) (10.15) (0.24) – –
Total Dividends and Distributions (7.17) (11.34) (0.74) (0.41) (0.35)
Net Asset Value, End of Period $
120.46 $
108.72 $
104.41 $
98.79 $
92.07
Total Returnb 17.69% 15.62% 6.44% 7.75% 34.22%
Ratios/Supplemental Data:
Net Assets, End of Period (in millions) $ 1,185 $ 1,212 $ 1,216 $ 1,109 $ 1,254 Ratio of Expenses to Average Net Assets:
Gross 0.71% 0.72% 0.72% 0.74% 0.74%
Netc 0.71% 0.72% 0.72% 0.74% 0.74%
Ratio of Net Investment Income to Average Net Assets 0.66% 0.63% 0.50% 0.36% 0.58%
Portfolio Turnover Rated 17% 33% 31% 38% 8%
a Per share calculations were based on average shares outstanding for the period.
b Assumes hypothetical initial investment on the business day before the first day of the fiscal period, with all dividendsand distributions reinvested in additional shares on the reinvestment date, and redemption at the net asset value calculated on the last business day of the fiscal period.
c The Net Ratio of Expenses to Average Net Assets reflects the impact, if any, of certain reimbursements.
d The lesser of purchases or sales of portfolio securities for a period, divided by the monthly average of the market valueof portfolio securities owned during the period. Securities with a maturity or expiration date at the time of acquisitionof one year or less are excluded from the calculation.
See Notes to Financial Statements
29
CLIPPER FUNDSM Report of Independent Registered Public Accounting Firm The Shareholders and Board of Trustees Clipper Funds Trust:
Opinion on the Financial Statements We have audited the accompanying statement of assets and liabilities of Clipper Fund (a series of Clipper Funds Trust) (the “Fund”), including the schedule of investments, as of December 31, 2017, the related statement of operations for the year then ended, the statements of changes in net assets for each of the years in the two-year period then ended, and the related notes (collectively, the “financial statements”) and the financial highlights for each of the years in the five-year period then ended. In our opinion, the financial statements and financial highlights present fairly, in all material respects, the financial position of the Fund as of December 31, 2017, the results of its operations for the year then ended, the changes in its net assets for each of the years in the two-year period then ended, and the financial highlights for each of the years in the five-year period then ended, in conformity with U.S. generally accepted accounting principles. Basis for Opinion These financial statements and financial highlights are the responsibility of the Fund’s management. Our responsibility is to express an opinion on these financial statements and financial highlights based on our audits. We are a public accounting firm registered with the Public Company Accounting Oversight Board (United States) (“PCAOB”) and are required to be independent with respect to the Fund in accordance with the U.S. federal securities laws and the applicable rules and regulations of the Securities and Exchange Commission and the PCAOB. We conducted our audits in accordance with the standards of the PCAOB. Those standards require that we plan and perform the audit to obtain reasonable assurance about whether the financial statements and financial highlights are free of material misstatement, whether due to error or fraud. Our audits included performing procedures to assess the risks of material misstatement of the financial statements and financial highlights, whether due to error or fraud, and performing procedures that respond to those risks. Such procedures included examining, on a test basis, evidence regarding the amounts and disclosures in the financial statements and financial highlights. Such procedures also included confirmation of securities owned as of December 31, 2017, by correspondence with the custodian and brokers or by other appropriate auditing procedures. Our audits also included evaluating the accounting principles used and significant estimates made by management, as well as evaluating the overall presentation of the financial statements and financial highlights. We believe that our audits provide a reasonable basis for our opinion.
KPMG LLP We have served as the Fund’s auditor since 2006. Denver, Colorado February 16, 2018
30
CLIPPER FUNDSM Federal Income Tax Information (Unaudited) In early 2018, shareholders received information regarding all dividends and distributions paid to them by the Fund during the calendar year 2017. Regulations of the U.S. Treasury Department require the Fund to report this information to the Internal Revenue Service. The information and distributions reported herein may differ from the information reported as distributions taxable to certain shareholders for the calendar year 2017 with their 2017 Form 1099-DIV. During the calendar year 2017, $15,612,366 of dividends paid by the Fund constituted income dividends for federal income tax purposes. The Fund designates $11,005,110 or 70% as income qualifying for the corporate dividends-received deduction. For the calendar year 2017, certain dividends paid by the Fund constitute qualified dividend income for federal income tax purposes. The Fund designates $14,516,052 or 93% as qualified dividend income. During the calendar year ended December 31, 2017, the Fund declared and paid long-term capital gain distributions in the amount of $52,678,439. The foregoing information is presented to assist shareholders in reporting dividends and distributions received from the Fund to the Internal Revenue Service. Because of the complexity of the federal regulations, which may affect your individual tax return and the many variations in state and local tax regulations, we recommend that you consult your tax adviser for specific guidance.
31
CLIPPER FUNDSM Privacy Notice and Householding Privacy Notice While you generally will be dealing with a broker-dealer or other financial adviser, we may collect information about you from your account application and other forms that you may deliver to us. We use this information to process your requests and transactions; for example, to provide you with additional information about the Fund, to open an account for you, or to process a transaction. In order to service your account and execute your transactions, we may provide your personal information to firms that assist us in servicing your account, such as our transfer agent. We may also provide your name and address to one of our agents for the purpose of mailing to you your account statement and other information about our products and services. We may also gather information through the use of “cookies” when you visit our website. These files help us to recognize repeat visitors and allow easy access to and use of the website. We require these outside firms and agents to protect the confidentiality of your information and to use the information only for the purpose for which the disclosure is made. We do not provide customer names and addresses to outside firms, organizations, or individuals except in furtherance of our business relationship with you or as otherwise allowed by law. We restrict access to nonpublic personal information about you to those employees who need to know that information to provide products or services to you. We maintain physical, electronic, and procedural safeguards that comply with federal standards to guard your personal information. Householding To avoid sending duplicate copies of materials to households, the Fund will mail only one copy of each prospectus, Annual, and Semi-Annual Report to shareholders having the same last name and address on the Fund’s records. The consolidation of these mailings, called householding, benefits the Fund through reduced mailing expense. If you do not want the mailing of these documents to be combined with those to other members of your household, please contact the Clipper Fund by phone at 1-800-432-2504. Individual copies of current prospectuses and reports will be sent to you within 30 days after the Fund receives your request to stop householding.
32
CLIPPER FUNDSM Trustees and Officers For the purpose of their service as trustees to the Clipper Fund, the business address for each of the trustees is 2949 E. Elvira Road, Suite 101, Tucson, AZ 85756. Each Trustee serves until retirement, resignation, death, or removal. Trustees must retire from the Board of Trustees and cease being a Trustee at the close of business on the last day of the calendar year in which the Trustee attains age 78.
Name (birthdate)
Position(s) Held with the Fund
Term of Office and Length of Time Served
Principal Occupation(s) During Past Five Years
Number of Portfolios Overseen
Other Directorships
Independent Trustees
Francisco L. Borges (11/17/51)
Trustee Trustee since 2014
Chairman and Managing Partner, Landmark Partners, LLC (private equity firm) since March 1999.
3 Trustee, John S. and James L. Knight Foundation; Trustee, Connecticut Public Broadcasting Network; Chairman/Director, Assured Guaranty Ltd. (financial guaranty insurance business); Director, Leucadia National Corporation (holding company); Trustee, Millbrook School; Director, Selected Funds (consisting of two portfolios).
Lawrence E. Harris (09/16/56)
Trustee Director/ Trustee since 2006
Fred V. Keenan Chair in Finance of the Marshall School of Business, University of Southern California, Los Angeles, CA.
3 Director, Interactive Brokers Group, Inc.; Director, Selected Funds (consisting of two portfolios).
Steven N. Kearsley (09/29/41)
Trustee Director/ Trustee since 2006
Private Investor, Real Estate Development; Owner, Old Peak Tree Farm.
3 Director, Selected Funds (consisting of two portfolios).
Katherine L. MacWilliams (01/19/56)
Trustee Trustee since 2014
Retired; Chief Financial Officer, Caridian BCT, Inc. (medical device company) 2008-2012.
3 Director, Selected Funds (consisting of two portfolios).
James J. McMonagle (10/01/44)
Trustee/ Chairman
Trustee since 2014/Chairman since 2015
Of Counsel to Vorys, Sater, Seymour and Pease LLP (law firm) since 2002.
3 Director, Owens Corning (producer of residential and commercial building materials); Director/ Chairman, Selected Funds (consisting of two portfolios).
Richard O’Brien (09/12/45)
Trustee Trustee since 2014
Retired; Corporate Economist, HP Inc. 3 Director, Selected Funds (consisting of two portfolios).
33
CLIPPER FUNDSM Trustees and Officers – (Continued)
Name (birthdate)
Position(s) Held With Fund
Term of Office and Length of Time Served
Principal Occupation(s) During Past Five Years
Number of Portfolios Overseen Other Directorships
Interested Trustees*
Andrew A. Davis (06/25/63)
Trustee Trustee since 2014
President or Vice President of each Selected Fund, Clipper Fund, and Davis Fund; President, Davis Selected Advisers, L.P., and also serves as an executive officer of certain companies affiliated with the Adviser.
16 Director, Selected Funds (consisting of two portfolios); Director, Davis Funds (consisting of 13 portfolios).
Christopher C. Davis (07/13/65)
Trustee Trustee since 2014
President or Vice President of each Selected Fund, Davis Fund, Clipper Fund, and Davis Fundamental ETF; Chairman, Davis Selected Advisers, L.P., and also serves as an executive officer of certain companies affiliated with the Adviser, including sole member of the Adviser’s general partner, Davis Investments, LLC.
16 Director, Selected Funds (consisting of two portfolios); Director, Davis Funds (consisting of 13 portfolios); Director, Graham Holdings Co. (educational and media company).
* Andrew A. Davis and Christopher C. Davis own partnership units (directly, indirectly, or both) of the Adviser and are considered to be “interested persons” of the Funds as defined in the Investment Company Act of 1940. Andrew A. Davis and Christopher C. Davis are brothers.
Officers Christopher C. Davis (born 07/13/65, Clipper Fund officer since 12/19/05). See description in the section on Interested Trustees. Andrew A. Davis (born 06/25/63, Clipper Fund officer since 01/23/15). See description in the section on Interested Trustees. Kenneth C. Eich (born 08/14/53, Clipper Fund officer since 12/19/05). Executive Vice President and Principal Executive Officer of Clipper Funds Trust (consisting of one portfolio), Davis Funds (consisting of 13 portfolios), and Selected Funds (consisting of two portfolios); Trustee/Chairman, Executive Vice President, and Principal Executive Officer of Davis Fundamental ETF Trust (consisting of three portfolios); Chief Operating Officer, Davis Selected Advisers, L.P., and also serves as an executive officer of certain companies affiliated with the Adviser. Douglas A. Haines (born 03/04/71, Clipper Fund officer since 12/19/05). Vice President, Treasurer, Chief Financial Officer, Principal Financial Officer, and Principal Accounting Officer of Clipper Funds Trust (consisting of one portfolio), Davis Funds (consisting of 13 portfolios), Selected Funds (consisting of two portfolios), and Davis Fundamental ETF Trust (consisting of three portfolios); Vice President and Director of Fund Accounting, Davis Selected Advisers, L.P. Randi J. Roessler (born 06/26/81, Clipper Fund officer since 01/01/18). Vice President and Chief Compliance Officer of Clipper Funds Trust (consisting of one portfolio), Davis Funds (consisting of 13 portfolios), Selected Funds (consisting of two portfolios), and Davis Fundamental ETF Trust (consisting of three portfolios); Vice President and Chief Compliance Officer, Davis Selected Advisers, L.P., and also serves as an executive officer of certain companies affiliated with the Adviser. Ryan M. Charles (born 07/25/78, Clipper Fund officer since 01/01/14). Vice President and Secretary of Clipper Funds Trust (consisting of one portfolio), Davis Funds (consisting of 13 portfolios), Selected Funds (consisting of two portfolios), and Davis Fundamental ETF Trust (consisting of three portfolios); Vice President, Chief Legal Officer, and Secretary, Davis Selected Advisers, L.P., and also serves as an executive officer of certain companies affiliated with the Adviser.
34
CLIPPER FUNDSM Investment Adviser Davis Selected Advisers, L.P. (Doing business as “Davis Advisors”) 2949 East Elvira Road, Suite 101 Tucson, Arizona 85756 (800) 432-2504 Distributor Davis Distributors, LLC 2949 East Elvira Road, Suite 101 Tucson, Arizona 85756 Transfer Agent DST Asset Manager Solutions, Inc. P.O. Box 55468 Boston, Massachusetts 02205-5468 Custodian State Street Bank and Trust Co. One Lincoln Street Boston, Massachusetts 02111 Counsel Greenberg Traurig, LLP 77 West Wacker Drive, Suite 3100 Chicago, Illinois 60601 Independent Registered Public Accounting Firm KPMG LLP 1225 Seventeenth Street, Suite 800 Denver, Colorado 80202
For more information about Clipper Fund including management fee, charges, and expenses, see the current prospectus, which must precede or accompany this report. The Fund’s Statement of Additional Information contains additional information about the Fund’s Trustees and is available without charge, upon request, by contacting the Fund at 1-800-432-2504 and on the Fund’s website at www.clipperfund.com. Quarterly Fact Sheets are available on the Fund’s website at www.clipperfund.com.

Clip
per F
und
2949
Eas
t Elv
ira R
oad,
Sui
te 1
01Tu
cson
, AZ
8575
680
0-43
2-25
04cl
ippe
rfun
d.co
m