Embed Size (px)
Citation preview
CLIVAR WGOMD, Exeter April 2009 Magdalena Alonso Balmaseda 1
Contents:
• Sensitivity studies: fluxes versus ocean model
• ERA-Interim fluxes
• CORE-II simulations and initialization of decadal forecasts
• Input from the Pacific Panel regarding CORE-II ocean model integrations.

CLIVAR WGOMD, Exeter April 2009 Magdalena Alonso Balmaseda 2
Uncertainties: Model versus forcing
• 2 models: HOPE and NEMO Similar horizontal resolution (~1 deg + eq refinement) Different grids, different vertical discretization, different numerics,
different physics
• 2 sets of forcing fluxes: ERA-40/OPS and ERA-Interim
• Integrations: 1989-2006 Daily fluxes Strong relaxation to SST
CLIVAR WGOMD, Exeter April 2009 Magdalena Alonso Balmaseda 3
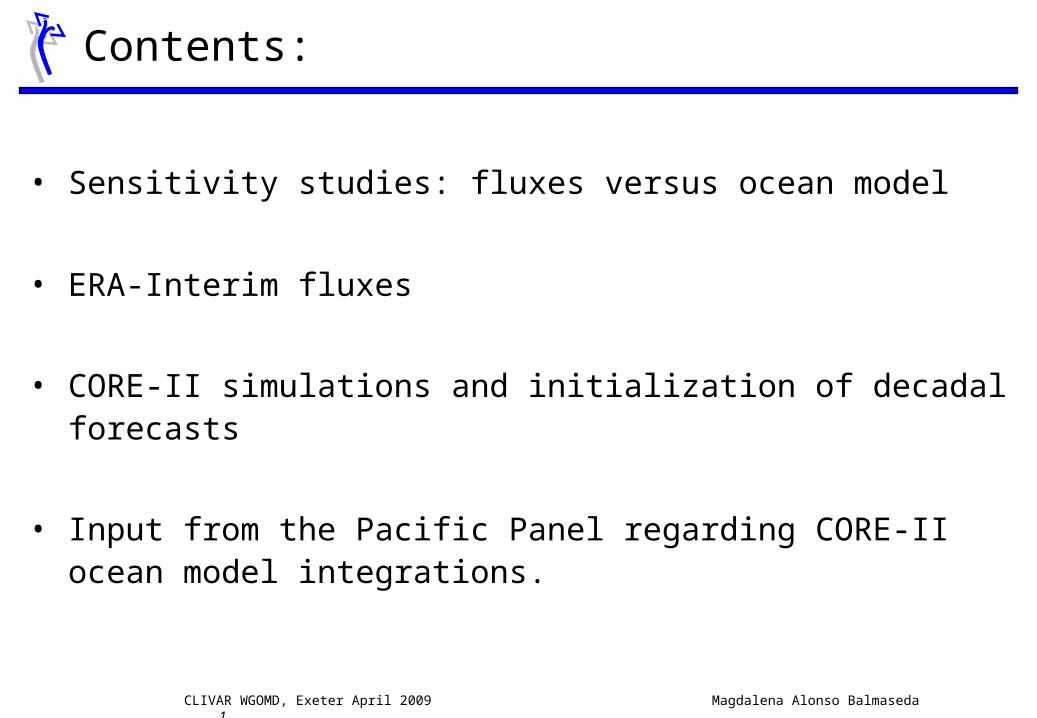
Heat flux corrections:
•In The Eastern Pacific the
solution depends mainly on the
ocean model
EQ1 162
1990 1995 2000 2005Time
-60
-40
-20
0
20
40
HOPE ERA40HOPE ERA-INTNEMO ERA40NEMO ERA-INT
IND2 162
1990 1995 2000 2005Time
-20
-10
0
10
20
30
HOPE ERA40HOPE ERA-INTNEMO ERA40NEMO ERA-INT
EQIND 162
1990 1995 2000 2005Time
-30
-20
-10
0
10
20
30
HOPE ERA40HOPE ERA-INTNEMO ERA40NEMO ERA-INT
•In the Equatorial Indian the
solution depends mainly on
the forcing fluxes

CLIVAR WGOMD, Exeter April 2009 Magdalena Alonso Balmaseda 4
Total sea level
EastPacWestPac EqAtlEqInd
NsTrPac
SsTrPac
NsTrAtl
SsTrAtl
Total Sea Level
0 200 400 600 800EastPac
WestPac
EqAtl
EqInd
NsTrPac
SsTrPac
NsTrAtl
SsTrAtl
Seasonal Sea Level
0 20 40 60 80 100EastPac
WestPac
EqAtl
EqInd
NsTrPac
SsTrPac
NsTrAtl
SsTrAtl
Interannual Sea Level
0 10 20 30 40 50 60EastPac
WestPac
EqAtl
EqInd
NsTrPac
SsTrPac
NsTrAtl
SsTrAtl
Differences due to models Differences due to forcing fluxes
CLIVAR WGOMD, Exeter April 2009 Magdalena Alonso Balmaseda 5
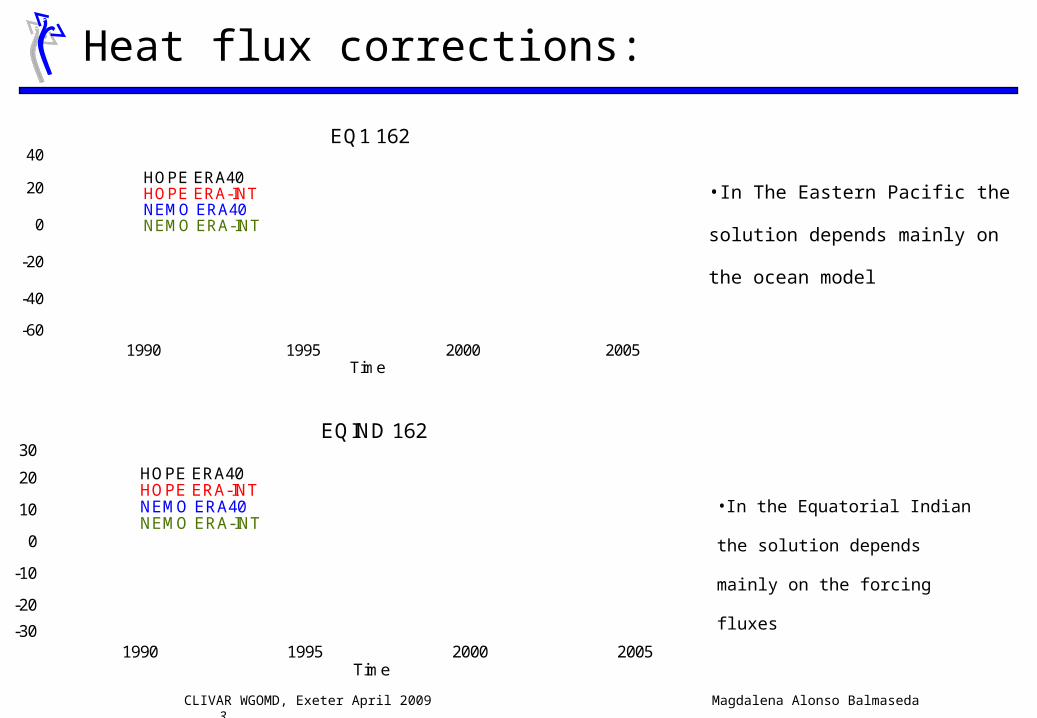
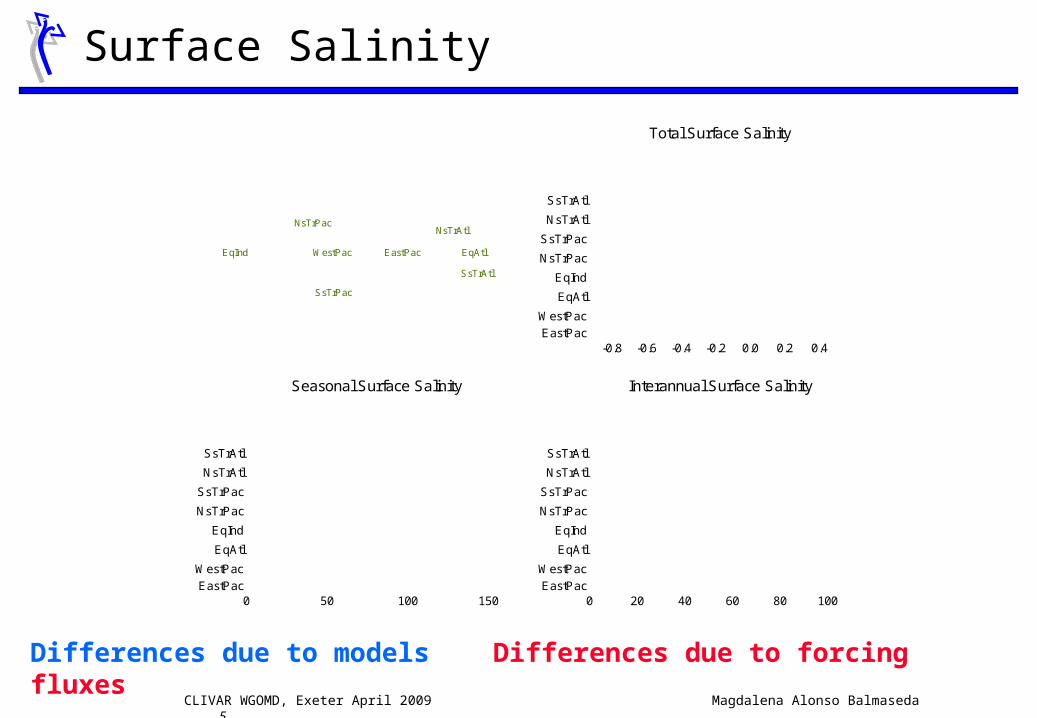
Surface Salinity
EastPacWestPac EqAtlEqInd
NsTrPac
SsTrPac
NsTrAtl
SsTrAtl
Total Surface Salinity
-0.8 -0.6 -0.4 -0.2 0.0 0.2 0.4EastPac
WestPac
EqAtl
EqInd
NsTrPac
SsTrPac
NsTrAtl
SsTrAtl
Seasonal Surface Salinity
0 50 100 150EastPac
WestPac
EqAtl
EqInd
NsTrPac
SsTrPac
NsTrAtl
SsTrAtl
Interannual Surface Salinity
0 20 40 60 80 100EastPac
WestPac
EqAtl
EqInd
NsTrPac
SsTrPac
NsTrAtl
SsTrAtl
Differences due to models Differences due to forcing fluxes

CLIVAR WGOMD, Exeter April 2009 Magdalena Alonso Balmaseda 6
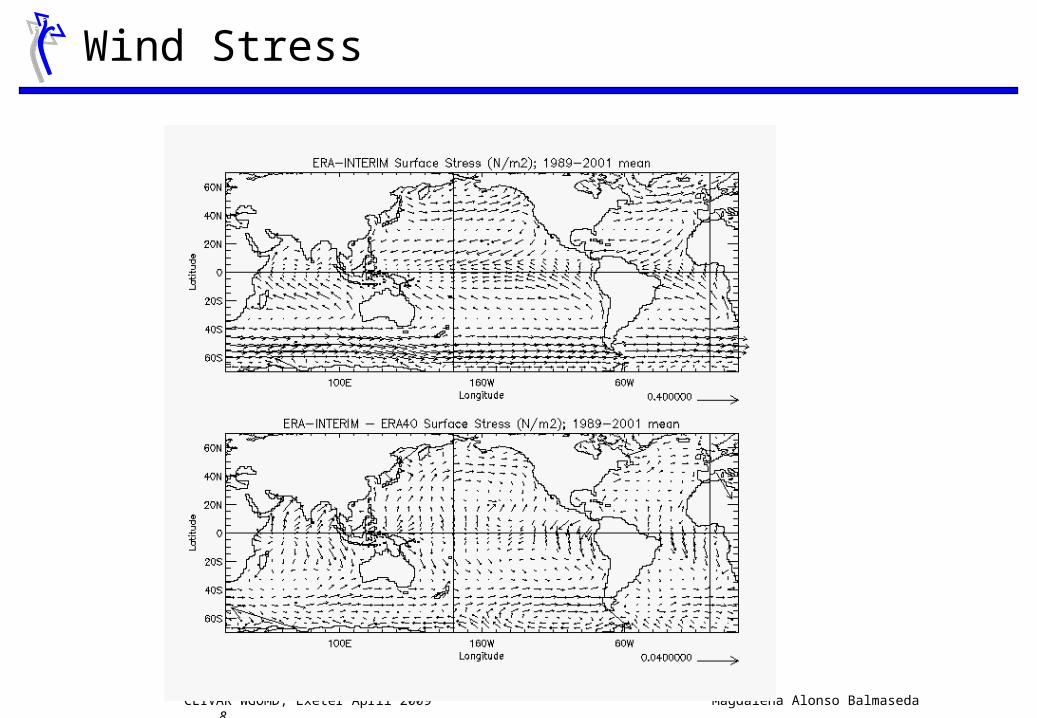
Solar Heat flux: Era Interim – Era 40
Solar Heat Flux: ERA-INTERIM minus ERA-40 fluxesSolar Heat Flux: ERA-INTERIM minus ERA-40 fluxes
(W/m2): Min= -42.75, Max= 82.64, Int= 10.00
100E 160W 60WLongitude
60S
40S
20S
0
20N
40N
60NLa
titud
e
-65.00 -43.33 -21.67 0.00 21.67 43.33 65.00
ei_e4_vector_tau) Apr 25 2009

CLIVAR WGOMD, Exeter April 2009 Magdalena Alonso Balmaseda 7
Flux correction term (~ SST error)
EastPacWestPac EqAtlEqInd
NsTrPac
SsTrPac
NsTrAtl
SsTrAtl
Total Flux Correction
-10 0 10 20EastPac
WestPac
EqAtl
EqInd
NsTrPac
SsTrPac
NsTrAtl
SsTrAtl
Seasonal Flux Correction
0 2 4 6 8 10EastPac
WestPac
EqAtl
EqInd
NsTrPac
SsTrPac
NsTrAtl
SsTrAtl
Interannual Flux Correction
0 5 10 15 20EastPac
WestPac
EqAtl
EqInd
NsTrPac
SsTrPac
NsTrAtl
SsTrAtl
ERA-40 ERA-INTERIM
CLIVAR WGOMD, Exeter April 2009 Magdalena Alonso Balmaseda 8
Wind Stress
CLIVAR WGOMD, Exeter April 2009 Magdalena Alonso Balmaseda 9
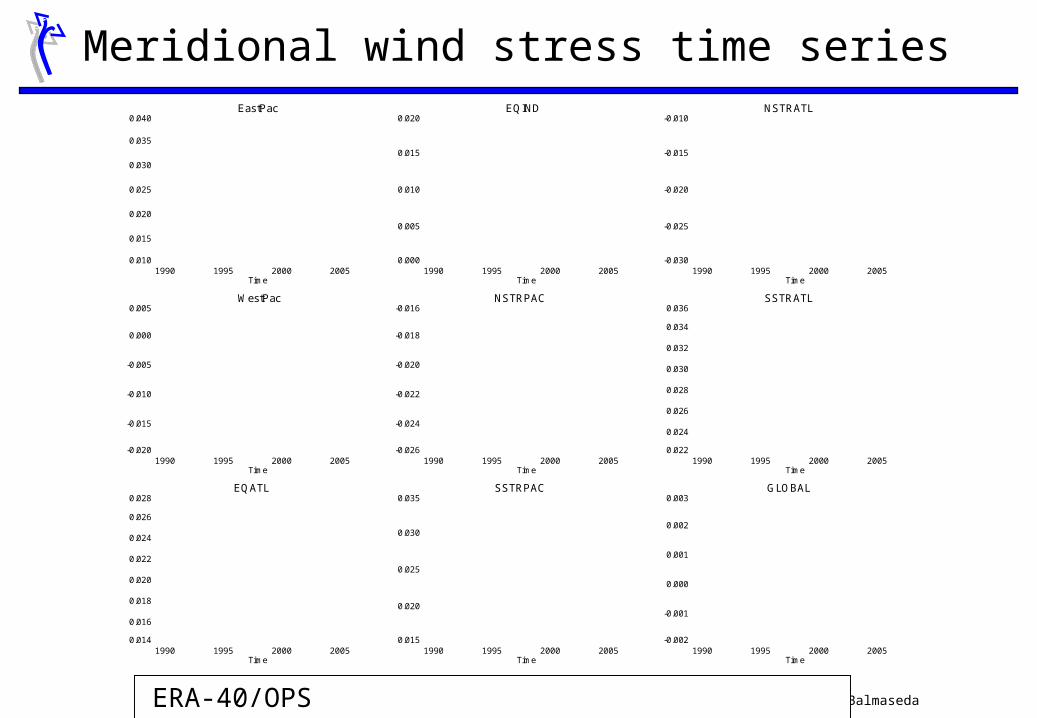
Meridional wind stress time series EastPac
1990 1995 2000 2005Time
0.010
0.015
0.020
0.025
0.030
0.035
0.040 EQIND
1990 1995 2000 2005Time
0.000
0.005
0.010
0.015
0.020 NSTRATL
1990 1995 2000 2005Time
-0.030
-0.025
-0.020
-0.015
-0.010
WestPac
1990 1995 2000 2005Time
-0.020
-0.015
-0.010
-0.005
0.000
0.005 NSTRPAC
1990 1995 2000 2005Time
-0.026
-0.024
-0.022
-0.020
-0.018
-0.016 SSTRATL
1990 1995 2000 2005Time
0.022
0.024
0.026
0.028
0.030
0.032
0.034
0.036
EQATL
1990 1995 2000 2005Time
0.014
0.016
0.018
0.020
0.022
0.024
0.026
0.028 SSTRPAC
1990 1995 2000 2005Time
0.015
0.020
0.025
0.030
0.035 GLOBAL
1990 1995 2000 2005Time
-0.002
-0.001
0.000
0.001
0.002
0.003
ERA-40/OPS ERA-INTERIM

CLIVAR WGOMD, Exeter April 2009 Magdalena Alonso Balmaseda 10
T300
SSH: ERA-INTERIM fluxes
0.3
0.3
0.7
SSH: ERA-INTERIM fluxes
(m): Min= -1.96, Max= 1.05, Int= 0.10
100E 160W 60WLongitude
60S
40S
20S
0
20N
40N
60N
Latit
ude
-1.50-1.30-1.10-0.90-0.70-0.50-0.30-0.100.100.300.500.700.901.101.301.50
SSH: ERA-INTERIM minus ERA-40 fluxesSSH: ERA-INTERIM minus ERA-40 fluxes
(m): Min= -0.04, Max= 0.05, Int= 0.01
100E 160W 60WLongitude
60S
40S
20S
0
20N
40N
60N
Latit
ude
-0.05 -0.03 -0.01 0.01 0.03 0.05ei_e4_vector_tau) Apr 27 2009

CLIVAR WGOMD, Exeter April 2009 Magdalena Alonso Balmaseda 11
Correlation with Altimeter date
correl
0.0
0.2
0.4
0.6
0.8
EQ1 EQ3 EQATL EQIND NSTRPAC SSTRPAC NSTRATL SSTRATL
ERA-40 ERA-INTERIM

CLIVAR WGOMD, Exeter April 2009 Magdalena Alonso Balmaseda 14
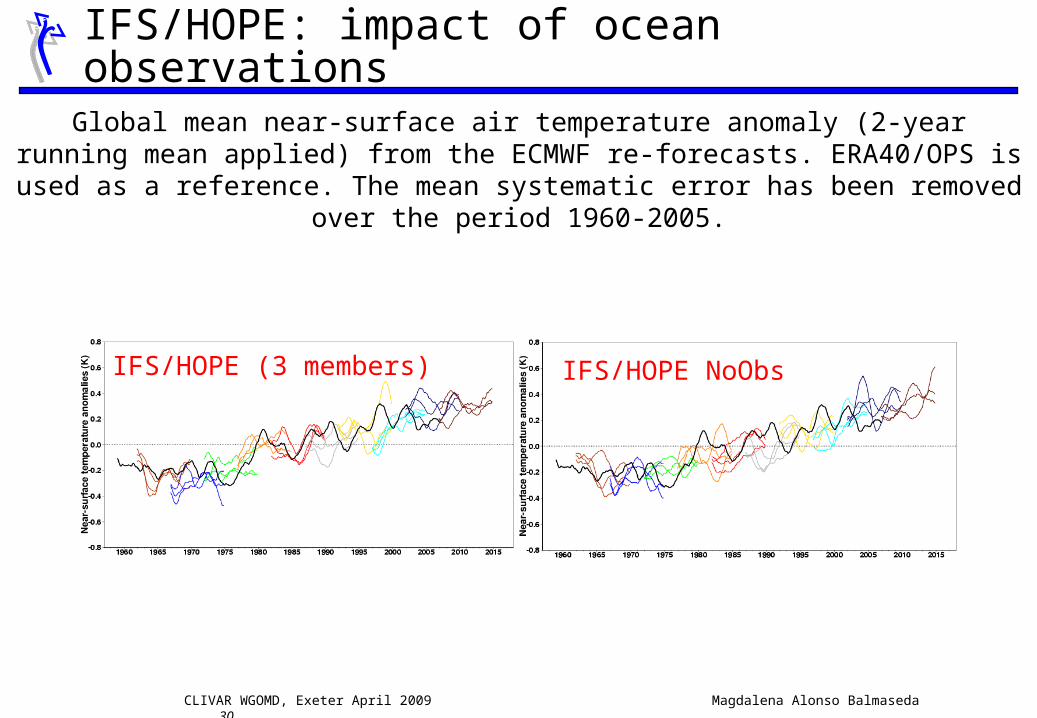
IFS/HOPE: impact of ocean observations
Global mean near-surface air temperature anomaly (2-year running mean applied) from the ECMWF re-forecasts. ERA40/OPS is used as a reference. The mean systematic error has been removed over the period 1960-2005.
IFS/HOPE (3 members) IFS/HOPE NoObs

CLIVAR WGOMD, Exeter April 2009 Magdalena Alonso Balmaseda 15
Estimation of the Atlantic MOC
Assimilation No-Data Bryden etal 2005 Cunningham etal 2007
From Balmaseda etal 2007
CLIVAR WGOMD, Exeter April 2009 Magdalena Alonso Balmaseda 16
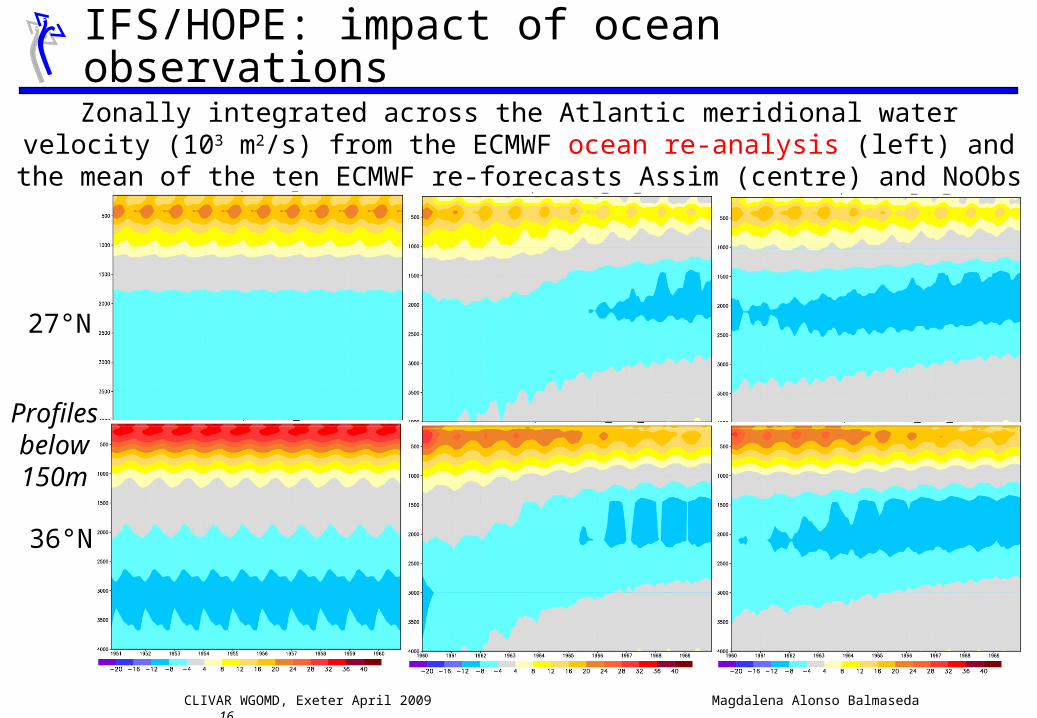
Zonally integrated across the Atlantic meridional water velocity (103 m2/s) from the ECMWF ocean re-analysis (left) and the mean of the ten ECMWF
re-forecasts Assim (centre) and NoObs (right).
27°N
36°N
Profiles below 150m
IFS/HOPE: impact of ocean observations
CLIVAR WGOMD, Exeter April 2009 Magdalena Alonso Balmaseda 17
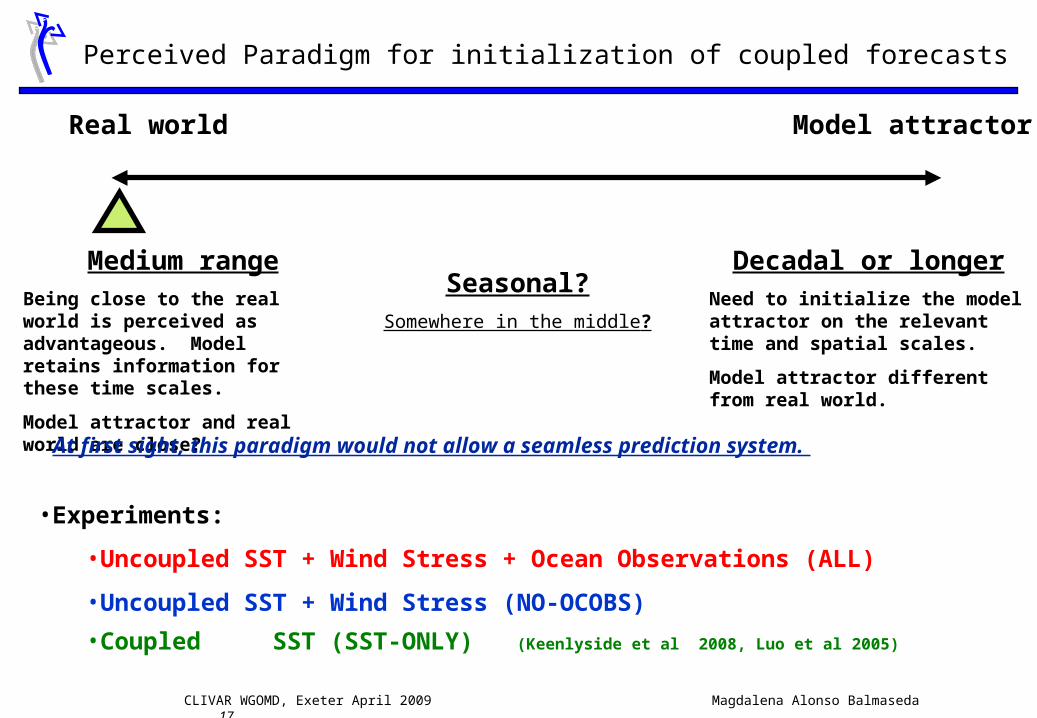
Perceived Paradigm for initialization of coupled forecasts
Real world Model attractor
Medium rangeBeing close to the real world is perceived as advantageous. Model retains information for these time scales.
Model attractor and real world are close?
Decadal or longerNeed to initialize the model attractor on the relevant time and spatial scales.
Model attractor different from real world.
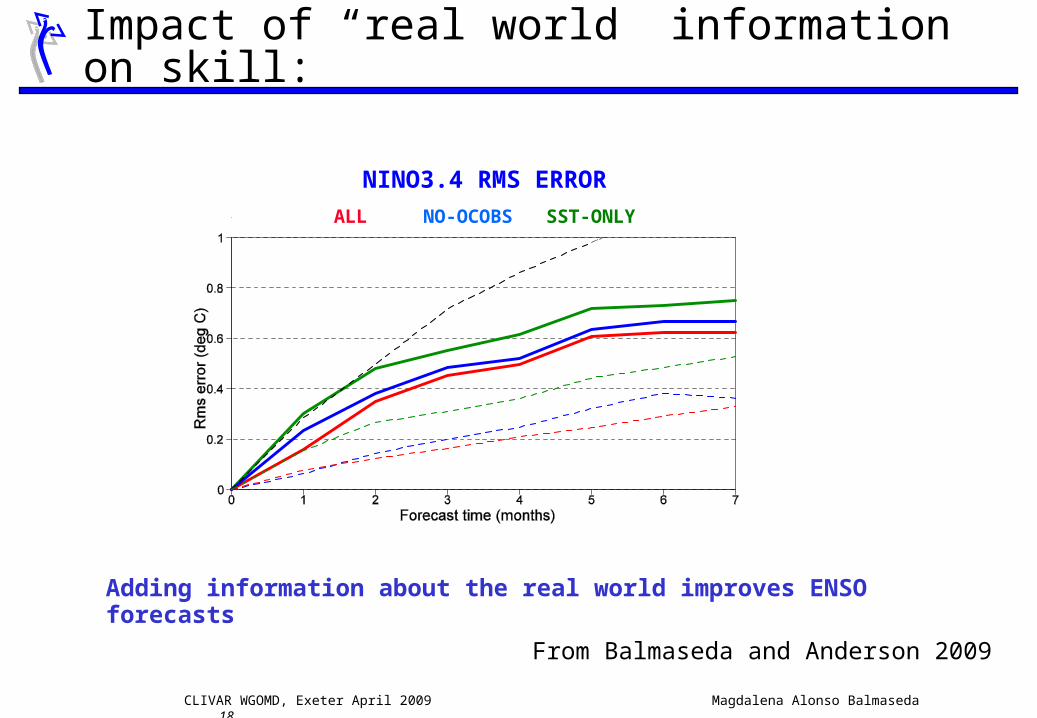
•Experiments:
•Uncoupled SST + Wind Stress + Ocean Observations (ALL)
•Uncoupled SST + Wind Stress (NO-OCOBS)
•Coupled SST (SST-ONLY) (Keenlyside et al 2008, Luo et al 2005)
Seasonal?Somewhere in the middle?
At first sight, this paradigm would not allow a seamless prediction system.
CLIVAR WGOMD, Exeter April 2009 Magdalena Alonso Balmaseda 18
Impact of “real world” information on skill:
NINO3.4 RMS ERROR
ALL NO-OCOBS SST-ONLY
Adding information about the real world improves ENSO forecasts
From Balmaseda and Anderson 2009

CLIVAR WGOMD, Exeter April 2009 Magdalena Alonso Balmaseda 19
NINO-W
EQATL
EQ3
STIO
WTIO
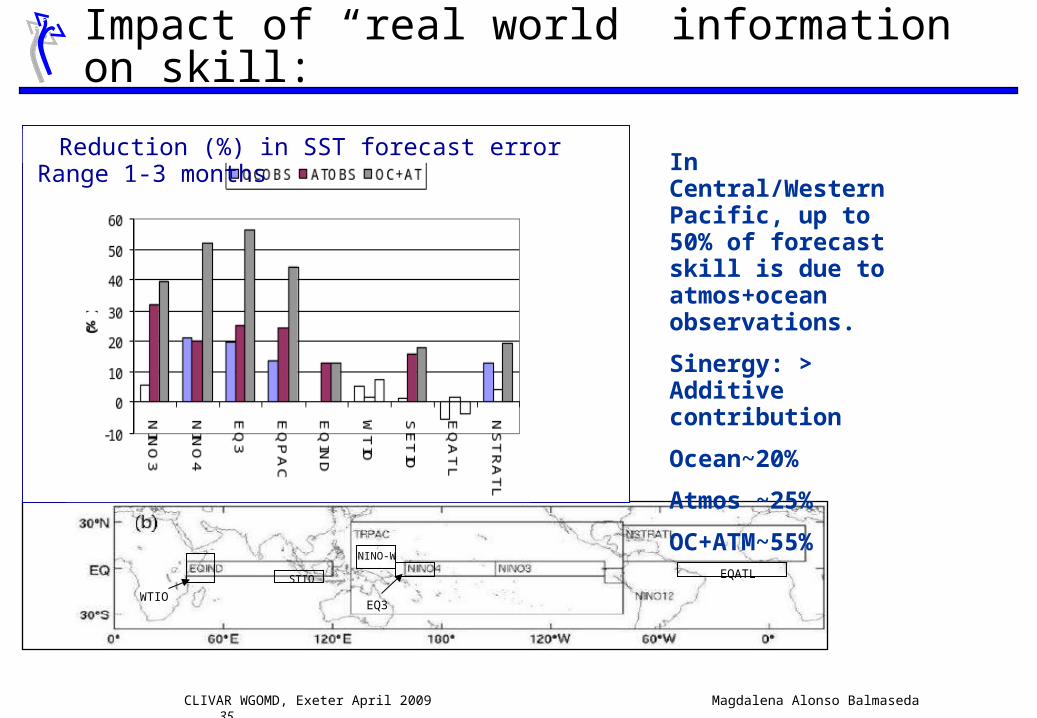
Reduction (%) in SST forecast error Range 1-3 months In Central/Western
Pacific, up to 50% of forecast skill is due to atmos+ocean observations.
Sinergy: > Additive contribution
Ocean~20%
Atmos ~25%
OC+ATM~55%
Impact of “real world” information on skill:

CLIVAR WGOMD, Exeter April 2009 Magdalena Alonso Balmaseda 20
•Relation between drift and Amplitude of Interannual variability.
•Upwelling area penetrating too far west leads to stronger IV than desired.
Western Pacific
•Relation between drift and Amplitude of Interannual variability.
•Possible non linearity: is the warm drift interacting with the amplitude of ENSO?
Impact of Initialization
•Drift and Variability depend on Initialization !!
•More information corrects for model error, and the information is retained during the fc.
•Need “more balanced” initialization methods to prevent initialization shock hitting non linearities
Eastern Pacific ALL
NO-OCOBS
SST-ONLY
DRIFT
VARIABILITY
CLIVAR WGOMD, Exeter April 2009 Magdalena Alonso Balmaseda 23
Pacific Panel Input:
• General proposal
0. Scientific Questions
1. Process oriented metrics (with/without observations)
2. Generic (blanket) metrics (with/without observations)
• METRICS and/or DIAGNOSTICS?
• Ongoing work on ENSO metrics to evaluate climate models (Pacific Panel, Eric Guilyardi).

CLIVAR WGOMD, Exeter April 2009 Magdalena Alonso Balmaseda 24
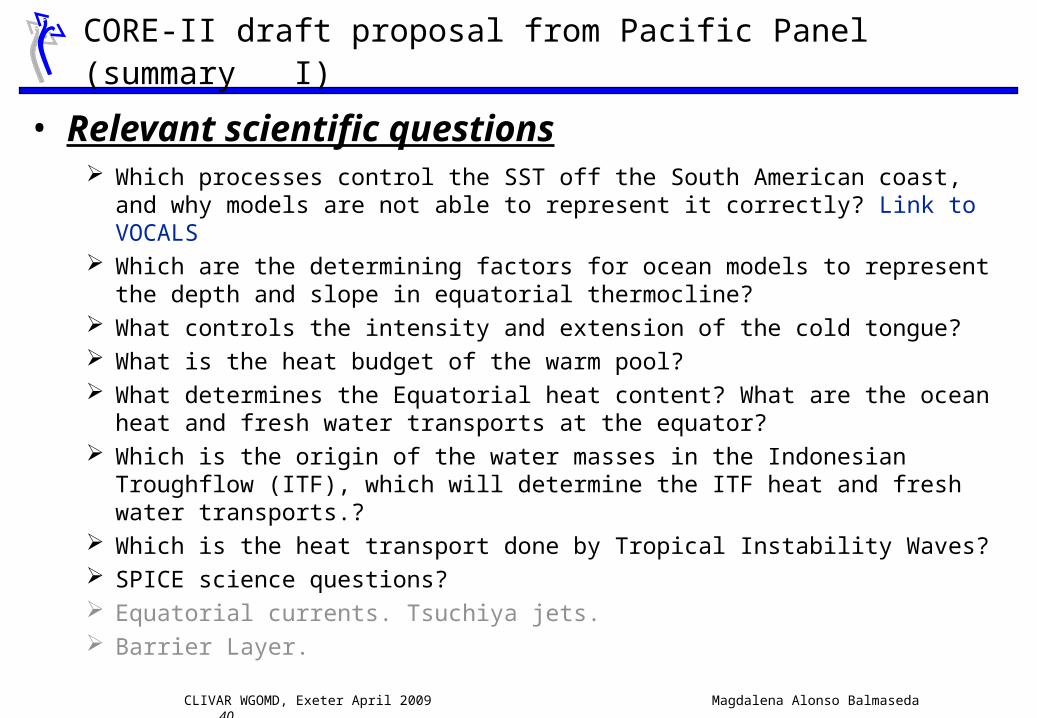
CORE-II draft proposal from Pacific Panel (summary I)
• Relevant scientific questions Which processes control the SST off the South American coast, and why
models are not able to represent it correctly? Link to VOCALS Which are the determining factors for ocean models to represent the
depth and slope in equatorial thermocline? What controls the intensity and extension of the cold tongue? What is the heat budget of the warm pool? What determines the Equatorial heat content? What are the ocean heat
and fresh water transports at the equator? Which is the origin of the water masses in the Indonesian Troughflow
(ITF), which will determine the ITF heat and fresh water transports.? Which is the heat transport done by Tropical Instability Waves? SPICE science questions? Equatorial currents. Tsuchiya jets. Barrier Layer.

CLIVAR WGOMD, Exeter April 2009 Magdalena Alonso Balmaseda 25
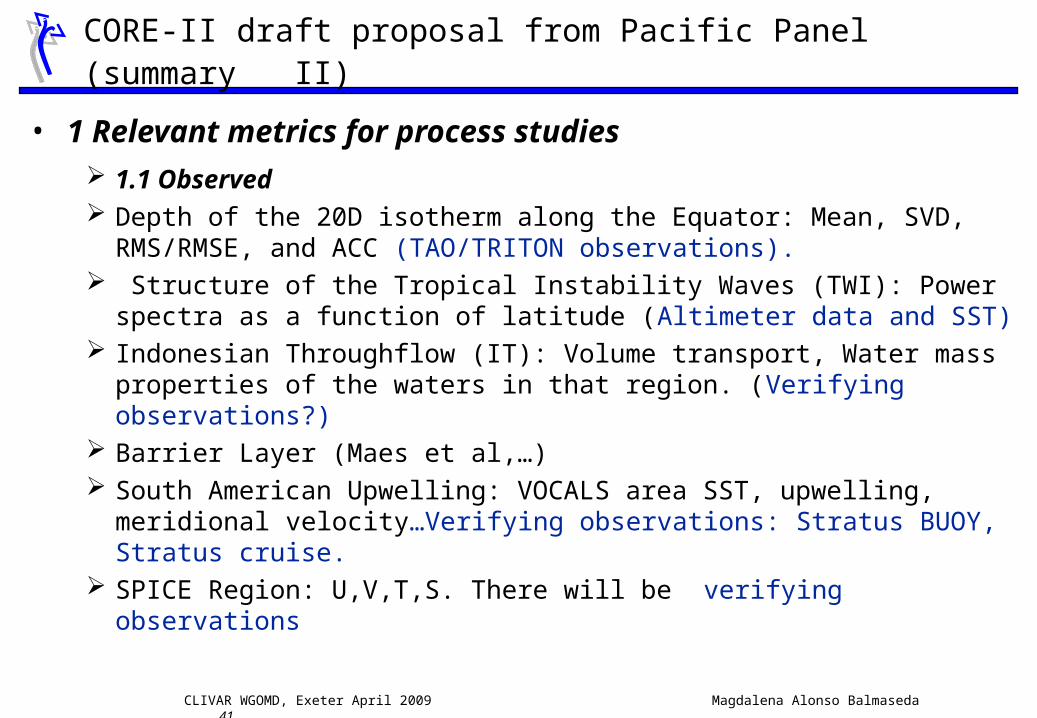
• 1 Relevant metrics for process studies 1.1 Observed Depth of the 20D isotherm along the Equator: Mean, SVD,
RMS/RMSE, and ACC (TAO/TRITON observations). Structure of the Tropical Instability Waves (TWI): Power spectra as
a function of latitude (Altimeter data and SST) Indonesian Throughflow (IT): Volume transport, Water mass
properties of the waters in that region. (Verifying observations?) Barrier Layer (Maes et al,…) South American Upwelling: VOCALS area SST, upwelling,
meridional velocity…Verifying observations: Stratus BUOY, Stratus cruise.
SPICE Region: U,V,T,S. There will be verifying observations
CORE-II draft proposal from Pacific Panel (summary II)

CLIVAR WGOMD, Exeter April 2009 Magdalena Alonso Balmaseda 26
• 1 Relevant metrics for process studies 1.2 Non Observed Heat and volume transports by TWIs Heat budget in the warm pool region Indonesian Throughflow: heat and fresh water mass transport. Origin of waters in the IT? Trends in the Equatorial Circulation? …..
CORE-II draft proposal from Pacific Panel (summary II)
CLIVAR WGOMD, Exeter April 2009 Magdalena Alonso Balmaseda 27
• 2. Generic metrics 2.1 Observed Temperature and Salinity profiles in prescribed areas (to include
attachment with Pacific_areas), compared with observations. Mean, SDV, mean difference/error and RMS/RMSE.
o T/S Observations are from WOA05 or from the Hadley Centre EN3. o T/S and Currents profiles at TAO/TRITON mooring location. Mean, SDV,
mean difference/error, RMS/RMSE and ACCTAO/TRITON observations. 2.2 Non observed: (comparable with reanalysis and obs-only
analysis) Zonal sections along the Equator of T,S,U,V,W: Mean, SDV, mean
difference, RMS. Meridional sections or T,S,U,V,W: Mean, SDV, mean difference,
RMS. Longitudes: 137E, 165E, 180,140W, 110W, 95W Others...
CORE-II draft proposal from Pacific Panel (summary III)
CLIVAR WGOMD, Exeter April 2009 Magdalena Alonso Balmaseda 30
IFS/HOPE: impact of ocean observations
Global mean near-surface air temperature anomaly (2-year running mean applied) from the ECMWF re-forecasts. ERA40/OPS is used as a reference. The mean systematic error has been removed over the period 1960-2005.
IFS/HOPE (3 members) IFS/HOPE NoObs

CLIVAR WGOMD, Exeter April 2009 Magdalena Alonso Balmaseda 31
Estimation of the Atlantic MOC
Assimilation No-Data Bryden etal 2005 Cunningham etal 2007
From Balmaseda etal 2007

CLIVAR WGOMD, Exeter April 2009 Magdalena Alonso Balmaseda 32
Zonally integrated across the Atlantic meridional water velocity (103 m2/s) from the ECMWF ocean re-analysis (left) and the mean of the ten ECMWF
re-forecasts Assim (centre) and NoObs (right).
27°N
36°N
Profiles below 150m
IFS/HOPE: impact of ocean observations

CLIVAR WGOMD, Exeter April 2009 Magdalena Alonso Balmaseda 33
Perceived Paradigm for initialization of coupled forecasts
Real world Model attractor
Medium rangeBeing close to the real world is perceived as advantageous. Model retains information for these time scales.
Model attractor and real world are close?
Decadal or longerNeed to initialize the model attractor on the relevant time and spatial scales.
Model attractor different from real world.
•Experiments:
•Uncoupled SST + Wind Stress + Ocean Observations (ALL)
•Uncoupled SST + Wind Stress (NO-OCOBS)
•Coupled SST (SST-ONLY) (Keenlyside et al 2008, Luo et al 2005)
Seasonal?Somewhere in the middle?
At first sight, this paradigm would not allow a seamless prediction system.

CLIVAR WGOMD, Exeter April 2009 Magdalena Alonso Balmaseda 34
Impact of “real world” information on skill:
NINO3.4 RMS ERROR
ALL NO-OCOBS SST-ONLY
Adding information about the real world improves ENSO forecasts
From Balmaseda and Anderson 2009
CLIVAR WGOMD, Exeter April 2009 Magdalena Alonso Balmaseda 35
NINO-W
EQATL
EQ3
STIO
WTIO
Reduction (%) in SST forecast error Range 1-3 months In Central/Western
Pacific, up to 50% of forecast skill is due to atmos+ocean observations.
Sinergy: > Additive contribution
Ocean~20%
Atmos ~25%
OC+ATM~55%
Impact of “real world” information on skill:

CLIVAR WGOMD, Exeter April 2009 Magdalena Alonso Balmaseda 36
•Relation between drift and Amplitude of Interannual variability.
•Upwelling area penetrating too far west leads to stronger IV than desired.
Western Pacific
•Relation between drift and Amplitude of Interannual variability.
•Possible non linearity: is the warm drift interacting with the amplitude of ENSO?
Impact of Initialization
•Drift and Variability depend on Initialization !!
•More information corrects for model error, and the information is retained during the fc.
•Need “more balanced” initialization methods to prevent initialization shock hitting non linearities
Eastern Pacific ALL
NO-OCOBS
SST-ONLY
DRIFT
VARIABILITY

CLIVAR WGOMD, Exeter April 2009 Magdalena Alonso Balmaseda 39
Pacific Panel Input:
• General proposal
0. Scientific Questions
1. Process oriented metrics (with/without observations)
2. Generic (blanket) metrics (with/without observations)
• METRICS and/or DIAGNOSTICS?
• Ongoing work on ENSO metrics to evaluate climate models (Pacific Panel, Eric Guilyardi).
CLIVAR WGOMD, Exeter April 2009 Magdalena Alonso Balmaseda 40
CORE-II draft proposal from Pacific Panel (summary I)
• Relevant scientific questions Which processes control the SST off the South American coast, and why
models are not able to represent it correctly? Link to VOCALS Which are the determining factors for ocean models to represent the
depth and slope in equatorial thermocline? What controls the intensity and extension of the cold tongue? What is the heat budget of the warm pool? What determines the Equatorial heat content? What are the ocean heat
and fresh water transports at the equator? Which is the origin of the water masses in the Indonesian Troughflow
(ITF), which will determine the ITF heat and fresh water transports.? Which is the heat transport done by Tropical Instability Waves? SPICE science questions? Equatorial currents. Tsuchiya jets. Barrier Layer.
CLIVAR WGOMD, Exeter April 2009 Magdalena Alonso Balmaseda 41
• 1 Relevant metrics for process studies 1.1 Observed Depth of the 20D isotherm along the Equator: Mean, SVD,
RMS/RMSE, and ACC (TAO/TRITON observations). Structure of the Tropical Instability Waves (TWI): Power spectra as
a function of latitude (Altimeter data and SST) Indonesian Throughflow (IT): Volume transport, Water mass
properties of the waters in that region. (Verifying observations?) Barrier Layer (Maes et al,…) South American Upwelling: VOCALS area SST, upwelling,
meridional velocity…Verifying observations: Stratus BUOY, Stratus cruise.
SPICE Region: U,V,T,S. There will be verifying observations
CORE-II draft proposal from Pacific Panel (summary II)

CLIVAR WGOMD, Exeter April 2009 Magdalena Alonso Balmaseda 42
• 1 Relevant metrics for process studies 1.2 Non Observed Heat and volume transports by TWIs Heat budget in the warm pool region Indonesian Throughflow: heat and fresh water mass transport. Origin of waters in the IT? Trends in the Equatorial Circulation? …..
CORE-II draft proposal from Pacific Panel (summary II)

CLIVAR WGOMD, Exeter April 2009 Magdalena Alonso Balmaseda 43
• 2. Generic metrics 2.1 Observed Temperature and Salinity profiles in prescribed areas (to include
attachment with Pacific_areas), compared with observations. Mean, SDV, mean difference/error and RMS/RMSE.
o T/S Observations are from WOA05 or from the Hadley Centre EN3. o T/S and Currents profiles at TAO/TRITON mooring location. Mean, SDV,
mean difference/error, RMS/RMSE and ACCTAO/TRITON observations. 2.2 Non observed: (comparable with reanalysis and obs-only
analysis) Zonal sections along the Equator of T,S,U,V,W: Mean, SDV, mean
difference, RMS. Meridional sections or T,S,U,V,W: Mean, SDV, mean difference,
RMS. Longitudes: 137E, 165E, 180,140W, 110W, 95W Others...
CORE-II draft proposal from Pacific Panel (summary III)