Embed Size (px)
Citation preview

Walden UniversityScholarWorks
Walden Dissertations and Doctoral Studies Walden Dissertations and Doctoral StudiesCollection
2016
Closing the Innovation Gap for BusinessSustainabilityWayne Philip StamlerWalden University
Follow this and additional works at: https://scholarworks.waldenu.edu/dissertations
Part of the Business Administration, Management, and Operations Commons, ManagementSciences and Quantitative Methods Commons, and the Other Education Commons
This Dissertation is brought to you for free and open access by the Walden Dissertations and Doctoral Studies Collection at ScholarWorks. It has beenaccepted for inclusion in Walden Dissertations and Doctoral Studies by an authorized administrator of ScholarWorks. For more information, pleasecontact [email protected].

Walden University
College of Management and Technology
This is to certify that the doctoral study by
Wayne P. Stamler
has been found to be complete and satisfactory in all respects, and that any and all revisions required by the review committee have been made.
Review Committee Dr. John Hannon, Committee Chairperson, Doctor of Business Administration Faculty
Dr. Perry Haan, Committee Member, Doctor of Business Administration Faculty
Dr. Anne Davis, University Reviewer, Doctor of Business Administration Faculty
Chief Academic Officer Eric Riedel, Ph.D.
Walden University 2016

Abstract
Closing the Innovation Gap for Business Sustainability
by
Wayne P. Stamler
MBA, Wilfrid Laurier University, 1995
BA, Trinity Western University, 1984
Doctoral Study Submitted in Partial Fulfillment
of the Requirements for the Degree of
Doctor of Business Administration
Walden University
July 2016

Abstract
Senior business leaders may deliberately impede innovation or inadvertently fail at
creating a culture of innovation to foster new product development. The gap between
desired and achieved levels of innovation is cause for concern. Addressing the innovation
gap may require new ways of thinking from senior executives and a departure from a
locked-in mindset to make the linkage between innovation, branding, and financial
performance. In this quantitative research study, multiple regression analyses were used
to examine and analyze the relationship between innovation rankings, brand valuation,
and economic sustainability to address possible reasons for an innovation gap. The
theoretical framework of the study included Legrand and Weiss’s innovation gap theory,
Sood and Tellis’s theory of limited market disruption, and Morris’s theory of innovation.
Furthermore, Dierk and Dover’s definition of ambidexterity elucidated the failure of
some senior leaders to balance short and long-term innovation objectives. A sample of
190 global companies was used in the study and taken from the Forbes World’s Most
Innovative Companies ranking, Interbrand Brand Value Index, and the Dow Jones
Sustainability Index. The results of the regression model indicated a small, statistically
significant positive correlation between innovation and long-term sustainability using
2015 data. Using 2012 data for the predictor variables and 2015 data for the dependent
variable indicated no statistically significant relationship between innovation and
branding efforts on sustainability. Though marginal, the correlation found between
innovation and sustainability may encourage senior business leaders to support specific
innovation practices in order to improve sustainability and close the innovation gap.
Closing the Innovation Gap for Business Sustainability
by
Wayne P. Stamler
MBA, Wilfrid Laurier University, 1995
BA, Trinity Western University, 1984
Doctoral Study Submitted in Partial Fulfillment
of the Requirements for the Degree of
Doctor of Business Administration
Walden University
July 2016

Dedication
This doctoral study is dedicated to my best friend and wife, Sonya, who has been
a constant source of support and encouragement during the challenges of postgraduate
school and life. I am truly thankful for having you in my life. This work is also dedicated
to my parents, Marjorie and Peter, who loved me unconditionally and whose virtuous
examples have taught me to work hard for the goals I aspire to achieve.

Acknowledgments
I wish to thank my committee members who were more than generous with their
expertise and precious time. A special and sincere thanks to Dr. John Hannon, my
committee chairman for his countless hours of reflecting, reading, encouraging, and most
of all his patient perseverance throughout the entire doctoral study process. Thank you,
Dr. Anne Davis and Dr. Perry Haan, for agreeing to serve on my committee. Your
collective feedback and your guidance provided me with an invaluable learning
experience.
I would like to acknowledge and thank Walden University’s School of
Management for allowing me to conduct my research and providing the assistance I
required. Thanks to Dr. Freda Turner, Program Director of the DBA program, as your
tireless leadership was exceptional, and special thanks to Dr. James Savard who provided
encouragement to push forward on this journey. Thanks to Amy Lindquist from the
writing center who answered my seemingly endless questions. Thanks to many of my
colleagues as I can attest I learned a great deal from you as you kept me focused,
challenged me, and supported me.
This acknowledgement would not be complete without recognizing the selfless
support, dedication, and encouragement of Sonya Rosenwirth who played a major part in
my achievement of this degree.
i
Table of Contents
List of Tables ..................................................................................................................... iv
List of Figures ......................................................................................................................v
Section 1: Foundation of the Study ......................................................................................1
Background of the Problem ...........................................................................................1
Problem Statement .........................................................................................................2
Purpose Statement ..........................................................................................................3
Nature of the Study ........................................................................................................3
Research Question .........................................................................................................5
Hypotheses .....................................................................................................................6
Theoretical Framework ..................................................................................................6
Operational Definitions ..................................................................................................7
Assumptions, Limitations, and Delimitations ................................................................9
Assumptions ............................................................................................................ 9
Limitations ............................................................................................................ 10
Delimitations ......................................................................................................... 11
Significance of the Study .............................................................................................12
Contribution to Business Practice ......................................................................... 12
Implications for Social Change ............................................................................. 14
Review of the Professional and Academic Literature ..................................................16
Summary and Transition ............................................................................................121
Section 2: The Project ......................................................................................................123

ii
Purpose Statement ......................................................................................................123
Role of the Researcher ...............................................................................................124
Participants .................................................................................................................126
Research Method and Design ....................................................................................126
Research Method ................................................................................................ 126
Research Design .................................................................................................. 128
Population and Sampling ...........................................................................................131
Population ........................................................................................................... 131
Sampling ............................................................................................................. 136
Ethical Research .........................................................................................................140
Data Collection ..........................................................................................................142
Instrumentation ................................................................................................... 142
Data Collection Technique ................................................................................. 146
Data Analysis .............................................................................................................147
Study Validity ............................................................................................................152
Study Validity ..................................................................................................... 153
Transition and Summary ............................................................................................157
Section 3: Application to Professional Practice and Implications for Change ................158
Introduction ................................................................................................................158
Presentation of the Findings .......................................................................................159
Main Research Question ..................................................................................... 161
Research Question 1 ........................................................................................... 161

iii
Research Question 2 ........................................................................................... 162
Delay Effect ........................................................................................................ 162
Applications to Professional Practice ........................................................................165
Implications for Social Change ..................................................................................167
Recommendations for Action ....................................................................................169
Recommendations for Further Research ....................................................................170
Reflections .................................................................................................................171
Summary and Study Conclusions ..............................................................................172
References ........................................................................................................................174
Appendix A: Data Use Agreement ..................................................................................192
Appendix B: Confidentiality and Nondisclosure Agreement ..........................................195

iv
List of Tables
Table 1. Means and Standard Deviations for Continuous Variables……...….…….…..159
Table 2. Results for Multiple Linear Regression with 2015 Data for Innovation Ranking
and Brand Value predicting Sustainability Index…………………… …....………160
Table 3. Results for Multiple Linear Regression with 2012 Data for Innovation Ranking
and Brand Value predicting 2015 Sustainability Index…………… ...……………163

v
List of Figures
Figure 1. Power as a function of the sample size to minimize statistical errors………..140
1
Section 1: Foundation of the Study
Senior business leaders have identified that a gap exists between desired and
achieved levels of innovation (Legrand & Weiss, 2011). Senior leaders, however, may
have locked-in mindsets and leadership styles that prevent them from challenging
existing business models (Morris, 2013). Senior leaders tend to focus on short-term goals
rather than create a culture of innovation to facilitate meaningful innovation leading to
sustainability (Dierk & Dover, 2012; Kotter, 2013). The purpose of this study was to
demonstrate the relationship between innovation, brand valuation, and sustainability.
Background of the Problem
The background of the problem lies in the debate surrounding the relationship
between innovation and economic sustainability. Senior corporate leaders tend to focus
on elevating the level of short-term financial performance rather than making financial
investments in innovation due to their tendency to be risk averse (Dierk & Dover, 2012).
Top management teams (TMTs) also tend to gravitate towards exploitation behaviors
(Buyl, Boone, & Matthyssens, 2012; Eccles & Serafeim, 2013). The purpose of this study
was to examine whether companies that achieve high levels of innovation and high brand
valuation also have long-term economic sustainability.
Shafie, Siti-Nabiha, and Cheng Ling (2014) noted that the business environment
is dynamic and increasingly competitive on a global scale. Given the rapidly changing
and evolving business environment, innovation is an important source of sustainable
competitive advantage. As such, Shafie et al. suggested that organizations must
continuously pursue advancements through innovation to remain competitive and

2
profitable. Even when companies bring innovations to market, without the necessary
communication or brand association, Shalfie et al. estimated 90% of such product
introductions will fail (Shafie et al., 2014). Shafie et al. noted that quality TMTs may be a
critical factor in driving strong innovation and branding efforts. Issues associated with the
TMT appear to be central to the ability of firms to innovate (Shafie et al., 2014). For
example, some TMTs would prefer to settle for the status quo. TMTs also indicate the
difference between the level of innovation they desire for their firms versus the level of
innovation achieved is substantial (Legrand & Weiss, 2011). The difference between the
level of desired and achieved innovation is the innovation gap. Shafie et al. posited that
there is also no correlation between the level of spending on research and development
(R&D) and market share. Specifically, some firms fail to address other factors such as
corporate strategy and business models, corporate culture, and the ability to effectively
commercialize innovation and gain market acceptance. Given the innovation gap appears
to be multifaceted in nature, it requires further examination to determine whether there is
a relationship between innovation and firm sustainability.
Problem Statement
An innovation gap exists due to the failure of top management teams (TMTs) to
promote a culture of innovation (Hunter, 2012). TMTs prefer instead to maintain the
status quo (Haynes & Hillman, 2010) despite the known risk of perishing (Aubrey &
Judge, 2012; Hunter, 2012). Legrand and Weiss (2011) found over 80% of leaders
surveyed stated that innovation is important for the sustainability of their firms and yet
less than 30% reported satisfaction with the level of innovation achieved. The general
3
business problem was that senior organizational business leaders focus on short-term
strategies rather than closing the innovation gap to achieve long-term economic
sustainability. The specific business problem was that some senior organizational
business leaders do not have a predictive model to understand the relationship between
innovation rankings, brand valuation, and economic sustainability.
Purpose Statement
The purpose of this quantitative correlation study was to examine the relationship
between innovation rankings, brand valuation, and economic sustainability. The
independent variables were innovation ranking and brand valuation. The dependent
variable was economic sustainability. The targeted population for this study are senior
business leaders of publicly traded, multinational companies that operate under global
brands within the service and manufacturing sectors. The implications for positive social
change include the potential to encourage senior business leaders to embrace
ambidextrous business models by recognizing the importance of investing in innovation
initiatives to support long-term economic sustainability.
Nature of the Study
In this quantitative correlational research study, I used archival data to determine
whether a relationship exists between the independent variables innovation and brand
value, and the dependent variable sustainability. The research method selected must be
appropriate for the business problem and the context of the study (Iacono, Brown, &
Holtham, 2009). Typically using qualitative research methods helps the researcher
explore the study of social and cultural phenomena using case study research methods

4
and ethnography within certain contexts (Iacono et al., 2009). Categorizing research
methods as quantitative and qualitative delineates between using numerical or verbal data
respectively (Iacono et al., 2009). Often in qualitative research, parallel activities such as
data collection, analysis, interpretation, and reporting require that a change in one activity
requires modifying the direction of the other activities (Iacono et al., 2009). However,
using quantitative research requires the collection of numerical data and subsequent
analysis to develop the findings (Iacono et al., 2009). The use of mixed methods research
requires the use of more than one research method by combining both qualitative and
quantitative methods (Iacono et al., 2009). Combining the methods from mixed methods
can add breadth and depth to an inquiry (Johnson, Onwuegbuzie, & Turner, 2007). The
business problem in this study required the use of numerical indices to examine whether a
correlation exists between variables. A study to determine whether a correlation exists
between variables requires the use of quantitative (Iacono et al., 2009). Simon (2013)
supported the use of correlational methods as the primary function of correlational studies
is to assess the relationship between variables. Given that the hypotheses in this study
required testing the relationship between variables, the use of quantitative methods is
appropriate (Simon, 2013). The use of qualitative methods is appropriate for the
exploration of concepts but not suitable for a correlational study (Simon, 2013).
In this research study, I incorporated a correlational design to examine the
relationship between the independent variables and the dependent variable. Given that the
intent of the study was to examine and describe the relationships between predictor
variables and a dependent variable, a correlational design was the most appropriate study
5
(Simon, 2013). Using a correlational design between known variables provides insight
into social phenomena suitable to test the hypotheses (Simon, 2013). Correlational
research does not imply causation nor does it attempt to infer cause-and-effect as in
causal-comparative research (Craig & Metze, 1979; Simon, 2013). Given that the use of
correlational research method infers a relationship exists between variables in a study
(Craig & Metze, 1979; Simon, 2013), the use of correlational research methods was
appropriate to assess the relationship between variables for my study. Other quantitative
research methods such as the use of pure experimental designs were not appropriate. The
use of an experimental design would require the manipulation of variables and a control
group to determine the effect of treatment on the dependent variable (Campbell &
Stanley, 2010) and was not practical to address my research questions.
Research Question
The specific business problem was senior organizational business leaders do not
have a predictive model to understand the relationship between innovation rankings,
brand valuation, and economic sustainability. Addressing the specific business problem
required determining whether innovation ranking or brand valuation can be a predictor of
economic sustainability. Based on the specific business problem, the central research
question was: What is the relationship between innovation ranking and economic
sustainability, and the relationship between brand valuation and economic sustainability?
By posing this question, my intent was to determine whether innovation or brand
valuation were predictors of economic sustainability.

6
Hypotheses
The following hypotheses were tested to support the central research question
regarding the nature of the relationship between innovation, brand valuation, and
economic sustainability:
Null Hypothesis (H01): There is no relationship between innovation ranking and
economic sustainability.
Alternative Hypothesis (Ha1): There is a relationship between innovation ranking
and economic sustainability.
Null Hypothesis (H02): There is no relationship between brand valuation and
economic sustainability.
Alternative Hypothesis (Ha2): There is a relationship between brand valuation and
economic sustainability.
Theoretical Framework
Within the doctoral study, I utilized several theories that deal with innovation
concepts and systems thinking by TMTs. The theoretical frameworks I used in this study
are Sood and Tellis’s (2011) theory of limited market disruption, Morris’s (2013) three-
dimensional theory of innovation, and Legrand and Weiss’s (2011) innovation gap
theory. Key constructs include Sood and Tellis’s theory of limited market disruption that
challenges Christensen’s (2015) theory of disruptive innovation of lower-priced
alternatives to create market disruption by new entrants first introduced in 1995.
Challenging Christensen’s theory of innovative disruption, Sood and Tellis noted that the
introduction of lower-priced technologies is a fallacy auguring most innovation is higher-

7
priced and introduced by incumbents. Morris builds on Christensen’s disruptive
innovation theory by introducing three dimensions of innovation (a) continuous
incremental innovation, (b) discontinuous or disruptive innovation, and (c) business
model innovation warfare based on systems thinking. Of the three dimensions, business
model innovation warfare is the most important (Morris, 2013). The challenge noted by
Morris is that TMTs fail to understand or focus on systems thinking to close the
innovation gap to achieve sustainability. Legrand and Weiss put forth the theory of an
innovation gap to illustrate reasons why TMTs need to create a culture of innovation.
With the need to innovate being challenged, TMTs are under pressure from shareholders
to focus on immediate financials even though innovation has a long-term orientation and
is important to brand valuation and economic sustainability (Kotter, 2013). Short-term
profitability and simultaneously making investments in innovation to help ensure future
revenues is a balancing act (Kotter, 2013). Balancing short-term and long-term goals to
create an ambidextrous organization is the role of a capable Chief Executive Officer
(CEO) (Dierk & Dover, 2012). While Morris suggested that the mandate of the TMTs
and boards is to foster innovation, this objective may be disingenuous and their desire to
innovate hollow given the prevalence of short-term goals (Kotter, 2013). The innovation
gap, the dimensions of innovation, and ambidexterity act as the theoretical framework for
understanding the role TMTs have in innovation efforts to achieve sustainability.
Operational Definitions
Throughout this study, several unfamiliar terms appeared that may have several
meanings depending on their unique connotation or context. Definitions for these terms

8
help provide the reader with necessary subject matter to delineate the meaning and
context of these unique terms.
Ambidexterity. Ambidexterity is the ability of TMT members to simultaneously
balance short-term business objectives with long-term goals (Dierk & Dover, 2012). Such
objectives may include financial objectives as well as innovation objectives (Dierk &
Dover, 2012).
Business model innovation. Business model innovation is the practice of using
adaptive systems thinking to substantially alter or replace existing business models to
improve overall business performance by intentionally reaching beyond existing business
parameters (Morris, 2013).
Continuous innovation. Continuous innovation is the practice of making
incremental improvements to business processes or products (Morris, 2013).
Disruptive innovation. Disruption innovation is a defined by the activities
whereby incumbents and new entrants introduce new products and services wishing to
compete primarily on price and first introduced as an integral component of Christensen’s
theory of disruptive innovation (Christensen, Raynor, & McDonald, 2015; Sood & Tellis,
2011). Breakthrough innovation is often interchangeable with disruptive innovation
(Morris, 2013).
Top management team. The top management team (TMT) includes members of
the senior leadership team of a business organization and is interchangeable with senior
leadership team or c-suite (Blackshaw, 2014).

9
Assumptions, Limitations, and Delimitations
Assumptions
Assumptions are the underlying and inherent beliefs that may not have a clear
definition but have acceptance as a state of being or as an enabler that may be out of the
control of the researcher (Simon, 2013). Once identifying the research problem, a
tentative or plausible explanation forms. The plausible explanation or assumptions should
be explicitly clear and testable to help narrow the focus of the data collection
requirements. Also, the assumptions should inform the inherent research method and
design (Craig & Metze, 1979). As such, this research study has several assumptions.
The assumptions for this study were (a) many TMTs believe an innovation gap
exists and yet do not know how to address this within their organizations; (b) resource
allocation to fund innovation will result in higher levels of innovation; (c) resource
allocation to support innovation is a possible means of closing the perceived innovation
gap and building brand value; (d) TMTs’ perception that funding innovation hurts short-
term financial performance given that budgeting for innovation is a tradeoff between
short-term financial performance and long-term economic sustainability; (e) funding
innovation may require a change in business models, a change in TMT capabilities, and a
departure from prevailing locked-in mental models; and (f) the metrics provided by
Forbes, Interbrand Brand, and Dow Jones are accurate. The assumption was that the
metrics from the noted third-party database stakeholder are well-respected and find
acceptance in other scholarly research. As such, these indices were reliable sources of
data for this study.
10
Limitations
Certain factors or conditions that are beyond the control of a researcher limit
research studies (Simon, 2013). The limitations may represent inherent attributes or
forces that may influence the accuracy of the measurements as they pertain to the variable
interaction or threaten validity (Brutus & Duniewicz, 2012). Without defined limitations,
the study would become irrelevant (Simon, 2013) and clearly defining the research
problem within the appropriate parameters would be difficult (Craig & Metze, 1979).
The first limitation was the companies selected were not chosen by industry but
on the innovation ranking by the third-party. This limitation underscores that there are
different types of innovation that require a range of capital allocation, and a vast array of
business industries with varying levels of complexity. Therefore, no distinction was made
between company industries in the selection process.
The second limitation was the restriction of data available. Given archival data
was used in this study, the researcher had no control over how the data providers
collected the data, evaluated the companies, and reported the data. Some data for
companies may be missing or incomplete. The selection of companies for the study did
not all have a corresponding assigned ranking or data available on the Forbes World’s
Most Innovative Companies List (WMIC), Interbrand Brand Index, and the Dow Jones
Sustainability Index (DJSI). Companies without the requisite corresponding indices data
required the elimination of some firms from the study sample and reduced the overall
sample size accordingly.
11
The third limitation was the study was limited in time and scope. Using data from
the Forbes WMIC List, Global Innovation 1000 Index, and the Interbrand Brand Index,
the scope was to examine whether innovation and brand valuation are predictors of
economic sustainability as listed in the DJSI. Due to the limitations of available resources
and time, the timeframe of the research study was restricted to the period of 2012 to
2015. A fourth limitation was the findings may not necessarily apply to firms that do not
have public information available, do not have global operations, or who do not operate
under recognizable brands.
A final limitation was the effect of innovation or brand valuation on sustainability
may not be evident immediately, and the results may be subject to inaccuracies.
Bogliacino and Pianta (2013) noted that the existence of a lag between innovation efforts
linked to process improvements and profits is typically 3 to 4 years. Given there may be
limitations attributable to the possible delay between innovation implementation and the
resultant metrics, the alignment in years between the metrics may have influenced the
results. As such, the years of available metrics were adjusted in the study to incorporate
Bogliacino and Pianta’s approach to compensate for this limitation.
Delimitations
Delimitations define the boundaries and scope of the study that are within the
control of the researcher (Simon, 2013). The delimitations applied to this study included
§ Not making a distinction between the three types of innovation as defined
within this study on the data collection and computations;
12
§ Only companies ranked by Forbes (e.g., publicly listed firms that have
issued shares and provide information to stock market regulators, available
within the public domain, and have a minimum market capitalization of
US$10B) were part of this study;
§ The exclusion of private companies from this study regardless of their
level of innovation due to the limited information available within the
public domain;
§ Financial results of subsidiary companies included in the subsidiary’s
parent company’s financial information; and
§ Scope limitations to the firms where information was available from
Interbrand Brand Index and the DJSI for the companies on the Forbes
WMIC List.
Significance of the Study
Contribution to Business Practice
The findings of this study may be of value to the practice of business because,
although top management teams and boards stated that long-term innovation objectives
are a priority, their actions do not reflect this. This paradox arises given the focus of
senior leadership teams is on short-term objectives to meet quarterly financial results
(Sonnenfeld, Kusin, & Walton, 2013). While TMTs indicated they are not happy with the
level of innovation achieved within their firms, the level of innovation achieved may
relate to the investment in innovation and their brands. In fact, TMTs noted the
innovation gap may have emerged given that the TMTs may have inadvertently or
13
deliberately starved innovation by not having allocated sufficient or dedicated resources
(Legrand & Weiss, 2011). TMTs that fund innovation are typically looking for either
incremental or disruptive technologies as the sole output of their innovation efforts
(Blank, 2013). TMTs may find there are other forms of innovation and systemic
challenges they have failed to recognize and appropriately address. Morris (2013) posited
the area that has the most influence on organizational sustainability is its business model.
While TMTs have tended to focus on short-term financial results, Morris argued that
business model warfare is the most important area of innovation. However, business
model warfare success requires TMTs understand systems thinking theory (Kotter, 2013).
Subsequently TMTs need to be able to apply such thinking in a manner that would
facilitate the development and implementation of a culture of innovation to achieve
economic sustainability (Kotter, 2013).
The emergence of an innovation gap between innovation expectations and
achieved innovation is evident in the research literature and underscored by Legrand and
Weiss (2011). The importance of this study was to understand whether innovation leaders
are more likely to have achieved a higher level of economic sustainability than firms that
are low or moderate innovators. The intent of this research was to determine whether
investing in R&D is in the best interest of TMTs and boards to address the innovation
gap. The mindset that appears to dominate seems to be that once an organization achieves
a level of success the TMT deems to be acceptable, the organization arrives at a crossroad
(Xu & Yan, 2014). The crossroad requires judgment to determine whether investing and
engaging in innovation is more beneficial to the organization and to themselves

14
personally (Xu & Yan, 2014). At the core of this senior leadership mindset is the decision
to manufacture short-term financial performance or to invest in innovation. For firms to
foster innovation, firms must allocate and consume resources in the innovation process
that can affect short-term profitability (Rubera & Kirca, 2012). The assumption is that the
long-term sustainability of firms appears to be at risk if top management teams and
boards do not recognize the emergence of this gap. The intent of this research study was
to determine whether addressing and closing the innovation gap, and higher brand
valuations are predictors of economic sustainability. Within the literature, there is the
suggestion that innovation laggards are unlikely to be ambidextrous organizations (Buyl,
Boone, & Matthyssens, 2012; Smith & Tushman, 2005). Innovation laggards may
deliberately bolster short-term profits at the expense of sustainability. The significance of
this research was to determine whether companies that invest in innovation are more
likely to garner higher levels of brand valuation and economic sustainability. The intent
of this research study was to examine the innovation gap to determine whether innovation
and brand valuation are predictors of economic sustainability. The findings could be used
to make a case that senior leaders should balance short-term objectives with investments
in innovation to achieve higher brand valuation and economic sustainability.
Implications for Social Change
The implications for positive social change include the potential to encourage
senior business leaders to challenge existing business models and embrace an
ambidextrous business model by recognizing the importance of investing in innovation
initiatives to support long-term sustainability along several dimensions. Brem and Ivens

15
(2013) noted that sustainability has three considerations with a triple bottom line view for
firms including environmental, economic, and social. Sayem (2012) identified three
categories to measure innovation success (a) environmental and social factors, (b)
technical effects, and (c) economic effects. Brem and Ivens asserted that positive benefits
from innovation efforts must address industrial sustainability including product design,
manufacturing, and services to meet the needs of the present generation while not
negatively affecting economic, social, and environmental factors over the long-term.
Brem and Ivens argued that three layers of performance along a firm’s value chain
affecting the triple bottom line that innovation effort must address to achieve social
benefits including (a) a reduction in input resources to foster stewardship of raw materials
and input, (b) optimizing the manufacturing process to reduce pollutants and carbon
emissions, and (c) a reduction of outcomes including how a product or service affects the
environment by reducing energy use and how it can be recycled or disposed. Sayem
asserted that the capacity to innovate is a catalyst of growth and influences performance
for sustainability not on simply an economic basis but also contribute to environmental
and social sustainability. As noted by Sayem, innovation efforts have the potential to
positively affect overall sustainability beyond economic factors and in the broader
context of the environment and society (Sayem, 2012). Given the assertions by Brem and
Ivens and by Sayem, innovation efforts offer the potential to address social and
environmental issues for the overall good of society.
16
Review of the Professional and Academic Literature
The organization of the literature review is by section and theme. Included in the
literature review is an analysis and synthesis of the literature in the context of the
theoretical framework discussed within this study and on the variables in this research
study. Conducting the searches yielded more than 235 articles of which approximately
128 are relevant to the topic of study, excluding regulations and data. Of the 128
references, 109 (85%) are peer-reviewed, and 116 (87%) published within the last 5
years. Of the articles reviewed, 108 articles support the literature review. In the literature
review section, 95 (88%) are peer-reviewed, and 101 (94%) published within the last 5
years.
While not exhaustive, the articles within the literature review provided an analysis
of the relevance and importance of the independent and dependent variables. Where
appropriate, I compare and contrast various points of view to support the relevance of this
study. The sources in the literature search include refereed journal articles, professional
websites that produce metrics that relate to this study, transcripts of academic
conferences, and dissertations. The articles in the literature review are accessible through
various databases including Business Source Compete, Google Scholar, ProQuest
Central, and from publishers’ websites. Searching keywords and phrases was also part of
the strategy to locate relevant articles. The strategy to search the databases included using
a list of relevant keywords and phrases such as innovation theory, innovation types,
innovation performance, brand performance, brand metrics, economic sustainability, and
financial sustainability.

17
According to Legrand and Weiss (2011), the innovation gap is a business problem
that requires further study. To understand the factors that contribute to the innovation
gap, I addressed key findings within the literature concerning why the innovation gap
occurs. An overarching notion is leaders deliberately or inadvertently create an
innovation gap (Legrand & Weiss, 2011) based on a variety of practices. The innovation
gap senior leaders create may show a lack of willingness to change locked-in thinking
about innovation, new product development (NPD) experimentation, business models,
and financial metrics (O’Connor & Rice, 2013). The focus of senior leadership is on
short-term goals around immediate financial performance at the expense of long-term
opportunities and sustainability (O’Connor & Rice, 2013). In the literature review, using
a range of relevant sources and scholarly journals addresses three areas within the
scholarly literature: innovation, branding, and sustainability. These three areas coincide
with the variables in the study: innovation ranking, brand valuation ranking, and
sustainability index ranking. I provide an in-depth discussion of each variable in the
literature review. The topics I address in the literature review include innovation, barriers
to innovation, the relevancy of brand, predominant brand valuation methods, and issues
that drive sustainability.
Innovation. Innovation is one of the three variables discussed within this study.
Innovation efforts enablers and detractors are many. Following are several factors that
contribute to the level of innovation in firms and may explain possible reasons for the
emergence of the innovation gap.

18
Ambidexterity. Morgan (2014) found a locked-in mindset and short-term focus
are detrimental to innovation efforts. Senior leaders must recognize that to close the
innovation gap and become a truly ambidextrous organization, they must intentionally
shift their organization’s culture to a learning environment (Morgan, 2014). Weber and
Tarba (2014) noted that ambidexterity consists of simultaneous exploration and
exploitation, best framed as strategic agility. The role of the TMT is to frame learning
and sharing knowledge as a means to alter the corporate culture and create a sustainable
innovation pipeline within an organization (Weber & Tarba, 2014). Mootee (2012)
asserted that effective CEOs should have the capability to make a distinction between
competitive strategy and strategic innovation. A competitive strategy represents the
choices firms make to compete effectively against industry rivals or new entrants within
today’s product-marketplace context (Mootee, 2012). On the other hand, strategic
innovation is the application of strategic foresight into the future to prognosticate and
capitalize on tomorrow’s opportunities (Mootee, 2012). Strategic innovation is an attempt
to create new markets or disrupt an established market with new products, new service
categories, processes, and business models (Mootee, 2012). According to Mootee,
developing strategic ambidexterity is critical if an organization wishes to maximize value
creation for long-term sustainability. Ambidexterity, as defined by Mootee, is the ability
to design and execute a competitive strategy to exploit current opportunities while
simultaneously engaging in strategic innovation. Ambidexterity also includes undertaking
strategic innovation to lay the groundwork to compete in the future for long-term
sustainability.
19
Buyl et al. (2012) defined ambidexterity as an organization’s ability to be as
efficient as possible by exploiting current opportunities while simultaneously being
adaptive to changes in the environment for long-term sustainability. Exploitation
behaviors enhance efficiencies, remove uncertainty, and reduce variance to maximize
profitability in the short-term. Juxtaposed to exploitation are exploratory organizational
behaviors that are committed to searching for new opportunities, innovation, and
increasing variance, and focus on long-term perspective (Buyl et al., 2012). While
organizations have many parts, changes in one area can have an effect in other areas.
Mootee (2012) argued that while TMTs should understand how to balance competitive
strategy, they should also have the foresight to imagine a future thereby making
investments in strategic innovation. However, developing ambidexterity capabilities
within TMTs is rare (Mootee, 2012). As such, Dierk and Dover (2012) developed an
assessment tool to assess ambidexterity skills of TMTs based on three archetype
behaviors. Dierk and Dover’s assessment tool provides additional insights specifically
into the TMTs’ innovation capabilities.
The three archetypes put forth by Dierk and Dover (2012) included managers who
optimize operational productivity and efficiencies, entrepreneurs whose role is to search
for new opportunities and continuously push for greater levels of innovation, and the
leader who is responsible for keeping the manager and entrepreneur archetypes in
balance. While assessment tools can help firms evaluate TMTs’ innovation capabilities
and ability, achieving ambidexterity requires TMTs to possess innovation capabilities
including an entrepreneurial orientation. In fact, Dierk and Dover found placing

20
managers into roles and asking them to act entrepreneurially to spur innovation would
refrain from doing so unless they had a genuine entrepreneurial orientation. Without this
authentic entrepreneurial orientation, an innovation stalemate transpires negatively
affecting long-term sustainability (Dierk & Dover, 2012). Leiponen’s (2012) research
supports the importance of developing better professional and systematic managerial
capabilities to broaden innovation objectives as managerial capabilities are critical to
innovation. Leiponen noted that better managerial capabilities generated direct and
indirect returns to both service and manufacturing firms.
Buyl et al. (2012) found an organization’s long-term success may be attributable
to its ability to simultaneously exploit current capacities while exploring fundamentally
new competencies. Buyl et al. cited Smith and Tushman (2005) who argued that long-
term organizational performance is dependent on the TMT’s ability to effectively explore
and exploit simultaneously. Striking a balance between exploitation and exploration to
achieve ambidexterity seems to be a challenge for senior leadership teams. Smith, Binns,
and Tushman’s (2010) noted that CEOs must have the skills and the motivation to
consistently balance core business unit objectives to exploit existing opportunities while
simultaneously fostering innovation unit objectives to explore future opportunities. Given
that some stakeholders will adhere to a short-term agenda of exploitation while other
stakeholders will advocate for exploration and long-term sustainability, the role of the
CEO is to manage ambidexterity by striking a balance between exploitation and
exploration. For an organization to embrace ambidexterity and fund R&D for NPD with
the intent of narrowing the innovation gap, CEOs must accomplish several objectives
21
(Smith et al., 2010). CEO objectives include not relegating innovation to lower levels of
the organization, forcing the abandonment of feudal battles within the TMT, and
engaging in practical and future-oriented debates (Smith et al., 2010).
Chang, Franke, Butler, Musgrove, and Ellinger (2014) noted that TMTs fail their
companies by not encouraging ambidexterity. The reason for this failure is that TMTs do
not understand radical innovation and incremental innovation (Chang et al., 2014). Some
companies emphasize incremental over radical innovation and miss significant
opportunities for competitive success. TMTs emphasize and support incremental
innovation given the payoffs seem more certain and quantifiable (Chang et al., 2014).
TMTs have the inclination that incremental innovation contributes to normal profits and
is less risky (Chang et al., 2014). TMTs also maintain the belief that radical innovation is
uncertain, produces less predictable financial contributions, and requires a longer
timeframe (Chang et al., 2014). Taking a balanced approach to managing incremental and
radical innovation simultaneously requires strategic expertise that is often lacking within
TMTs (Buyl et al., 2012; Chang et al., 2014; Dierk & Dover, 2012; Leiponen, 2012;
Mootee, 2012; Smith & Tushman, 2005).
Adding support to Smith et al.’s (2010) assertion that capable TMTs need to
champion innovation efforts, Lin, McDonough, Lin, and Lin (2013) hypothesized the
combination of three capabilities associated with innovation ambidexterity led to higher
business performance in strategic business units. By opening corporate culture to
learning, Lin et al. noted that both intraorganizational and extraorganizational learning
capability links to ambidextrous innovation and financial performance. Lin et al. asserted
22
that enhanced shared learning capabilities have a positive effect on innovation
ambidexterity. By combining internal learning and external partnering with the
development of an open culture, more simultaneous explorative and explorative activities
emerge (Lin et al., 2013). An open culture ultimately leads to effectively generating
incremental and radical innovation simultaneously (Lin et al., 2013). Lin et al. noted that
combining the three practices and their interaction maximizes the success of
ambidextrous innovation. By building an open organizational culture, it provides a
climate for individuals to engage in collaborative behaviors essential to fostering
incremental and radical innovation simultaneously (Lin et al., 2013). Several themes
pertain to innovation and the critical role of senior organizational leaders that requires
consideration.
The innovation gap and status quo retention. When TMTs speak about the level
of desired innovation versus the level of innovation achieved or realized, the difference
between desire and reality is the innovation gap (Legrand & Weiss, 2011). Legrand and
Weiss (2011) asserted that the two factors that contribute to the innovation gap included
the lack of knowledge or skills needed by TMTs to lead organizational change, and
locked-in mindsets leading to the desire of TMTs to rely on past strategies to preserve the
status quo. These two contributing factors to the innovation gap are consistent with the
assertions in other research findings (Morris, 2013; Smith et al., 2010). Legrand and
Weiss found most TMTs make every effort to preserve the status quo since it is the only
reality they have experienced. Although companies may develop and adopt an existing
business model in response to a past competitive environment and market context,
23
stability and predictability may no longer be the norms rendering the existing business
model inappropriate. While retaining the status quo seems to be the default position of
many TMTs, the tendency is for TMTs to rely on past experiences and analytical skills to
solve issues (Legrand & Weiss, 2011). TMTs were, however, not able to apply
innovative thinking designed to look at the overall business context from a different lens
(Buyl et al., 2012; Legrand & Weiss, 2011). This oversight on the part of TMTs is that
they fail to establish and resource innovation teams that have been trained to address
current problems in ways that differ from the skills of TMTs (Legrand & Weiss, 2011;
Morris, 2013). In fact, using forward-looking, innovative, and systems thinking are the
skills required to move away from the status quo but tend to be in short supply by many
TMTs (Legrand & Weiss, 2011).
According to Schoemaker, Krupp, and Howland (2013), sources of the innovation
gap may be attributable to the lack of immutable skills necessary to think strategically
about innovation by senior leaders. Without the necessary skills to understand innovation
and innovative thinking, TMTs are not able to navigate the unknown effectively nor
adapt and react to shifting environmental circumstances (Schoemaker et al., 2013). As
sectors become more dynamic, the requisite leadership skills to foster innovation include
the abilities to anticipate, challenge the status quo, interpret trends, make decisions, align
the organization with the core strategy, and to learn from successes and failures
(Schoemaker et al., 2013). Schoemaker et al. (2013) argued that leaders must have the
ability to apply these skills simultaneously. A significant limitation of TMTs is that most
are not adept at perceiving ambiguous opportunities and threats on the periphery of their
24
business (Schoemaker et al., 2013). According to Schoemaker et al., the most important
skill that senior leaders can exhibit is the ability to zoom into the details and out to see the
big picture. Understanding the details and seeing the big picture helps TMTs interpret
conflicting information, identify missing information, and subsequently be able to form
and test hypotheses (Schoemaker et al., 2013). Strategic thinkers do not get prematurely
locked into a simplistic set of go or no-go choices but instead look for a range of multiple
options and trade-offs (Schoemaker et al., 2013). Competent TMTs have the ability to
take into account both long-term and short-term organizational goals (Schoemaker et al.,
2013).
Predominant theories of innovation. While innovation is critical to sustainability,
there are many definitions of innovation. The predominant definition of disruptive
technology tends to be Christensen’s theory of disruptive innovation (Sood & Tellis,
2011). Christensen asserted in his 1997 disruption theory that smaller companies with
fewer resources and known as new entrants often introduce disruptive technology in the
form of new products and services to challenge established incumbents (Christensen et
al., 2015). New entrants introduce and design products with fewer features to compete
primarily on price (Christensen et al., 2015; Sood & Tellis, 2011) and replication rather
than innovation (Hunter, 2012). Other researchers define innovation differently. When
defining innovation, Morris (2013) noted there are three types of innovation to consider.
The first two types of innovation that Morris identified are continuous innovation that
tends to be incremental, and breakthrough innovation that may be disruptive. While
Morris’s definition of breakthrough innovation is somewhat analogous to Christensen’s

25
theory of disruptive innovation, Morris departed from Christensen’s theory. Morris
argued that the third type of innovation is the most important type of innovation: business
model innovation.
Other researchers have provided different perspectives on innovation. Nagji and
Tuff (2012) defined innovation as core, adjacent, and transformational. Nagji and Tuff
defined core innovation initiatives as the efforts required to make incremental changes to
existing products and efforts to make additional inroads into new markets. At the
opposite end of the spectrum, the intention of transformational innovation is to create
new offers and possibly new businesses that do not yet exist (Nagji & Tuff, 2012). In
between are adjacent innovation initiatives that typically share characteristics with core
and transformational innovations and could allow a company to draw on existing
capabilities. However, adjacent innovation initiatives require putting existing capabilities
to new uses (Nagji & Tuff, 2012). Morris (2013) posited business model innovation is the
most significant type of innovation as it has a profound effect on many parts of an
organization. Morris asserted that business model innovation has its roots in adaptive
systems thinking and is the most challenging for business leaders for several reasons.
Morris posited business model innovation is the most important yet predominantly
overlooked within the research literature and ideally part of the discussion on innovation.
Systems thinking drives business model innovation–replication versus renewal.
To provide additional context on systems thinking, business model innovation
may include changes made to the value chain (Morris, 2013). Morris suggested that the
possibility of applying systems thinking to organizations with the intent of making

26
substantial and tangible changes to the process of value creation along the value chain.
The resultant delivery of products and services are substantially deviant to that of
competitors within a given system. An example of deviating from an existing business
model is Tesla’s direct distribution model that is unlike the traditional dealership model.
Given that business model innovation is a source of competitive advantage, business
model innovation may be a crucial factor in understanding differences in firm
performance.
Heij, Volberda, and van den Bosch (2014) examined the influence of two business
model innovation types on firm performance. The two business models include
replication consisting of leveraging an existing business model, and renewal through the
introduction of a new business model onto an existing framework (Heij et al., 2014). Of
the two business model innovation types, Heij et al. (2014) noted that business model
replication provides several cost advantages because it allows firms to operate more
efficiently, involves economies of scale, increased revenues, captures more value,
extends a firm’s competitive advantage, establishes close relationships, increases the
difficulty of competitors to imitate such a business model, and ultimately increases a
firm’s profit. Juxtaposed to business model replication is business model renewal.
Business model renewal permits firms to redefine industry profitability by reshaping the
world in a firm’s existing industry (Heij et al., 2014). Over time, reshaping the existing
industry provides stronger firm performance versus retaining the older business model
(Heij et al., 2014). Heij et al. found TMTs often fail to understand the markets and
industry dynamics of their environment within the context of defining existing
27
parameters and constraints. Heij et al. asserted that TMTs should learn when each of the
two types of business innovation models, replication and renewal, are appropriate along
the innovation continuum. The challenge of applying the appropriate business innovation
models is that TMTs often run the risk of blindly adhering to the status quo by falling
into the complementaries trap (Heij et al., 2014). TMTs fall into the complementaries
trap by wishing to preserve an existing business model more appropriate to a past
business environment (Heij et al., 2014). Unfortunately, the complementaries trap
promotes blind adherence to the status quo (Heij et al., 2014).
Obstacles to innovation. Considering the obstacles to innovation is pertinent
when discussing the innovation gap and the effect of innovation performance. Innovation
initiatives can underperform because senior leaders often fail to confront internal
obstacles to innovation given their fixation on short-term financial performance and
associated metrics (Hess, 2012). While chief financial officers (CFOs) are responsible for
managing their companies’ return on investment (ROI) and operational efficiencies,
simultaneously they attempt to manage investment in innovation initiatives (Hess, 2012).
Each activity is distinct and requires TMTs to have a fundamentally different mindset to
distinguish the different activities. The innovation gap is a serious issue tied to the natural
proclivity of individuals and organizations wishing to maintain the status quo (Hess,
2012). TMTs using best practices to innovate require that leaders adopt a distinctively
new mindset that promotes innovation by internally aligning systems with the correct
processes to create deliberate innovation (Hess, 2012). Aligning systems require a
willingness on the part of the TMT to explore and challenge assumptions that underlie

28
existing practices outside of a companies’ comfort zone (Hess, 2012). In essence, the
TMT must have the ability to take a holistic systems approach to innovation (Hess,
2012). Taking a holistic systems approach to innovation requires aligning business
strategy, culture, structure, leadership behaviors, human resources policies,
measurements, and rewards to promote innovation (Hess, 2012).
Solely focusing on operational excellence and efficiencies juxtaposes meaningful
innovation (Hess, 2012; Schoemaker et al., 2013). The TMTs of incumbent firms note
that newer organizations often are more nimble and flexible to innovate (Blank, 2013;
Legrand & Weiss, 2011). New firm nimbleness may simply be true given that newer
firms are not bound by legacy TMTs, culture, or organizational processes that often
hamper the incumbents (Legrand & Weiss, 2011). Sood and Tellis (2011) provided a
warning to incumbents not to be complacent about new entrants. TMTs of incumbents
need to understand and pay close attention to their internal cultures and values given that
Sood and Tellis specifically noted that internal issues have the potential to be more
disruptive than external factors. Paradoxically, larger firms typically have slack resources
and the financial depth to deliberately address their innovation gap (Legrand & Weiss,
2011).
TMTs typically do not have the knowledge to challenge current management
systems nor the capabilities to make innovation systematic and part of the culture
(Legrand & Weiss, 2011). Mollick (2012) asserted that the traditional thinking by TMTs
is the belief that only individual innovators make significant contributions and that
hollowing out middle management positions is prudent. Mollick found, in addition to the
29
organizational structure and culture, the quality of middle management is a financial
variant that drives innovation outputs and branding efforts more so than do individual
contributors or senior executives. Mollick asserted that overlooking the contribution of
middle managers by executives explaining why executives noted gaps between the levels
of innovation they expect within their organizations and the actual amount of innovation
delivered (Mollick, 2012). Hollowing out middle management may explain why
innovation levels do not meet the expectations of senior executives. Several of these
impediments to innovation require further consideration.
Lock-in mindsets impede innovation. Building on Morris’s (2013) notion of
business model innovation, a contributing factor to the innovation gap may be that senior
leaders have a locked-in mindset that prevent them from challenging existing business
models. Legrand and Weiss (2011) attributed the innovation gap to senior leadership
teams limiting their existing frames of reference. In other words, TMTs rely on their
locked-in mentality to analyze problems adding to their inability to think innovatively
about problems (Legrand & Weiss, 2011). Organizations rely on rigid short-term metrics,
process standardization, hierarchy and delegation, and a propensity for short-term
profitability that exacerbates locked-in thinking (Legrand & Weiss, 2011). A short-term
orientation often forces investment in innovation and R&D initiatives to suffer (Legrand
& Weiss, 2011). Others researchers have also noted that exhibiting a locked-in mentality
is an impediment to innovation. Lampikoski, Westerlund, Rajala, and Möller (2014)
found TMTs thwart meaningful innovation because they often do not understand the
range of innovation types or the innovation process. Lampikoski et al. found senior

30
leaders often possess preconceived negative views of revolutionary innovation due to
their short-term orientation and related lack of urgency, and the misconception that
funding any sustainability effort only represents costs rather than an investment. Senior
leaders often fail to understand how systems thinking, the lack of TMT skills, and
organizational culture can negatively affect innovation.
Supporting the notion that a TMT’s locked-in mindset hinders innovation,
Seebode, Jeanrenaud, and Bessant (2012) developed a four-quadrant innovation model.
Seebode et al.’s model plots established context and new contexts from left to right along
the X-axis, and incremental innovation and radical innovation from bottom to top
respectively along the Y-axis. Seebode et al. found most firms operate in quadrants on the
left side that represents business as usual. The researchers noted that most innovation is
incremental or is in response to regulatory requirements for sustainability. Plotting firms
within one of the left quadrants is analogous to firms retaining the status quo. Left
quadrant firms innovate at the component level as innovation usually takes place within
the current framework or core configuration. On the right side of the model, Seebode et
al. found there is a need within firms to develop new routines, co-evolution, and
modification of existing systems. Quadrant four, in particular, represents the edge of
chaos and results from complex transactions and interaction required by sustainability-led
innovation (SLI). What is significant is that in most cases, the development of SLI
requires the adoption of new systems thinking and the abandonment of existing business
models to move forward (Seebode et al., 2012). Seebode et al. provided a salient example
and noted that Royal Philips Electronics’ (Philips) TMT utilizes a similar matrix to map
31
innovation types against the market life cycles of their products. The three innovation
types that Philips uses to classify its products and processes include roadmap innovation,
adjacencies, and breakaway innovation (Seebode et al., 2012). Roadmap innovations
strengthen Philips’ core business, adjacencies create profitable adjacent businesses that
are new to Philips, and breakaway innovations are new to the world (Seebode et al.,
2012). Philips is not locked-in to one type of innovation to the exclusion of others
(Seebode et al., 2012).
Key steps in the process Philips utilized to innovate and optimize products are
documented by Arnold and Hockerts (2011). To drive the innovation process, Philips’
TMT developed and implemented a process strategy driven by specific sustainability
targets (Arnold & Hockerts, 2011). The overarching targets that Philips’ TMT established
have several focal areas including energy efficiency, weight reduction, recycling,
recyclability and disposal, reduction and eventual elimination of hazardous substances,
reduction in packaging, and an increase in lifetime product reliability (Arnold &
Hockerts, 2011). To facilitate the achievement of these targets, the innovation process
that Philips’ developed and implemented included: (a) having a robust vision; (b)
alignment of strategies, policies, and systems to support the vision; (c) setting
unambiguous sustainability targets for all business units and holding managers
accountable; (d) ensuring that the TMT drives the process; (e) forming an intra-firm
education program to share innovation across the organization; (f) establishing
sustainability accounting and reporting; and (g) changing product labeling and marketing
communications to emphasize sustainability benefits (Arnold & Hockerts, 2011). To

32
survive, Philips’ TMT created clear objectives supported by a deliberate process designed
to challenge their business model.
Systems thinking and the innovation paradigm – value chain considerations. A
discussion on how innovation along an organization’s value chain is necessary within the
context of systems thinking. Kock, Gemünden, Salomo, and Schultz (2011) noted that
technical innovation is a continuous construct related to the newness of technologies
embedded within products. While Kock et al.’s definition is analogous to Morris’s (2013)
definition of continuous innovation, Morris made the observation that most TMTs tend to
view innovation in individual parts rather than from a holistic perspective. Viewing
innovation from a holistic perspective or along a continuum must, however, be done
within the context of being part of a larger value chain situated within a larger system
(Morris, 2013).
Applying systems thinking to innovation changes the paradigm of innovation
within an organization along the entire value chain (Seebode et al., 2012; Tung, 2012).
When looking at innovation within a larger system, Morris (2013) suggested that firms
often fail to look for innovative ideas in the most noticeable places along the value chain.
Morris noted that firms often fail to ask their customers for direct feedback and ideas for
improvement through surveys and face-to-face meetings to identify areas of learning and
improvement. Morris argued that typically senior leadership teams believe they can
create a competitive advantage through incremental innovation to products and services.
Undertaking incremental innovation requires the absence of systems thinking
understanding and customer feedback. While incremental innovation often includes a
33
reduction in process time, reduction in paperwork (Morris, 2013), this approach may not
be sufficient. Discontinuous or radical innovation is the result of deliberate large-scale
R&D programs to develop innovation typically associated with NPD. Managing R&D for
continuous and discontinuous innovation is a challenging process (Dierk & Dover, 2012;
Morris, 2013).
As noted by Morris (2013), most TMTs look at innovation through the lens of a
defensive strategy to keep the competition in check within an existing system. A
defensive innovation strategy is akin to incremental changes to products and services, and
incremental changes to processes. TMTs use defensive innovation strategies to enhance
internal efficiencies and short-term profitability (Morris, 2013). A defensive approach to
innovation is, however, very different from acting creatively to look for new
opportunities, new approaches, or develop new systems within the context of the entire
value chain. Vuorinen, Uusitalo, and Vos (2012) provided a different perspective by
defining innovation as a multistage process that affects the value chain. Vuorinen et al.
noted that TMTs better serve their organizations by enabling the transformation of ideas
into new and substantially improved products, services, or processes with the clear intent
of differentiating themselves in the marketplace against their competitors. Vuorinen et al.
asserted that connecting with changing markets and emerging consumer needs requires
co-creating value with customers. Co-creating value with customers requires engaging in
intensive dialog about needs along the entire value chain (Vuorinen et al., 2012).
Gathering customer feedback includes engaging in a discussion about brand values
(Vuorinen et al., 2012). Taking a systems approach to innovation as asserted by Vuorinen

34
et al. goes beyond taking a defensive approach to innovation but is closer to the
innovation ambidexterity that Dierk and Dover (2012) and Morris (2013) asserted.
Need for ambidexterity. Mootee (2012) asserted that developing strategic
ambidexterity is critical if an organization wishes to maximize value creation for long-
term sustainability. Regardless of the leadership approach that TMTs may choose to
employ within their organizations, Latham (2014) was adamant that modern
organizations must become ambidextrous and achieve a level of ambidexterity as it
relates to innovation and sustainability. Latham’s findings are consistent with Dierk and
Dover’s (2012) findings. Having a meaningful discussion on innovation requires
addressing a broader internal context around leadership behaviors. Latham asserted that
senior leaders must have the skills to execute and innovate simultaneously to successfully
manage multiple stakeholders. Organizations that are only capable of focusing on one or
the other are unlikely to survive according to Latham. Organizations that are only adept
at executing an innovation strategy will likely experience boom-bust cycles (Latham,
2014). Organizations that are only good at product execution will likely produce reliable
products that few will desire to purchase (Latham, 2014). Latham noted that it is possible
for skilled TMTs to run their business profitably yet simultaneously change the business
as noted early in this discussion.
Latham (2014) noted that 88% of academic researchers use quantitative methods
to generalize their findings of successful leadership accomplishments. Reallocation of
resources and value from one stakeholder group to another does not take great leadership
to accomplish (Latham, 2014). Buyl et al. (2012) noted that the need for organizations to

35
be as efficient as possible to exploit current opportunities while simultaneously being
adaptive to changes in the environment for long-term sustainability. Buyl et al. asserted
that TMTs require specific skills and knowledge to create an ambidextrous organization.
Buyl et al. asserted that TMTs are responsible for developing an ambidextrous
organization for long-term organizational success. Christensen et al. (2015) posited
TMTs of incumbents must recognize the patterns of new entrants and respond by creating
new divisions to simultaneously explore and exploit new business models. Larson,
Latham, Appleby, and Harshman (2012) noted that Baldrige CEOs were more likely to
drive continuous improvement, exhibit dissatisfaction with the status quo, and
demonstrate behaviors and attitudes to deliberately transform organizational capabilities
to one of a culture of innovation rather than rely on an existing business model. Latham
noted that the intention of leadership should be to create sustainable value for multiple
stakeholders. Creating value for the various stakeholders goes beyond addressing
customer needs but also requires a synthesis of leadership theories for TMTs to exhibit
innovation competencies (Latham, 2014). To create value for stakeholders, Larson et al.
asserted that collaborative CEOs tend to foster higher degrees of willingness to change
and integrate new organizational policies and process changes along the entire value
chain.
Ability to navigate ambiguity is an important TMT skill. Ideally, incremental
innovation creates greater operational efficiencies where possible (Cristina, 2013). Other
forms of innovation such as disruptive innovation targets customer needs and creates
market demand based on a new idea or technology (Cristina, 2013). For genuine and

36
meaningful innovation to flourish, Morris (2013) argued that TMTs must have the
capabilities to view innovation through an adaptive system lens and be capable of
challenging the firm’s business model. Capable CEOs should be skilled and prepared to
make changes to the firm’s structure and culture to engage in business model warfare
(Morris, 2013).
Most CEOs and TMTs are not equipped to lead innovation initiatives within their
organizations (Kaplan, 2012). Even when applying more resources, when different
models and new tools are brought to bear to help companies innovate, many executives
who have risen through the ranks of management have done so because many
organizations value and reward predictability and control (Kaplan, 2012). Fostering
innovation often requires new mindsets, new behaviors, new skills, and new attitudes and
motivations to address and lead the organization through the complexities associated with
problems stemming from disruptive innovation (Kaplan, 2012). Creating or responding to
hyper-competitive market changes and disruptive innovation from competitors often
involves extreme uncertainty that is unlike operations management (Kaplan, 2012). Few
leaders possess formal preparation to confront crisis and critics, nor do they have the
resilience to lead or respond to disruptive innovation and hyper-competitiveness (Kaplan,
2012). Simply stated, most CEOs and TMTs are not equipped to deal with problems and
crisis associated with extreme ambiguity (Kaplan, 2012). Many TMTs lack the
understanding that the innovation journey is not predictable nor follows a linear path
(Kaplan, 2012).
37
Conflicting stakeholders objectives. Strategic leaders must be adept at aligning
and securing buy-in from stakeholders particularly among those who may have disparate
views (Schoemaker et al., 2013). Some stakeholders have long-term organizational goals
while others fixate on short-term objectives. Latham (2014) noted that balancing the
competing interests of various TMT members is an essential attribute of competent
leadership. While Latham found creating value was relevant to most stakeholders, not all
could agree on what value represented. Yuan, Guo, and Fang (2014) asserted that
conflicting stakeholder goals concerning innovation within the TMT requires
consideration when assessing the value and quality of the TMT.
Role of the CEO and TMT in the innovation gap. The skills and the roles of the
CEO and TMT are appropriate considerations within the context of the innovation gap.
TMT leadership capabilities drive successful innovation within an organization (Cristina,
2013). Cristina (2013) argued that TMTs are responsible for creating an optimal
environmental culture for innovative thinking. According to Latham (2014),
organizations require specific leadership behaviors from TMTs to create an
organizational environment that facilitates innovation, systems thinking, and design
thinking. Ideally, TMTs should have the ability to bring all favorable cultural and
organizational factors together (Cristina, 2013). The organizational factors should include
financial resources, necessary human talent, and the ability to clearly articulate the vision
and mission to divisional managers throughout the organization (Cristina, 2013). Cristina
argued that the most important role of the TMT is providing favorable conditions for
healthy risk-taking, stipulating organizational direction, and setting targets to drive
38
innovation in a very deliberate manner. Latham argued the need for CEOs to articulate
and set aggressive organizational targets to challenge status quo thinking. Nadkarni and
Herrmann (2010) asserted that organizations must recruit individuals for the TMT who
are extroverts and assertive in idea generation about innovation, and open to new ideas
rather than maintain the status quo. For TMTs to facilitate innovation within an
organization, TMT must depart from the status quo and adopt new competencies that
promote innovation practices (Latham, 2014). According to Cristina, setting innovation
targets should have the unequivocal intent of transforming innovative ideas into
successful products, services, and processes that add value to the organization. The
notion of setting aggressive targets is analogous to viewing innovation more holistically
and setting targets that will affect the entire organization (Larson et al., 2012).
TMT behaviors influence innovation efforts. To develop new TMT
competencies and depart from the perceived status quo, understanding the significant role
that TMTs perform and their approach to innovation within an organization is important
(Larson, Latham, Appleby, & Harshman, 2012). To deliberately depart from the status
quo for innovation efforts to be successful, Parker, Abdul-Ghaffar, Campbell, and
Vickers-Johnson (2012) asserted that TMTs must exhibit specific behaviors and
personality traits such as cooperation, open-mindedness, be communicable, sympathetic,
and helpful. Parker et al. asserted that, for organizational followers to view the TMT as
competent and capable, TMTs must exhibit specific visible behaviors.
Nadkarni and Herrmann (2010) found the importance of CEO personality
attributes affects the overall ability of innovation and firm performance. Nadkarni and

39
Herrmann found a correlation between CEO personality attributes such as CEO strategic
flexibility and openness to new idea generation with innovation. Specifically CEO
strategic flexibility is directly related to financial performance and important when
considering the relationship between TMT innovation capabilities and financial
performance. Given the failure rate of 70% to 80% and a success rate of only 20% to
30% of organizational transformation initiatives, Larson et al. (2012) asserted that the
value of looking beyond CEO behaviors and examining further CEO motivation and
attitudes on organizational innovation.
TMT skills can affect innovation. Yuan et al. (2014) noted that when TMTs are
puzzled by the fact that their firms are not more innovative and experience an innovation
gap, TMTs should look beyond conflicting TMT objectives. Yuan et al. suggested that
TMT skills, background, and the overall quality of the TMT require a review in detail
given that the TMT factors listed have a significant influence on innovativeness. Dierk
and Dover (2012) asserted that TMTs often fail to take a hard look at their skill
deficiency to determine why their company is experiencing a persisting innovation gap.
Yuan et al. noted that bringing different perspectives and information into the innovative
process may have a positive effect on efforts to close the innovation gap. Nadkarni and
Herrmann (2010) asserted that CEOs should recognize TMT deficiencies and actively
recruit individuals into senior leadership roles who are more assertive in the area of idea
generation to address innovation deficiencies. According to Nadkarni and Herrmann,
TMT members who possess superior R&D experience allow the CEO to focus on
balancing goal achievement, and on creating a culture of innovation by fostering
40
employee engagement. Yuan et al. found TMTs with high levels of R&D experience
enhance a firm’s propensity to invest in R&D and a firm’s effectiveness in deploying
innovation resources. Adding TMT members with enhanced marketing experience helps
leverage R&D investments as background diversity directly contributes to a firm’s
innovativeness within the context of customer needs (Yuan et al., 2014). In other words,
TMTs with higher background diversity including innovation and marketing skills are
better equipped at soliciting feedback from customers on their needs. However, when
there are deficiencies in the diversity of experience within the TMT, boards may need to
intervene and address the TMT experience deficiency. A deficiency of TMT skills and
diversity of skill is likely a source of the innovation gap (Dierk & Dover, 2012; Yuan et
al., 2014).
Lack of TMT skills influences innovation ambidexterity. Understanding
innovation within the context of systems thinking along the value chain appears
challenging for organizations. Legrand and Weiss (2011) recognized that the inability of
firms to adopt business model innovation is because of the lack of skills and abilities of
senior leadership teams. Legrand and Weiss argued that many TMTs do not possess the
skills to use systems thinking to facilitate innovative thinking beyond their companies’
existing business models (Legrand & Weiss, 2011). To provide additional context around
why TMTs may find innovation efforts challenging within their firms, Smith et al. (2010)
provided two approaches to innovation that CEOs tend to adopt. The first approach
identified by Smith et al. is a hub and spoke model. The hub and spoke model places the
CEO at the center and has the business unit leaders formally communicating directly to
41
the CEO. The hub and spoke model limits communication with other senior leadership
peers to informational updates. The second approach to innovation identified by Smith et
al. is a ring-team model. The ring-team model promotes collaboration between business
unit leaders and CEO. The ring-team model facilitates the TMT to make decisions
collectively on resource allocation and trade-offs. The second approach to innovation is
not without its challenges as the ring-team model approach creates a great deal of tension
amongst the TMT members themselves and with the CEO (Smith et al., 2010). The cause
of this tension is the perception that investing in innovation hurts the short-term
performance of some business units as well as the firm as a whole (Smith et al., 2010).
The perceived net result is investing in innovation negatively affects resultant TMT
compensation in the form of bonus incentives at the business unit level and the corporate
level (Smith et al., 2010). Regardless of the innovation approach adopted, Smith et al.
illustrated why TMTs tend to favor short-term financial results rather than invest in
innovation and long-term sustainability.
Smith et al. (2010) asserted that hub-spoke and ring-team models create different
TMT dynamics around innovation. Smith et al. found TMTs speak about long-term
objectives yet TMT behaviors reflect a short-term perspective. The dichotomy TMTs
create when talking long-term yet acting short-term, results in innovation areas not
securing a share of an organization’s capital resources for innovation (Smith et al., 2010).
TMTs push the allocation of capital and key decisions down to business units to fight it
out like feudal territories according to Smith et al. Smith et al. noted that both approaches
create tension among the TMT. Short-term performance suffers by funding innovation
42
and prioritizing TMT compensation and bonus incentives. Alternatively, not funding
innovation may sacrifice long-term performance. Smith et al. suggested that TMTs adopt
the ring-team approach where business unit leaders collectively make decisions on
resource allocation and trade-offs. Smith et al. asserted that TMTs abandon the hub-spoke
approach and adopt the ring-team approach and deliberately hold tension and
accountability within the TMT. Having the TMT take full responsibility for funding
innovation is less likely to result in starving innovation business units of critical resources
(Smith et al., 2010). Smith et al. noted that the two types of business units, innovation
and operational, have distinct purposes, objectives, and culture. Hall (2012) and Morris
(2013) asserted that firms should review their approach to innovation and adopt a
different business model to facilitate innovation apart from business operations. Smith et
al. noted that the role of the CEO is to balance the inconsistency of innovation units and
operational business units by creating different metrics, incentives, and timeframes.
Given the predominant short-term agenda and inability of TMTs to view
innovation in a broader context, Smith et al. (2010) noted that TMTs should replace their
existing hub-spoke approach and adopt the ring-team approach. The rationale for
changing the approach to innovation is the necessity to create a dialog among the TMT
around innovation within a broader strategic context (Smith et al., 2010). The notion of
challenging existing models and creating a different business model to encourage
innovation for economic sustainability is analogous to the research findings presented by
Morris (2013). Morris suggested that the lack of systems thinking dialog was attributable
to the notion that TMTs find it easier and less challenging to focus on individual parts of

43
their business rather than taking a holistic perspective. When viewing only individual
parts of an organization, there is a tendency to regress towards maintaining the status quo
(Morris, 2013). TMTs locked-in mental models are their frame of reference (Morris,
2013) that prevent them from viewing their business from a different perspective and
actively promoting innovation at the business model level. This new perspective requires
the ability to use and apply systems thinking to challenge the entire value chain (Smith et
al., 2010).
Business models for innovation. According to Smith et al. (2010), successful
innovation requires a realignment of specific management models and reporting lines.
The purpose of realigning management models and reporting lines is to foster higher
degrees of cooperation among members of the TMT. Innovation-specific management
models may force cooperation among TMT member and their business units to allocate
resources in an appropriate manner to foster innovation (Smith et al., 2010). Ironically
and unknowingly, the TMTs of many organizations develop and implement policies and
procedures to make their organizations more efficient while stifling innovation (Blank,
2013). Even when the resources available for innovation are enormous, TMTs cannot
seem to develop their business model to facilitate meaningful innovation (Blank, 2013).
The foremost difference between start-ups and larger organizations, according to
Blank (2013), is their business models are different as is their focus. Start-up firms tend
to focus on searching for a repeatable and scalable business model while large companies
tend to concentrate on implementing and executing a repeatable and scalable business
model to gain efficiencies (Blank, 2013). While Sood and Tellis (2011) asserted that new

44
entrants can cause unintentional disruption to markets without insightful market
knowledge or expertise, Blank asserted that the traditional business models of large
organizations could have a detrimental effect on innovation. For example, the traditional
business growth model requires the development of a strategic business plan including
step-by-step implementation of an NPD plan (Blank, 2013). Traditional firms require
NPD plans use a waterfall development approach to build products iteratively.
Traditional firms will hire for traditional experience and the ability to execute.
Operationally, Blank argued that most large companies tend to drive their organizations
by accounting metrics and focus on their income statement and balance sheet. Failure to
be operationally efficient or to follow the step-by-step implementation plan will result in
firing executives (Blank, 2013).
Large firms can learn from lean start-up firms as their approach to strategy
development, and execution tends to be different. Seebode et al. (2012) noted that the
core competencies of incumbents often becomes core rigidities that severely limits their
ability to deal with changing conditions and dynamic markets. Lean start-ups, for
example, tend to develop a hypothesis-driven business model whereby lean start-ups
develop new products for testing by customers (Blank, 2013). Lean start-ups are different
in that they hire personnel for their ability to learn, be nimble, and do not waste time
assigning existing TMT members into roles where they lack innovation skills (Blank,
2013). Lean start-ups base their accounting metrics on customer acquisition costs and
customer lifetime value (Blank, 2013). When a product or model fails, lean start-ups
pivot away from business models that no longer work and move towards testing new

45
models (Blank, 2013) whereas incumbents must unlearn old ways of thinking about their
business before they are open to thinking about innovation and their business differently
(Seebode et al., 2012). Blank (2013) asserted that the critical lesson often lost on TMTs is
as follows. While large companies understand they need to deal with external threats by
continually innovating to ensure their survival and growth, most TMTs fail to realize that
the importance of experimenting is to reinvent new business models. Hess (2012),
Lampikoski et al. (2014), and O’Connor and Rice (2013) suggested that experimentation
runs contrary to maintaining the status quo by allowing feedback, permitting critical
thinking, learning from failure, and observe an organization holistically to challenge the
dominant business model. The central tenant of Blank’s assertion is to develop good
guesses and test their hypothesis with the intent of creating value for themselves and their
customers. Blank noted that testing a hypothesis is about customer development, needs
discovery, and validation. Blank noted that lean start-ups ask potential users, purchasers,
and partners for feedback on all elements of their business model and products. Areas
solicited for feedback include product features, pricing, and channels of distribution
(Blank, 2013). By using customer feedback, agile development works hand-in-hand with
customer development and is unlike the traditional long product development cycles that
large firms use (Blank, 2013). According to Blank, large companies presume they know
their customers’ needs when they do not. Hung-Jung and Hsien (2013) noted that CEOs
should be open to experimentation to garner customer feedback on needs and act to
change the business model. While tempting to rely on current business models and
metrics, Blank argued that TMTs require an understanding of how to affect their

46
company’s business model through rapid innovation rather than rely on otherwise
traditional business models and financial metrics. O’Reilly & Tushman (2013) asserted
that managers are responsible for optimizing the efficiencies of core business units. TMT
are responsible for reshaping their firm’s business model by deliberately creating an
ambidextrous organization by directing and encouraging innovation units to experiment
(O’Reilly & Tushman, 2013). Relying on traditional business models and financial
metrics are innovation killers (Blank, 2013). Blank pointed to large companies, such as
General Electric and Qualcomm, that have adapted lean start-up business model thinking
within certain divisions to foster innovation.
Applying systems thinking to challenge the status quo ensconced in the value
chain. To provide insight into the importance of applying systems thinking to the value
chain, Lu (2013) examined the criteria used to evaluate applicants for the Malcolm
Baldrige National Quality Award (MBNQA). Lu noted the factors behind why Lockheed
Martin Missiles and Fire Control (MFC) won the MBNQA in 2012. While there are
several factors used to evaluate all MBNQA applicants, Lu noted that many organizations
place excessive emphasis on financial gains that leads to shortcuts, sub-standard
workmanship, and disappointing outcomes. Lu noted that the MBNQA applicants that
pursued excellence across their entire value chain tended to achieve superior performance
over the long-term (Lu, 2012). The commitment of the TMT of MBNQA applicants to
support innovation is congruent with other research that asserts that a short-term focus
has specific consequences while a long-term perspective leads to durability and
sustainability. Lu found innovation and the perception of quality were evident in the

47
brand image of the MBNQA applicants as brand image drives brand value and superior
overall performance. Larson et al. (2012) found six distinct differences in attitudinal and
motivational patterns between the CEOs of Baldrige Award recipient organizations and
MBNQA applicant CEOs. Baldrige Award winning CEOs are likely to drive continuous
improvement, be discontent with the status quo, and create tension among the TMT
(Larson et al., 2012). Smith et al. (2010) found new business models such as the ring-
team approach fosters tension among the TMT, can spur discontentment with the status
quo, and can lead to investment in innovation efforts. Larson et al. found the Baldrige
Award winning CEOs are more supportive of continuous learning, sponsor break-through
innovation, and strongly focus on systems thinking to move their organizations forward.
While Larson et al. found CEO motivation and the attitude for change requires the ability
of systems thinking by the CEO, Morris (2013) found true transformative innovation also
requires a change to the business model to develop and implement systematic processes
to facilitate innovation.
Deliberately creating an organizational imbalance to foster innovation. Given
an aversion to uncertainty and the inability to cope with uncertainty, Kaplan (2012)
argued that TMTs tend to articulate significant visions then follow up with detailed
roadmaps and action plans. While roadmaps have their place within the context of
innovation, roadmaps can also hinder innovation. To create and respond to disruptive
innovation, Kaplan asserted that TMTs must recognize that they must proactively create
disruption to avoid a business-as-usual-mentality to settle within their organizations. By
changing the internal business model, deliberate tension within the TMT challenges the
48
lock-in mentality of the status quo (Larson et al., 2012; Smith et al., 2010). By
deliberately creating an imbalance and tension as noted by Latham (2014), innovation is
spurred by disrupting the most fundamental mindsets and behaviors that led to current
successes. Kaplan noted that without the opportunity to experience and subsequently fail,
there is no opportunity to learn, gain new insights, uncover new opportunities, or to
progress forward with any meaningful innovation. Blank (2013) supported Kaplan’s
assertion. Blank found as start-ups test new hypotheses, it provides an opportunity to
learn and alter their business model accordingly. Kaplan noted that the role of the TMT
was not to merely articulate a vision associated with the status quo but rather transform
the organization to one of innovation.
Innovation transformation commences with the CEO creating an imbalance to
experiment proactively with disruptive innovation in response to hyper-competitiveness
(Kaplan, 2012). To transform the direction of an organization, Latham (2014) noted the
importance of leadership skills and approach. While there are many theories and
approaches to leadership including transformational, transactional, stewardship, spiritual,
and Theory X-Y for example, Kamisan and King (2013) found to optimize leadership
effectiveness, CEOs must possess the skills to exhibit and consistently balance both
transformational and transactional leadership styles. While leadership continues to be a
popular research topic, Latham argued that there is not one universal approach that
researchers can agree on that fits all organizations. Cristina (2013) posited innovation
priorities differ between various types of organizations and industries. Therefore,
leadership styles, management structures, business practices, and business models will

49
not be identical across all industries and must be adapted according to their industry
context (Cristina, 2013).
TMT motivation and attitudes affect the culture of innovation. For
organizational change such as innovation initiatives to be successful, Larson et al. (2012)
noted that TMTs and particularly CEOs must exhibit specific motivation and attitudinal
patterns. The key attitudes and motivational patterns at the senior level appear to be
necessary to drive change at all three levels of innovation: incremental, breakthrough, and
business model innovation (Larson et al., 2012). This change in motivation and attitude
often requires the ability to grasp systems thinking. Morris (2013) asserted that genuine
transformative innovation requires systems thinking with the intent of challenging and
changing existing business models to develop and implement systematic processes and
integration. While Parker et al. (2012) focused on highlighting desirable personality traits
drawn from the antithesis of Theory X leadership to encourage innovation, anosognosic
and inept managers can directly and significantly harm an organization’s ability to
innovate and change (Parker et al., 2012).
To transform organizational culture to one of innovation, TMTs must create trust
by exhibiting traits such as warmth and approachability (Parker et al., 2012). Without
establishing trust, even the most competent TMTs are unlikely to successfully prompt
their organization to adopt new business models and foster a culture of innovation. CEO
motivation and attitudes must go beyond the leadership theory models or the typical
personality traits that Parker et al. put forward. Larson et al. (2012) noted that while
50
personality traits are typically genetic, learning, altering, and adjusting motivation and
attitudinal patterns is possible and specific to the context.
By comparing and contrasting the differences in motivation and attitudinal
patterns between the CEOs of Baldrige Award recipients’ organizations and non-Baldrige
recipients, several differentiating motivation and attitudinal patterns emerged (Larson et
al., 2012). There are several distinctions in motivation and attitudinal patterns between
Baldrige, and non-Baldrige recipients including possessing a dissatisfaction with the
organizational status quo, the need to learn continuously from experience and understand
future trends, a desire to drive cultural change and evolve the organization, and a desire
to create deliberate tension among TMT members. Larson et al. (2012) posited
motivation and attitudinal patterns of Baldrige Award winning CEOs includes a desire to
pursue growth opportunities beyond the typical 3% to 5% that continuous improvement
might produce by setting aggressive growth targets of 20%. To achieve aggressive
growth, Baldrige Award winning CEOs sponsor breakthrough innovation projects, and
engage in systems thinking to align functions, policies, and processes with strategies to
drive change and deviate from the status quo (Larson et al., 2012). Motivation and
attitudinal patterns of Baldrige Award winning CEOs include the desire to elevate team
orientation and employee engagement, diminish self-orientation to foster collaboration,
use facts and a comprehensive scorecard to benchmark, and actively experiment, test, and
trial proposed new products and services to garner feedback from customers. Baldrige
Award winning CEOs also engage external stakeholders to ensure that TMTs understand
environmental ethics and the need for sustainability (Larson et al., 2012).

51
With the potential for TMTs to do damage to their organizations (Brookmire,
2012), Hill, Brandeau, Sal, and Lineback (2014) suggested that a deliberate innovation
agenda must be driven by CEO motivation and attitudes to set the priorities for the
organization. CEO support for innovation is likely to have a positive effect on the success
of organizational transformation initiatives (Larson, 2012). Bhattacharyya (2006) asserted
that several positive traits such as visionary leadership help inspire and motivate the
organization and are essential to encourage innovation. Negative traits associated with
transactional leadership, however, tended to derail innovation efforts (Bhattacharyya,
2006).
TMT self-interest inhibits innovation. Apart from TMTs having a locked-in
mindset that impedes their understanding of innovation on its various levels, Xu and Yan
(2014) suggested that a lack of investment in R&D may starve radical or incremental
innovation. Starving innovation may be attributable to other priorities set out by TMTs.
Short-horizon CEOs tend to make managerial decisions that enhance short-term firm
performance at the expense of long-term firm value given there are self-serving
incentives for this seemingly managerial myopia. Managerial myopic behaviors are
evident in other variables such as the small number of patent applications, Tobin’s Q
comparisons, R&D budgets, and other metrics (Xu & Yan, 2014). Xu and Yan found
retiring CEOs often have a personal interest to increase short-term earnings to boost
pension contributions and performance incentives by supporting incremental and safe
innovation initiatives. Xu and Yan found CEO self-interest is evident by their effort to
maximize retirement payouts and why some companies do not invest in radical

52
innovation. Instead, the self-interest of such CEOs favors investment in incremental
innovation. Schoemaker et al. (2013) asserted that some stakeholders have long-term
organizational goals while others fixate on short-term objectives. According to Latham
(2014), balancing various competing interests among stakeholders is essential to effective
leadership. While a locked-in mindset or the lack of skill within the C-suite may
contribute to the innovation gap, a short-term focus is detrimental to innovation efforts
(Hess, 2012). As CEOs approach retirement, the number of patent applications also
tended to decline. Xu and Yan found retiring CEOs with vested in-the-money options
holdings preferred to support safe, incremental innovation by making choices that would
reduce their personal risk exposure at the expensive of long-term firm growth.
Sonnenfeld et al. (2013) asserted that the role of boards is not to maintain the status quo
and avoid risk and but to push the CEO to plan beyond the next quarter’s earnings and
think long-term. When independent directors had high stock ownership and the best
interest of shareholders in mind, they tended to not only sanction incremental innovation
but to fund radical innovation understanding that radical innovation is required to secure
long-term performance (Xu & Yan, 2014). CEOs may deliberately create the innovation
gap when CEOs limit investment to incremental innovation efforts rather than radical
innovation efforts as CEO self-interest is to maximize performance bonus and retirement
benefits (Xu & Yan, 2014). Xu and Yan’s findings support Dover and Dierk’s (2009)
assertion that the composition of TMTs are typically risk adverse managers who exhibit a
preference for focusing on short-term goals at the expense of long-term planning.
53
Directors influence the innovation horizon. Related to self-serving members of
the TMT, Boyd, Haynes, and Zona (2011) looked at CEO-board relations to determine
whether duality affects financial performance. Boyd et al. noted that despite inter-firm
ties, board members and TMTs may have social links. The duality between TMT and
boards tended to be a nonfactor in corporate performance. Nevertheless, Boyd et al.
found a clear difference in time orientation specifically between Western and Eastern
cultures. Specifically, cultural values, norms, behaviors, and attitudes for Asian-based
firms tended to have a longer-term orientation consisting of a ten-year horizon. Western
firms, however, tend to focus on short-term profitability in one-year increments. To
address the difference in time orientation, Sonnenfeld et al. (2013) noted that Western
boards should recognize the preoccupation with short-term objectives and intervene by
conveying a longer-term perspective on shareholder value to all shareholders. In doing
so, Sonnenfeld et al. suggested that boards push their CEOs and themselves to plan
beyond the next quarterly or yearly earnings. Prudent oversight, support for risk-taking,
encouragement, and wise counsel is what most CEOs expect from their boards. However,
Sonnenfeld et al. asserted that many boards do not have the courage for the level of risk-
taking required for long-term sustainability and related innovation investments. Instead,
boards and CEOs tend to engage in adversarial posturing to ensure short-term priorities
prevail (Sonnenfeld et al., 2013).
CEO organizational fit contributes to cultural change. CEO fit within an
organization is a major factor in leading organizational change (Blettner, Chaddad, &
Bettis, 2012). Blettner et al. found CEOs can elect to preserve the status quo or act as

54
agents of change and challenge the existing mindset of the TMT. CEO fit may be
appropriate or not suitable for the firm at any particular point in time given several
factors (Blettner et al., 2012). Fit factors include internal strengths and weaknesses,
environmental dynamics, market opportunities, and threats may present at a particular
point in time requiring appropriate responses (Blettner et al., 2012). CEO priorities,
shared values that focus on long-term objectives, and clear rules of engagement to
support innovation efforts are considerations for effective CEO fit (Hill et al., 2014).
Blettner et al. noted a distinction between internal and external fit CEOs and the effect on
innovation. Blettner et al. found CEOs who have high levels of internal fit may find it
difficult to take the necessary actions that are necessary to respond to dynamic external
challenges. Loose fit CEOs implied they had more freedom of action to respond to the
challenges of changing current approaches and strategies. Blettner et al. noted that loose
fit CEOs were readily prepared to make changes to address the experience deficiencies
within the TMT, and to realign organizational priorities to address a lack of R&D
experience to foster higher levels of innovation efforts. In other words, the quality and
experience of TMTs have a direct effect on innovation priorities and efforts. Changes to
the experience and composition of the TMT may require hiring outsiders who have a
loose-fit (Yuan et al., 2014). CEOs with a high level of internal fit tend to retain the status
quo about innovation efforts and may show a reluctance to alter organizational priorities
and culture (Blettner et al., 2012; Yuan et al., 2014). High fit CEOs are reluctant to
execute transformational change needed to foster a culture of innovation (Blettner et al.,
2012).

55
Organizational enablers facilitate a culture of innovation prioritization.
Legrand and Weiss (2011) put forward a model of enablers that senior leadership teams
and specifically CEOs should consider implementing to address the innovation gap
within their organization. The enablers suggested by Legrand and Weiss included the
need for TMTs to lead by example and make innovation an organizational priority. This
assertion is consistent with the discussion on the role that TMTs and specifically CEOs
should play in developing a culture of innovation. Legrand and Weiss asserted that in
making innovation an organization priority, the CEO must lead by example. TMTs must
commit resources to foster innovative thinking, encourage organizational learning, and
make changes to TMT composition and acquire new talent with needed skills to address
the deficiency of experience. To foster innovation and organizational thinking, TMTs
will need to create and implement a top-down culture of systematic innovation to ensure
that everyone understands the corporate direction (Legrand & Weiss, 2011). Achieving a
culture of systematic innovation is possible by creating cross-functional teams that have
the ability, tolerance, and backing of the TMT to take risks associated with delivering
value throughout the value chain (Legrand & Weiss, 2011). Legrand and Weiss suggested
that TMTs implement a formal top-down innovation plan. Implementing a formal
innovation plan ensures that the entire senior leadership team has a thorough
understanding that innovation resources are not to be cut even when quarterly results may
not be stellar.
An example of the important role CEOs play in setting innovation priorities is
provided by Miller (2012). Miller noted that when Apple was once a struggling company,
56
Steve Jobs stated that the way out of their difficulties was not to cut NPD R&D costs.
The mandate from Jobs was for Apple to innovate its way out of their predicament.
Investment in innovation and the cognizance to align various parts of the organization is,
therefore, essential to foster innovation (Legrand & Weiss, 2011).
Organizational alignment. Cultural transformational efforts require the alignment
of organizational resources to foster innovation (Kahn, Barczak, Nicholas, Ledwith, &
Perks, 2012). Aligning departments such as marketing, human resources (HR), R&D, and
information technology (IT) enables cross-functional innovation projects (Hall, 2012;
Hess, 2012; Holland & Weathers, 2013). The HR department must work with the CEO
and make the correct hires at the TMT level to address the TMT organizational
experience deficiencies (Kahn et al., 2012). HR must align TMT incentives to promote
rather than penalize innovation (Kahn et al., 2012). An NPD strategy best practice
identified by Kahn et al. (2012) requires the innovation strategy and the overall corporate
strategy and mission be aligned. Kahn et al. noted that aligning innovation strategy with
corporate strategy must touch the entire organization, be highly visible, and promote a
long-term perspective. To align innovation efforts with the strategic plan and support
meaningful innovation, the plan should be flexible, not to thwart innovation through
rigidity, engage cross-organizational groups, establish clear go or no-go criteria, and
provide funding for the NPD process (Kahn et al., 2012).
Role of creativity in innovation. Whether product innovation is incremental or
radical, product design affects consumer perception (Mugge & Dahl, 2013). Specifically,
there is a learning cost associated with becoming familiar with a new product or service

57
to realize its benefits. This interaction potentially affects a brand and the economic
sustainability of a company. A poorly chosen product design and introduction strategy
can have an adverse effect on the short-term financial results and negatively affect the
sustainability of the brand over the long-term (Mugge & Dahl, 2013). Remarkably, many
organizations tend to compete with their competitors on replication and price rather than
on adding value to the products and services they provide (Hunter, 2012). While first
mover advantage and lower pricing strategies are motivating factors that spur innovation
and NPD activities, organizations often overlook creativity and design when innovating.
Often misunderstood is that creativity is an essential ingredient behind innovation,
not the need or the trigger to fill the gap by using some predetermined formula or through
replication (Hunter, 2012). Hunter (2012) asserted that there is no such thing as a lock-in
success formula, but the use of creativity creates the opportunity to recognize needs and
fill the innovation gap. Placing more value and emphasis on creativity skills will help
organizations develop alternative business models rather than continue to cling to
traditional business models (Hunter, 2012). Without innovation, both start-up companies,
and large firms are unlikely to be sustainable (Hunter, 2012). Heij et al. (2014) asserted
that business model replication focuses on the reduction of transaction costs, operational
efficiencies, economies of scales, and growing revenue. Business model renewal requires
innovation and creativity and contributes to overall firm performance specifically in
dynamic market environments.
Closing the innovation gap requires innovative thinking (Legrand & Weiss,
2011). Enhancing consumer appreciation of radical innovations requires that firms find a
58
way to ensure a positive response by consumers to radical innovations. Positive consumer
response to radical innovations is possible by highlighting the new benefits through
imagination-focused visualization (Mugge & Dahl, 2013). While Boyd et al. (2011) and
Sonnenfeld et al. (2013) found the TMTs of Western firms may not inadvertently but
deliberately starve transformational innovation through self-interest and short-term
perspective, their findings did not explain why many Eastern firms also struggle with
innovation given their long-term perspective. Instead, Eastern firms tend to focus on
creative adaptation (Abrami, Kirby, & McFarland, 2014).
Innovative thinking is different from analytical thinking and should not be
confused with creativity (Legrand & Weiss, 2011). Using creativity can help develop new
ideas that may or may not be relevant or implementable. Innovative thinking requires
small teams to deliberately work hard to develop products and services to define and
create value for an organization (Legrand & Weiss, 2011). Misinterpreting creativity or
absolute innovation as creative adaptation can create confusion in the context of
creativity or innovation (Abrami et al., 2014). While creative adaptation can also provide
value to an organization, noting the distinction between creative adaptation and absolute
innovation requires consideration. Creative adaptation is the modification of existing
technology, but it is not absolute innovation (Abrami et al., 2014). The best example of
creative adaptation is China where absolute innovation is severely limited (Abrami et al.,
2014). Creative adaptation stems from the political structure that emphasizes rote
learning in universities, the lack of respect for intellectual property rights, and the
preference to buy companies through foreign acquisition rather than pay licensing fees

59
(Abrami et al., 2014). The results show that despite the fact that China has spent the last
forty years mandating innovation from the top of its political hierarchy and by erecting
trade barriers and foreign ownership restrictions, China has effectively created an insular
market where creative adaptation thrives but absolute innovation does not (Abrami et al.,
2014). While creative adaptation may create some short-term value for state-run
organizations, at best creative adaptation is similar to incremental innovation. Without
the state insulating its domestic market, sustainability of many state-run companies is
unlikely. Abrami et al. (2014) questioned whether absolute innovation is overvalued.
Abrami et al. argued that as a precondition of innovation to pursue ideas, freedom of
minds and markets is a prerequisite. To illustrate the lack of true innovation within
Chinese companies, Abrami et al. noted that the Global Innovation 1000 Study lists only
a handful of Chinese-based brands.
Role of strategic planning in innovation. To establish the role that leadership
behaviors have on innovation performance, understanding the role of strategic planning
in the innovation process requires consideration. Song, Im, Bij, and Song (2011) asserted
that strategic planning is more effective in increasing the number of NPD projects in
larger firms than in smaller firms. Song et al.’s findings are contrary to the finding of
other researchers (Abril & Martos-Partal, 2013; Carayannopoulos, 2009; Tung, 2012).
Song et al. found the TMTs of smaller firms are quicker at exploiting opportunities as the
TMTs of smaller firms tend to not possess locked-in mindsets and a propensity to
preserve the status quo. Song et al. noted that TMTs of larger firms have sufficient R&D
resources they can mobilize to undertake innovation and NPD activities. Large firms with
60
high levels of R&D intensity and resources can overcome the adverse effects of formal
strategic planning on the number of NPD projects (Song et al., 2011). Allocating and
deploying a firm’s resources for NPD activities signals the high priority and importance
of NPD activities within the firm.
A significant finding was that the number of NPD projects initiated also enhanced
return on investment and overall firm performance despite the adverse relationship
between strategic planning and the number of NPD projects (Song et al., 2011). Formal
strategic planning was more effective at spurring the number of NPD projects due to
sufficient resources than were smaller firms (Song et al., 2011). While there is an inverse
relationship between the effectiveness of formal strategic planning and firm size and an
inverse relationship between R&D intensity and formal strategic planning, R&D intensity
has a significant positive effect on the number of NPD projects (Song et al., 2011). Large
firms may have an advantage over smaller firms given the resources available to increase
the number of R&D projects. Larger firms can generate more R&D projects than smaller
firms using formal strategic planning as more resources are available (Song et al., 2011).
Hoonsopon and Ruenrom (2012) found centralization has a positive influence on
incremental product innovation. Formalization also has a partial relationship with
incremental product innovation (Hoonsopon & Ruenrom, 2012). However, senior leaders
must signal the importance of R&D as a priority given its link to firm performance (Song
et al., 2011), its positive effect on marketing performance and subsequent market
performance (Hoonsopon & Ruenrom, 2012). While meaningful innovation may enhance
customer loyalty, innovation efforts that fail to provide meaningful improvements or

61
meet specific customer needs can negatively affect customer loyalty (Stock & Zacharias,
2013).
Transformational innovation moves from earning to learning to earning. To
succeed at innovation and yield results, the challenge TMTs face according to Nagji and
Tuff (2012) is that most senior leadership teams do not understand or deny that
transformational innovation is necessary. Undertaking transformational innovation
requires companies to rethink and do things differently throughout their value chain
(Nagji & Tuff, 2012). Most companies rely on existing personnel and existing analytical
skills to look at existing markets and customer data that may be appropriate for core and
adjacent innovation initiatives (Nagji & Tuff, 2012). TMTs that understand they need to
do things differently will make an effort to shift their thinking and priorities from earning
to learning (Blank, 2013; Nagji & Tuff, 2012). An essential element of this shift from
earning to learning is simply gaining and acting on feedback from existing and potential
customers (Blank, 2013; Nagji & Tuff, 2012). To enhance learning, TMTs tend to focus
on five important areas to enhance the results of their transformational innovation efforts
including hiring for different skills, integrating new skills into initiatives, providing
adequate R&D funding, using pipeline management, and adopting specific innovation
metrics (Nagji & Tuff, 2012). Nagji and Tuff noted that TMTs must clearly communicate
their innovation goals, identify the processes that the organizing will fund, and
subsequently act to orchestrate innovation effects as a coordinated portfolio. Nagji and
Tuff’s proposed approach is complementary to Smith et al.’s (2010) assertion that the
current business model of organizations needs to change by adopting a ring-team model.
62
The change in model helps to better manage and fund innovation more effectively and
address the innovation gap. The findings of Kahn et al. (2012) and Morgan (2014) also
support Nagji and Tuff’s findings. Kahn et al. and Morgan found NPD metrics must be
very different from ongoing operational process metrics and instead focus on driving and
providing support for the desired innovation behaviors.
Chang et al. (2014) found TMTs must change the way they view and approach
innovation within their business. To change how TMTs approach innovation, Chang et al.
suggested the need for organizations to employ looped-back learning. For organizations
to develop an environment of learning, Chang et al. noted that firms must continually
study and adapt to their ever-changing environments and act on this input. Chang et al.
argued that the future success of firms to innovate is a function of double-loop learning.
They found double-loop learning helps to provide valuable feedback to change TMT
actions and expected outcomes. Double-loop learning may challenge the TMT’s locked-
in mindset, its underlying values, assumptions, and goals. Double-loop learning involves
explorative, generative learning, and exploitative, adaptive learning to generate
knowledge around deficiencies (Chang et al., 2014). Once TMTs identify deficiencies,
TMTs can leverage the gaps to make fundamental changes in marketing mixes (Chang et
al., 2014). Such changes could lead to enhancing radical innovation efforts (Chang et al.,
2014). Chang et al. argued that conducting incremental and radical innovation
simultaneously helps to maximize exploitation that can also fund the exploration of future
opportunities. This assertion around ambidexterity made by Chang et al. is consistent
with Dierk and Dover’s (2012) findings. Chang et al. noted that a strategy of

63
ambidexterity can foster financial performance in the short-term while funding radical
innovation for long-term economic sustainability. While some firms are capable of
implementing both types of innovation simultaneously, other firms seem to survive with
little innovation or limited looped learning (Chang et al., 2014).
Lampikoski et al. (2014) asserted that TMTs believe that if their organizations
greenwashed only 1% of their products, this approach to innovation would be sufficient.
The view by TMTs that embrace greenwashing is simply to create the perception of being
an innovative and responsible corporate citizen in the marketplace (Olsen, Slotegraaf, &
Chandukala, 2014). Seebode et al. (2012) noted that Philips is an example of a firm that
has gone beyond simply greening their operations by deliberately seeking to create
radical products. Philips changed their manufacturing processes through intensive
innovation. Philips’ TMT reframed their business strategy towards sustainability-led
innovation and encouraged transformation innovation beyond incremental adjustments
(Seebode et al., 2012). Often the core competencies of incumbent firms become core
rigidities that severely limit the ability of the TMT to deal with changing conditions and
dynamic markets (Seebode et al., 2012). Incumbents must unlearn old ways of thinking
about their business before they are open to thinking about innovation differently
(Seebode et al., 2012). Seebode et al. found Philips’ TMT had a clear understanding that
they needed to embrace transformational innovation and become ambidextrous. In other
words, Philips’ TMT realized they needed to exploit the present opportunities
deliberately while simultaneously exploring future opportunities to become economically
sustainable. Seebode et al. noted that Philips’ TMT realized the need to address long-term

64
sustainability and set clear innovation targets around sustainability along with new
financial metrics. The alignment of corporate and innovation strategy illustrates that
Philips’ TMT understood that ambidexterity requires balancing both incremental and
radical innovation, and that transformational innovation is linked to economic
performance (Seebode et al., 2012).
Innovation portfolio management. When attempting to manage innovation, Kahn
et al. (2012) found TMTs think they may not have a grasp on all dispersed NPD
initiatives because they feel that innovation is often haphazard and episodic. TMTs
suspect that the returns on the company’s total innovation investment are low (Nagji &
Tuff, 2012) particularly when not managing initiatives as a portfolio. Nagji and Tuff
(2012) noted that the tendency is for TMTs to react and drastically intervene to
understand what R&D initiatives are underway. In the absence of a structured portfolio
management process, vacillating strategies only make matters worse as the senior
leadership team often responds by instructing R&D teams to proliferate their existing
products into variants (Nagji & Tuff, 2012). Proliferating existing products into variants
only serves to split the revenue pie into even smaller slices without actually growing the
overall business (Nagji & Tuff, 2012).
To structure innovation initiatives within a portfolio, Kahn et al. (2012) and
Morgan (2014) suggested that NPD metrics and the management process must be very
different from ongoing operational process metrics. Different metrics and processes are
required to drive the desired innovation behaviors throughout an organization (Nagji &
Tuff, 2012). Managing a total innovation portfolio requires constructing a portfolio that

65
produces the highest overall returns and requires allocating funds among growth
initiatives rather than funding a collection of ad hoc standalone efforts (Nagji & Tuff,
2012). Nagji and Tuff found some firms could change their cultures to one of innovation
by managing innovation as part of a larger strategic portfolio.
Implementing balanced scorecard metrics to encourage innovation. The
example of Philips’ innovation process illustrates that their TMT was not afraid to alter
Philips’ business model and metrics (Arnold & Hockerts, 2011). Arnold and Hockerts
(2011) found innovation metrics can change behaviors when aligned with a longer-term
organizational strategy. Arnold and Hockerts noted that by Philips’ TMT utilizing an
organizational-wide approach to innovation and establishing specific innovation metrics,
the result was the occurrence of a change to Philip’s organizational culture. As Philips
repositioned new products by rationalizing labels and promoting environmental
sustainability, Philips’ TMT was attempting to strike a balance between short-term issues
and long-term market opportunities. TMTs that understand innovators tend to adopt a
different mindset about costs and metrics (Reeves, Haanaes, Love, & Levin, 2012).
Reeves et al. found innovators should take a holistic, systems thinking approach to gain
overall efficiencies rather than rely on the conventional approach of focusing on reducing
individual component costs.
Firms committed to realizing the benefits of innovation and sustainability efforts
developed and implemented a balanced scorecard with nonfinancial metrics including
environmental and social efforts (Reeves et al., 2012). Reeves et al. (2012) found tying
the compensation of executives, managers, and employees to a triple-bottom-line
66
accounting system incentivize and accelerates growth and earnings before interest, taxes,
and depreciation (EBITDA), rather than impeding growth and earnings. Reeves et al.
posited many TMTs fail to understand the need to become more innovative in their
thinking. TMTs will typically dismiss a possible link between innovation, sustainability,
and financial performance. While Philips’ innovation process may not be implementable
by firms in other industries without adaptation, adaptation alone may not be sufficient to
address TMTs who desire to maintain the status quo (Arnold & Hockerts, 2011).
Internationalization requires added innovation effort. A factor for consideration
is the effect of internationalization on R&D and sustainability. Chakrabarty and Wang
(2012) found R&D and internationalization must converge together for firms to move
from a mindset of market development to one of embracing a longer-term perspective.
Internationalization and R&D intensity ideally should complement each other within an
innovation portfolio rather than be undertaken as unique practices (Chakrabarty & Wang,
2012). When multinational corporations’ (MNCs) internationalization exceeds its R&D
capabilities, an increase in the level of innovation and R&D is typically a requirement to
catch up. When internationalization is low, the level of innovation tends to be constrained
by its domestic market limitations. As international exposure increases, TMTs must
address their innovation efforts in a broader global context (Chakrabarty & Wang, 2012).
Chakrabarty and Wang noted that when internationalization and investment in innovation
are low, sustainability practices are likely to decline thereby affecting ambidexterity
though the self-sabotaging efforts of TMTs. Slotegraaf (2012) supported Chakrabarty and
Wang’s notion and found firms operating in international markets exhibit a wide variance
67
in environmentally sustainable innovation efforts. In other words, some innovation efforts
have sustainability as a goal while others do not and resist pressure from governments to
address environmental sustainability. Chakrabarty and Wang suggested that the lack of a
global orientation is a possible reason for the emergence of an innovation gap and
inability to achieve sustainability within some organizations. However, Slotegraaf
asserted that innovation efforts must address sustainability as a component of product and
process design. Slotegraaf noted that innovation efforts are often incremental and
insignificant. Partnering along a global value chain may provide access to expertise and
specific knowledge in areas such as packaging or environmental technologies to help
firms alter their thinking and catch up (Slotegraaf, 2012).
Developing an innovation portfolio to gain NDP R&D efficiencies. To
successfully develop and balance an innovation portfolio designed to address dynamic
markets associated with internationalization, TMTs must have proprietary insight into
several areas (Nagji & Tuff, 2012). Several areas that TMTs must have insight into
include an organizational understanding of customer needs, trends, market structure,
competitive dynamics, technology trends, demand requirements, and other market
variables (Nagji & Tuff, 2012). Concerning the overall strategy of firms to innovate,
Nagji and Tuff found there is an optimal mix for investing in core, transformation, and
adjacent innovation to yield the best return on investment. Typically striking the right
balance to optimize the return on investment requires an allocation mix of 70% in core
innovation initiatives, 20% in adjacent initiatives, and 10% in transformational initiatives
(Nagji & Tuff, 2012). This proposed mix tends to outperform their peers with a price-to-
68
earnings ratio (P/E) premium of between 10% and 20% (Nagji & Tuff, 2012). The
proposed innovation investment allocation of 70% –20%–10% balance typically yields a
return on investment of 10% for core initiatives, 20% for adjacent innovation initiatives,
and 70% for transformational initiatives (Nagji & Tuff, 2012). Nagji and Tuff (2012)
underscored the importance of managing innovation initiatives as a portfolio. Given that
a heavy orientation towards core innovation may be appropriate for certain industries,
many firms tend to ignore or avoid investing in transformational innovation initiatives
when they should be investing in transformational innovation within their industry.
Investing in transformational innovation initiatives is often the engine of future growth,
but is an area that TMTs most often ignore (Nagji & Tuff, 2012).
While Nagji and Tuff (2012) recommended an allocation mix 70%-20%-10% as
an average, there are optimal investment mixes for different industries as different
ambitions drive the various sectors. For example, Nagji and Tuff found consumer goods
companies should allocate innovation investments based on a formula of 80% to core
initiatives, 18% to adjacent innovations, and 2% to transformational innovations.
Industrial companies should allocate 70% to core, 20% to adjacent and 10% to
transformational innovations while a mid-stage technology firm should allocate only 45%
to core initiatives, 40% to adjacent innovation initiatives, and 15% to transformational
initiatives. For mid-stage technology firms that may not have much of a core business to
build on, Nagji and Tuff noted a disproportional investment in transformational and
adjacent innovation technologies is appropriate. Kahn et al. (2012) supported Nagji and
Tuff’s notion of managing innovation as a portfolio. Some firms are unable to innovate

69
successfully because TMTs do not establish a clear NPD process for managing
innovation as a portfolio (Kahn et al., 2012). Instead of managing innovation efforts as a
portfolio, some firms support pet products, focus on short-term projects, fail to align NPD
with the organizational mission, fail to establish appropriate NPD-specific metrics (Kahn
et al., 2012), and fail to create a corporate climate of innovation (Kahn et al., 2012;
Larson et al., 2012; Lu, 2013). While most companies attempting to enter new businesses
have a 99% failure rate, senior leadership teams should develop a process for managing
innovation efforts as a portfolio and arrive at a specific ratio that they believe will deliver
an optimal ROI of future revenue growth and market capitalization (Nagji & Tuff, 2012).
The challenge to accepting the notion of using a strategic NPD portfolio strategy to
manage innovation initiatives requires TMTs address the issue of corporate culture and
transformation on several levels (Kahn et al., 2012; Larson et al., 2012; Lu, 2013).
Firm size agility and innovation. Firm size may also be a factor that has an affect
on innovation. Carayannopoulos (2009) developed a model to compare the differences
between large firms and small firms who innovate and commercialize disruptive
technologies. Carayannopoulos found while larger firms had more resources available to
innovate, smaller firms were often able to modify their activities due to a lack of
ingrained routines or locked-in mindset often found within the TMTs of larger firms.
Füller (2014) found smaller firms often possess agility and can innovate rapidly by
developing online communities to collaborate with and create innovative technologies to
fill gaps. Carayannopoulos found small firms were more agile than large incumbents and
were more likely to modify their activities given their lack of ingrained routines and

70
locked-in mindset. This finding is significant given that young technology firms can use
their agility to innovate and stay ahead of the incumbents. Smaller firms have the
intention of gaining first mover advantage and higher margins, as noted by Tung (2012)
and Abril and Martos-Partal (2013), through differentiation. Larger firms tend to want to
achieve legitimacy through isomorphism (Carayannopoulos, 2009). The fact remains,
however, that in some smaller firms and communities, innovation occurs based on the
perceived necessity to fill the gaps that larger firms in some industries have not yet
fulfilled (Füller, 2014).
Some of these communities comprised of smaller firms have also created brands
for new innovative products they have developed including Firefox, Apache, and Linus
(Füller, 2014). These community-based brands have evolved somewhat accidentally as
mere byproducts of community interactions (Füller, 2014). Often smaller firms and
communities innovate successfully through collaboration because they are unencumbered
by the rigid structure that stifles innovation within larger firms (Füller, 2014). Füller
(2014) noted that corporate decisions made by the TMTs of larger firms tend to develop
incremental products and brands that do not entirely meet the needs of their customers or
fill a void in the market. Füller’s findings also support the findings of Nagji and Tuff
(2012) who noted that the TMTs of large firms tended to avoid transformational
innovation due to the short-term orientation of the leadership team.
Innovation provides low probably results. To address the innovation gap and
locked-in mindset that inhibits innovation as elucidated elsewhere, Hess (2012) noted that
innovation initiatives tend to underperform because leaders fail to confront internal
71
obstacles to innovation. Hess suggested that organizations must develop a parallel system
to promote innovation. Hess’ notion that meaningful innovation is counter to senior
business leaders’ and capital markets’ short-term focus is consistent with the findings of
Boyd et al. (2011), and Sonnenfeld et al. (2013). The challenge is that TMTs must
recognize that innovation is a low probability process much like blackjack players do not
expect to win every hand (Hess, 2012). Venture capitalists realize that if 10% of their
investments are big winners and 20% are perhaps small hits, the investment strategy is
successful (Hess, 2012). Venture capitalists recognize that the other 70% are important
failures as such failure contributes to learning what works (Hess, 2012). The
opportunities that typically are more attractive to venture capitalists focus on disruptive
innovation, not incremental innovation (Morgan, 2014). The critical decision factors
venture capital firms use to judge a firm’s ability to innovate include potential market
size, senior leadership team integrity, and the ability to turn creative ideas into working
prototypes for testing and evaluation with prospective customers (Morgan, 2014).
Venture capitalists look for further refinement as part of the commercialization process
(Morgan, 2014) so that products are scalable (Blank, 2013) and likely to affect existing
business models (Morgan, 2014). Morgan (2014) asserted that additional key decision
factors venture capital firms use to judge a firm’s ability to innovate include the
persistence to learn from mistakes and keep moving forward. The likelihood that
commercialization will result in profitability over the longer term is a critical decision
factor (Morgan, 2014).
72
Innovation requires collaboration from a wider network of talent. Many firms
attempt to undertake innovation in-house without utilizing sufficient or appropriate
resources, or they fail to solicit feedback from a larger network regarding
commercialization (Partanen, Chetty, & Rajala, 2014). Slotegraaf (2012) found
innovation is a collaborative process. Collaboration on innovation should include
soliciting input from open innovation sources, experts, and consumers to incorporate new
knowledge into a firms’ innovation process where they may not have in-house expertise
(Slotegraaf, 2012). Morgan (2014) noted that successful innovators require the
development of an extended network to provide input into the commercialization process.
Such a network is typically comprised of universities, research institutes, suppliers,
customers, distributors, and agents (Partanen et al., 2014). Fostering collaboration may
include holding design competitions that involve consumers in an innovation initiative.
Partanen et al. (2014) suggested that firms need to be open and honest about prototyping
their products. Providing prototypes to customers facilitates customer feedback to
determine whether the prototypes work or require modification as part of the
commercialization process (Partanen et al., 2014).
Firms that engaged in a large number of alliances increased the persistence of
superior performance and decreased the persistence of the inferior performance
(Lazzarini, Brito, & Chaddad, 2013). Lazzarini et al. (2013) noted that alliances can be
beneficial for firms that enjoyed a competitive advantage and superior performance.
Alliances were even more critical for firms that were facing some competitive
disadvantage or subpar performance (Lazzarini et al., 2013). For firms with a competitive

73
disadvantage, the benefits of alliances may include improved access to valuable resources
held by other firms that allow them to leave their position of disadvantage (Lazzarini et
al., 2013). While interfirm alliances confirm the link between and financial performance
above the norm, Lazzarini et al. could not confirm the link between interfirm alliances
and innovation. Slotegraaf (2012) provided a different perspective. Slotegraaf found
partnering in a value chain potentially enhances a firm’s innovation capabilities in a
global context. Li, Qian, and Qian (2014) supported the use of international strategic
alliances (ISAs) as ISAs can moderate the negative relationship between the
inconsistencies of product strategies across countries and firm performance. Utilizing
ISAs may be helpful when firms use foreign partners to adapt and implement various
products strategies to fit individual markets on behalf of the focal firm (Li et al., 2014).
Lazzarini et al. noted that there is little evidence to show an association of extensive
partnering or alliances with superior performance in all industries. The industry and the
nature and context of alliances must be a consideration in the context of actual benefits as
different industries such as high tech may require alternative approaches to ISAs than
other industries.
Separate innovation division. The notion of structuring a separate division also
provides the requisite resources and distance needed to create future value through radical
innovation. Bhattacharyya (2006) found generating meaningful innovation requires the
development and implementation of policies and practices that establish a separate
innovation entity. A separate innovation entity requires dedicated resources and the
appropriate talent to focus on innovation within the organization’s area of business
74
expertise (Bhattacharyya, 2006; Hess, 2012). To spur innovation, Morgan (2014)
suggested that an incubator model separate from the primary business operations is more
appropriate for large companies. A separate incubator model requires separate funding,
resources, and appropriate metrics (Morgan, 2014). Establishing an innovation incubator
to spur innovation requires embracing a long-term focus and adequately funding R&D
efforts that operate independently from existing operational processes and metrics
(Morgan, 2014). Bhattacharyya suggested that after establishing a separate innovation
department, TMTs must trust the ability of the innovation team to deliver the vision
rather than meddle in the innovation process. As a caveat to the findings of
Bhattacharyya, and of Morgan, Hoonsopon and Ruenrom (2012) found securing the
support of TMTs does not positively correlate with incremental product innovation.
Incremental improvements or further development of existing products may not always
require the support of the TMT and the allocation of additional resources. However,
radical innovation requires the support of TMT but too much control or formalization of
the innovation effort by the TMT decreases the success of radical product innovation
(Hoonsopon & Ruenrom, 2012). Hoonsopon and Ruenrom found, while incremental
product innovation can increase the marketing performance for firms, radical innovation
does so as well. Hoonsopon and Ruenrom found market performance attributable to
innovation had a positive correlation to financial performance.
An example of radical innovation by one of the oldest brand-driven firms is that
of Nestlé’s use of digital technology on a global scale. Blackshaw (2014) found to
facilitate innovation and its potential effect on the brand, Nestlé established an innovation
75
outpost. Nestlé’s innovation outpost allowed it to create a digital acceleration team
(DAT) at its head office in Switzerland that was responsible for adapting and adopting
the latest digital technology developed in Silicon Valley. The DAT partnered with firms
in Silicon Valley with the intent of bringing speed and agility in real time to Nestlé’s
brand communications. Nestlé’s objective was to facilitate greater collaboration and
distribution of shared learning and best practices across its global operations. Nestlé
adopted the use of an internal Facebook-like tool called Chatter from Salesforce.com to
foster increased levels of hands-on communication between divisions, and between the
TMT and employees. Blackshaw found the DAT enabled Nestlé to push its digital
strategy to real-time listening, engaging, and transforming opportunities by facilitating
collaboration and more employee engagement. While ROI metrics are relevant to Nestlé,
Nestlé’s TMT realized that the duality of managing ROI and funding innovation is akin
to managing the tension between various objectives. Creating and managing TMT tension
was important according to Latham (2014), and advocated by Dierk and Dover (2012).
According to Blackshaw, ROI can coexist with intuition and innovation. Blackshaw
asserted that all brand-building processes should integrate the use of digital tools,
particularly when the firm’s TMT desires to move decisively away from the status quo
and alter an existing business model. As the Nestlé example illustrates, their TMT set up
a separate division to innovate that in turn facilitated input from customers. Gathering
input and listening to customers resulted in Nestlé’s TMT changing their business model
to communicate better with consumers. In essence, leveraging innovation helped Nestlé

76
effectively change their business model and balance short and long-term objectives
effectively.
Brand value. Brand value is one of the three variables discussed within this
study. Brand value is measurable in several manners and may influence sustainability.
Branding and brand valuation warrant a discussion as part of the literature review.
Defining the brand construct. According to Chang et al. (2014), innovation only
explains part of the influence on market orientation. The effect of innovation and the link
to firm performance has an association with other factors including corporate culture,
employee attitudes, executive skill sets, distribution, and industry-specific factors (Chang
et al., 2014). Ideally, brand should be part of any discussion on innovation given that the
intent of NPD R&D teams is to work closely with the marketing leaders to commercialize
innovations to meet customer needs. Given the myriad of brand definitions,
understanding what constitutes a brand requires the realization that understanding a brand
goes beyond simply using a logo in advertising. Larson (2011) asserted that a brand is not
a logo, trademark, or corporate identity that TMT can choose to ignore. A brand is a
collection of perceptions in the mind of the customer (Larson, 2011). Larson noted that
brand perception is attributable to the experience customers have with a firm’s products
and services. Larson noted that managing a company’s perception in the minds of
customers is not an easy task but a complex undertaking. The undertaking to influence
the perception of a brand in the mind of customers requires understanding, cultivation,
and carefully management by the TMT (Larson, 2011). Any definition of a brand should
ideally encompass many different dimensions including the importance of an emotional
77
connection with a brand and the effect that innovation has on enhancing the customer
experience (Daley, 2014). Understanding brands requires an articulation that brands are
the sum of a company’s marketing efforts, customer experiences, emotional effect on
customers, place within a particular culture, and is the mark of quality and status (Daley,
2014). A brand is the sum of these components and provides the underlying reason one
company may succeed while another company fails (Daley, 2014).
Engaged employees deliver a branded experience. Leadership style may affect a
brand and enhance or diminish overall brand equity and ultimately long-term financial
performance (Punjaisri, Evanschitzky, & Rudd, 2013). Daley (2014) found the top brands
were not companies that engaged in star-studded commercials or marketing hype but
rather firms that deliver on their brand promises consistently giving consumers the
highest level of service and best products. Holland and Weathers (2013) noted that while
companies spend millions on advertising using celebrity endorsements to convince
consumers to do business with them, they often have misguided priorities when they fail
to address the people strategy and delivery on the brand promise. Many TMTs believe
that the business strategy, the brand strategy, and the people strategy are independent
when in reality the components are interdependent (Holland & Weathers, 2013). When
companies fail to address the people strategy, this failure prevents firms from delivering
on the brand promise through engaged employees (Holland & Weathers, 2013). Holland
and Weathers asserted that CEOs must carefully align the three strategic components and
improve employee engagement to deliver a consistent and positive brand experience.
Perkins (2012) found engaged employees working in an extraordinary work environment
78
are more likely to deliver higher quality work, superior customer service, and meaningful
innovation for their organizations. Daley (2014) noted that engaged employees and
strategic alignment of components contribute to delivering a firm’s brand specifically
when employees view their work as meaningful (Perkins, 2014).
Daley (2014) argued that great brands fulfill a larger purpose than being profitable
but rather create dynamics where the customer feels valued. To improve the client
experience and achieve and retain brand relevancy, Daley asserted that great brands
employ both incremental and continuous disruptive innovation efforts. Brands such as
Sephora, Hilton, and Ritz-Carlton place innovation at the heart of their brand to create
new and positive experiences for clients delivered by engaged employees (Daley, 2014).
By reframing innovation as the impetus for organizational change, owning change
initiatives by engaged employees often results in aggressive target setting (Blackshaw,
2014). Blackshaw (2014) noted that Nestlé’s was able to improve brand perception by
creating a corporate culture of highly engaged employees with an external focus on
customer engagement. Blackshaw noted that Nestlé’s TMT found innovation is a
component of a larger process to fundamentally create superior brand experiences for
customers. Creating of meaningful brand experiences requires the full engagement of
employees in both the delivery of the brand and in the change process (Blackshaw, 2014).
In other words, Nestlé became brand-driven rather than product-driven realizing that a
relevant brand requires personification through employee engagement.
The importance of brand and the influence on sustainability. Carefully
managing a brand may support sustainability. Hung-Jung and Hsien-Bin (2013) provided
79
insight into the transformational journey that Giant Manufacturing (Giant) took over the
last 40 years. On the verge of bankruptcy, the CEO of Giant Bicycle took the firm from
being an original equipment manufacturer (OEM) bicycle parts manufacturer to a global
brand powerhouse. Giant now has over 10,000 distributors in 50 countries. However, as a
component of creating a brand powerhouse, Giant realized the need to develop new
innovative products and support new products with a brand. Pure survival was the
impetus for Giant to innovate including the use of new materials and designs. Giant
moved away from simply being a contracted OEM to a firm producing products under its
brand (Hung-Jung & Hsien-Bin, 2013). While Hung-Jung and Hsien-Bin did not delve
into the management traits and behaviors exhibited by the CEO, Giant’s CEO was open
to substantially changing the organization’s business model with input from employees
and its value chain. Being flexible to change the product line provided an environment of
experimentation at Giant whereby they garnered customer feedback to look for products
that filled various gaps. While Giant was investing in NPD, it was also building Giant
into a brand powerhouse.
Brand valuation. There are several methods and points of view on brand
valuation. Given investor pressure and fixation on short-term profitability, funding NPD
and innovation research often create a battle of wills (Hess, 2012). Long-term economic
sustainability is what is at risk according to Eccles and Serafeim (2013). Short-term
pressure to produce immediate financial results is apparent by the application of high
discount rates in calculating net present values (Eccles & Serafeim, 2013). Eccles and
Serafeim suggested that there may be a need to develop and adopt a new valuation model
80
that explicitly incorporates environmental factors into brand valuation methods. Such
factors may take into account long-term sustainability that this study attempts to address.
Companies that innovated, according to Eccles and Serafeim, improved their financial
performance by approximately 30% above those firms that did not innovate. To move
away from a short-term fixation of quarterly financials, Eccles and Serafeim suggested
that TMTs should have the courage to communicate the need to adopt longer-term
objectives. The specific goal is to attract farsighted investors rather than bowing to the
demands of short-term investors (Eccles & Serafeim, 2013).
Underestimating the importance of brands and their effect on shareholder value
may be unwise. J.P. Morgan considers that established brands could account for as much
as one-third of shareholder value (Duguleană & Duguleană, 2014). Brand valuations
typically use three brand multiples including intangible earnings on a per country basis,
brand contribution as a proposition of the intangible earnings attributable to the brand,
and growth potential and customer loyalty data (Duguleană & Duguleană, 2014). Attila
(2014) noted three other measurements of brand value including price premium, revenue
premium, and profit premium. Each method has advantages and disadvantages. Of these
three brand value measurements, Attila asserted that the price premium method has a
strong correlation to brand equity than the other measurements. The rationale for this
assertion is that stock market pricing usually contains information referring to brand
equity as there is typically a positive relationship between new products and stock return.
However, a brand’s value may signal a product’s past performance and experience
attributes, but not necessarily future performance (Attila, 2014).

81
Price premium component of valuation. Pfoertsch (2012) developed a model to
calculate brand equity or Brand Caused Earnings (BCEs). Pfoertsch’s model has four
components comprising price premium depicting quality, discounted cash flow and
growth over time, growth from operations, and the growth rate of profits. The four
components contribute to calculating future expected free cash flows. Future cash flows
calculation are the Net Operating Profits Less Adjusted Taxes (NOPLAT), price
premium, sales, and BCE over a specific period (Pfoertsch, 2012). The calculations show
a firm’s growth rate that is attributable to operations and BCE (Pfoertsch, 2012). While
Pfoertsch’s model calculates brand equity from future revenue and earnings separate
from operations, the method has limits attributable to its theoretical nature given that this
method does not interpret the underlying attributes of brand value.
Keller and Lehmann’s brand value chain (BVC) framework (as cited by Huang &
Sarigollu, 2014) make a significant contribution to the understanding of how brand equity
develops and operates beyond purely quantitative brand valuation models. Huang and
Sarigollu asserted that the BVC framework follows a persuasive hierarchy model
whereby cognition drives behavior. To drive behaviors, marketers assume there is
relationship flow from making investments in marketing to drive brand effect, and that
brand effect drives purchasing behaviors (Huang & Sarigollu, 2014). While the revenue
premium in the BVC framework is a convenient and practical measure for tracking brand
equity, the assumption is that the BVC can measure and assess the customer mindset and
the revenue premium together as part of the same underlying construct. Huang and
Sarigollu noted that when researchers compare mindset measures, revenue premium

82
provides an easier and more convenient method to track brand equity continuously. Using
revenue premium to track brand equity is more convenient as information is readily
available for managers (Huang & Sarigollu, 2014). Customer mindset measures are
laborious to construct and use (Huang & Sarigollu, 2014). For example, the use of
customer mindset data requires questionnaire design, sample selection, and surveying on
an ongoing basis to continuously track and understand the underlying drivers and
perception of the customer mindset (Huang & Sarigollu, 2014). While revenue premium
is simpler to use as a measurement component of brand equity, there are shortcomings
because of the need to establish a baseline brand using a manufacturer’s national brand
(Huang & Sarigollu, 2014). The use of revenue premiums can confound the logic of this
method when private labels also command revenue premiums (Huang & Sarigollu,
2014).
Brand valence component of valuation. In most cases of high volume brands,
revenue premium measures are a good choice for continuous tracking of brand equity
because they reveal the real changes in brand equity (Huang & Sarigollu, 2014). Using
revenue premium metrics is practical and convenient to use since data is readily available
and typically flag any changes in brand equity before customer mindset measures (Huang
& Sarigollu, 2014). Given that user experience often precedes brand awareness in certain
contexts, changes to revenue premium measures can signal a potential change in brand
equity (Huang & Sarigollu, 2014). However, TMTs must utilize customer mindset
measurement feedback to diagnose the underlying problems and make the requisite
adjustments accordingly. Adjustments might include generating new products,

83
conducting new product trials, increasing distribution intensity, and using advertising to
frame and reinforce a positive product experience in customers’ minds (Huang &
Sarigollu, 2014). While the BVC framework tested by Huang and Sarigollu illustrates the
importance of revenue premium in brand equity models, it is merely one component. This
richness of information around customer mindset is unlikely to be evident by relying
entirely on revenue premium measures.
While there is the predominant notion that revenue premium or the pay more
metric is the best predictor of brand valuation, Riedesel (2011) found this not to be true.
Among a range of services, food products, and electronics, the use of the revenue
premium was only average at predicting conjoint based brand utility scores. Riedesel
found using brand valence is the best method of predicting brand utility scores. Valence
measures are incremental and can assess emotional responses to brands (Riedesel, 2011).
Riedesel asserted that the use of conjoint analysis to predict brand utility scores is not
entirely contrary to Huang and Sarigollu’s (2014) findings. Riedesel suggested not to
dismiss brand valence in favor of only using a price premium in brand equity
assessments. Riedesel noted that the assessment of brand valence may be complementary
to Huang and Sarigollu’s suggestion that factoring in the customer mindset into brand
valuation models is a basis for understanding user experience with a brand. Factoring in
consumers’ purchasing consideration as a metric is not a surrogate for pricing power as
pricing power often measures factors other than the intrinsic value of a brand (Riedesel,
2011). Riedesel found measuring feelings towards a brand could evoke non-cognitive,
strongly positive or strongly negative visceral feelings. While Riedesel asserted that when
84
associating human feelings towards a brand with future consumer behavior during
assessments, the responses draw on past feelings and experiences of consumers and not
future intentions. In other words, consumers often buy products or services they know or
are comfortable with, and how good they feel using a brand even if those brands cost a
little more (Riedesel, 2011). Heavily weighting conjoint analysis factors including pricing
metrics or financial market premiums when assessing brands tends only to assess hyper-
rationality. Valence scaling taps into consumer feelings about brands beyond assessing a
pricing premium (Riedesel, 2011).
Using valence scaling provides an insight into the human reaction to brands
(Riedesel, 2011). While the inclusion of a valence scale when assessing brand valuation
is isomorphic in that it can capture how the human brain works (Riedesel, 2011), some
brand valuation calculations ignore or downplay isomorphic factors. Stock and Zacharias
(2013) found customer loyalty has a powerful effect on brand performance and ultimately
on economic sustainability. Given that innovativeness can evoke both positive and
negative customer responses, companies must be sensitive that the innovativeness they
introduce is not only new but also meaningful for customers (Vuorinen et al., 2012; Stock
& Zacharias, 2013). New and meaningful innovation must meet specific customer needs
(Vuorinen et al., 2012; Stock & Zacharias, 2013). Chang et al. (2014) found incremental
service innovations are typically less risky to adopt than radical innovations. Introducing
radical service innovation contributes to an increase in customer loyalty, enhances brand
image and firm reputation by attracting new customers (Chang, 2014). Riedesel (2011)
asserted that the use of valence measures provides insights into the underlying factors

85
that merit a pricing premium for a brand. Discussion around the different approaches to
brand valuation must include the acknowledgment that intangibles such as the brand
valence of consumers may not be prominent in the metric calculations of different
consultancies that provide valuations (Riedesel, 2011).
Focus of different brand valuation consultancies. While there are several brand
valuation methodologies that emphasize different valuation components, different brand
valuation consultancies also focus on the range of brands. Some brand consultancies
include sports brands, cosmetic brands, technology brands, and service brands
(Duguleană &Duguleană, 2014). Other brand consultancies include energy, heavy
industry, auto manufacturing, electronics, technology, telecoms, and conglomerates
(Gent, 2014). Duguleană and Duguleană (2014) asserted that the brands that are the most
highly valued tended to be global with the majority being more than 60 years old. Gent
(2014) noted that the 2014 Brand Finance Global 500 brand valuation from the brand
consultancy firm Brand Finance provided a different perspective. Brand Finance reported
(as cited by Gent, 2014) that eight out of the ten global brands were technology firms
including Apple and Samsung. While technology firms dominate the top 50 global brands
in the 2014 Brand Finance Global 500 list, many technology companies at the bottom of
the list are old school companies (Gent, 2014). Those at the top of the list tend to be less
traditional (Gent, 2014). While the data from the two perspectives may appear
paradoxical, Gent noted that firms can create brand value. Brand value drivers include
innovation, capturing the public’s imagination and monetizing a brand to generate multi-

86
billion dollar revenues across product categories. Gent found aligning innovation efforts
with a firm’s carefully orchestrated approach is a key component of managing its brand.
Intangible assets of a brand. Duguleană and Duguleană (2014) suggested that
brand valuation must include intangibles. Measuring a brand’s intangible assets must
include factors closely connected with an organization’s culture, values, and its business
strategy (Duguleană & Duguleană, 2014). Intangible assets may also include attitudes
and behaviors that help create a shared sense of purpose and partnership, a deep
understanding of their customers’ industry, trustworthiness, and sense of professionalism
for business-to-business (B2B) brands (Ryan & Silvanto, 2013). Tangible assets may
include additional services that a firm is able and willing to offer to accommodate
consumers and provide expert advice on their products (Ryan & Silvanto, 2013).
Leveraging intangible and tangible assets through effective marketing efforts can build
customer loyalty, awareness, and effective management of customer relationships
(Duguleană & Duguleană, 2014). By considering all of these factors, together these
factors form brand equity (Duguleană & Duguleană, 2014).
Attila (2014), Narayan (2012), and Riedesel (2011) noted that some brand
valuation methods are indicators of the present value of future cash flows. The generation
of future earnings and future economic benefits are the primary objective of using present
value methods for the forecasted future period (Narayan, 2012). While B2B commerce is
often more complicated than business-to-consumer (B2C), within B2B relationships there
is often a perception by buyers that the seller is acting as a trustworthy, reliable partner

87
available to offer expert advice. Trust and expert advice are crucial components to
building the seller’s brand equity (Ryan & Silvanto, 2013).
Duguleană and Duguleană (2014) found strong brands have a competitive
advantage over their competitors and tend to be profitable over the long-term. Firms with
high brand values tend to garner higher levels of trust, loyalty, receive more
recommendations, and have the perception of being of better value (Duguleană &
Duguleană, 2014). To build a sustainable business, McKinney and Benson (2013) found
brands need to develop trust to attract and retain customers. Strong brands command
higher prices and consumers are willing to pay for the perceived worth of such brands
(Duguleană & Duguleană, 2014). Attila (2014) found firms with one product achieve a
higher price premium for their brand but also more likely to realize a reduction in
revenue and profit. Attila noted that as companies increase their offerings with multiple
products, the correlation between revenue premium and profit premium was positive
regardless of firm size.
Strong brands are one of the few assets that can provide a long-term competitive
advantage to a firm (Duguleană & Duguleană, 2014). Like other assets, a brand requires
careful management (Narayan, 2012). Tait (2012) noted support for the careful
management of brands. Tait asserted that effective branding required the alignment of
brand values and consumer values while high levels of brand loyalty often equate to
higher top and bottom line financial performance. Strong brands can help firms
successfully weather a significant crisis or turbulence and prevent them from falling
further (Duguleană & Duguleană, 2014). While the most prominent brand consultancy
88
reports include Interbrand’s Brand Value Index and Millward Brown Optimor’s BrandZ
report, the metrics are inconsistent among the brand valuation companies (Duguleană &
Duguleană, 2014). The inconsistency of brand valuation methods persists despite the
British Standard Institute (BSI) and the International Organization for Standardization
(ISO) creating the BSI ISO 10668 Brand Valuation: Requirements for Monetary Brand
Valuation standard in 2010 (Duguleană & Duguleană, 2014). To address the
inconsistency of brand valuation methods and overcome the limitations of subjectivity,
Narayan (2012) proposed the use and implementation of a multidimensional, holistic
approach to brand valuation. No general agreement on brand valuation methods exists
because each brand consultancy computes brand valuations based on different accounting
objectives that each may have (Narayan, 2012).
Developing the ISO standard was an attempt to create a framework for
standardizing the method of brand valuation by using common subcomponents
(Duguleană & Duguleană, 2014). The common subcomponents include financial value,
brand contribution, and brand value in their valuation (Duguleană & Duguleană, 2014).
Other firms such as Brand Finance use a market approach, cost approach, and income
approach to determine a brand’s value (Duguleană & Duguleană, 2014). While the
methodology that the brand valuation consultancies use broadly complies with the ISO
standard, the specific methodology garners different results by each firm. While the brand
valuation firms loosely comply with the ISO standards for brand valuation, reaching a
common methodology and compliance is unlikely. Each brand valuation firm regards
their specific methodology as proprietary and claims it as a point of differentiation from
89
each of their competitors. The principle of homogeneity of brand valuation methods is
not equivalent resulting in brand equity valuations and rankings being different among
the consultancies (Duguleană & Duguleană, 2014). While the brand equity valuations
methods and rankings are different, data availability and global perspective are
considerations for selecting and using one consultancy’s data over the other for this
study. Selecting one brand evaluation metric over another may affect the findings.
TMT behaviors influence brand. While the use of ISO standards is an attempt to
standardize brand valuation, it is not possible to distill brands entirely to a metric.
Morhart, Herzog, and Tomczak (2011) asserted that the personification of the brand
vision through brand-based behaviors such as employees acting as brand ambassadors is
a key component of an organization’s overall brand. The exhibition of brand-based
behaviors reflects brand valuation (Duguleană & Duguleană, 2014; Morhart et al. 2011;
Punjaisri et al., 2013). Punjaisri et al. (2013) found leaders who adopt a brand-specific
transformational leadership style tend to foster service recovery behaviors in their
employees that align with the brand values. Achieving a shift in culture requires the
adoption of brand-specific behaviors that can create value for stakeholders (Kamisan &
King, 2013; Punjaisri et al., 2013). While brand-specific behaviors are imperative, TMTs
must intervene to change their organizational culture by setting an example that
employees can learn from and adopt (Morhart et al., 2011).
When determining the reasons why some organizations can repeatedly innovate
while most cannot, Hill et al. (2014) suggested that the role of an effective organizational
leader is to build a community that is willing and able to innovate over a longer period.

90
Hill et al. found CEOs who simply paint an organizational vision is insufficient given that
innovation requires hard work, is taxing on the leadership and employees, and can be an
uncomfortable process both emotionally and intellectually for stakeholders. Hill et al.
asserted that three organizational capabilities are required. The first of these three
capabilities include collaboration using creative abrasion to create a productive debate
and tension within the organization. The second organizational capability is creative
agility using a repeatable discovery-driven learning process to foster experimentation
using looped-back learning from stakeholders and customers. The third capability cited
by Hill et al. is the ability to integrate organizational decision-making with guidance from
the TMT to arrive at optimal solutions. Hill et al. found Google and Volkswagen
emphasize brand attributes that create a common sense of purpose to guide the innovation
effort within their respective organizations. Hill et al. asserted that organizations that
have a clear understanding of their brand values tend to innovate to create long-term
sustainability and addition value for shareholders.
NPD initiatives affect brand. While innovation and NPD can further strengthen a
brand, Abril and Martos-Partal (2013) found some brands with higher value and able to
command premium pricing are not always able to garner the highest market share. Abril
and Martos-Partal found, for certain product categories in Europe, 39% of households are
loyal to a private label brand while manufacturers’ brands are not able to command price
premiums for products in some categories over the long-term. While the price premium
market share is paradoxical, Abril and Martos-Partal suggested that unless manufacturers
with well-known brands launch innovative products offering significant advantages to
91
consumers, the brand equity of the manufacturers’ brand will erode. The brand equity of
national brands is vulnerable to erosion in categories where private labels tend to
dominate (Abril & Martos-Partal, 2013). While innovation allows firms to garner a price
premium from the reputation of a brand, market share could decline if innovation efforts
are unable to produce products or services others firms cannot easily replicate (Abril &
Martos-Partal, 2013). For well-known brands to command a price premium, they must
offer some advantage over their nearest competitors’ products and services (Abril &
Martos-Partal, 2013). Abril and Martos-Partal asserted that when the use of brand
premium is a proxy for innovation in the context of sustainability, it requires the use of
caution since imitation products introduced under private labels may be a substitute for
capturing market share. The approach of creating brand equity around private labels has
the potential to command brand equity for private labels and negatively affect the brand
valuation of established manufacturers’ brands (Abril & Martos-Partal, 2013). Negatively
affecting brand valuation is possible when firms position private brands as prestige
brands such as Loblaw’s President’s Choice brand (Huang & Sarigollu, 2014).
Brand reputation and corporate social responsibility. In addition to the various
challenges with brand valuation methods, McNeal (2013) found using innovative
marketing to market innovative product affects brand valuation. McNeal noted that
innovative brands achieved higher pricing premiums for a nonconventional marketing
approach that goes outside of strategic boundaries of what seems normal. In other words,
innovative brands tend to push conventional marketing boundaries (McNeal, 2013).
McNeal found firms that do not have a strong brand reputation or enjoy the perception of
92
being innovative were less likely to garner pricing premiums. Marketing campaigns must
be out of the ordinary as consumers may consider such an approach as negative (McNeal,
2013). Once a brand achieves the status and recognition of being an innovator by
consumers, innovative brands have more flexibility to experiment with unconventional
marketing strategies without risking their brand reputation (McNeal, 2013). Firms that do
not attempt to build their brand equity through innovation attribution tend to limit
themselves (McNeal, 2013).
Smart marketers examine the potential benefits they can derive from their
innovative products and services (McNeal, 2013). McNeal asserted that firms should
leverage innovative products and services in an unconventional manner through
innovative advertising campaigns to bolster the value of their brand. For brands to be
relative, the messaging must be salient and top of mind by illustrating their relevance to
specific consumer needs rather than using overtly persuasive messaging. Brand
messaging should utilize positive messaging and be highly visible through consistent
advertising over an extended period to build brand awareness (McNeal, 2013).
Utilizing corporate social responsibility (CSR) actions can affect consumer
attitudes by shifting the perception of how consumers humanize corporations (Olsen et
al., 2014). When surveying CEOs, Aschaiek (2012) found the stakeholders who had the
most influence to shift CEOs’ mindset to embed sustainable strategies into their
operations were consumers followed by employees. Aschaiek found CEOs recognized
the business value of doing the right thing concerning sustainability and social
responsibility given that embracing sustainability strategies affects their brand image,

93
grows revenues, and reduces costs. Tarnawska (2013) noted that firms need to do more
than rely on resource efficiency as this approach is insufficient to reduce input costs
through the implementation of incremental innovation. Tarnawska found eco-innovation
has a positive effect on developing radical innovation and leads to new disruptive
technologies that potentially create higher demand for their products based on positive
brand perception. Edvardsson and Enquist (2011) found CSR is a prerequisite for a
sustainable business model in the longer-term. Edvardsson and Enquist posited firms to
build on customer values using ethical, social, and environmentally responsible
strategies. Miller (2012) asserted that TMTs jettison the status quo and realize that
innovation has the potential to play a prominent role in securing future social,
environmental, and economic sustainability. Miller argued that as citizens become more
vocal about environmental sustainability via social networks, greater awareness of
sustainability issues will dictate the need for higher levels of disruptive innovation.
Chernev and Blair (2015) found CSR behaviors are likely to have a positive effect on
consumers’ perception of a corporate brand by conferring a halo effect on the products
and services it offers. The presence of a halo effect derived from CSR behaviors
positively affects the financial performance of a brand (Chernev & Blair, 2015). CSR
actions can influence the perception of quality and the demand for a firm’s products and
services Olsen et al. For example, green new product introductions (GNPIs) often require
that firms invest in NPD research to innovate. Given that CSR actions and GNPI
positively affect consumer perception of brands, firms must innovate to invest in their
94
corporate brand just as they would invest in other financial assets as CSR is a
subcomponent of the overall brand asset (Gregory, 2013; Olsen et al., 2014).
Aschaiek (2012) found while some CEOs are recognizing that CSR actions can
provide a competitive advantage, the majority of corporations largely ignore the benefits
of CSR. Edvardsson and Enquist (2011) asserted that TMTs are responsible for their
firm’s CSR actions. As exemplars, TMTs must set an example for all employees to
follow by outlining how to work with one another, and how to interact responsibly and
innovate with customers. Edvardsson and Enquist suggested that TMT members must
work towards developing the trust of followers and customers by the actions they exhibit.
Developing trust requires TMT to trust in their employees starting by referring to them as
partners, coworkers, and colleagues rather than as employees. TMTs that exhibit trust
through their messaging sets the tone for how employees interact with each other and
with customers (Edvardsson & Enquist, 2011).
Brand values embedded in cultural DNA. Olsen et al. (2014) argued that most
senior leadership teams lack a clear understanding of the implications on how the
messaging around GNPI affects consumer attitudes. Olsen et al. noted that TMTs tend to
fall short in understanding the importance of CSR. Gregory (2013) asserted that TMTs
must align CSR positioning with a firm’s fundamental values or mission, be relevant, and
connect to the messaging and activities of the firm. To create the perception of
authenticity, Gregory noted that CSR activities must be unique and innovative. Gregory
found for CSR to be authentic, CSR initiatives must become part of a company’s DNA
rather than an add-on or one-time event. Rather than embedding CSR activities into an

95
organization, Holland and Weathers (2013) found most CEOs think that their firm’s use
of IT systems is the most important enabler of a brand. Holland and Weathers noted that
IT systems are enabling tools for employees to use. Holland and Weathers argued that
embedding a brand promise into a firm’s cultural DNA enables the firm to deliver
product and service in a manner that authentically engages the customers. Holland and
Weathers suggested that the value of a brand must encompass the alignment of the
business strategy, the brand strategy, and the people strategy.
Olsen et al. (2014) noted that the introduction of environmentally sustainable new
products can change consumer attitudes towards a brand. Consumers tend to build and
maintain their identity by identifying with brands (Olsen et al., 2014). As consumers
actively monitor brands that take purposeful CSR actions, CSR actions reinforce
consumers’ central association for desired brands (Olsen et al., 2014). Brands not
perceived as authentic tend to be negatively affected (Gregory, 2013). McKinney and
Benson (2013) found when a bond develops between people and brand, trust in a brand
emerges. When the bond between people and brand is strong, customers loyal to a brand
tend to work hard to sell the brand to others (McKinney & Benson, 2013). Tait (2012)
found functional brands that define their market context as benefits often garner the
perception of existing only to make money. Tait noted that values-based branding is
different because it leverages market context from neuroscience. Values-based brands
tend to garner a deeper sense of loyalty when consumers can relate to brand values. Tait
noted that most companies use a brand-values ladder to define product features and
benefits, emotional connection, values connection, and movement. Tait argued that the

96
importance of extending the top section of the brand-values ladder to include some
brands that provide seemingly mythical benefits. Tait suggested that the mythical benefit
of the Gucci Woman brand included enjoyment of life, job success, and desire to leave a
lasting impression when wearing the brand. Tait noted that Gucci’s shift to a brand-
driven company smashed sales records and profits in 2006 jumping 20 spots on the
Global Brand Valuation list between 2004 and 2011. Gucci’s brand value was greater
than Lexus and Starbucks combined (Tait, 2012).
Social media’s effect on brand. There has been a shift away from trust in
traditional paid media such as advertising and product placement given a 42% trust level
(McKinney & Benson, 2013). The shift in trust in media is towards earned media.
Earned media consists of recommendations and opinions, with a trust level of 92%
(McKinney & Benson, 2013). Therefore, the trust gap has widened between what
companies say about their brand and consumers’ perception of the brand based on other’s
opinion (McKinney & Benson, 2013). Accordingly, the trust gap is widening because
consumers believe less of what a brand says and more about how a brand behaves and
what it does (McKinney & Benson, 2013). To build brand trust consisting of a strong
emotional bond, three distinct factors are required including (a) creditability that a brand
does what it says it will do by keeping its promise, (b) brand representatives understand
their customers and practice active listening and empathy to create quality interpersonal
exchanges to create emotional trust, and (c) the brand values are congruent with the
values of customers (McKinney & Benson, 2013).

97
Given that brand loyalty is related to trust levels, Gouws and van Rheede van
Oudtshoorn (2011) used the diffusion of innovation theory to outline how brand loyalty is
often a product of the social network. Within the context of a social network to diffuse
information about a brand, Gouws and van Rheede van Oudtshoorn found innovation can
help drive brand perception to be desirable by followers. There is the potential for
tapping this enhanced perception by the larger social network of feeders. The challenge
according to Quinton (2013) is that some TMTs do not understand the shift and progress
of brand management paradigm as a result of digital media. Brand management is no
longer about controlling consumers and based on internal-external thinking and locked-in
thinking (Quinton, 2013). Brand as a social community paradigm is the basis for
accepting that stakeholders from external communities will provide input to brand
managers. Brand managers will, in turn, realize the need for and the power available
through co-creation innovation initiatives (Quinton, 2013). However, co-creation also
requires brand managers to influence and affect internal stakeholders such as the TMT
when formulating a strategy. There must be a clear understanding that the social media
approach is interactive, fluid, and echoes real world activities of consumers within these
communities (Quinton, 2013). However, while defining innovation as incremental-
continuous, or radical-discontinuous, this categorization is secondary to innovation that
addresses business model warfare. Business model warfare has the potential to generate
innovation ambidexterity along the entire value chain including perceived attractiveness
of brands as Lin et al. (2013) noted.
98
Given that social networking can drive brand loyalty, failure to innovate does not
create a social magnetic effect and is likely to put a brand’s reputation at risk (Gouws &
van Rheede van Oudtshoorn, 2011). Liao and Cheng (2013) also found other factors such
as service innovation failures could affect brand equity rather than strictly a lack of
innovation. How firms handle service failures has implications on perceived brand equity
and recovery efforts (Liao & Cheng, 2013).
Using brand authenticity to develop consumer trust, Gregory (2013) noted that the
influence brands can have on stock market performance is approximately 5% to 7% for
the average public company. According to the Corporate Branding Index (CBI), brand
power uses and incorporates corporate advertising, sector affiliation, and market
capitalization. While CSR typically makes up over 5% of a firm’s reputation, the size of a
brand’s effect on market performance can vary depending on the specific industry
(Gregory, 2013). Utilities have a range of 0% to 4% while the brand power of beverage
and food manufacturers may go as high as 20% (Gregory, 2013). Therefore, the
importance of brand in this discussion is not trivial.
Olsen et al. (2014) noted that brands that have high levels of GNPI are more
likely to continue these initiatives moving forward which tends to positively affect
consumer attitude towards that brand. Greenwashing or positioning products as
environmentally sustainable when they are not, and other deceptive environmental
efforts, will create consumer skepticism and a negative brand valence (Olsen et al.,
2014). Given that consumer attitudes towards brands could affect brand valuation, senior
leadership teams need to address how the use of innovation can help develop GNPI and

99
influence brand perception and value. In fact, the importance of CSR activities on brand
performance cannot be underestimated (Gregory, 2013).
McNeal’s (2013) approach requires careful reconsideration in selecting
investments in NPD innovation efforts. Perpetuating the status quo, researchers and
marketing practitioners continue to quantify an investment in innovation as a return on
investment. Senior leaders should understand how product development and innovation
strategies have an interdependency that drives brand value. Many senior leadership teams
overlook this interdependence. Addressing the interdependence of product and marketing
campaign innovation should be part of any proposed marketing and pricing strategy
within the context of marketplace dynamics (McNeal, 2013). Unfortunately, senior
leadership teams do not seem to know when to deviate from maintaining the status quo to
gain rewards for innovation. Instead, strict adherence to ROI metrics and the prevalence
of the status quo sets the stage for the perception of brands and ultimately whether
consumers value or penalize brands. In other words, firms that are recognizable as market
innovators could inflate their brand valuation whereas the lack of perceived innovation
negatively affects brand valuation. Consumer perception of a brand is an important factor
when looking at the importance of innovation and brand valuation. To challenge the
status quo, Nadkarni and Herrmann (2010) asserted that CEOs should recruit more
assertive individuals in the area of idea generation for the TMT to drive innovation.
Larson et al. (2012) found Baldrige CEOs dissatisfied with the status quo and more likely
to drive continuous improvement in the value chain by implementing balanced scorecards
beyond traditional financial metrics. Eccles and Serafeim (2013) noted that TMTs must

100
consider valuation models and incorporate innovation around environmental
considerations to influence brand perception and drive long-term brand valuation over the
long-term.
Brand preference versus brand relevancy. Building on McNeil’s (2013) findings,
Aaker (2012) provided a model of brand preference and brand relevancy strategies that
requires discussion in the context of innovation and effect on the brand. Aaker asserted
that a brand preference strategy involves incremental innovation to make a product or
service offering more attractive, reliable, or less costly, but almost never moves the
marketplace. A brand preference strategy at best is a recipe for retention of existing
market positions, eventual price and margin erosion, and possibly a decline into
irrelevance. However, a brand relevancy strategy involves transformational innovation
and can be a game changer. Substantial innovation, not incremental innovation, tends to
offer enhancements, or new must have characteristics that are so significant that
customers will reject any option without it (Aaker, 2012). Aaker asserted that to create a
new category or subcategory of products and services, firms must ensure customers can
relate to the offering on an emotional level and not simply analyzing product features. In
fact, Beverland, Napoli, and Farrelly (2010) noted that there is a need for alignment
between brand positioning and new-product innovation. Beverland et al. found when a
follower and/or a craft-designer leader brand attempted to introduce radical innovations
that were well beyond the brands’ core promise, they were not able to garner consumer
support for the new products. Conversely, product and category leader brands were more
likely to survive if they continue to innovate radically (Beverland et al., 2010). However,

101
firms may unintentionally reposition the brand from a leader to a follower brand because
a firm wishes to make only incremental changes to products to extend their brand. This
approach can cause brand perception challenges when customers are expecting to see
radically new products emerge (Beverland et al., 2010).
Unfortunately, many established and successful firms will be fearful of altering
their business model (Aaker, 2012; Beverland et al., 2010). Such firms will continue to
maintain the status quo by focusing on building their brands through intense marketing
campaigns, sponsorships, incremental innovation, and by maintaining their current
business models (Aaker, 2012). Their TMTs will be fearful of diverting resources and
taking a risk to innovate other products and services that create new categories or
subcategories with must have relevancy (Aaker, 2012). Also, TMTs will fail to
understand the significance of alignment required between brand positioning and new
product innovation to create new product categories (Beverland et al., 2010). Examples
of game changers who created new categories or subcategories through radical product
innovation include Dell, Apple, Chrysler’s minivan, and Toyota’s Prius (Aaker, 2012).
While some companies have unique capabilities to engage in disruptive
innovation on an ongoing basis, many do not have similar capabilities and thus should
innovate based on their unique capabilities. Given that disruptive innovation tends to be
risky, companies without the capabilities or leadership to engage in disruptive innovation
are better to leverage their core capabilities using incremental innovation (Aaker, 2012).
Based on Aaker’s (2012) assertion, most firms are not ambidextrous as their TMTs
continue to erect barriers to maintain the status quo. Retaining the status quo tends to be
102
the preferred strategy (Aaker, 2012; Beverland et al., 2010) rather than viewing
innovation as a viable means to achieve sustainability.
Economic sustainability. Economic or financial sustainability is one of the three
variables discussed within this study. Financial sustainability is the notion that a firm will
be sustainable over the long-term due to factors such as investments in innovation and
careful management of brand assets. The literature review requires a discussion on
sustainability.
Economic sustainability metrics. There is precedence to using secondary data to
gauge company performance as Rubera and Drogue (2013) noted a significant positive
correlation between design innovation and corporate branding. Also, an increase in
Tobin’s q ratio found an increase in the level of technological innovation. Decreasing
marginal effects have a relationship with the limits of corporate brand name extensions.
Therefore, given the perception by investors around future cash flows, the performance
value of innovation has a relationship with the branding strategy selected. With this in
mind, it is important to note that Rubera and Drogue’s research is an example of
attempting to use secondary data to link innovation, branding, and financial performance.
However, while Rubera and Drogue’s findings focus on Tobin’s q, in my research study I
examined the longer-term prospects of innovation on brand valuation and economic
sustainability.
Kajander, Sivunen, Vimpari, Pulkka, and Junnila (2012) suggested that defining
corporate sustainability using the DJSI is a business approach to gauge long-term
shareholder value. To assess the long-term value of firms, Kajander et al. analyzed 500
103
announcements filed with various securities exchanges from 30 firms in a 200 day period.
Kajander et al. found firms that issued a higher number of sustainability business
innovation (SBI) announcements had a significant positive correlation with financial
performance when compared with firms that issued a lower number of SBI
announcements. Kajander et al. noted using SBI announcements as a proxy for a firm’s
innovation capability and as a subcomponent of a firm’s ability to generate future cash
flows. Kajander et al.’s use of the DJSI sets a precedent to use third party metrics.
Economic sustainability within the value chain. Hynds (2013) noted that some
companies use sustainability as a vogue marketing tool while other firms realize that
sustainability efforts reduce costs, improve efficiencies, mitigate risk, and create new
competitive revenue opportunities. Achieving the benefits from a firm’s sustainability
efforts requires firms to utilize their R&D capabilities to innovate ways to minimize the
resources consumed by their operations, eliminate toxic materials from their processes,
and provide solutions and improve the lives of their employees and customers (Hynds,
2013). Hynds asserted that companies must learn how to address sustainability as a
strategic objective and incorporate sustainability into their innovation processes along the
entire value chain. Morris (2013) asserted that TMTs must innovate by first
understanding systems thinking and second engaging in business model warfare to affect
a firm’s overall value chain. Morris noted that embracing systems thinking moves an
organization from a short-term defensive mentality to a holistic view of their organization
and critical for sustainability efforts. Hynds argued that sustainability efforts are a
powerful business lever as are quality, reliability, and the voice of the customer but

104
sustainability efforts should be a component of a firm’s overall business strategy by
embedding it into the NPD innovation process (Hynds, 2013). While applying a
sustainability lens helps customers do their jobs more efficiently throughout the value
chain (Hynds, 2013), Yuan et al. (2014) noted that TMTs must possess diverse
backgrounds and different points of view to facilitate strategic innovation. Hynds noted
that TMTs should apply a sustainability lens during the creative phase of NPD concept
development to identify where to add value to meet the needs of customers.
Gobble et al. (2012) found a link between R&D spending and financial
performance. High-level innovators such as Apple, Google, and Honda deliver high-
performance innovation that contributes to the bottom line of each firm year after year.
Gobble et al. noted that the Global Innovation 1000 Index suggests that strategic
alignment between innovation and the overall corporate strategy is important to
successful innovation. Gobble et al. asserted that innovation is a tool of strategy that can
create the future that a strategy envisions. Gobble et al. suggested that firms must fit
innovation into the larger corporate strategy and carefully decide where to focus R&D
resources. Gobble et al. noted that Porter believes that the only competition that matters is
the competition for profits and success is only measurable by the bottom-line. Gobble et
al. challenged Porter’s notion by asserting that competition is about capturing value from
products or services as a function of differentiation and sustainability. Blank (2013)
suggested that when TMTs solely focus on financial and operational efficiency they rob
innovation efforts of resources. Gobble et al. argued that focusing solely on maximizing
profitability is often at the expense of innovation. Gobble et al. asserted that stifling

105
innovation efforts could have a profoundly negative effect on the long-term economic
sustainability of firms when TMTs deny there is a connection between disruptive, radical,
and systems innovation and sustainability.
Interdependencies of sustainability. Sayem (2012) asserted that the capacity to
innovate is a catalyst for growth and likely the most important factor influencing firm
performance. Sayem identified three categories to measure innovation success including
environmental and social facts, technical effects, and economic effects. Sayem created a
conceptual framework using market orientation, learning orientation, entrepreneurial
orientation, and sustainability orientation to plot relative sustainability factors. Sayem
found when factors in the model occur together, higher degrees of sustainability and
competitiveness as measured by business performance tend to be present. While Sayem
did not provide empirical evidence to support the link between the four noted factors and
economic sustainability, the four dimensions are complementary and necessary for firms
to enhance the likelihood of their economic performance and long-term sustainability.
Edvardsson and Enquist (2011) attempted to link innovation and financial
performance using case studies of Ikea, H&M, Starbucks, and The Body Shop.
Edvardsson and Enquist argued that value resonance, innovation, and service excellence
drive sustainability and corporate social responsibility. Edvardsson and Enquist found to
innovate in a meaningful manner to create value and achieve sustainability, TMTs must
address several dimensions within an organization. Edvardsson and Enquist found the
dimensions linking innovation to sustainability include implementing new business
models that focus on serving and providing new solutions to customers, and articulating

106
the logic behind and the need to create and incorporate values along the value chain.
Additional dimensions that link innovation to sustainability noted by Edvardsson and
Enquist include delivering great service experience for customers, positioning the brand
and marketing communications to reflect the corporate vision, achieving service
leadership by aligning culture and image with the delivery of customer service, and
creating employee trust through bilateral knowledge flows.
Rubera and Kirca (2012) developed a chain-of-effects model to determine
whether there is a direct or indirect relationship between organizational innovativeness
and performance outcomes. The impetus behind Rubera and Kirca’s research was their
assertion that most of the scholarly literature on innovation and its relationship to firm
performance was fragmented. Rubera and Kirca noted that most of the literature failed to
provide a clear definition of the variables. While factoring the role of brand into their
model, Rubera and Kirca examined the relationship between innovation and six factors
including
§ Performance metrics consisting of market position and revenue metrics,
return on investment (ROI), return on assets (ROA), return on earnings
(ROE), profitability, stock market performance, Tobin’s q, market
capitalization, market-to-book ratio;
§ Firm size;
§ Advertising intensity;
§ High-tech versus low-tech industry;
§ Western versus non-Western country and orientation; and

107
§ Conceptualization of innovativeness comprising innovativeness inputs
versus innovativeness outputs, innovativeness outputs versus
innovativeness culture, and incremental innovations versus radical
innovations.
Rubera and Kirca (2012) found TMTs should focus on innovation because
innovation has a greater direct effect on firm value rather than focus on sales, profits, or
stock returns. Rubera and Kirca found TMTs were reluctant to invest in innovation
because they fear that investing in long-term innovation will affect short-term
profitability. While stock markets recognize innovative efforts before new product
commercialization, TMTs were reluctant to invest in innovation (Rubera & Kirca, 2012).
Research by Ba, Lisic, Lin, and Stallaert (2013), and Gregory (2013) supports a positive
link between innovation announcements and stock market valuation performance. Rubera
and Kirca found 51% of firms who experienced past stock gains reduced their innovation
budgets even when TMTs had the knowledge of a positive relationship between
innovation announcements and market value. Rubera and Kirca asserted that the reason
behind the reduction in innovation budgets was due to TMTs adopting myopic behaviors
and their quest to avoid an unexpected earnings shortfall. In other words, TMTs tend to
focus on the immediate future even though innovativeness has a direct relationship with
firm value (Rubera & Kirca, 2012).
To successfully create value for stakeholders, addressing both the functional and
the emotional aspects of a brand value proposition is imperative (Palma & Visser, 2012).
The functional aspects of a brand may range from simple compliance with legislation to

108
adding value from achieving energy efficiency, materials management, and waste
reduction that environmentally responsible products provide (Palma & Visser, 2012). The
emotional appeal of a brand may go beyond mere compliance and includes creating
products that are exciting and enhance people’s lives through clever design and style
(Palma & Visser, 2012). Palma and Visser (2012) asserted that Philips is an example of a
company that integrates sustainability into its business divisions and processes to create
value for its stakeholders. Philips’s TMT understands that sustainability is a key element
in every business strategy, decision-making process, and in value chain management
(Palma & Visser, 2012). Philips embeds sustainability strategies into how it positions its
businesses to enhance the value of its brand (Palma & Visser, 2012). Palma and Visser
found while 39% of Philips total sales came from green products, Interbrand estimated
that customer perception of Philips’ sustainability efforts contributes 10% to the
company’s brand value. Palma and Visser noted that asking buyers to provide reasons for
recommending Philips’ products, there was a 25% to 30% correlation between the
customer perception of Philips respecting the environment and a brand worth paying
more for. Palma and Visser found the prevailing perception that Philips’ energy efficient
products offered better value for money even when pricing their products significantly
higher than less energy efficient products of their competitors. Philips is a good example
of how a concerted and deliberate focus on innovation affects brand value and long-term
sustainability as measured by economic performance (Palma & Visser, 2012).
Economic sustainability affected by a holistic approach. Sayem (2012)
suggested that the environment, social, and economic pillars of sustainability are

109
interdependent and comprise the dimension that innovation efforts should address. Sayem
noted that innovation efforts that address sustainability might require that a new business
model emerge. Adopting a new business model may result in the realization of benefits
including economic profitability, social benefits accruing to employees and other
stakeholders, environmental and planetary concerns, and technological innovation. New
business models that emerge from embracing an innovation orientation may result in
TMTs taking a more holistic view of their business strategies (Sayem, 2012). Sayem
asserted that the adoption of new business models may prompt TMTs to shift from a
short-term orientation to a longer-term perspective that produces meaningful and
sustainable results. Sayem noted the possibility of organizational cultures morphing into
cultures that thrive on innovation. Sayem found several relationships linking innovation
to sustainability. The links follow a logical progression whereby (a) market orientation
positively links to innovativeness, (b) learning orientation positively correlates with
business performance, (c) entrepreneurial orientation positively correlates with business
performance, (d) sustainability orientation positively correlates with business
performance, (e) sustainability orientation leads to innovation, and (f) innovation leads to
business performance providing a sustainable competitive advantage. Sayem found
innovation affects sustainability and that a sustainability orientation affects innovation
such that there is a circular yet interdependent relationship resulting in superior economic
performance.
Sayem (2012) noted that a shift from short-term to long-term thinking is a
function of innovation. Innovation efforts can provide cost savings and produce green
110
products that consumers desire and influence sustainability and profitability (Sayem,
2012). Yandava (2012) noted that shifting towards a long-term orientation to change
organizational thinking, culture, and capabilities are necessary if an organization wishes
to be successful at a turnaround initiative. Yandava asserted that firms that use adaptive
systems thinking move from a short-term focus to a longer-term orientation. Yandava
noted that shifting orientation changes firm capabilities and subsequently enhances
sustainability and profitability. Yandava found when TMTs took a holistic approach to
addressing several factors as part of their firm’s turnaround effort, financial performance
improved and was higher than firms that undertook a traditional turnaround strategy.
Yandava noted that when firms employed a traditional turnaround strategy there was a
tendency to make only one or two financial or operational improvements. Firms that took
a holistic approach during difficult economic conditions as part of their turnaround effort
invested in strategic capabilities (Yandava, 2012). Yandava noted that the firms that
invested in their strategic capabilities invested in people, innovation, process and
operational improvements, leadership training, and cultural change in addition to
traditional financial responses. Yandava found the successful turnaround firms
collaborated with both customers and partners within their value-chain to push their
organization toward a sustainable long-term strategy.
While focusing on core capabilities is necessary, Yandava (2012) asserted that
adopting a holistic approach transforms TMT thinking whereby traditional cost centers
become value centers. Yandava found by changing thinking towards the creation of value
centers, operations become better strategically aligned and more efficient and capable of
111
creating greater customer value. Yandava asserted that the adoption of longer-term
strategic goals often become the backbone of organizational transformation efforts that
help lead organizations through financial challenges and become sustainable. Yandava
found when market conditions change, firms that invested in innovation efforts to create a
sustainable organization are better equipped to adapt efficiently to additional external
changes.
Potential lag between innovation and economic results. Lampikoski et al. (2014)
found firms that invest in innovation become more sustainable. Gobble et al. (2012)
noted that meaningful innovation effort requires TMT support including the provision of
resources, careful coordination, orchestration, and organizational alignment of innovation
with business strategy. Gobble et al. found the financial results attributable to innovation
efforts may not be apparent immediately given that time is required for innovation efforts
to affect the financial results. Bogliacino and Pianta (2013) developed a model that
attempted to determine if there was a link between profitability, R&D, and innovation.
Bogliacino and Pianta found a circular relationship between innovation efforts and
financial performance. In other words, the lagged profits of past product R&D activities
supports R&D activities and the adoption of technology for the specific purpose of
increasing process innovation, efficiency, and competitiveness (Bogliacino & Pianta,
2013). An increase in process innovation and competitiveness led to higher profits and
reinvested in product R&D efforts (Bogliacino & Pianta, 2013). Bogliacino and Pianta
found the overall average lag between innovation efforts and profits was typically 3 to 4
years with manufacturing industries having less of a lag than service industries.
112
Bogliacino and Pianta found the best results occur when technological process
improvements are made simultaneously with product innovation rather than improve one
at the exclusion of the other.
Bogliacino and Pianta (2013) found some firms increase profitability through cost
cutting measures and reducing their workforce. Bogliacino and Pianta noted that process
improvements from incremental innovation do not readily lead to higher product
innovation, and making improvements in process efficiency is not typical in response to
growing demand or product pull. Bogliacino and Pianta noted that short-term speculative
gain is one of the most significant obstacles to innovation success because immediate
profits are often too attractive to resist by TMTs. While some firms consider outsourcing
innovation to achieve immediate profits, Gobble (2013) found there are risks with
outsourcing innovation if not handled thoughtfully. Gobble asserted that short-term cost
savings could easily spiral into a loss of innovation, loss of control, and loss of
knowledge creation and negatively affect long-term financial performance. Bogliacino
and Pianta argued that TMTs tend to make decisions not to reinvest profits into radical
R&D thereby reducing the resources available for knowledge generation required for
longer-term sustainability. Gobble noted that 70% of senior leaders surveyed indicated
that outsourcing innovation had contributed to their firms’ financial performance. The
motivation for outsourcing innovation was to maximize the value of R&D dollars spent
by reducing costs and increasing development speed to bring products to market quicker.
Gobble (2013) found outsourcing innovation is not without its dangers. Gobble
noted that Boeing’s 787 Dreamliner development initiative was an example of a TMT

113
failing to plan for risks, failing to coordinate, failing to share knowledge, failing to
address cultural barriers, and failing to measure the progress of innovation efforts. The
Boeing example illustrates that focusing on short-term financial performance led to a lack
of attention to detail by Boeing’s TMT. Managing innovation outsourcing poorly creates
major problems and has significant negative cost and time implications (Gobble, 2013).
Gobble noted that the loss of innovation knowledge may translate into the inadvertent
creation of competitors. To illustrate the negative effect of the loss of innovation
knowledge, Dell and Apple are examples. Gobble noted that the disruption to Dell’s
business was the result of its suppliers developing products to compete with Dell, and
Samsung started its smartphone business having been only a component supplier to
Apple. The risks of outsourcing innovation include the loss of innovation capabilities and
the loss of knowledge. Outsourcing innovation requires trusted partners. TMTs that lack
the foresight to see the risks of innovation outsourcing may negatively affect long-term
financial performance in their zeal for short-term profits (Gobble, 2013).
Gregory (2013) found a connection between innovation and sustainability using
the Corporate Branding Index (CBI) model. Gregory noted that the CBI shows the
connection between innovation and sustainability and the relationship to financial
performance and economic sustainability using shareholder value and stock price. Kock
et al. (2011) tested several hypotheses to determine whether technical innovativeness had
a positive or negative moderating effect on commercial success. Kock et al. found
innovativeness does not necessarily have a direct, statistically significant positive
relationship with commercial success. Kock et al. noted that technological innovation can

114
have both a positive and a negative effect on firm performance. Kock et al. noted that
innovation may provide a competitive advantage but innovation efforts can also
fundamentally alter the technological trajectory of a firm. Altering a firm’s technological
trajectory may lead to the suppression of existing technologies when new technologies
are not complementary to existing resources particularly when building new capabilities
require additional effort or resources during adoption. Cannibalizing existing capabilities
may occur, and unforeseeable constraints could prevent the successful commercialization
of new technologies (Kock et al., 2011). Kock et al. found technical innovation did not
have a direct correlation with commercial success but had an indirect effect on three other
variables that includes organizational effectiveness, market innovativeness, and
environmental innovativeness. Kock et al. found market innovativeness has a statistically
significant positive relationship and effect on commercial success. Organizational
innovativeness and environmental innovativeness has a statistically significant negative
relationship and effect on commercial success. While Kock et al. noted that the existence
of the indirect effects of technological innovativeness, Koch et al. provided a possible
explanation concerning why there is not a significant and direct link between
technological innovativeness and commercial success in the empirical literature.
Multichannel innovation conundrum affecting sustainability. Some retailers
stymied by the innovations taking place view e-commerce technology as a threat to their
traditional bricks and mortar business and financial sustainability (Aubrey & Judge,
2012). Aubrey and Judge (2012) noted that innovation creates a multichannel ecosystem
that can add value to a brand’s offer and drive consumer preference, particularly when
115
the store network becomes integrated into their supply chain. Examples of innovatively
integrating multiple channels into an eco-system include Adidas stores, Nespresso
Boutiques, Levi’s, and Diesel (Aubrey & Judge, 2012). The retailers in the previous
examples use their flagship stores to showcase their products while their network of
smaller footprint stores specializes in certain products and services designed to target the
needs of local consumers and provide locations for customers to click and pick-up
products (Aubrey & Judge, 2012). Aubrey and Judge asserted that retail brands must
innovate at the business model level plus leverage technology to reinvent their retail store
business model and integrate all channels seamlessly to provide a superior, channel-
agnostic customer experience. Retailers that fail to innovate their business model or
leverage technology put their sustainability at risk (Aubrey & Judge, 2012).
Innovation failure negatively affects brand and sustainability. The reasons why
firms actively attempt to close the innovation gap are evident in Kock et al.’s (2011)
findings. Kock et al. asserted that while innovation may be a two-edged sword, the non-
significant effect of technological innovation on commercial success may influence
variables and act as barriers to innovation. Influential variables may include a variety of
management practices, existing or lack of skilled product champions, TMT support,
quality of communication, marketing strategies, and brand support. Other barriers to
commercialization success include the desire by senior leadership teams to retain the
status quo within its defined market environment, a limitation in TMT abilities,
organizational competencies, process efficiency, power distribution, and willingness to
change to address dynamic markets.

116
Traub and Brettel (2014) found a link between brand image volatility and
financial performance using financial markets data. Talke and Colarelli O'Connor (2011)
noted that many new innovative products fail commercially not because of the product
itself but because the innovating firm does exhibit sophistication to formulate key
messages that address specific customer informational needs. Talke and Colarelli
O'Connor asserted that the innovating firms’ messaging might not adequately address the
perceived risks of new product adoption by potential purchasers along three specific
dimensions. To determine the most relevant product launch message content, Talke and
Colarelli O'Connor tested three dimensions including the usability of information and
product advantages, technical information and the consequences of adoption to reduce
adopter uncertainty, and the financial viability of adoption such as value, risk mitigation,
and warranty. Talke and Colarelli O'Connor found messages that address a product’s
advantages, benefits, usage, and compatibility were effective when launching a new
innovative product. Embedding messages that highlight positive product attributes can
help create positive consumer perceptions to adopt the product. Financial messages that
justify investing in a product purchase and support a purchasing decision were the
strongest predictors of market performance (Talke & Colarelli O'Connor, 2011). Talke
and Colarelli O'Connor found technical message elements were counterproductive
because they have significant negative correlation with market performance. The
counterproductively of technical messaging seems to support the notion that consumers
make purchasing decisions using factors other than just technical information.
Information about new technical features may only confuse or overload consumers when
117
making purchasing decisions by inducing negative perceptions thereby impeding product
adoption (Talke & Colarelli O'Connor, 2011). Talke and Colarelli O'Connor asserted that
when firms launch new innovative technical industrial products, the messaging should
emphasize usability benefits, ease of adoption, and financial advantages such as the value
of the capital invested. The content of the messages firms select helps drive the market
success of new innovative products and enhances financial performance (Talke &
Colarelli O'Connor, 2011).
Tung (2012) noted that innovation has a relationship with firm performance and
sustainability. Tung found innovation helps enhance profitability by improving
productivity and reducing costs. Tung suggested that introducing new products and
services and gaining first mover advantage can help firms to maximize profits before
competitors replicate and introduce substitutes (Tung, 2012). Tung suggested that
investing in R&D is necessary to fuel innovation. Tung argued that many products have a
limited lifecycle and require investments in R&D to ensure new products are available as
older ones reach the end of their lifecycle. Li, Qian, and Qian (2014) suggested adopting
different market entry timing and customer quality strategies particularly when entering
dynamic international markets. Li et al. asserted that different stages of a product
lifecycle may generate above average profits and certain market segments on a temporary
basis. While Tung suggested that TMTs better manage the lifecycle of their firm’s
offerings, TMTs must identify strategic responses to competitors and invest in R&D
efforts to address gaps that hamper profitability or lack of differentiation that could affect
both long and short-term prospects. Tung posited while innovation efforts may include
118
using brand extensions when a brand is strong and can support additional variants to tap
new markets, TMT should be cognizant of not using brand extensions to cannibalize
existing markets. Li et al. noted that TMTs cannot always predict product demand and the
reception of new products and extensions. Hill (2014) noted that innovation teams should
be cross-functional with looped-back learning mechanisms to develop integrated
marketing strategies that address the entire lifecycle of each new model. Hill underscored
the value of a cross-functional approach to product and brand innovation efforts to
capture market share rather than cannibalize existing products. Li noted that some new
products and extensions may be met with hostility across different markets (Li et al.,
2014). Li et al. noted that in some situations, international strategic alliances may be a
source of gathering information on the dynamics of international markets to enhance the
prospect of success in the short-term and over the long-term. Tung argued that the
survival or death of an organization have a dependency on using innovation as a tool to
better manage gaps in a brand’s product lifecycle to provide long-term financial
sustainability.
Reverse-frugal innovation is not appropriate for all markets. Brem and Ivens
(2013) asserted that reverse innovation and frugal innovation use a bottom-up approach
and may not be true innovation. In other words, by reverse-engineering existing
technology from developed, industrialized economies, technology moves in a reverse
direction whereby frugal or reverse innovation meets basic needs of consumers at a low-
cost level. Typically, firms that engage in reverse innovation and frugal innovation are
located in Asia and receive funding from governments (Brem & Ivens, 2013). While
119
reverse innovation and frugal innovation is similar to Abrami’s et al. (2014) description
of creative adaptation, Brem and Ivens asserted that reverse and frugal innovation puts
pressure on the long-term sustainability of Western firms that engage in radical
innovation. The objective of reverse and frugal innovation is to develop a simpler product
with a high benefit but at a very low-cost specifically for low-income market segments
(Brem & Ivens, 2013). Brem and Ivens asserted that frugal and reverse innovation offers
the potential to help firms reduce levels of input resources, become more efficient,
increase competitiveness, and increase sales revenue and enhance financial performance.
Brem and Ivens found little empirical evidence concerning the innovation-sustainability
link from a financial performance perspective given some reverse and frugal innovation
efforts are successful in some markets while other are not. When comparing the
similarities of Abrami’s et al.’s notion of creative adaptation and Brem and Ivens’
construct of reverse and frugal innovation, the approaches produce incremental product
variants of existing technologies, not radical innovation.
From the evidence presented in the literature review, there are several possibilities
why the innovation gap exists. TMTs may contribute to the innovation gap as some
senior leaders have locked-in mindsets (Legrand & Weiss, 2011; Morgan, 2014;
O’Connor & Rice, 2013) preventing TMTs from moving from the status quo preferring to
retain the status quo and existing business models. Chang et al. (2014) thought
challenging the status quo is required to change the innovation paradigm within the ranks
of TMTs. Senior leaders may not understand concepts like ambidexterity as noted by
several researchers (Buyl et al. 2012; Boone, & Mattyssens, 2012; Dierk & Dover, 2012;

120
Lin et al., 2013; Mottee, 2012; O’Reilly & Tushman, 2013; Smith et al., 2010). While
employing ambidexterity allows TMTs to simultaneously balance short-term goals with
long-term objectives, TMTs fail to understand ambidexterity when setting organizational
priorities (O’Reilly & Tushman, 2013). Changing the mindsets of TMT members may be
challenging given TMTs must review their organizational business models (Morris,
2013) and align innovation strategy with the business strategy (Kahn et al., 2012). Nagji
and Tuff (2012) asserted that managing innovation effort as a portfolio rather than as
individual initiatives by establishing separate divisions or entities (Bhattacharyya, 2006;
Morgan, 2014). Some TMTs fail to exhibit the behaviors necessary to motivate and
enable followers to create a culture of innovation (Dierk & Dover, 2012; Morris, 2013;
Schoemaker et al., 2013; Smith et al., 2010; Yuan et al., 2014). O’Reilly and Tushman
(2013) noted that the strategic capabilities TMTs must address include the quality of
TMTs, business models, ambidexterity, quality of communications, training, corporate
culture, and TMT incentives.
Innovation efforts may link to brand perception and brand valuation. McNeal
(2013) asserted that firms should leverage innovative products and services in an
unconventional manner using innovative advertising campaigns to bolster the value of
their brand. Beverland et al. (2010) noted that alignment between brand positioning and
new product innovation requires careful management to influence brand perception.
While a brand is an important asset to manage, some brands may suffer when there is a
perception they are product or service laggards rather than leaders. Fostering brand
awareness based on the authenticity of the brand adds brand value (Gregory, 2013).
121
Perceiving brands as being less than authentic in how they interact with customers can
negatively affect brand valuation (McKinney & Benson, 2013). Corporate social
responsibility efforts and green product innovation also contribute to positive brand
perception and help foster long-term economic sustainability (Arnold & Hockerts, 2011;
Ba et al., 2013; Lampinski et al., 2014; Olsen et al., 2014; Rubera & Kirca, 2012).
Summary and Transition
In Section 1 of this quantitative research study, the objective was to introduce the
reader to my research study and provide a review of the professional and academic
literature. Within the literature review, possible reasons that contribute to the emergence
of the innovation gap include TMTs prioritizing short-term profits at the exclusion of
resourcing innovation efforts. TMTs may also lack the skills and abilities to create a
culture of innovation and embrace ambidexterity, but instead TMTs prefer to maintain
the status quo. I discussed brand as a valuable asset that enhances stakeholder value.
Noted in the literature review is the notion TMTs often fail to understand innovation and
brand management helps drive brand value. I also provided insight into the importance of
innovation and brand value on sustainability.
In my research study, I examined whether a statistically significant correlation
exists between the level of innovation and brand valuation with economic sustainability
using archival research. The independent variables were innovation based on the Forbes
WMIC ranking, and brand valuation based on the Interbrand Brand Value Index. The
dependent variable was economic sustainability based on the DJSI.

122
In Section 2, I provide a description of the role of the researcher, the research
method and design, population and sampling, data analysis, ethical considerations of the
data providers, and issues concerning validity and instrumentation. Section 3 contains a
presentation of the findings from the study including the data analysis, application of the
findings, implications for social change, recommendations for further research, summary
and reflections, and the conclusion.
123
Section 2: The Project
Based on the literature review, innovation and brand appear to have an effect on
the innovation gap and prospects for long-term sustainability. As noted in the literature
review, many factors influence innovation, branding capabilities, and sustainability.
Several factors noted in the literature review appear to be within the sphere of control of
the TMT. The TMT can set the tone for innovation culture through several available
levers should innovation be a priority. Given brands are a valuable corporate asset,
brands also need to be carefully managed given brands can affect long-term
sustainability. By expanding on the literature review, the intent of my research study was
to determine whether there is a significant correlation between innovation, brand, and
sustainability.
Purpose Statement
The purpose of this quantitative correlation study was to examine the relationship
between innovation rankings, brand valuation, and economic sustainability. The
independent variables were innovation ranking and brand valuation. The dependent
variable was economic sustainability. The targeted population for this study was senior
business leaders of publicly traded multinational companies that operate under global
brands within the service and manufacturing sectors. The implications for positive social
change include the potential to encourage senior business leaders to embrace
ambidextrous business models by recognizing the importance of investing in innovation
initiatives to support long-term economic sustainability.

124
Role of the Researcher
The role of the researcher is to identify the problem, form hypotheses, define
terms, secure and collect data, organize and analyze data, and interpret the data and
provide conclusions (Craig & Metze, 1979). The data collection process requires the
researcher to select the most viable data sources to test the stated hypotheses and not
degrade the potential accuracy of the results (Craig & Metze, 1979). In this quantitative
research study, I selected archival data and tested the hypotheses put forward in my
study. Given that I utilized archived data and did not use human subjects in my research
study, the Belmont Report protocol (Belmont, 1979) that addresses the ethical treatment
of live participants was not relevant for this specific study.
After completing the data collection, Craig and Metze (1979) asserted that
researchers must organize data to generate statistics that describe and summarize the
characteristics of the data. Green and Salkind (2014) asserted that standardizing data to
determine the significance of data outputs and to provide inferences about the population
in the study. I organized and used the data to generate several statistics that describe and
summarize the vital characteristics of the generated data sets. The regression model
standardizes the data to determine the significance of the data outputs and to make
inferences about the larger population based on the subjects used in the study. Green and
Salkind noted that SPSS is a useful computer program capable of analyzing data into
information a researcher can use to compute and report the results requiring statistical
analysis. To analyze my data, I used the Statistical Package for the Social Sciences
(SPSS) statistical program, Version 23 (v23.02) to perform the requisite computations
125
needed for statistical testing. The interpretation phase of the research process requires the
interpretation of the results to explain the means of the statistical computations to offer
and support conclusions (Craig & Metze, 1979). Campbell and Stanley (2010) suggested
exercising caution when generalizing results beyond as the interaction effects of selection
biases and the variables could influence external validity. The interpretation phase of the
research process requires an interpretation of the results generated from the statistical
analysis, an explanation of the meaning of results, and the provision of conclusions. From
the statistical analysis, I provided generalizations and exercised caution so that the
interaction effects of selection biases and the variables may affect external validity.
Justifying the findings to another field not represented in the sample requires caution to
maintain external validity (Campbell & Stanley, 2010). Given there are challenges with
justifying the findings to another field not represented in the sample, I did not attempt to
generalize the findings beyond the noted field to ensure external validity.
Green and Salkind (2014) and Minium (1978) noted that rejecting or accepting
the null hypotheses using the correlational computations as the basis for interpreting the
data. I outlined whether to reject or accept the forecasts contained in the null hypotheses
using the correlational computations and an interpretation of the data. Craig and Metze
(1979), Green and Salkind (2014), and Minium (1978) asserted that avoiding incorrect
support for untrue hypotheses requires the correction of possible Type I errors. I
corrected for Type I errors to avoid incorrect support for an untrue hypothesis. Upon
completion of the analysis and interpretation, I summarized and presented the findings,
outlined limitations of the study, and offered recommendations for future research.
126
Participants
Given I used archival data in this research study, live subjects were not required.
As I did not use live subjects, a further discussion on the use of ethical treatment of
participants and protection of human subjects as outlined in the Belmont Report protocol
(Belmont, 1979) was not a requirement nor appropriate. Given I utilized archival data in
this research study, it was appropriate to disclose that I did not have any relationship,
affiliation, or arrangement between myself and the organizations whose data I used in this
research study. I also did not provide nor receive support, paid or otherwise, with the
organizations. There were no known conflicts of interest between myself and the
organizations used in the study.
Research Method and Design
The following section addresses the research method and the research design of
the research study.
Research Method
The objective of the research method used in this study was to determine whether
a relationship exists between innovation, brand valuation, and sustainability by
examining companies that are deemed to be innovators in their operations from an
innovation and sustainability perspective. The best approach to examine the research
question is employing a quantitative methodology and a correlational research design
using archival data analysis. According to Craig and Metze (1979), quantitative designs
are systematic, empirical, controlled, and a critical investigation of hypothetical
propositions about conceivable relationships among phenomena. Researchers consider
127
causality before choosing a research method given the assumption the universe is
uniform, orderly, and governed by cause-and-effect laws (Craig & Metze, 1979). Factors
associated with quantitative methods include generalizability of results and objectivity
associated with quantitative measures (Minium, 1978). My research study contains the
noted factors. Quantitative research is an objective and systematic process to quantify
information about the world and allow for generalizability (Craig & Metze, 1979). The
generalizability of the findings to other populations and settings is likely (Campbell &
Stanley, 2010). The quantitative correlational research method I selected for my study
used a correlation design to examine variables and quantify the relationship between
variables and facilitates generalizability of the findings to other populations.
The quantitative research method of correlational design is the best method to use
when examining the relationship between variables (Craig & Metze, 1979; Green &
Salkind, 2014; Minium, 1978). An objective of my research study was to examine the
relationship between variables. If a relationship exists between the variables, using
quantitative methods allows a researcher to make predictions about the population of the
study that other methods would be unable to make (Craig & Metze, 1979; Simon, 2013).
Selecting quantitative methods to examine the relationship between variables
facilitates the testing of null hypotheses and can predict and confirm the relationship
between the variables (Craig & Metze, 1979; Minium, 1978; Simon, 2013). According to
Craig and Metze (1979), Minium (1978), and Simon (2013), quantitative methods are
most appropriate to test the hypotheses while other methods such as qualitative methods
are best for learning through observation and experience. I considered other research
128
methods, but there were challenges to overcome including time, resource constraints, and
inability to use scientific methods to examine relationships. Qualitative methods has
validity and reliability issues because the research occurs in a natural setting making the
study difficult to replicate (Simon, 2013). I did not select qualitative methods given the
objective of my research was to examine a particular social phenomenological interaction
or event and develop appropriate hypotheses for testing rather than use methods
associated with observation and experience. While mixed methods research can provide
rich information to enhance the research findings, the use of mixed methods also requires
extensive data collection and analysis (Simon, 2013). Using mixed method is not
appropriate given the challenges associated with time constraints and resources
limitations required to conduct mixed method studies (Creswell & Plano Clark, 2007).
Given the limitations and challenges of time and data collection, quantitative research
methods were appropriate for me to address the research questions and the constraints of
time and resources.
Research Design
The selection of the research design is dependent on the business problem and
context of the study (Craig & Metze, 1979). Using correlational analysis allows a
researcher to examine hypothesized relationships between variables while excluding
other plausible hypotheses or explanations (Campbell & Stanley, 2010; Craig & Metze,
1979)I hypothesized relationships between variables in my research study while
excluding other plausible hypotheses or explanations; the appropriate research design I
selected was correlational analysis to examine the relationship between variables.
129
According to Simon (2013), correlational design is a data analysis procedure that
examines the relationship between variables and describes the direction and strength of
relationships among variables (Campbell & Stanley, 2010; Craig & Metze, 1979). Using
a correlational design to examine the relationship between known multiple variables is
suitable for testing hypotheses and providing insight into social phenomena, and is
effective at identifying and describing possible relationship between several variables
under examination (Craig & Metze, 1979; Green & Salkind, 2014; Minium, 1978).
Correlational research does not imply causation nor does it attempt to infer cause-and-
effect as in causal-comparative research (Craig & Metze, 1979; Simon, 2013).
Correlational research only infers a relationship exists between variables, and the use of
correlational research is appropriate to assess the relationship between the variables in
this study (Campbell & Stanley, 2010). Research problems having two or more variables
require a correlational design to examine relationships among variables (Craig & Metze,
1979; Green & Salkind, 2014). Using a regression procedure determines the direction and
strength of the interaction between the predictor variables and the dependent variable
(Minium, 1978).
While correlation does not equate to causation, statistically significant
correlations provide the ability to interpret the data to assess a plausible causal hypothesis
to explain the relationships (Campbell & Stanley, 2010; Craig & Metze, 1979; Simon,
2013). A correlational research design is a suitable method of examining the research
question and underlying predictive assumptions about relationships between variables
(Minium, 1978). Analysis of variance enables a researcher to use multiple independent

130
variables and determine the effect on the dependent variable (Minium, 1978).
Establishing a significant relationship between the variables allows a regression equation
to offer predictions about the study’s population (Simon, 2013).
I considered other research designs. In quasiexperimental and experimental
research designs, establishing a baseline, administering treatment, imposing sequencing,
and assessing the effects of treatment is possible (Campbell & Stanley, 2010; Craig &
Metze, 1979). Quasiexperimental or experimental designs allow a researcher to control or
manipulate treatment and observe the effect (Campbell & Stanley, 2010; Craig & Metze,
1979). Correlational methods are unlikely to establish causation (Campbell & Stanley,
2010) and provide an indication of an association between variable (Simon, 2013).
Claiming causation is not possible when the manipulation of an independent variable and
resultant effect is not possible as correlation is not an indicator of causation (Craig &
Metze, 1979; Simon, 2013). Using a quasiexperimental or experimental design requires
establishing a baseline, administering treatment, and assessing the treatment effect that
might create causation and change the performance variables (Campbell & Stanley, 2010;
Craig & Metze, 1979). In my study, it was not possible to claim causation given the
manipulation of an independent variable and resultant effect is not possible particularly
when using archival data. Using a quasiexperimental or experimental design was clearly
not suitable for my study as establishing a baseline, administering treatment, and
assessing the treatment effect that might create causation and change the performance
variables is not possible. Given my research study relied on archival data rather than on
the manipulation or control of variables to determine the effect of treatment as in
131
experimental or quasiexperimental designs, neither design was appropriate to address the
research problem.
Population and Sampling
Population
A population refers to a group of persons a researcher wishes to make
observations, measurements, and draw conclusions about (Minium, 1978). Craig and
Metze (1979) noted that after the formulation of plausible hypotheses a researcher must
be clear on the study population and the best method to select a sample from the
population. The choice of the populations must be appropriate, not too narrow or too
broad, for testing hypotheses (Craig & Metze, 1979). The selection of the population also
outlines the general descriptive characteristics for the intended group of a research study
(Simon, 2013). In other words, a population consists of the subjects a researcher intends
to study. The intended population of this study included companies judged to be
innovative by Forbes WMIC. Forbes WMIC lists and ranks the innovativeness of
companies in their database (Dyer & Gregersen, 2015). The Forbes WMIC is a research
database that measures the R&D expenditures as a percent of revenue, and the innovative
performance of over 1,000 companies in global markets (Dyer & Gregersen, 2015). The
Forbes WMIC is limited to publicly listed companies (Dyer & Gregersen, 2015). In this
study, I used a population of global companies ranked by the Forbes WMIC in 2015 and
2012. The Forbes WMIC utilizes stock market filings from global regulatory agencies
and corporate annual reports and assembles the financial components for use in their
database (Dyer & Gregersen, 2015). Forbes WMIC applies a propriety formula from the

132
HOLT division of Credit Suisse to determine a firm’s innovation premium and the
rankings (Dyer & Gregersen, 2015). Since 2011, there is recognition the Forbes WMIC is
a comprehensive assessment examining the relationship between R&D investment and
innovation (Dyer & Gregersen, 2015).
The companies listed in Strategy&’s 2015 Global Innovation 1000 Index study
account for approximately 40% of global R&D spending while the next 1,000 largest
R&D spenders represent 3% of global R&D expenditures (Jaruzelski et al., 2014).
However, Dyer and Gregersen (2015) noted that companies that spend more on R&D to
bolster their innovative efforts are not necessarily innovative, nor are they good
investments but rather spend on continuing historical programs. Forbes WMIC stresses
its innovation premium approach stresses projected future cash flows for the next 2 years
derived from expected growth and revenues. Expected revenues are attributable to true
innovation associated with new products, services, or markets (Dyer & Gregersen, 2015).
Forbes and Credit Suisse HOLT do not disclose detailed information on the components
that comprise the Forbes WMIC or its methodology. Forbes WMIC does not normalize
its ratings across the overall company domain or individual industry categories when
reporting financial data (Dyer & Gregersen, 2015). However, while the rankings provided
are ordinal, they do not correlate to total company R&D expenditures or as a percentage
of revenue (Dyer & Gregersen, 2015). Some firms, such as Apple and Google, who spend
billions on innovation slipped in ranking in 2015 from previous years because other firms
had higher innovation premiums. Given Forbes WMIC ranks firms by their level of

133
innovation premium, the ranking was relevant to this study to determine whether the level
of innovation was a predictor of sustainability.
In this study, the brand valuation data was from the Interbrand Brand Value
Index. Interbrand conducts brand valuations to determine how a brand contributes to the
business results of a company’s metrics and predicts how likely the brand will contribute
to financial performance in the future (Interbrand Methodology, 2015). Interbrand
evaluates brands using criteria including financial analysis, the role brands play in the
purchasing decision separate from other purchasing factors, and brand strength using
loyalty and demand for a brand’s offerings (Interbrand Methodology, 2015). Interbrand
utilizes financial data feeds from Thomson Reuters, consumer goods data on volumes and
values from Datamonitor data feeds, and from social media data feeds such as Twitter as
input into its rankings (Interbrand Methodology, 2015). Interbrand’s criteria for inclusion
in the Brand Value Index requires a brand to have: (a) publicly available performance
data; (b) the expectation of positive after-tax operating profit with a return above the
company’s cost of capital; (c) a public profile to generate brand awareness; (d) global
presence with a minimum of 30% of its revenue derived from outside of its home region;
(e) coverage in emerging markets; and (f) a significant presence in Asia, Europe, and
North America (Interbrand Methodology, 2015).
Narayan (2012) noted that three valuation methods including business finance-
oriented models using stock market capitalization, behaviorally-oriented models using
assets and liabilities linked to a brand’s image and perception, and a composite of
business finance and behavior oriented models plus estimates of risk to adjust potential

134
earnings. Attila (2014) noted that three measurements of brand value measurements
includes price premium, revenue premium, and profit premium, price premium was more
strongly correlated to brand equity when comparing other methods. Duguleană and
Duguleană (2014) noted that strong brands usually offer a competitive advantage over
their competitors and tend to be profitable over the long-term. Narayan (2012) asserted
that while there is no general agreement on one valuation method because firms compute
brand valuations based on different accounting objectives each may have, there is a
preference for a multidimensional, integrated, and holistic approach. Given the arguments
to use a brand valuation index that focus on a composite of price premium, profitability,
and brand perception, there is value in selecting a brand valuation that captures these
metrics in a standardized manner. Interbrand’s brand valuation methodology meets strict
standardization requirements making it appropriate for this research study. In 2010, the
British Standard Institute (BSI) and the International Organization for Standardization
(ISO) created the BSI ISO 10668 Brand Valuation: Requirements for Monetary Brand
Valuation (Duguleană & Duguleană, 2014). The ISO 10668 standard is a framework for
standardizing the method used to derive brand valuation based on financial value, brand
contribution, and brand value (Duguleană & Duguleană, 2014). Interbrand’s brand
valuation methodology complies with the ISO 10668 standard (Duguleană & Duguleană,
2014) and is an important consideration for the selection of database for use in this study.
Selecting the values from the Interbrand database must align with the sample selected
from the Global Innovation 1000 Study and the DJSI.
135
Using data from the DJSI (2014) provided sustainability scores for the research
study. The composition of the DJSI is 1,813 global companies (Robecosam Sustainability
Investing, 2014). The corporate sustainability data provides an assessment of companies
by monitoring news media, publicly available information from stakeholders, consumer
organizations, nongovernment organizations (NGOs), and government agencies
(Robecosam Sustainability Investing, 2014). Ongoing assessment of companies includes
the monitoring of companies’ involvement and responses to environmental, economic,
and social crises that affect a firm’s core business and reputation (Robecosam
Sustainability Investing, 2014). DJSI uses a Total Sustainability Score (TSS) to create an
assessed universe and subsequently segments data by geographical regions and industry
(Robecosam Sustainability Investing, 2014). Key criteria included tax strategy and
transparency, social and environmental reporting, human capital development, and
performance scoring on best-in-class occupational health and safety practices
(Robecosam Sustainability Investing, 2014). The DJSI uses the Global Industry
Classification System (GICS) to classify industries but excludes some industries for
various reasons (Robecosam Sustainability Investing, 2014). The assessment of
sustainability by Dow Jones excludes companies who derive their revenue from vice
products and services including tobacco, alcohol, gambling, adult entertainment,
armaments, weapons, firearms, and nuclear power generation (Robecosam Sustainability
Investing, 2014). Dow Jones assigns a sustainability score by assessing eligible
companies (Robecosam Sustainability Investing, 2014). The DJSI updates the
sustainability assessments annually and delists companies when substantial changes
136
occur to a company’s status due to a merger, acquisition, or divestiture activity, or
delisting from capital markets (Robecosam Sustainability Investing, 2014). Financial
reporting is in U.S. dollars (Robecosam Sustainability Investing, 2014). Eligible U.S.-
based companies listed in the DJSI’s North America Report rolls up to the DJSI World
Report (Robecosam Sustainability Investing, 2014). The scores from the DJSI represent a
sustainability metric to determine whether innovation levels and brand value influence
sustainability scores that the Dow Jones reports.
A further discussion regarding reliability and validity of the data appears in the
results section of this study.
Sampling
A sample consists of a subset or part of a population (Minium, 1978; Simon,
2013). There are several methods of sampling a population including systematic sampling
using a predetermined procedure, representative or a deliberate sample using assumed
characteristics that resemble a population, and casual sampling using a human
randomizer where the researcher attempts to choose at random from available subjects
often using subconscious preference (Minium, 1978). Random sampling is a technique to
select participants from a population with the equal probability of selection for the
purpose making statistical inferences that apply to the population (Craig & Metze, 1979;
Minium, 1978; Simon, 2013). There are advantages of using random sampling including
the elimination of sampling bias by impartially assigning extraneous influence among the
comparative groups (Minium, 1978). According to Minium, randomization provides a
type of control over known or unknown extraneous influences and tends to produce

137
equality. Craig and Metze (1979) noted that randomization could minimize the chance of
systematically relating or confounding extraneous variables with the independent
variable. The tendency to produce equality increases as sample size increases (Minium,
1978). Randomization also provides the ability to generalize the findings of a study to a
larger population (Craig & Metze, 1979; Simon, 2013). The disadvantage of random
sampling is that even as the size of a random sample increases, sometimes sample
variances cause sample differences that are not attributable to the independent variable
(Craig & Metze, 1979). According to Simon, and Craig and Metze, random sampling
requires careful planning to avoid confounding extraneous factors with the independent
variable.
Drawing a random sample from a population is sometimes difficult and using a
representative sample of convenience is necessary (Craig & Metze, 1979; Simon, 2013).
Selecting a nonprobability sample of convenience requires choosing characteristics that
closely resemble the population (Craig & Metze, 1979; Simon, 2013). The advantage to
using convenience sampling is the ability to use data results readily available (Simon,
2013). There are limitations of using convenience sampling. By using a sample of
convenience, there is a possibility of not selecting any member of a population, which
introduces bias and limits the generalizability of the results to a broader population
(Minium, 1978). Also, appropriate generalizations and inference of the findings to a
broader population is sometimes difficult due to the possible introduction of bias (Craig
& Metze, 1979; Minium, 1978; Simon, 2013). Given the approach of this study and

138
reliance on using existing index and ranking data, convenience sampling was the
sampling method for this research study.
The selection of companies for this study required using a sample of convenience.
Using the data available, I examined the relationship between innovation, brand
valuation, and economic sustainability in this research study. As noted in the limitations
section of this study, I did not have control over the collection of archival data. While
many companies undertake continuous incremental innovation or engage in R&D
activities to develop disruptive technologies, the criteria for this study requires that
companies had a listing in Forbes WMIC 2015. The sample of companies used in this
research study have a brand value and rating assigned by Interbrand Brand for 2015, and
a sustainability rating by the DJSI for 2015. A sampling of ordinal data points from the
Forbes WMIC fits with the purpose of the study and uses the criteria required to conduct
this study. Determining the final and total number of valid data points required an
examination of the datasets from each data provider. I expected the availability of
sufficient data from the data providers to meet the minimum sample size required for this
study.
Given I used archival data rather than live subjects in this study, committing Type
I errors when interpreting the results of the statistical analysis was possible. A Type I
error occurs when a true hypothesis is falsely rejected and more serious than a Type II
error (Craig & Metze, 1979; Simon, 2013). According to Minium (1978) and Armstrong
(2014), ensuring statistical validity and committing Type I errors requires a sufficient
sample size. Simon (2013) also noted the importance of selecting an appropriate sample
139
size to avoid sampling errors. A sample size that is sufficient is less prone to overlap
between the two distributions and reduces the risk of drawing a sample that leads to the
false acceptance of the hypothesis (Minium, 1978). To calculate the correct sample size,
using the G*Power software tool can determine the appropriate sample size for a study
(Faul, Erdfelder, Buchner, & Lang, 2009; Simon, 2013). According to Faul et al., using
the G*Power tool provides the minimal sample size sufficient to address errors of
statistical validity. To calculate the sample size, I used the G*Power software tool
Version 3.1.9.2 to determine the appropriate sample size for this research study. Given
there are no expectations of a correlation, a medium effect size (f2 = 0.15) is appropriate
(Cohen, 1992). Using the parameters of the power of error probability of 1 - β = 0.80, the
error probability of 95% (α = 0.05), and the number of predictors variables set at two, the
appropriate study sample size is 68 as shown in Figure 1. Using the G*Power tool to
increase the power of error probability to 95 (1 - β = 0.95) yielded a sample size of 107.
The sample sizes calculated using the G* Power tool match the sample sizes in Cohen’s
table of effect size for the appropriate confidence level. The original intent was to use
over 100 data points for the final sample size depending on aligning the data from
selected indices.

140
Figure 1. Power as a function of the sample size to minimize statistical errors.
Ethical Research
The Belmont Report is a standard protocol that addresses the ethical treatment of
live participants (Belmont, 1979). There are several categories of live participants that the
Belmont Report protocol addresses (Belmont, 1979). In the Belmont Report protocol
document, decision trees help determine whether a research activity involves human
subjects or uses existing data documents (Belmont, 1979). Subject to the Code of Federal
Regulation Part 46 (CFR 46), Chart 5 of the Belmont Report decision tree illustrates that
research using existing and publically available data documents is exempt from the
Belmont Report protocol (Belmont, 1979). Given that this research study relies on using
existing data, does not use live participants to collect data, and does not identify
organizations in the presentation of the findings, the Belmont Report protocol was not
relevant to this research study.
Walden University requires Walden University students obtain IRB approval for
research studies that use archival data (Guide for Archival Researchers, 2015). Before
0.6 0.65 0.7 0.75 0.8 0.85 0.9 0.950
20
40
60
80
100
Tota
l sam
ple
size
= 0.15
Effect size f²
F tests - Linear multiple regression: Fixed model. R² deviation from zeroNumber of predictors = 2. α err prob = 0.05. Effect size f² = 0.15
Power (1-β err prob)

141
proceeding with the study, I obtained approval from Walden University’s Institutional
Review Board (IRB) to comply with the standards and principles of ethical research set
out by Walden University (Guide for Archival Researchers, 2015). Walden University
provided an IRB approval number to verify compliance and approval of this study
(Research Ethics, 2015). To safeguard the use and treatment of the existing data from
database stakeholders, I complied with Walden University’s directive that I complete the
standard IRB application and leave items 37-51 blank (Guide for Archival Researchers,
2015). My research study IRB approval number (01-15-16-0479729) was issued by
Walden University to authorize my research study.
No known or anticipated relationship existed between the database stakeholders
and myself. No known or anticipated incentives or payment exchange arrangements
existed between the data providers and myself to conduct the research. Therefore, the
conduct of my research was in compliance with Walden University ethical research
guidelines (Research Ethics, 2015). Walden University’s Internal Review Board (IRB)
requires retaining data for 5 years (Research Ethics, 2015). The 5-year data retention rule
applies to the data obtained from and provided by Forbes, Interbrand, and Dow Jones.
Data storage and retention of data on a password-protected portable thumb drive locked
in a secure Sentry fireproof safe for 5 years complies with Walden University’s standards
for data retention (Research Ethics, 2015). Permanent destruction of the data files will
occur upon expiry of the retention period (Research Ethics, 2015).
142
Data Collection
Instrumentation
Given I used archival data in my study, the discussion on data collection is limited
due to the proprietary nature of the instruments each data provider uses. Although the
indices from third parties use proprietary methodologies that are not available for
enhanced levels of scrutiny, there is precedence in using indices. Scholars such as Gobble
(2013) have used Forbes WMIC since its inception. Larson (2011) has used the
Interbrand rating and ranking as part of addressing the value and importance of brands.
Lourenço, Branco, Curto, and Eugénio (2012) have used data from the DJSI as a
component of their research. Given the purpose of this study, the following is a
discussion of the three indices representing the variables in this research study and the
data collection methodology of each index.
Data from Forbes WMIC ranking represents the independent variable of
innovation in this research study. Forbes developed the Forbes WMIC ranking and
methodology in 2011 to investigate the difference between a firm’s market capitalization
and net present value (NPV) of the next two years of projected cash flows using a
proprietary formula from Credit Suisse HOLT. The difference between market
capitalization and net present value of cash flows is the premium attributable to profitable
new growth from future new products, services, and processes (Dyer & Gregersen, 2015).
Forbes does not rank companies by R&D expenditures to rank innovativeness within
industry categories (Dyer & Gregersen, 2015). Forbes and Credit Suisse HOLT obtain
and analyze key financial metrics on over 45,000 companies from publicly available

143
sources and indices (Dyer & Gregersen, 2015). The companies Forbes and Credit Suisse
HOLT analyze must have 7 years of financial data available including market
capitalization, R&D expenditures, profits, sales, and surveys innovation leaders to gauge
their views on innovation (Dyer & Gregersen, 2015). However, the number of patents
filed is not a benchmark for innovation as the patent filing benchmark may be meaningful
within an industry classification (Dyer & Gregersen, 2015). Brand value and other
tangible assets do not contribute to the innovation premium calculation (Dyer &
Gregersen, 2015). Forbes and Credit Suisse HOLT exclude mining and financial service
companies from the innovation premium formula (Dyer & Gregersen, 2015). Detailed
information on the instrumentation Forbes and Credit Suisse HOLT use to calculate the
innovation premium and rankings is sparse due to the proprietary nature of their research
methodology (Dyer & Gregersen, 2015). Forbes provides an ordinal ranking metric that
represents a comparison to other peer companies on the overall level of innovativeness
(Dyer & Gregersen, 2015).
Data from Interbrand’s Best Brands represents the independent variable of brand
value in this research study. The Interbrand Best Brands study began in 1988 and ranks
brand valuation (Interbrand Methodology, 2015). From the beginning of brand valuation
methodology, firms have evolved the brand value metrics to assess factors including the
ability of a brand to influence consumer choice, to attract, create, and retain brand loyalty
(Interbrand Methodology, 2015). The three components in Interbrand’s brand valuation
methodology include financial performance of the brand, the role of the brand in
purchasing decisions, and the competitive strength of the brand (Interbrand Methodology,
144
2015). The Interbrand uses several sources to assess financial data including annual
reports, data feeds from Thomson Reuters, brand volumes and values from Datamonitor,
and social media posts on Twitter (Interbrand Methodology, 2015). Detailed information
on the instrumentation used by Interbrand is limited although brand valuation, and brand
ranking is relative to their other peer companies (Interbrand Methodology, 2015). In my
research study, I used ordinal data based on Interbrand’s reported brand value rankings.
The DJSI launched in 1999 as a family of indices to evaluate the sustainability
performance of the largest 2,500 companies listed on the Dow Jones (Robecosam
Sustainability Investing, 2014). Since its inception, the DJSI evolved to provide regional
indices (Robecosam Sustainability Investing, 2014). The DJSI uses information that
includes the use of the annual RobecoSAM questionnaire, company annual reports,
media coverage, social media, and direct contact with companies (Robecosam
Sustainability Investing, 2014). RepRisk ESG Business Intelligence tracks corporate risk
and is input to assess sustainability as a component of the overall methodology
(Robecosam Sustainability Investing, 2014). The DJSI uses three dimensions of
sustainability that include environmental, social, and economic as part of their
sustainability assessment criteria (Robecosam Sustainability Investing, 2014). Detailed
information on the DJSI instrumentation is limited since Dow Jones claims it is
proprietary (Robecosam Sustainability Investing, 2014). In my research study, I used
ordinal data from the DJSI’s reported rankings.
In my research study, I used archival data that provides a relative ranking based
on several criteria, and the scale of measurement. Given that the data from the database

145
providers report rank order to present their findings, using ordinal data was appropriate
for my research study. Ahn and Choi (2012) noted that the use of ordinal data is
sometimes the best alternative over a multitude of alternatives. Where a multiple of
alternative bases for making decisions exists such as criteria, attributes, objectives, or
data to choose from, the decision-making process should have two phases (Ahn & Choi,
2012). The first phase of the decision-making process is the construction of the problem
and data preparation with the second phase being aggregation and exploitation (Ahn &
Choi, 2012). According to Ahn and Choi, sometimes there is difficulty developing a
construct using a theory that is completely consistent with the data available. The use of
ordinal scales for each of the indices does not imply the magnitude of the difference
between the construct represented by each index, but that one company exhibits the
construct represented by the index in amounts greater than others (Craig & Metze, 1979).
Ordinal scales represent not only differences but also the relative magnitude of
differences (Craig & Metze, 1979). The number identifies an event, object, or
phenomenon as belonging to a category that has similar attributes or criteria that are
distinct from another category (Craig & Metze, 1979). Also, the magnitude of the
difference between the criteria or attribute within the construct or category is not
indicative of the number on the ordinal scale (Craig & Metze, 1979). A number on the
ordinal scale only reflects the relative difference where one value is bigger or smaller
than the other (Minium, 1978). The use of ordinal ranking methods spans over 200 years,
but the challenge of using ordinal data lies in how to differentiate among the rank
positions (Ahn & Choi, 2012). Differentiation among the rank positions can be difficult
146
and for the researcher to specify their preference for using weighted averages or rank
orders (Ahn & Choi, 2012). The method used by the database providers produces other
metrics that may not account for other criteria captured within each of the indices.
Data Collection Technique
Data collection for this study proceeded after receiving IRB approval to comply
with Walden University’s guideline for data collection using archival data (Guide for
Archival Researchers, 2015). I collected data by accessing archival data contained in the
Forbes WMIC database that comprises the innovation data required for this research
study. I contacted the data provider and requested datasets via e-mail request from the
appropriate resource. The archival data is available to the public without charge. I
collected additional data from existing archival data records for the brand valuation
measure contained in the Interbrand Brand Value Index. Archival data on sustainability
rankings came from Dow Jones. Archival data is normally available to the public without
charge from Dow Jones. To facilitate sampling, I used a sample of convenience as
outlined by Craig and Metze (1979) and Simon (2013). While randomization provides
control over known or unknown extraneous influences and tends to produce equality
(Minium, 1978), I used a sample of convenience because the data was available and the
sample best represented the companies with the desired characteristics of the population
to be studied. Using a convenience sample has limitation including the ability to
generalize the findings of a study to the population represented by the sample (Craig &
Metze, 1979; Simon, 2013). Once I collected data on innovation, brand valuation, and

147
economic sustainability, I entered the data into the into a Microsoft Excel spreadsheet
consisting of rows and columns to facilitate data capture and to prepare the data analysis.
The use of archival data has its advantages over other methods including a
reduction in time and cost to initially collect and analyze data (Simon, 2013). However,
the use of archival data also has some drawbacks. Access to the correct secondary data
sources and format of the data may present challenges to the researcher. The
disadvantages include limitations to the sample size given the parameters estimated in
each of the data providers’ models, unknown researcher bias, and the reliance on the
accuracy, reliability, and validity of the underlying data collection tools (Yuan et al.,
2014). Also, a researcher may not be able to control for confounding variables for
observed differences that a true experimental design would allow for as noted by
Campbell and Stanley (2010).
Data Analysis
Based on the research question developed, I used quantitative methodology in my
research study to answer the following questions:
For the entire sample, does brand value have a correlation with sustainability?
For the entire sample, does innovation have a correlation with sustainability?
According to Craig and Metze (1979), in quantitative research the researcher
establishes hypotheses that offer a tentative explanation or a prediction of an expected
outcome among variables. For a hypothesis to be useful in research, it must be definable
and testable (Craig & Metze, 1979). Interpreting correlation results requires caution by a
researcher given that a causal interpretation of a correlation depends on a plausible causal
148
hypothesis and the absence of plausible rival hypotheses (Campbell & Stanley, 2010). By
testing hypotheses using statistical processes, researchers can develop inferences about
the attributes of specific populations (Craig & Metze, 1979). According to Minium
(1978), formulating a hypothesis provides specific parameters of a test population for
determining whether the hypothesis is true or rejected. To address the research questions
and infer certain attributes to specific populations and to avoid Type II errors, I tested the
null and alternative hypotheses using a p value of less than .05 to reject the null
hypotheses. According to Simon (2013), p values measures the level of confidence in
rejecting a null hypothesis. According to Minium, using a p value of less than .05 to
reject the null hypotheses is satisfactory given that the level of significance keeps Type II
errors under control while adequately controlling for Type I errors. According to Craig
and Metze, the level of significance is typically 0.05 to control for Type I and Type II
errors. According to Simon, a p value of between 0.01 and 0.05 indicates significant
statistical evidence to reject a null hypothesis and to accept the alternative hypothesis. A
p value above 0.05 indicates insufficient evidence to reject the null hypothesis such that
the null hypothesis is accepted, and the alternative hypothesis is rejected. The null and
alternative hypotheses tested were:
Null Hypothesis (H01): There is no relationship between innovation ranking and
economic sustainability.
Alternative Hypothesis (Ha1): There is a relationship between innovation ranking
and economic sustainability.

149
Null Hypothesis (H02): There is no relationship between brand valuation and
economic sustainability.
Alternative Hypothesis (Ha2): There is a relationship between brand valuation and
economic sustainability.
I tested the hypotheses using 2015 data for all variables and repeated using 2013
data for the independent variable and 2015 data for the dependent variable to determine if
there was a delay effect. I collected innovation data from the Forbes WMIC, brand
valuation data from the Interbrand Brand Value Index database, and sustainability data
from the DJSI database. According to Craig and Metze (1979), once data collection is
complete, the data requires scrutinization. While missing data is beyond my control,
missing data is less likely when using archival data (Simon 2013). When data cases are
missing, rather than transform data and compute a mean for the affected variable as that
process carries risk, missing cases should be excluded (Green & Salkind, 2014). Once
obtaining the dataset, I entered the values into a Microsoft Excel spreadsheet. Next, I
imported data from the Microsoft Excel spreadsheet into SPSS Version 23 software for
statistical analysis. To address research questions 1 and 2, I performed a multiple
regression test to determine whether there is a statistically significant relationship
between the variables. Regression testing is suitable to examine the overall effect and
effect size of the predictor variables on the dependent variable in a study (Green &
Salkind, 2014; Minium, 1978). Using a regression procedure is appropriate for the use of
multiple independent variables (Craig & Metze, 1979; Green & Salkind, 2014; Simon,
2013). In my research study, I tested two independent predictor variables using a
150
regression procedure. Simon (2013) noted that the effect on the results may not be serious
if there are departures from normal distributions. Given the possibility of having limited
data and needing to resample residuals and remodel the data to normalize the distribution,
bootstrapping is an appropriate procedure for regression models (Freedman, 1981;
Simon, 2013). Using bootstrapping is suitable when parametric assumptions are in doubt,
when questions of normality arise, size of variance is large, and the sample size may be
inadequate (Simon, 2013). A bootstrapping also tests the reliability of the dataset and
control for the stability of the results (Simon, 2013). To address potential issues of
parametric inference that may not be apparent, performing a bootstrapping procedure is
appropriate when using regression to normalize the data during analysis. While
conducting a follow-up test assesses a claim of a possible correlation between variables
(Green & Salkind, 2009), its use is not typical with regression procedures but is more
appropriate for ANOVA procedures (Simon, 2013).
A positive correlation where the R value is between 0 and +1, or a negative
correlation where the R value is between 0 and -1 (Green & Salkind, 2014; Simon, 2013).
Where the R value is close to 0, likely no significant linear correlation exists between the
variables (Green & Salkind, 2014; Simon, 2013). Calculating the R2 value provides an
indication of the strength of the effect size a predictor variable has on the dependent
variable (Green & Salkind, 2014; Simon (2013). Levine and Hullett (2002) noted that eta
squared known as η2 for ANOVA procedures and R2 for regression procedures, provides
the direction of a correlation and specifically an indication of the effect size of the
predictor variable on the dependent variable. Levine and Hullett noted that reporting

151
partial eta rather than reporting R2 or adjusted R2 provides misleading results. I computed
the R2 value using SSPS version 23 to determine the strength of the correlation and
specifically the effect size of the predictor variables on the dependent variable. I
considered other statistical procedures such as the Pearson’s r correlation procedure, but
this procedure is more suitable to compare two continuous and quantitative variables
(Minium, 1978; Simon, 2013). I considered using the Spearman’s Rho correlation, a
technique suitable for rank order correlation, but the Spearman’s Rho correlation is better
suited for smaller sample sizes and two variables (Minium, 1978; Simon, 2013). Using an
ANOVA procedure is possible and considered but Levine and Hullet noted that in some
instances effect sizes are misreported in SPSS outputs for 2+ way ANOVAs. Using the
Mann-Whitney U test is possible but using this test has limitations when comparing
internal-scaled dependent variables with scores from the same distributions that are
normal, and the sample sizes tend to be small (Craig & Metze, 1979; Green & Salkind,
2014; Minium, 1978).
The datasets from Forbes and Interbrand are publically available. Data from Dow
Jones is not publically available and I was required to submit a formal request to Dow
Jones requesting access to and use of the data in compliance with Walden University’s
guidelines (Guide for Archival Researchers, 2015). A signed nondisclosure agreement
with Dow Jones appears in Appendix B of this study. The data from the database
stakeholders use proprietary instruments as outlined in detail in this study. Once
obtaining the datasets, I reviewed the data and selected the companies that had the
required variables and met the data needs. I used archival data for this research study
152
using the assumption that the archival data provided by the firms is complete and
accurate. I used a sample of convenience from the available data although using a random
sampling technique is more desirable to addresses the issue of external validity (Craig &
Metze, 1979; Minium, 1978; Simon, 2013). Addressing the issue of external validity in
this research study has limitations given I used a sample of convenience thereby limiting
generalizability to the population represented by the sample.
Conducting the regression procedure required importing raw data into SPSS
Version 23 software for statistical analysis. I interpret and present the results from the
regression procedure regarding the statistical correlation between the independent
variables and the dependent variable, and provide the results for the strength of the model
and the effect size of the variables. Using a confidence level set at 95%, results that show
p < 0.05 require the acceptance of the null hypotheses (Green & Salkind, 2014; Minium,
1978; Simon, 2013). For values where p >.05, I reject the null hypotheses.
Study Validity
Reliability and validity of the instrument to assess sustainability for this study
requires discussion. Given I used archival data, my research study relied on three
proprietary instruments (a) the Forbes WMIC rankings which assesses innovation (Dyer
& Gregersen, 2015), (b) the Interbrand Best Brands Report that assesses the brand value
component of a firm’s valuation (Interbrand Methodology, 2015), and (c) the DJSI that
assesses sustainability performance (Robecosam Sustainability Investing, 2014).
Discussing the choice of each instrument ensures reliability and validity for this type of
study.

153
Study Validity
Issues of internal validity from testing effects include history, maturation, testing
effects on participants, instrumentation bias and decay, respondent biases, experiential
mortality, and confounding interactions (Campbell & Stanley, 2010). According to Craig
and Metze (1979), there are several methods used to control experimental conditions that
affect systematic variables issues such as randomization of participants and the research
design to prevent extraneous variables from confounding the results. While Minium
(1978) noted that randomization is a type of control over extraneous influences,
Campbell and Stanley (2010) noted that the use of randomization in laboratory
experiments may address issues of internal validity rather than only external validity.
Simon (2013) noted that other threats to validity including the Hawthorne Effect,
sensitization from pre and posttesting, novelty effect, and inadequate power that could
lead to Type I errors. Threats to statistical conclusion validity may include a Type I error
given the possibility of falsely rejecting a null hypothesis when testing more than one
hypothesis. To minimize Type I errors, the alpha used in each correlation tested was set
at 0.05. As noted by Freedman (1981), bootstrapping is a resampling procedure for
regression models when the data may be parametric. While Armstrong (2014) and Green
and Salkind (2014) noted that the Holm’s sequential Bonferroni method is the preferred
method for evaluating hypotheses to minimize Type I errors, this procedure is not
available for regression models. To minimize Type I errors, I used a bootstrapping
procedure in this research study. Given that I used archival data in this research study
from other database stakeholders and not primary research, I must rely on the database
154
stakeholders’ data collection process and their efforts to address issues of internal validity
related to instrumentation. The Forbes WMIC ranking launched in 2011 (Dyer &
Gregersen, 2015), the Interbrand Best Brands Report launched in 2000 (Interbrand
Methodology, 2015), and the DJSI launched in 1999 (Robecosam Sustainability
Investing, 2014). While each database stakeholder has updated their criteria, data
collection processes, and computational processes, issues of internal validity may affect
the archival data that I selected and used in my study. Factors that may have affected the
internal validity of the data include statistical validity, the reliability of each instrument,
data assumptions, and bias. I cannot control for these factors given my reliance on
archival data generated by third parties.
Sample size validity. Sample size validity is a consideration to ensure the use of
an adequate sample size (Cohen, 1992). The probability of committing Type I errors and
rejecting a true hypothesis relates to sample size (Armstrong, 2014; Craig & Metze,
1979; Minium, 1978). G*Power software tool can determine the appropriate sample size
for a study (Faul, Erdfelder, Buchner, & Lang, 2009; Simon, 2013). Calculating the
minimum sample size for this research study was performed by using G*Power (Version
3.1.9.2). The sample size calculation from G*Power was 107 for this study.
Generalizability to larger populations. External validity and the ability to
generalize the findings to a larger population, according to Campbell and Stanley (2010),
is dependent on whether test samples are selected randomly from a larger population or
assigned based on a specific population. The selection of companies in this research study
included criteria that indices assess public companies that have undertaken innovation

155
efforts and have visible brands. Therefore, generalizing the findings of this study to
broader populations that may not strictly meet the selection criteria may be difficult.
Also, Campbell and Stanley suggested that reverse correlation could also be a factor.
Therefore, excising caution is necessary when reporting the results of correlation as
quasiexperiments differ from pre and post results of true experiments (Craig & Metze,
1979). Latham (2014) also noted the importance of taking caution when generalizing the
findings of quantitative research when evaluating senior leadership performance given
the difficulty in isolating all possible variables. While the sample size may be large
enough to address statistical errors of sample size and Type I errors, Ongori and Agolla
(2008) noted there are limitations concerning the generalizability of the results to
populations located in other countries due to sample size, cultural differences, and
business practices. Therefore, conducting additional research or replicating this research
using companies located in specific countries may help to address the noted constraints.
Reliability of the instruments. As noted by Simon (2013), the reliability of an
instrument refers to the consistency of assessment scores derived from its use. In other
words, scores derived from the repeated use of an instrument should be consistently
stable and accurate with repeated use of the instrument (Simon, 2013). As Drummond
and Vowler (2012) noted, independent variables are known as the input values that
provides an explanation for the change in the dependent variable. Having confidence in
the use of an instrument to provide accurate and consistent results with repeated use
provides instrumentation reliability (Simon, 2013). While Campbell and Stanley (2010)
noted that reliability is a requirement for establishing validity, a reliable assessment is not

156
always deemed to be valid. Simon suggested using the most reliable instrument available
when conducting a study. To address the reliability of the Forbes WMIC, Forbes and
Credit Suisse HOLT uses several processes to maintain the consistency and accuracy of
its research including monitoring of publically available data from news sources,
financial markets, and company financial reports. Other data metrics include R&D
spending, key financial metrics such as sales, profit margins, and market capitalization
based on averaging share prices (Dyer & Gregersen, 2015). The methodology remains
consistent from the original launch date (Dyer & Gregersen, 2015).
To address the reliability of the Brand Value Index, Interbrand uses several
processes to maintain the consistency and accuracy of its research (Interbrand
Methodology, 2015). Interbrand uses publicly available financial data, monitors daily
financial data feeds from several sources including Thomson Reuters, social media feeds
such as Twitter, and consumer goods data on volumes and values from Datamonitor
(Interbrand Methodology, 2015). Interbrand uses the information it collects to predict the
future financial performance of company brands (Interbrand Methodology, 2015).
To address the issue of reliability of the DJSI, Dow Jones uses several processes
to maintain the consistency and accuracy of its research (Robecosam Sustainability
Investing, 2014). The DJSI launched in 1999 through a collaborative effort between the
Dow Jones Indices and RobecoSAM (Robecosam Sustainability Investing, 2014). As part
of the assessment process since its inception, the DJSI reviews, refines, and updates the
DJSI annually (Robecosam Sustainability Investing, 2014). DJSI collects data from
companies using a proprietary questionnaire and from disclosures to stock exchange
157
commissions (Robecosam Sustainability Investing, 2014). In addition to the annual
questionnaire and review of stock exchange filings, other components used to assess
corporate sustainability include ongoing monitoring of media news feeds, publicly
available information from stakeholders, consumer organizations, NGOs, and
government agencies (Robecosam Sustainability Investing, 2014). Contacting companies
directly helps to clarify discrepancies between information captured in a company’s
questionnaire response and on-going media reports (Robecosam Sustainability Investing,
2014). Several analysts review the information from all sources annually to ensure the
quality, consistency, and reliability of the data collection, analysis and reporting process
(Robecosam Sustainability Investing, 2014). The database stakeholders do not provide
detailed information on the reliability of their respected instruments.
Transition and Summary
In Section 2, I reiterated the purpose of this study and the rationale for conducting
the research, outline the role of the researcher, and identified and provided the rationale
for the selected research method and design. In Section 2, I addressed ethical research
issues, the data collection process, sampling, instrumentation, and statistical validity of
the study. In Section 3, I present my research findings including the provision of the data
analysis, descriptive statistics, an interpretation of the findings, a discussion on applying
the findings to professional practice, implications for social change, and
recommendations for action and further research. I also conclude Section 3 with a brief
summary.
158
Section 3: Application to Professional Practice and Implications for Change
Introduction
The purpose of this quantitative correlation study was to examine the relationship
between innovation rankings, brand valuation, and economic sustainability. The specific
business problem addressed whether TMTs exhibit a perception that investing in
innovation and brand valuation has an effect on long-term financial sustainability. While
senior business leaders have indicated an innovation gap may exist, TMTs may act
consistently without understanding the relationship between innovation and sustainability
and between brand valuation and sustainability. I hypothesized that if TMTs supported
higher levels of innovation and brand building in the short-term, such actions could
narrow the innovation gap and contribute to sustainability. For the first set of related
hypotheses, I rejected the null hypothesis. The findings of the study illustrated there is a
small statistically significant positive relationship between innovation ranking and
sustainability. The study findings provide an indication that no statistically significant
relationship between brand valuation and sustainability existed. For the second set of
related hypotheses, I did not reject the null hypothesis. In Section 3, I provide a
description of the study, present the findings, and discuss the applicability of the findings
to the professional practice of business. I also provide recommendations and with
implications for social change, recommendations for further study, a summary, and
conclusions.

159
Presentation of the Findings
To examine the research question, using standard multiple regression with α = .05
(two-tailed), I examined innovation ranking and brand value to predict the variation in
sustainability index scores. The independent variables were innovation ranking and brand
value. The dependent variable was sustainability index scores. The null hypothesis was
that innovation and brand would not significantly predict sustainability index scores. The
alternative hypothesis was that innovation and brand would significantly predict
sustainability scores. Reported observations for innovation ranking ranged from 0 to 100,
with a mean observation of 26.580 (SD = 32.864). Brand value measurement is in
millions of dollars and observations ranged from $1.000 to $170,276 with a mean
observation of $9,498.06 (SD = 18,908.897). Sustainability index observations ranged
from a score of 1.00 to 7.00, with an average observation of 1.99 (SD = 1.612). The
presentation of descriptive statistics for continuous variables is in Table 1.
Table 1
Means and Standard Deviations for Continuous Variables (N = 190)
Variable M SD
Innovation Rank 26.580 32.864 Brand Value 9,498.060 18,908.897 Sustainability Score 2015 1.99 1.612
Using preliminary analyses, I assessed the assumptions of normality, linearity,
homoscedasticity, and independence of residuals. Tests to determine if the data met the
assumption of collinearity indicated that multicollinearity was not violated (Innovation
Rank, Tolerance = .910, VIF = 1.099; Brand Value, Tolerance = .910, VIF = 1.099). The
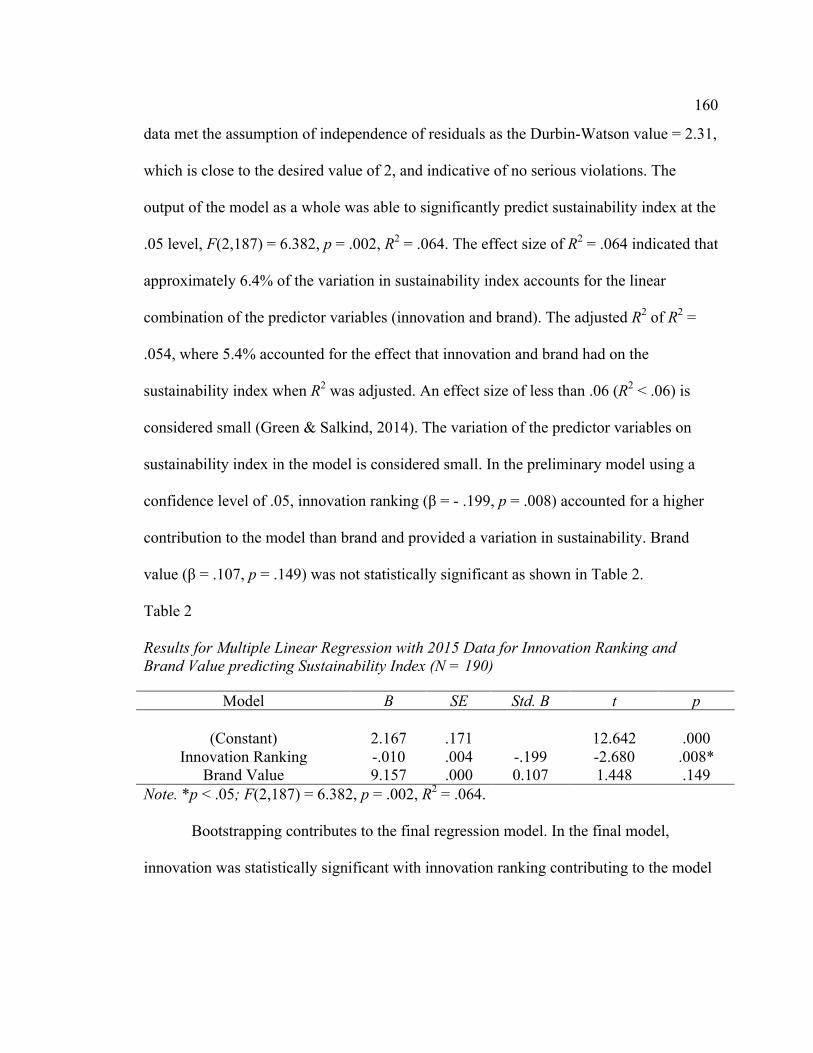
160
data met the assumption of independence of residuals as the Durbin-Watson value = 2.31,
which is close to the desired value of 2, and indicative of no serious violations. The
output of the model as a whole was able to significantly predict sustainability index at the
.05 level, F(2,187) = 6.382, p = .002, R2 = .064. The effect size of R2 = .064 indicated that
approximately 6.4% of the variation in sustainability index accounts for the linear
combination of the predictor variables (innovation and brand). The adjusted R2 of R2 =
.054, where 5.4% accounted for the effect that innovation and brand had on the
sustainability index when R2 was adjusted. An effect size of less than .06 (R2 < .06) is
considered small (Green & Salkind, 2014). The variation of the predictor variables on
sustainability index in the model is considered small. In the preliminary model using a
confidence level of .05, innovation ranking (β = - .199, p = .008) accounted for a higher
contribution to the model than brand and provided a variation in sustainability. Brand
value (β = .107, p = .149) was not statistically significant as shown in Table 2.
Table 2
Results for Multiple Linear Regression with 2015 Data for Innovation Ranking and Brand Value predicting Sustainability Index (N = 190)
Model B SE Std. B t p
(Constant) 2.167 .171 12.642 .000 Innovation Ranking -.010 .004 -.199 -2.680 .008*
Brand Value 9.157 .000 0.107 1.448 .149 Note. *p < .05; F(2,187) = 6.382, p = .002, R2 = .064.
Bootstrapping contributes to the final regression model. In the final model,
innovation was statistically significant with innovation ranking contributing to the model
161
(p = .010). Brand value was not statistically significant (p = .149) and did not provide a
variation to sustainability.
Main Research Question
The overall research question asked, What is the relationship between innovation
ranking, brand valuation, and economic sustainability? The intent of the research
question was to determine whether innovation ranking and brand valuation are predictors
of economic sustainability.
Research Question 1
Research question 1 had two related sets of hypotheses:
Null Hypothesis (H01): There is no relationship between innovation ranking and
economic sustainability.
Alternative Hypothesis (Ha1): There is a relationship between innovation ranking
and economic sustainability.
The first hypothesis represented by Null Hypothesis 1 predicted that innovation
ranking and sustainability were not related. From the regression model, the results
showed that innovation ranking does contribute to the variation in sustainability although
the effect size is considered small. Innovation ranking contributed a small statistically
significant effect on sustainability. Based on the findings, the null hypothesis was
rejected. Rejecting the null hypothesis requires caution considering the small effect size
innovation ranking contributed to variation in sustainability index.
162
Research Question 2
The second hypothesis Null Hypothesis 2 predicted that brand value and
sustainability were not related:
Null Hypothesis (H02): There is no relationship between brand valuation and
economic sustainability.
Alternative Hypothesis (Ha2): There is a relationship between brand valuation and
economic sustainability.
From the regression model, the results showed that brand value does not
contribute to the variation in sustainability given that brand value was not statistically
significant. Based on the findings, the null hypothesis was not rejected. Accepting the
null hypothesis indicates that brand value does not contribute to sustainability index.
Delay Effect
As noted by Bogliacino and Pianta (2013), the existence of a lag between
innovation efforts linked to process improvements and profits is typically 3 years. Given
a possible delay between the occurrence of innovation efforts and the measurement of
sustainability, I replicated the test procedure with same cases (N = 190). Innovation
ranking and brand value data from 2012 was used to determine variations in 2015
sustainability scores. The data met the assumption of independence of residuals as the
Durbin-Watson value = 1.763. However, the output of the model as a whole indicated the
model was not able to significantly predict a variance in the sustainability index at the .05
level, F(2,187) = .804, p = .449, R2 = .009. The effect size of R2 = .009 indicated that
approximately <1% of the variation in sustainability index was accounted for by the
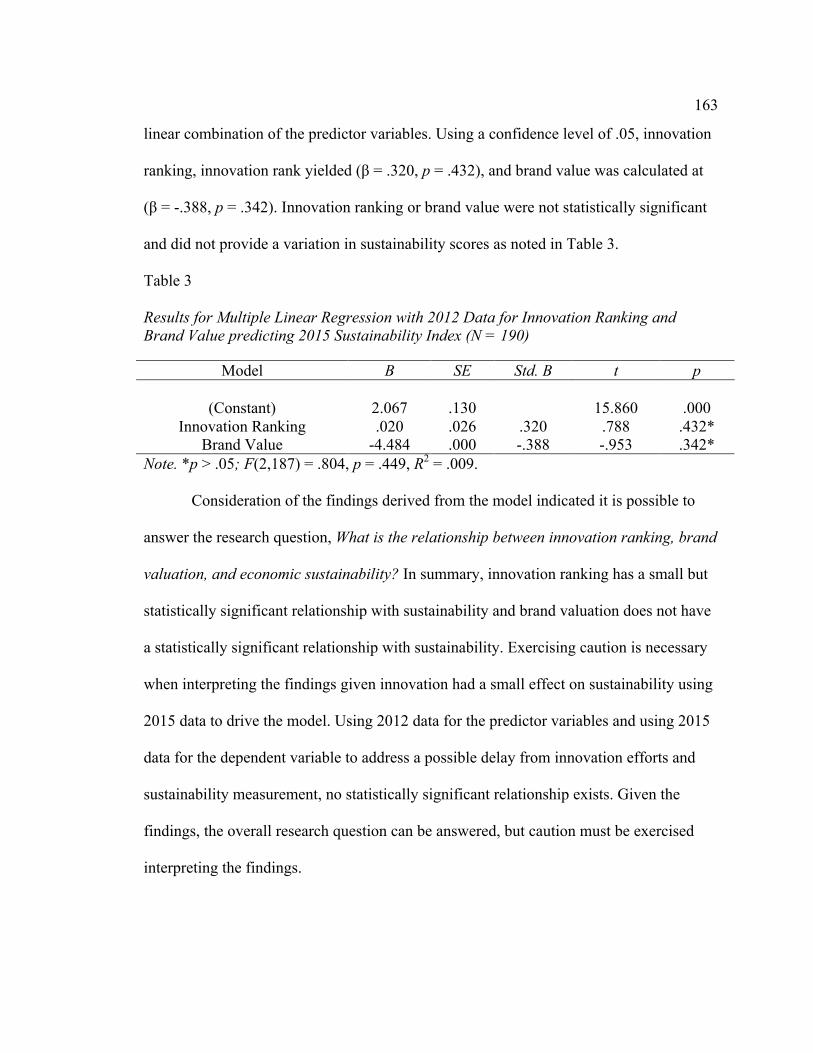
163
linear combination of the predictor variables. Using a confidence level of .05, innovation
ranking, innovation rank yielded (β = .320, p = .432), and brand value was calculated at
(β = -.388, p = .342). Innovation ranking or brand value were not statistically significant
and did not provide a variation in sustainability scores as noted in Table 3.
Table 3
Results for Multiple Linear Regression with 2012 Data for Innovation Ranking and Brand Value predicting 2015 Sustainability Index (N = 190)
Model B SE Std. B t p
(Constant) 2.067 .130 15.860 .000 Innovation Ranking .020 .026 .320 .788 .432*
Brand Value -4.484 .000 -.388 -.953 .342* Note. *p > .05; F(2,187) = .804, p = .449, R2 = .009.
Consideration of the findings derived from the model indicated it is possible to
answer the research question, What is the relationship between innovation ranking, brand
valuation, and economic sustainability? In summary, innovation ranking has a small but
statistically significant relationship with sustainability and brand valuation does not have
a statistically significant relationship with sustainability. Exercising caution is necessary
when interpreting the findings given innovation had a small effect on sustainability using
2015 data to drive the model. Using 2012 data for the predictor variables and using 2015
data for the dependent variable to address a possible delay from innovation efforts and
sustainability measurement, no statistically significant relationship exists. Given the
findings, the overall research question can be answered, but caution must be exercised
interpreting the findings.
164
The theoretical frameworks used to formulate the research questions included
Sood and Tellis’s (2011) theory of limited market disruption auguring that most
innovation is higher-priced and introduced by incumbents; Morris’s (2013) theory of
innovation on a continuum from continuous incremental, discontinuous disruptive
innovation, and business model innovation warfare; and Legrand and Weiss’s (2011)
innovation gap theory attributable to TMTs focus on immediate financials. To address the
innovation gap, Kotter (2013) and Dierk and Dover (2012) noted that CEOs must push
their TMTs and boards to balance short-term with long-term goals. To develop an
ambidextrous organization, Dierk and Dover suggested that balancing short-term
exploitation to address immediate financial objectives is possible, but long-term
exploration derived from innovation efforts is a requirement for sustainability. Legrand
and Weiss suggested that when TMTs focus on short-term goals at the exclusion of
investing in innovation activities, achieving the desired level of innovation is impeded
and potentially affects sustainability negatively.
While the research results could not provide a definitive relationship between
innovation ranking, brand value, and sustainability, some companies in the sample were
ranked high on sustainability but not on innovation. For example, Palma and Visser
(2012) noted that companies such as Philips are highly innovative, have a strong global
brand presence, and are led by a TMT focused on innovation and sustainability.
However, Philips is evaluated as not being innovative according to the innovation
ranking. In reviewing cases in the raw data, some top companies that operate in the
technology sector and exhibited strong brand value and presence received notable
165
evaluations as not sustainable or highly innovative by the data providers. Some firms
evaluated as highly innovative tended not to be as well-known as the top brands. The
equivocal firm rankings on different measures may explain why innovation ranking had
only a small statistically significant effect on sustainability and why brand value did not
have a statistically significant effect on sustainability using 2015 data. Although there
was an expectation of a stronger relationship between innovation ranking and brand
value, and sustainability in my study, innovation efforts should not be abandoned by
organizations nor should investing in brands be suspended. My research findings might
apply to the sample I analyzed and may not generalize to a larger population. Innovation
efforts are still required to meet long-term objectives including goals of sustainability as
outlined in the literature.
Applications to Professional Practice
In this quantitative research study, I examined the relationship between
innovation ranking, brand valuation, and the effect on sustainability using a sample of
global companies. The results of the study indicate a small statistically significant
relationship between innovation and sustainability. A relationship between brand and
sustainability was not statistically significant.
The statistically significant relationship between innovation and sustainability and
the lack of a statistically significant relationship between brand and sustainability is
relevant given the range and mix of firms that were part of the sample used to conduct the
study. A stronger correlation between innovation and sustainability would ideally provide
further evidence to TMTs and boards to support investing in innovation efforts.

166
Correlation between brand and sustainability would provide evidence that efforts to
create strong brands positively affect sustainable performance. The positive linkage
between innovation and sustainability provides a case for TMTs to take an ambidextrous
approach and balance short-term exploitative goals with long-term investments in
innovation. Given the strength of the relationship between innovation and sustainability,
and the lack of a relationship between brand and innovation, limits on the generalization
of the findings should be to the sample used. Several organizations included in this study
did not rank as top innovators, nor were some organizations ranked as highly sustainable
yet they invest billions annually in innovation efforts, have highly recognizable brands,
and invest in sustainability efforts. Some organizations are consistently ranked as top
innovators with well-recognized brands while their innovation rankings, brand value, and
sustainability index scores tend to fluctuate year-to-year.
TMTs, boards, and financiers who make decisions between immediate and long-
term fiscal objectives do not necessarily have to trade off short- and long-term objectives.
Cristina (2013) noted that innovation efforts must be deliberate. As innovation efforts
increase, organizations can develop unique and differentiated product and service
offerings that create demand over other offerings adding value to the organization
(Cristina, 2013). When products and services are unique, new markets and market share
gains can contribute additional revenue (Kotter, 2013). Coupled with innovation, brand
valuation allows firms to develop greater awareness of new products, services, and new
processes by using advertising to differentiate, frame and reinforce a positive product
experience in customers’ minds (Huang & Sarigollu, 2014). Riedesel (2011) asserted that
167
consumers often buy products or services they know, are comfortable with, and make
them feel good. Positive emotional responses to brands requires effort on the part of
companies to build brand awareness and a connectedness to brand to realize a revenue
premium. The implication is innovation efforts contribute to the development of
differentiated products and services. Branding efforts build awareness and connectedness
to products and services to increase revenue. As such, the results of this study point out
(a) innovation has a statistically significant relationship to sustainability, (b) TMTs
should continue to invest in innovation efforts because innovation is important to
sustainability, and (c) TMTs should pursue innovation strategies to support their brand
with products and services customers perceive as being CSR to which customers can
relate.
Implications for Social Change
The implications for social change from the study results follow. In this research
study, the research questions were the basis for examining the relationship between the
independent variables innovation and brand, and the dependent variable sustainability. In
the literature review, Legrand and Weiss (2011) asserted that TMTs observed a gap
between the expected level of innovation and the level of innovation achieved. Achieving
sustainability is important given that the three components of sustainability include the
interdependence of (a) environmental responsibility, (b) social responsibility, and (c)
financial performance (Sayem, 2012). Business strategy, brand strategy, and people
strategy also have an interdependency (Holland & Weathers, 2013). Given the

168
interdependencies, innovation efforts at various levels are required to support true
change.
In my study, the effect size between innovation and sustainability was small yet
statistically significant indicating possible improvement to organizational and social
performance. Given society’s demand for more socially responsible products and
behaviors (Edvardsson & Enquist, 2011), innovation efforts should be a top priority for
organizations. Positive social implications of innovation include the ability of firms to
create employment opportunities and underpin a better standard of living for society as a
whole. Innovation is a means of securing future social, environmental, and economic
sustainability (Miller, 2012). The positive linkage of innovation to sustainability should
provide impetus for organizations to innovate and develop environmentally responsible
products, processes, and services. The business community and society as a whole are
likely to benefit from ongoing innovation efforts and the associated rewards of
employment, living standards, and environmental stewardship.
While the findings of this research did not provide evidence of a relationship
between brand and sustainability, greater awareness of sustainability issues dictate the
need for organizations to heighten their perception as CSR leaders. Consumer perceptions
of corporate brands are likely to benefit from CSR efforts given the halo effect placed on
the products and services of organizations perceived to be CSR leaders (Chernev & Blair,
2015). Given CSR behaviors affect brand and financial performance, brands are rewarded
or punished by consumer perception (Chernev & Blair, 2015). Awareness of CSR actions
on brand perception influence how companies develop new products, services, and

169
processes (Chernev & Blair, 2015). Organizations investing in their corporate brand
through innovation efforts and CSR behaviors are likely to develop products and
processes that benefit consumers, the environment, and society as a whole. As companies
understand brand perception can affect demand for an organization’s products and
services (Olsen et al., 2014), the social implication is firms should engage in positive
CSR behaviors.
Recommendations for Action
Assessing the research findings provided an opportunity to recommend actions.
As evidenced in this study and as noted in Section 1, innovation efforts positively
contribute to sustainability and financial performance. Innovation efforts may assist
organizations to develop new products, services, and processes to achieve higher levels of
competitiveness, reduce emissions, and support responsible use of resources and labor.
Based on the findings from the research study, TMTs should prioritize the development
of new products, services, business models, and processes through innovation efforts that
can deliver the social, environmental, and economic benefits associated with
sustainability. While brand did not have a statistically significant relationship with
sustainability in this study, CSR behaviors are closely associated with brand perception
(Chernev & Blair, 2015). CSR behaviors associated with the responsible use of resources,
labor, and the reduction in emissions will require innovation (Olsen et al., 2014).
Therefore, it is recommended organizations engage in innovation efforts to develop
products, services, and processes that contribute to sustainability as such action will also
positively affect consumer brand perception. To disseminate the results of this study, I

170
intend to develop an article and explore publishing the results in a scholarly journal such
as the Journal of Executive Education, Business Strategy and the Environment, the
Strategic Management Journal, or the Journal of Leadership, Accountability & Ethics.
Recommendations for Further Research
As noted in the Applications to Professional Practice section, a small statistically
significant relationship between innovation ranking and sustainability index scores is a
result of this research. The study results indicate the relationship between brand and
sustainability is not statistically significant and possibly attributable to limitations of the
research. While the data collected met the objectives for this research study, limited
generalizations can only be made given the sample of companies used and noted
constraints. The limitations of the research include restrictions on the companies used in
the study and specifically how each measurement evaluated the companies examined.
While each data provider evaluated thousands of companies on an annual basis, including
less than the top 10% in the study constrained the ability to use both larger and more
comprehensive data sets. Future researchers might utilize additional data, or consider
using other measurements from other data providers who use different methodologies to
evaluate innovation and brand as noted in Section 1. Data from companies used in the
study were from a variety of industry sectors as reported by the data providers. Future
researchers might segment and examine data for specific industries or industrial
classifications given that the overall performance metrics may differ between industries.
Examining the variables by sector is recommended. Opportunities for future research
may also focus on examining the variance between companies for each measurement tool
171
as measurement scores for some companies are consistent year-to-year while others
exhibited fluctuations. The reasons behind significant fluctuation between measures
require further examination. A future researcher might also consider using other
statistical approaches such as ANOVA and Spearman’s correlation using industry sector
specific data to strengthen the analysis of future studies.
Reflections
The research I performed in this study examined the relationship between
innovation, brand, and sustainability. The research experience was gratifying for several
reasons. First, the literature review provided insight into the innovation gap as cited by
many TMTs. The research opportunity provided a deeper understanding of how the
innovation gap is a business problem affecting TMTs, boards, and investors. The
challenge for senior leaders is to balance short-term goals and need for immediate
financial results with long-term goals (Dierk & Dover, 2012; Kotter, 2013). Additionally,
when scrutinizing possible sources for the innovation gap, the evidence of locked-in
mindsets specific to CEO and TMT behaviors as noted by Morris (2013) is enlightening.
Short-term and long-term goals tend to be in a state of conflict, as some stakeholders
prefer to retain the status quo demanding immediate financial results while eschewing
risks associated with funding innovation efforts (Dierk & Dover, 2012). Second, the
literature review uncovered the importance of several elements TMTs must address
within their organizations including (a) the distinctive dimensions of innovation (Morris,
2013), (b) the importance of innovation efforts to remain competitive or lead in dynamic
markets (Heij et al., 2014), (c) the contribution and role of brand to position an

172
organization as relevant and sought after by customers (Daley, 2014; Gregory, 2013), (d)
the role CEOs play in setting the organizational agenda concerning ambidexterity and
innovation efforts (Dierk & Dover, 2012), and (e) the effectiveness of establishing
innovation divisions outside of operational businesses to foster experimentation
(Bhattacharyya, 2006; Blackshaw, 2014; Hess, 2012). Third, the literature review
elucidated imperative elements of branding underscoring the need for valence, repetition,
the uniqueness of messaging, the power of earned media over paid media, the
authenticity of messaging, and customer expectations for proactive CSR (Edvardsson &
Enquist, 2011; McKinney & Benson, 2013; Riedesel, 2011). Fourth, the research
experience (a) provided greater awareness of known research methods and designs, (b)
challenged and broadened my knowledge of the research process, and (c) provided an
effective lens to evaluate challenging business problems. Finally, the research experience
provided an enhanced appreciation of the need to apply research principles and standard
practices to address important business problems.
Summary and Study Conclusions
Addressing a perceived innovation gap by TMTs was the impetus for this research
study. The purpose of the investigation was to examine whether a relationship existed
between the independent variables innovation and brand, and the dependent variable
sustainability. The intent of the research was to gain insight into the innovation gap
causes, remedies, and the potential effect on financial performance. To understand the
linkage between innovation, brand, and sustainability, the relationship between
innovation, brand, and sustainable financial performance was examined using global
173
companies. The relationship between innovation, brand, and sustainability is relevant to
TMTs who must balance short-term and long-term goals given that innovation requires a
deliberate decision to exploit immediate financial gains or invest in uncertain future
opportunities. The results from the research revealed a small statistically significant
relationship between innovation and sustainability, and no relationship between brand
and sustainability using 2015 data. To determine if the results could be attributable to a
delayed effect given innovation efforts results or branding efforts may not be
immediately apparent, the test procedure was repeated using 2012 data for innovation and
brand to determine the variation in 2015 sustainability. The results of the delayed
measurement procedure showed no statistically significant relationship between
innovation, brand, and sustainability. The results derived from the second procedure are
likely due to the year-to-year fluctuation of innovation and brand measurements. Based
on the research findings, the correlation between variables may be attributable to the
restricted range of company data available. Employing an industrial segmentation
strategy may have also yielded different results. In summary, a small relationship exists
between innovation and sustainability thereby reinforcing encouragement for TMTs to
invest in innovation efforts.

174
References
Aaker, D. A. (2012). Win the brand relevance battle and then build competitor barriers.
California Management Review, 54, 43-57. doi:10.1525/cmr.2012.54.2.43
Abrami, R. M., Kirby, W. C., & McFarlan, F. W. (2014). Why China can't innovate.
Harvard Business Review, 92, 107-111. Retrieved from http://www.hbr.org/
Abril, C., & Martos-Partal, M. (2013). Is product innovation as effective for private
labels as it is for national brands? Innovation: Management, Policy & Practice,
15, 337-349. doi:10.5172/impp.2013.15.3.337
Ahn, B., & Choi, S. (2012). Aggregation of ordinal data using ordered weighted
averaging operator weights. Annals of Operations Research, 201(1), 1-16.
doi:10.1007/s10479-012-1169-3
Armstrong, R. A. (2014). When to use the Bonferroni correction. Ophthalmic &
Physiological Optics, 34, 502-508. doi:10.1111/opo.12131
Arnold, M. G., & Hockerts, K. (2011). The greening Dutchman: Philips' process of green
flagging to drive sustainable innovations. Business Strategy & the Environment
(John Wiley & Sons, Inc.), 20, 394-407. doi:10.1002/bse.700
Aschaiek, S. (2012). The sustainability edge. CMA Magazine (1926-4550), 86, 28-29.
Retrieved from https://www.cpacanada.ca/
Attila, S. (2014). Testing brand value measurement methods in a random coefficient
modeling framework. Annals of the University of Oradea, Economic Science
Series, 23, 1069-1074. Retrieved from http://www.steconomiceuoradea.ro/
175
Aubrey, C., & Judge, D. (2012). Re-imagine retail: Why store innovation is key to a
brand's growth in the 'new normal', digitally-connected and transparent world.
Journal of Brand Strategy, 1, 31-39. Retrieved from
http://www.henrystewart.com/
Ba, S., Lisic, L. L., Liu, Q., & Stallaert, J. (2013). Stock market reaction to green vehicle
innovation. Production & Operations Management, 22, 976-990.
doi:10.1111/j.1937-5956.2012.01387.x
Belmont Report (1979). The Belmont Report: Ethical principles and guidelines for the
protection of human subjects of research. Retrieved from
www.hhs.gov/ohrp/humansubjects/guidance/belmont.html/
Beverland, M. B., Napoli, J., & Farrelly, F. (2010). Can all brands innovate in the same
way? A typology of brand position and innovation effort. Journal of Product
Innovation Management, 27, 33-48. doi:10.1111/j.1540-5885.2009.00698.x
Bhattacharyya, S. (2006). Entrepreneurship and innovation: How leadership style makes
the difference? Vikalpa: The Journal for Decision Makers, 31, 107-115. Retrieved
from http://www.vikalpa.com/
Blackshaw, P. (2014). Keynote comments digital transformation at Nestlé: Playing to
win. Journal of Brand Strategy, 3, 6-11. Retrieved from
http://www.henrystewartpublications.com/jbs
Blank, S. (2013). Why the lean start-up changes everything. Harvard Business Review,
91, 63-72. Retrieved from http://www.hbr.org/
176
Blettner, D. P., Chaddad, F. R., & Bettis, R. A. (2012). The CEO performance effect:
Statistical issues and a complex fit perspective. Strategic Management Journal,
33, 986-999. doi:10.1002/smj.1949
Bogliacino, F., & Pianta, M. (2013). Profits, R&D, and innovation—a model and a test.
Industrial & Corporate Change, 22, 649-678. doi:10.1093/icc/dts028
Boyd, B. K., Haynes, K., & Zona, F. (2011). Dimensions of CEO-board relations.
Journal of Management Studies, 48, 1892-1923. doi:10.1111/j.1467-
6486.2010.00943.x
Brem, A., & Ivens, B. (2013). Do frugal and reverse innovation foster sustainability?
Introduction of a conceptual framework. Journal of Technology Management for
Growing Economies, 4, 31-50. Retrieved from http://www.journal.chitkara.edu.in/
Brutus, S., & Duniewicz, K. (2012). The many heels of Achilles: An analysis of self-
reported limitation in leadership research. Leadership Quarterly, 23, 202-212.
doi:10.1016/j.leaqua.2011.11.015
Buyl, T., Boone, C., & Matthyssens, P. (2012). The impact of the top management team's
knowledge diversity on organizational ambidexterity. International Studies of
Management & Organization, 42, 8-26. doi:10.2753/imo0020-8825420401
Campbell, D. T., & Stanley, J. C. (2010). Experimental and quasi-experimental designs
for research (Laureate Education, Inc., custom ed.). Mason, OH: Cengage
Learning.
177
Carayannopoulos, S. (2009). How technology-based new firms leverage newness and
smallness to commercialize disruptive technologies. Entrepreneurship: Theory &
Practice, 33, 419-438. doi:10.1111/j.1540-6520.2009.00297.x
Chakrabarty, S., & Wang, L. (2012). The long-term sustenance of sustainability practices
in MNCs: A dynamic capabilities perspective of the role of R&D and
internationalization. Journal of Business Ethics, 110, 205-217.
doi:10.1007/s10551-012-1422-3
Chang, W., Franke, G. R., Butler, T. D., Musgrove, C. F., & Ellinger, A. E. (2014).
Differential mediating effects of radical and incremental innovation on market
orientation-performance relationship: A meta-analysis. Journal of Marketing
Theory & Practice, 22, 235-250. doi:10.2753/MTP1069-6679220301
Chernev, A., & Blair, S. (2015). Doing well by doing good: The benevolent halo of
corporate social responsibility. Journal of Consumer Research, 41, 1412-1425.
doi:10.1086/680089
Christensen, C. M., Raynor, M., & McDonald, R. (2015). What is disruptive innovation?
Harvard Business Review, 93, 44-53. Retrieved from http://www.hbr.org/
Cohen, J. (1992). Statistical power analysis. Current Directions in Psychological Science,
1, 98-101. doi:10.1111/1467-8721.ep10768783
Craig, J. R., & Metze, L. P. (1979). Methods of psychological research. Philadelphia, PA:
Saunders.
Creswell, J. W., & Plano Clark, V. L. (2007). Designing and conducting mixed methods
research. Thousand Oaks, CA: Sage.

178
Cristina, V. (2013). The importance of an innovative leader in the organization. Annals of
the University of Oradea, Economic Science Series, 22, 703-709. Retrieved from
http://www.anale.steconomiceuoradea.ro/
Daley, J. (2014). The secrets of the top brands. Entrepreneur, 42, 42-46. Retrieved from
http://www.entrepreneur.com/
Dierk, U., & Dover, P. (2012). Measuring the integrative impact of managers,
entrepreneurs and leaders in sustaining innovation: A tool for customized
executive education program. Journal of Executive Education, 11, 15-35.
Retrieved from http://www.digitalcommons.kennesaw.edu/jee/
Drummond, G., & Vowler, S. (2012). Categorized or continuous? Strength of an
association - and linear regression. The Journal of Physiology, 590, 2061-2064.
doi:10.1113/phsyiol.2012.232488
Duguleană, L. L., & Duguleană, C. C. (2014). Brand valuation methodologies and
practices. Bulletin of the Transilvania University of Brasov. Series V: Economic
Sciences, 7 43-52. Retrieved from http://webbut.unitbv.ro/Bulletin/
Dyer, J., & Gregersen, H. (2015). How we rank the world’s most innovative companies.
Forbes, 196, 104-118. Retrieved from http://www.forbes.com/sites/
Eccles, R. G., & Serafeim, G. (2013). A tale of two stories: Sustainability and the
quarterly earnings call. Journal of Applied Corporate Finance, 25, 8-19.
doi:10.1111/jacf.12023

179
Edvardsson, B., & Enquist, B. (2011). The service excellence and innovation model:
Lessons from IKEA and other service frontiers. Total Quality Management &
Business Excellence, 22, 535-551. doi:10.1080/14783363.2011.568242
Faul, F., Erdfelder, E., Buchner, A., & Lang, A. (2009). Statistical power analysis using
G*Power 3.1: Tests for correlation and regression analysis. Behavior Research
Methods, 41, 1149-1160. doi:10.3758/brm.41.4.1149
Freedman, D. A. (1981). Bootstrapping regression models. The Annals of Statistics, 9,
1218-1228. doi:10.1214/aos/1176345638
Füller, J. (2014). For us and by us: The charm and power of community brands. Gfk-
Marketing Intelligence Review, 6, 40-45. doi:10.2478/gfkmir-2014-0097
Gent, E. (2014). Technology brands top for value in 2014. Engineering & Technology
(17509637), 9, 38-41. doi:10.1049/et.2014.0301
Gobble, M. M. (2013). Outsourcing innovation. Research Technology Management, 56,
64-66. doi:10.5437/08956308X5604005
Gobble, M. M., Petrick, I., & Wright, H. (2012). Innovation and strategy. Research
Technology Management, 55, 63-67. doi:10.5437/08956308X5503005
Gouws, T., & van Rheede van Oudtshoorn, G. P. (2011). Correlation between brand
longevity and the diffusion of innovations theory. Journal of Public Affairs
(14723891), 11, 236-242. doi:10.1002/pa.416
Green, S. B., & Salkind, N. J. (2014). Using SPSS for Windows and Macintosh. Upper
Saddle River, NJ: Pearson Education, Inc.
180
Gregory, J. R. (2013). Accountability of sustainability. Journal of Brand Strategy, 2, 28-
39. Retrieved from http://www.henrystewartpublications.com/jbs/
Heij, C. V., Volberda, H. W., & van den Bosch, F. J. (2014). How does business model
innovation influence firm performance: The moderating effect of environmental
dynamism. Academy of Management Annual Meeting Proceedings, 1502-1507.
doi:10.5465/AMBPP.2014.234
Hess, E. D. (2012). Is the CFO an enabler or inhibitor? Financial Executive, 28, 25-29.
Retrieved from http://www.financialexecutivemag.com/
Hill, L. A., Brandeau, G., Sal, E., & Lineback, K. (2014). Collective genius. Harvard
Business Review, 92, 94-102. Retrieved from http://www.hbr.org/
Holland, J., & Weathers, J. (2013). Aligning a company's people strategy with its
business strategy and brand strategy. Journal of Brand Strategy, 2, 245-258.
Retrieved from http://www.henrysteward.com/
Hoonsopon, D., & Ruenrom, G. (2012). The impact of organizational capabilities on the
development of radical and incremental product innovation and product
innovation performance. Journal of Managerial Issues, 24, 250-276. Retrieved
from http://www.jomi.web.id/
Huang, R., & Sarigollu, E. (2014). Assessment of brand equity measures. International
Journal of Market Research, 56, 783-806. doi:10.2501/IJMR-2014-037
Hung-Jung, C., & Hsien-Bin, W. (2013). A case study on the model of strategic
entrepreneurship. International Journal of Organizational Innovation, 5, 30-44.
Retrieved from http://www.ijoi-online.org/

181
Hunter, M. (2012). On some of the misconceptions about entrepreneurship. Economics,
Management, and Financial Markets, 7, 55-104. Retrieved from
http://www.addletonacademicpublishers.com/
Hynds, E. J. (2013). Viewing innovation through the sustainability lens. Research
Technology Management, 56, 10-12. doi:10.5437/08956308X5602009
Iacono, J., Brown, A., & Holtham, C. (2009). A case example of participant observation.
The Electronic Journal of Business Research Methods, 7, 39-46. Retrieved from
http://www.ejbrm.com
Interbrand Methodology. (2015). Retrieved from http://www.interbrand.com/best-brands/
Jaruzelski, B., Staack, V., & Goehle, B. (2014). Global Innovation 1000: Proven paths to
innovation success. Retrieved from http://www.strategyand.pwc.com/global/
Johnson, R. B., Onwuegbuzie, A. J., & Turner, L. A. (2007). Toward a definition of
mixed methods research. Journal of Mixed Methods Research, 1, 112-133.
doi:10.1177/1558689806298224
Kahn, K. B., Barczak, G., Nicholas, J., Ledwith, A., & Perks, H. (2012). An examination
of new product development best practice. Journal of Product Innovation
Management, 29, 180-192. doi:10.1111/j.1540-5885.2011.00888.x
Kajander, J., Sivunen, M., Vimpari, J., Pulkka, L., & Junnila, S. (2012). Market value of
sustainability business innovations in the construction sector. Building Research
& Information, 40, 665-678. doi:10.1080/09613218.2012.703893
Kamisan, P., & King, B. M. (2013). Transactional and transformational leadership: A
comparative study of the difference between Tony Fernandes (Airasia) and Idris
182
Jala (Malaysia Airlines) leadership styles from 2005-2009. International Journal
of Business and Management, 8, 107-116. doi:10.5539/ijbm.v8n24p107
Kaplan, S. (2012). Leading disruptive innovation. Ivey Business Journal. Retrieved from
http://www.wwsg.com/
Kock, A., Gemünden, H. G., Salomo, S., & Schultz, C. (2011). The mixed blessings of
technological innovativeness for the commercial success of new products. Journal
of Product Innovation Management, (s1), 28-43. doi:10.1111/j.1540-
5885.2011.00859.x
Kotter, J. (2013). Change leadership. Leadership Excellence, 30, 6-7. Retrieved from
http://www.excellenceessentials.com/
Lampikoski, T., Westerlund, M., Rajala, R., & Möller, K. (2014). Green innovation
games: Value-creation strategies for corporate sustainability. California
Management Review, 57, 88-116. doi:10.1525/cmr.2014.57.1.88
Larson, D. (2011). Global brand management -- Nike's global brand. ISM Journal of
International Business, 1(3), 1-14. Retrieved from http://www.ism.edu/
Larson, M. D., Latham, J. R., Appleby, C. A., & Harshman, C. L. (2012). CEO attitudes
and motivations: Are they different for high-performing organizations? Quality
Management Journal, 19, 55-69. Retrieved from http://asq.org/pub/qmj/
Latham, J. R. (2014). Leadership for quality and innovation: Challenges, theories, and a
framework for future research. Quality Management Journal, 21, 11-15.
Retrieved from http://asq.org/pub/qmj/

183
Lazzarini, S. G., Brito, L. L., & Chaddad, F. R. (2013). Conduits of innovation or
imitation? Assessing the effect of alliances on the persistence of profits in U.S.
firms. BAR - Brazilian Administration Review, 10(1), 1-17. Retrieved from
http://www.anpad.org.br/periodicos/
Legrand, C., & Weiss, D. (2011). How leaders can close the innovation gap. Ivey
Business Journal. Retrieved from http://iveybusinessjournal.com/
Leiponen, A. (2012). The benefits of R&D and breadth in innovation strategies: A
comparison of Finnish service and manufacturing firms. Industrial & Corporate
Change, 21, 1255-1281. doi:10.1093/icc/dts022
Levine, T. R., & Hullett, C. R. (2002). Eta squared, partial eta squared, and misreporting
of effect size in communication research. Human Communication Research, 28,
612–625. doi:10.1111/j.1468-2958.2002.tb00828.x
Li, L., Qian, G., & Qian, Z. (2014). Inconsistencies in international product strategies and
performance of high-tech firms. Journal of International Marketing, 22(3), 94-
113. doi:10.1509/jim.13.0111
Liao, S., & Cheng, C. C. (2013). Consumer evaluation of self-service innovation failure:
The effect of brand equity and attribution. Service Industries Journal, 33, 467-
485. doi:10.1080/02642069.2011.614339
Lin, H., McDonough, E. F., Lin, S., & Lin, C. Y. (2013). Managing the
exploitation/exploration paradox: The role of a learning capability and innovation
ambidexterity. Journal of Product Innovation Management, 30, 262-278.
doi:10.1111/j.1540-5885.2012.00998.x
184
Lourenço, I., Branco, M., Curto, J., & Eugénio, T. (2012). How does the market value
corporate sustainability performance? Journal of Business Ethics, 108, 417-428.
doi:10.1007/s10551-011-1102-8
Lu, S. (2013). Applied case study academic analysis of Lockheed Martin missiles and fire
control recipient of the 2012 Malcolm Baldrige national quality award. Review of
Management Innovation & Creativity, 6, 77-86. Retrieved from
http://www.intellectbase.org/
McKinney, M. E., & Benson, A. (2013). The value of brand trust. Journal of Brand
Strategy, 2, 76-86. Retrieved from http://www.henrysteward.com/
McNeal, M. (2013). Return on innovation. Marketing Insights, 25, 48. Retrieved from
https://www.ama.org/publications/MarketingInsights/
Miller, R. A. (2012). Innovation, sustainable ethics and the future of American economic
power. Journal of Leadership, Accountability & Ethics, 9, 92-98. Retrieved from
http://www.na-businesspress.com/jlaeopen.html/
Minium, E. W. (1978). Statistical reasoning in psychology and education (2nd ed.). New
York, NY: Wiley.
Mollick, E. (2012). People and process, suits and innovators: The role of individuals in
firm performance. Strategic Management Journal, 33, 1001-1015.
doi:10.1002/smj.1958
Mootee, I. (2012). Organizational ambidexterity. Ivey Business Journal, 76(6), 1-4.
Retrieved from http://www.iveybusinessjournal.com/topics/

185
Morgan, H. (2014). Venture capital firms and incubators. Research Technology
Management, 57, 40-44. doi:10.5437/08956308X5706014
Morhart, F. M., Herzog, W., & Tomczak, T. (2011). Turning employees into brand
champions: Leadership style makes a difference. Gfk-Marketing Intelligence
Review, 3, 35-43. Retrieved from http://www.gfkmir.com/
Morris, L. (2013). Three dimensions of innovation. International Management Review, 9,
5-10. Retrieved from http://www.usimr.org/
Mugge, R., & Dahl, D. W. (2013). Seeking the ideal level of design newness: Consumer
response to radical and incremental product design. Journal of Product Innovation
Management, 30,34-47. doi:10.1111/jpim.12062
Nadkarni, S., & Herrmann, P. (2010). CEO personality, strategic flexibility, and firm
performance: The case of the Indian business process outsourcing industry.
Academy of Management Journal, 53, 1050-1073.
doi:10.5465/AMJ.2010.54533196
Nagji, B., & Tuff, G. (2012). Managing your innovation portfolio. Harvard Business
Review, 90, 66-74. Retrieved from http://www.hbr.org/
Narayan, G. (2012). Brand Valuation: A strategic tool for business. IUP Journal of Brand
Management, 9, 55-64. Retrieved from http://www.iupindia.in/
O'Connor, G. C., & Rice, M. P. (2013). New market creation for breakthrough
innovations: Enabling and constraining mechanisms. Journal of Product
Innovation Management, 30, 209-227. doi:10.1111/j.1540-5885.2012.00996.x
O'Reilly III, C. A., & Tushman, M. L. (2013). Organizational ambidexterity: Past,

186
present, and future. Academy of Management Perspectives, 27, 324-338.
doi:10.5465/amp.2013.0025
Olsen, M. C., Slotegraaf, R. J., & Chandukala, S. R. (2014). Green claims and message
frames: How green new products change brand attitude. Journal of Marketing, 78,
119-137. doi:10.1509/jm.13.0387
Ongori, H. & Agolla, J. (2008). Occupational stress in organizations and its effects on
organizational performance. Journal of Management Research, 8, 123-135.
Retrieved from http://www.sapub.com/
Palma, N., & Visser, M. (2012). Sustainability creates business and brand value. Journal
of Brand Strategy, 1, 217-222. Retrieved from
http://www.henrystewartpublications.com/jbs/
Parker, M., Abdul-Ghaffar, R., Campbell, K., & Vickers-Johnson, D. (2012). Managing
not to change: A mixed-methods analysis of anosognosic management and the
indirect impact on organizational change. Journal of Leadership, Accountability
& Ethics, 9, 112-124. Retrieved from http://www.na-businesspress.com/JLAE/
Partanen, J., Chetty, S. K., & Rajala, A. (2014). Innovation types and network
relationships. Entrepreneurship: Theory & Practice, 38, 1027-1055.
doi:10.1111/j.1540-6520.2011.00474.x
Perkins, K. M. (2012). Sustainability and innovation: Creating change that engages the
workforce. Journal of Corporate Citizenship, 46, 175-187.
doi:10.9774/gleaf.4700.2012.su00011
187
Pfoertsch, W. (2012). Assessing management performance with brand caused earnings
(BCE). IUP Journal of Brand Management, 9, 40-49. Retrieved from
http://www/iupindia.in/
Punjaisri, K., Evanschitzky, H., & Rudd, J. (2013). Aligning employee service recovery
performance with brand values: The role of brand-specific leadership. Journal of
Marketing Management, 29, 981-1006. doi:10.1080/0267257X.2013.803144
Quinton, S. (2013). The community brand paradigm: A response to brand management's
dilemma in the digital era. Journal of Marketing Management, 29, 912-932.
doi:10.1080/0267257X.2012.729072
Reeves, M., Haanaes, K., Love, C., & Levin, S. (2012). Sustainability as adaptability.
Journal of Applied Corporate Finance, 24, 14-22. doi:10.1111/j.1745-
6622.2012.00373.x
Riedesel, P. (2011). What's your brand's pricing power? Marketing Research, 23, 14-18.
Retrieved from http://www.ama.org/
Robecosam Sustainability Investing. (2014). DJSI 2014 Review Results. Retrieved from
http://www.sustainability-indices.com/
Rubera, G. & Droge, C. (2013). Technology versus design innovation’s effects on sales
and Tobin’s q: The moderating role of branding strategy. Journal of Product
Innovation Management, 30, 448-464. doi:10.1111/jpim.12012
Rubera, G. & Kirca, A. (2012). Firm innovativeness and its performance outcomes: A
meta-analytic review and theoretical integration. Journal of Marketing, 2012, 76,
130-147. doi:10.1509/jm.10.0494

188
Ryan, J., & Silvanto, S. (2013). The critical role of corporate brand equity in B2B
marketing: An example and analysis. The Marketing Review, 13, 39-50.
doi:10.1362/146934713X13590250137745
Sayem, M. (2012). Sustainability orientation: Driver of firms' innovativeness and
business performance. International Journal of Information, Business &
Management, 4, 75-84. Retrieved from http://www.ijibm.elitehall.com/
Schoemaker, P. H., Krupp, S., & Howland, S. (2013). Strategic leadership: The essential
skills. Harvard Business Review, 91, 131-134. Retrieved from
http://www.hbr.org/
Seebode, D., Jeanrenaud, S., & Bessant, J. (2012). Managing innovation for
sustainability. R & D Management, 42, 195-206. doi:10.1111/j.1467-
9310.2012.00678.x
Shafie, S. B., Siti-Nabiha, A. K., & Cheng Ling, T. (2014). Organizational culture,
transformational leadership and product innovation: A conceptual review.
International Journal of Organizational Innovation, 7, 30-43. Retrieved from
http://www.ijoi-online.org/
Simon, M.K (2013). Dissertation and scholarly research: A practical guide to start and
complete your dissertation, thesis, or formal research project (2013 ed.). Seattle,
WA: CreateSpace Independent Publishing.
Slotegraaf, R. J. (2012). Keep the door open: Innovating toward a more sustainable
future. Journal of Product Innovation Management, 29, 349-351.
doi:10.1111/j.1540-5885.2012.00905.x

189
Smith, W. K., Binns, A., & Tushman, M. L. (2010). Complex business models:
Managing strategic paradoxes simultaneously. Long Range Planning, 43, 448-
461. doi:10.106/j.lrp.2009.12.003
Smith, W. K., & Tushman, M. L. (2005). Managing strategic contradictions: A top
management model for managing innovation streams. Organization Science, 16,
522-536. doi:10.1287/orsc.1050.0134
Song, M., Im, S., Bij, H. D., & Song, L. Z. (2011). Does strategic planning enhance or
impede innovation and firm performance? Journal of Product Innovation
Management, 28, 503-520. doi:10.1111/j.1540-5885.2011.00822.x
Sonnenfeld, J., Kusin, M., & Walton E. (2013). What CEOs really think of their boards.
Harvard Business Review, 91, 98-106. Retrieved from http://www.hbr.org/
Sood, A., & Tellis, G. J. (2011). Demystifying disruption: A new model for
understanding and predicting disruptive technologies. Marketing Science, 30, 339-
354. doi:10.1287/mksc.1100.0617
Stock, R. M., & Zacharias, N. A. (2013). Two sides of the same coin: How do different
dimensions of product program innovativeness affect customer loyalty? Journal
of Product Innovation Management, 30, 516-532. doi:10.1111/jpim.12006
Tait, B. (2012). The mythic status brand model: Blending brain science and mythology to
create a new brand strategy tool. Journal of Brand Strategy, 1, 377-388. Retrieved
from http://www.henrysteward.com/

190
Talke, K., & Colarelli O'Connor, G. (2011). Conveying effective message content when
launching new industrial products. Journal of Product Innovation Management,
28, 943-956. doi:10.1111/j.1540-5885.2011.00852.x
Tarnawska, K. (2013). Eco-innovations - tools for the transition to green economy.
Economics & Management, 18, 735-743. doi:10.5755/j01.em.18.4.4485
Traub, L., & Brettel, M. (2014). Brand image volatility and stock market performance -
how do fluctuating customers' perceptions impact abnormal returns? Global
Conference on Business & Finance Proceedings, 9, 57-61. Retrieved from
http://www.theibfr.com/
Tung, J. (2012). A study of product innovation on firm performance. International
Journal of Organizational Innovation, 4, 84-97. Retrieved from http://www.ijoi-
online.org/
Vuorinen, M., Uusitalo, O., & Vos, M. (2012). Mapping critical factors in brand
management contributing to innovation. Journal of Business Studies Quarterly, 3,
58-76. Retrieved from https://www.jyx.jyu.fi/
Walden University. (2015). Guide for archival researchers completing the Walden IRB
application. Retrieved from
http://academicguides.waldenu.edu/researchcenter/orec/
Walden University. (2015). Research ethics planning worksheet. Retrieved from
http://academicguides.waldenu.edu/researchcenter/orec/
Weber, Y., & Tarba, S. Y. (2014). Strategic agility: A state of the art. California
Management Review, 56, 5-12. doi:10.1525/cmr.2014.56.3.5
191
Xu, C., & Yan, M. (2014). Radical or incremental innovations: R&D investment around
CEO retirement. Journal of Accounting, Auditing & Finance, 29, 547-576.
doi:10.1177/0148558X14538970
Yandava, B. (2012). A capability-driven turnaround strategy for the current economic
environment. Journal of Business Strategies, 29, 157-185. Retrieved from
http://www.shsu.edu/centers/cbed/journal/
Yuan, X., Guo, Z., & Fang, E. (2014). An examination of how and when the top
management team matters for firm innovativeness: The effects of TMT functional
backgrounds. Innovation: Management, Policy & Practice, 16, 323-342.
doi:10.5172/impp.2014.16.3.323

192
Appendix A: Data Use Agreement
Data Use Agreement
This Data Use Agreement (“Agreement”), effective as of January 17. 2016 (“Effective Date”), is entered into by and between Wayne Stamler (“Data Recipient”) and Dow Jones Robecosam (“Data Provider”). The purpose of this Agreement is to provide Data Recipient with access to a Limited Data Set (“LDS”) for use in research in accord with laws and regulations of the governing bodies associated with the Data Provider, Data Recipient, and Data Recipient’s educational program. In the case of a discrepancy among laws, the agreement shall follow whichever law is more strict.
1. Definitions. Due to the study’s affiliation with Laureate, a USA-based company,
unless otherwise specified in this Agreement, all capitalized terms used in this Agreement not otherwise defined have the meaning established for purposes of the USA “HIPAA Regulations” and/or “FERPA Regulations” codified in the United States Code of Federal Regulations, as amended from time to time.
2. Preparation of the LDS. Data Provider shall prepare and furnish to Data Recipient a LDS in accord with any applicable laws and regulations of the governing bodies associated with the Data Provider, Data Recipient, and Data Recipient’s educational program.
3. Data Fields in the LDS. No direct identifiers such as names may be included in the Limited Data Set (LDS). In preparing the LDS, Data Provider shall include the data fields specified as follows, which are the minimum necessary to accomplish the research: the datapoints the partner site will be providing include the ranking of every global company who participated and was evaluated by DJSI for each year between 2010 and 2015 inclusive.
4. Responsibilities of Data Recipient. Data Recipient agrees to:
a. Use or disclose the LDS only as permitted by this Agreement or as required by law;
b. Use appropriate safeguards to prevent use or disclosure of the LDS other than as permitted by this Agreement or required by law;
c. Report to Data Provider any use or disclosure of the LDS of which it becomes aware that is not permitted by this Agreement or required by law;
d. Require any of its subcontractors or agents that receive or have access to the LDS to agree to the same restrictions and conditions on the use and/or disclosure of the LDS that apply to Data Recipient under this Agreement; and

193
e. Not use the information in the LDS to identify or contact the individuals who are data subjects.
5. Permitted Uses and Disclosures of the LDS. Data Recipient may use and/or disclose the LDS for its Research activities only.
6. Term and Termination.
a. Term. The term of this Agreement shall commence as of the Effective Date and shall continue for so long as Data Recipient retains the LDS, unless sooner terminated as set forth in this Agreement.
b. Termination by Data Recipient. Data Recipient may terminate this agreement at any time by notifying the Data Provider and returning or destroying the LDS.
c. Termination by Data Provider. Data Provider may terminate this agreement at any time by providing thirty (30) days prior written notice to Data Recipient.
d. For Breach. Data Provider shall provide written notice to Data Recipient within ten (10) days of any determination that Data Recipient has breached a material term of this Agreement. Data Provider shall afford Data Recipient an opportunity to cure said alleged material breach upon mutually agreeable terms. Failure to agree on mutually agreeable terms for cure within thirty (30) days shall be grounds for the immediate termination of this Agreement by Data Provider.
e. Effect of Termination. Sections 1, 4, 5, 6(e) and 7 of this Agreement shall survive any termination of this Agreement under subsections c or d.
7. Miscellaneous.
a. Change in Law. The parties agree to negotiate in good faith to amend this Agreement to comport with changes in federal law that materially alter either or both parties’ obligations under this Agreement. Provided however, that if the parties are unable to agree to mutually acceptable amendment(s) by the compliance date of the change in applicable law or regulations, either Party may terminate this Agreement as provided in section 6.
b. Construction of Terms. The terms of this Agreement shall be construed to give effect to applicable federal interpretative guidance regarding the HIPAA Regulations.

194
c. No Third Party Beneficiaries. Nothing in this Agreement shall confer upon any person other than the parties and their respective successors or assigns, any rights, remedies, obligations, or liabilities whatsoever.
d. Counterparts. This Agreement may be executed in one or more counterparts, each of which shall be deemed an original, but all of which together shall constitute one and the same instrument.
e. Headings. The headings and other captions in this Agreement are for convenience and reference only and shall not be used in interpreting, construing or enforcing any of the provisions of this Agreement.
IN WITNESS WHEREOF, each of the undersigned has caused this Agreement to be duly executed in its name and on its behalf. DATA PROVIDER DATA RECIPIENT Signed: Signed: Print Name: Print Name: Wayne Stamler Print Title: Print Title: DBA Candidate Walden University DJSI Personal Code: XXXXXXXX

195
Appendix B: Confidentiality and Nondisclosure Agreement

196