Embed Size (px)
Citation preview

Stra
tegi
c Lea
ders
hip
Clos
ure,
Trus
t, an
d Re
puta
tion
(pag
e 1)
Closure, Trust, and Reputation:The Third Rule of Social Capital
and Strategic Partners
Appendices:I. Measuring Network Closure/Embedding (page 42, from 2007 "Closure & Stability")II. Closure/Embedding and the Theory of the Firm (page 43, from 1992 Structural Holes; 1924 Legal Foundations of Capitalism)III. Closure and Learning Curves (pages 44-48, from 1919 Psychological Monographs, 1965 Review of Economics and Statistics,
1992 Upside, 1998 Perspectives on Strategy, 1999 Organizational Learning)IV. Snipits on Business Culture (pages 49-52, 1998 Financial Times, other)V. Why Don't People Discount Gossip? (page 53, from 2005 Brokerage and Closure)VI. Detail on Reputation & Echo vs Bandwidth (pages 54-55, 2008 "Gossip and reputation" in Management et Réseaux Sociaux)VII. Groupthink and Unlearning (pages 56-57)VIII. Sources of Variance in 360 Evaluations (pages 58-59)
IX. Mobbing (page 60, 1999 The Mobbing Encyclopedia)X. Exception that Proves the Rule on Secondhand Brokerage (page 61, from 2010 Neighbor Networks))XI. Other Partner Networks and Integration Failures (pages 62-64)
XII. Gossip-Enforced Walls Reinforce Outsider Feelings of Inferiority (page 65, based on 1965 The Established and the Outsiders)
This handout was prepared by Ron Burt as a basis for discussion in executive education (Copyright © 2019 Ronald S. Burt, all rights reserved).To download work referenced here, or research/teaching materials on related topics, go to http://faculty.chicagobooth.edu/ronald.burt.
For text on this session, see Chapters 3 and 4 in Brokerage and Closure, and Chapter 7 in Neighbor Networks.

Stra
tegi
c Lea
ders
hip
Clos
ure,
Trus
t, an
d Re
puta
tion
(pag
e 2)
(“The Bull,” 1917 Berlin political cartoon of Bavarian bourgeois)
Stra
tegi
c Le
ader
ship
Foun
datio
ns (p
age
3)
CEO
C-Suite
Heir Apparent
Other Senior Person
Yanjie
B
BB
B
Jim
Bob
B
B
B
Social Networkat the Topof the CompanyLines indicate frequent and substantive work discussion; heavy lines especiallyclose relationships.
Asia
US
EU and Emerging Markets
R&DFrontOffice
Back Office
Figure 1 in Burt, "Network disadvantaged entrepreneurs" (Entrepreneurship Theory & Practice, 2019)
FrontOffice
JIM is a WARLORD in US BUSINESS, Illustrating Rule 1 of Network Advantage:
Close the network around your contacts to promote trust and efficiency.

Stra
tegi
c Lea
ders
hip
Clos
ure,
Trus
t, an
d Re
puta
tion
(pag
e 3)
Stra
tegi
c Le
ader
ship
Foun
datio
ns (p
age
3)
CEO
C-Suite
Heir Apparent
Other Senior Person
Yanjie
B
BB
B
Jim
Bob
B
B
B
Social Networkat the Topof the CompanyLines indicate frequent and substantive work discussion; heavy lines especiallyclose relationships.
Asia
US
EU and Emerging Markets
R&DFrontOffice
Back Office
Figure 1 in Burt, "Network disadvantaged entrepreneurs" (Entrepreneurship Theory & Practice, 2019)
RULE 3: For bottom-line growth, closed networks facilitate and maintain trust and reputation within the network, promoting reliable, efficient operations within the network (Sherif, 1935; Festinger et al., 1950; Asch, 1951; Katz and Lazarsfeld, 1955; Granovetter, 1985, 1992; Burt, 1987; Coleman, 1988; Greif, 1989; Ellickson, 1991; Bernstein, 1992, 2001; Barker, 1993; Putnam, 1993; Uzzi, 1997; Burt, 2005:Chps. 3-4).

Stra
tegi
c Lea
ders
hip
Clos
ure,
Trus
t, an
d Re
puta
tion
(pag
e 4)
Trust Builds withinRelationships Slowly
TRUST — committing to an exchange before you know how the other will behave.
REPUTATION — extent to which you are known as trustworthy.
I. Good Behavior as theSource of Trust
third parties irrelevant to trust & distrusttoo slow (graph to right), too dangerous
(Burt, 1999, "Private games are too dangerous")
II. Network Closure and Structural Embedding as the Source,
Bandwidth Storythird parties enhance information and
enforcement, and so facilitate trust (next page)
from Figure 3.2 in Brokerage and Closure
JJ
J
J J
J
J
JJ J
J J
J JJ
J
J J
J
J
J J J
J
JJ
JJ
JJJ J
J
JJ
J JJ
J
J
JJ J
J
JJ J
J
J
JJ
J
J J
J
J J
JJ
J
(710)10 ormore
Percent citedfor trust
Percent cited for distrust
(378)1 orless Years Known
(number of relationships in parentheses)
(370)2
(395)3
(121)9
(183)8
(145)7
(195)6
(275)5
(243)4
(170)(33) (76) (48) (85)(37)(48)(46)(82)(31)
(509)(782) (576) (311) (43)(89)(85)(180)(198)(190)
40%
30%
20%
10%
30%
20%
10%
30%
20%
10%
217 Staff Officersin Two Financial Services Firms
Cite 3,324 Colleagues
60 Senior Managers in a Chemicals FirmCite 656 Colleagues
284 Senior Managers in anElectronics & Computer Firm
Cite 3,015 Colleagues

Stra
tegi
c Lea
ders
hip
Clos
ure,
Trus
t, an
d Re
puta
tion
(pag
e 5)
Figure 3.1 in Brokerage and Closure (for discussion, see pages 105-111). See Appendix II on network embedding in the theory of the firm.
Robert Jessica Robert Jessica Robert Jessica
Situation ARobert New Acquaintance
(no embedding)
Situation BRobert Long-Time Colleague
("relational" embedding)
Situation CRobert Co-Member Group
("structural" embedding)
More connections allow more rapid communication, so poor behavior can be more readily detected and punished. Bureaucratic authority was the traditional engine for coordination in organizations (budget, head count). The new engine is reputation (e.g., eBay). In flattened-down organizations, leader roles are often ambiguous, so people need help knowing who to trust, and the boss needs help supervising her direct reports. Multi-point evaluation systems, often discussed as 360° evaluation systems, gather evaluative data from the people who work with an employee. These are "reputational" systems in that evaluations are the same data that define an employee's reputation in the company. In essence, reputation is the governance mechanism in social networks.
Closed Networks within the ClustersFacilitate Trust and Shared Beliefs
Stra
tegi
c Lea
ders
hip
Clos
ure,
Trus
t, an
d Re
puta
tion
(pag
e 6)
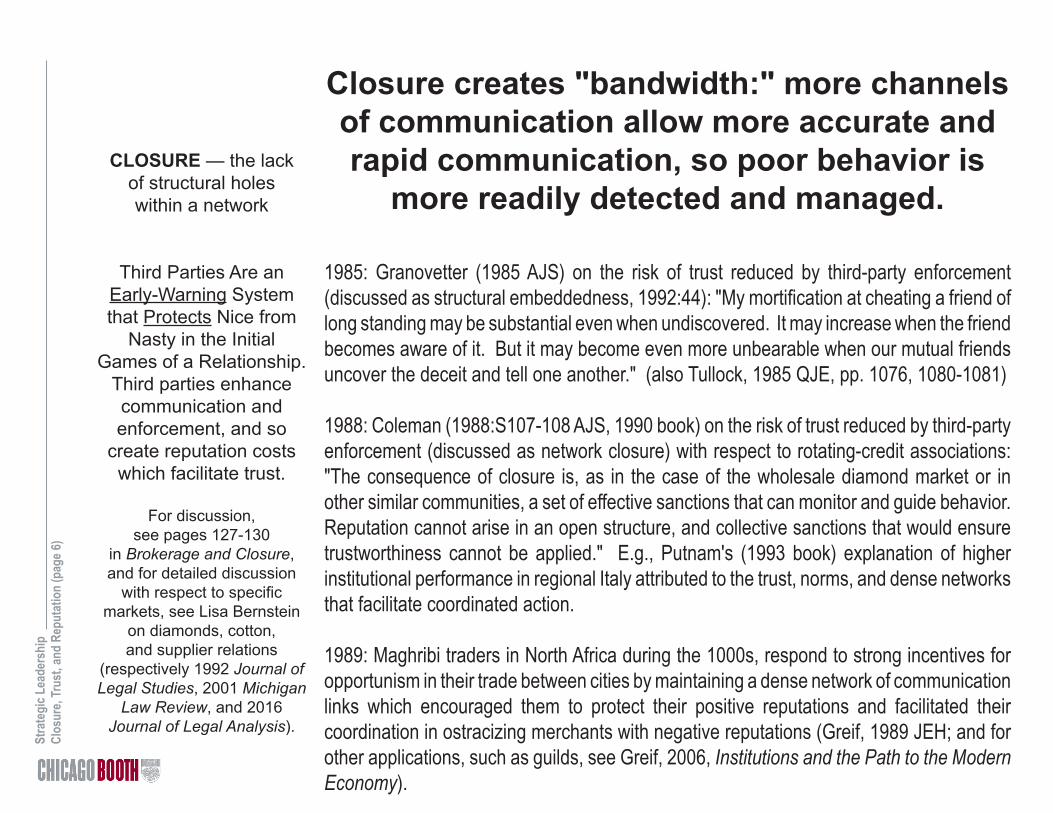
Closure creates "bandwidth:" more channels of communication allow more accurate and rapid communication, so poor behavior is
more readily detected and managed.
1985: Granovetter (1985 AJS) on the risk of trust reduced by third-party enforcement (discussed as structural embeddedness, 1992:44): "My mortification at cheating a friend of long standing may be substantial even when undiscovered. It may increase when the friend becomes aware of it. But it may become even more unbearable when our mutual friends uncover the deceit and tell one another." (also Tullock, 1985 QJE, pp. 1076, 1080-1081)
1988: Coleman (1988:S107-108 AJS, 1990 book) on the risk of trust reduced by third-party enforcement (discussed as network closure) with respect to rotating-credit associations: "The consequence of closure is, as in the case of the wholesale diamond market or in other similar communities, a set of effective sanctions that can monitor and guide behavior. Reputation cannot arise in an open structure, and collective sanctions that would ensure trustworthiness cannot be applied." E.g., Putnam's (1993 book) explanation of higher institutional performance in regional Italy attributed to the trust, norms, and dense networks that facilitate coordinated action.
1989: Maghribi traders in North Africa during the 1000s, respond to strong incentives for opportunism in their trade between cities by maintaining a dense network of communication links which encouraged them to protect their positive reputations and facilitated their coordination in ostracizing merchants with negative reputations (Greif, 1989 JEH; and for other applications, such as guilds, see Greif, 2006, Institutions and the Path to the Modern Economy).
CLOSURE — the lackof structural holeswithin a network
Third Parties Are an Early-Warning System that Protects Nice from
Nasty in the Initial Games of a Relationship.
Third parties enhance communication and enforcement, and so
create reputation costs which facilitate trust.
For discussion, see pages 127-130
in Brokerage and Closure, and for detailed discussion
with respect to specific markets, see Lisa Bernstein
on diamonds, cotton, and supplier relations
(respectively 1992 Journal of Legal Studies, 2001 Michigan
Law Review, and 2016 Journal of Legal Analysis).

Stra
tegi
c Lea
ders
hip
Clos
ure,
Trus
t, an
d Re
puta
tion
(pag
e 7)
from Burt (2019, Structural Holes in Virtual Worlds). See Appendix I on measuring network closure/embedding.
Prob
abili
ty th
at R
elat
ions
hip
is C
ited
Nex
t Yea
r as
Goo
d or
Out
stan
ding
(z = 14.88)
Number of Third PartiesLinking Employee
with Colleague this Year
10+
A. Analysts and Investment Bankers
Mean Number of Third PartiesConnecting Banker with
Colleagues This Year
Mea
n C
orre
latio
n fo
rB
anke
r’s R
eput
atio
nfr
om th
is Y
ear t
o N
ext
(13-
pers
on s
ubsa
mpl
e)
banker banker
1
2
3
4
1 2 3 4
1
2
3
4
1 2 3 4
10+
B. Investment Bankers
(t = 8.10)
“Reputation cannot arise in an open structure.”(AJS, Coleman, 1988:S107)
Closure-Trust Associations, ManagementDots are average Y scores within intervals of X. Graph A describes 46,231 observed colleague relations with analysts and
bankers over a four-year period (adapted from Burt, 2010: 174-175). Vertical axis is the proportion of relations cited next year as good or outstanding. Horizontal axis is number of mutual contacts this year. Logit z-score test statistics are estimated with controls for differences in network size and adjusted for autocorrelation between relationships (Stata "cluster" option). Graph B describes for the bankers subsample correlations between positive (above average) and negative (below average) reputa-tions this year and next year (adapted from Burt, 2010:166; routine t-tests reported across 1,179 banker-year observations).

Stra
tegi
c Lea
ders
hip
Clos
ure,
Trus
t, an
d Re
puta
tion
(pag
e 8)
from Figure 4.8 in Brokerage and Closure. For general discussion of structural embedding primarily facilitating the formation of relations rather than their long-term survival, see Dahlander & McFarland (2013 ASQ), "Ties that last: tie formation and persistence in research collaborations over time."
0.0
0.1
0.2
0.3
0.4
0.5
0.6
0.7
0.8
0.9
1.0
0 1 2 3 4 5 6 7 8 9 10
Bridge relationships(employee and colleaguehave no mutual contacts)
Relationships embedded in closed network of one or more mutual colleagues
One of the 25%most embeddedrelationships
Relationship Duration(in years, up through this year)
Prob
abili
ty th
at R
elat
ions
hip
Dec
ays
befo
re N
ext Y
ear
(rel
atio
n ci
ted
this
yea
r is
not c
ited
next
yea
r)
Closure Slows Decay,which allows new connections (with friends of friends)
to mature.
In this management, closure has its effect in
the first two yearsof a relationship.
These are decay functions for colleague relations with
investment bankers and analysts during the 1990s.
Logit z-scores in parentheses below (based on 46,231
relations).

Stra
tegi
c Lea
ders
hip
Clos
ure,
Trus
t, an
d Re
puta
tion
(pag
e 9)
Network Closure and Trust in China
NOTE — Dots are average Y scores at each level of X. Graph A describes 46,231 observed colleague relations with analysts and bankers
over a four-year period (adapted from Burt, 2010:174-175). Vertical axis is proportion of relations cited next year as good or outstanding.
Horizontal axis is number of mutual contacts this year. Graph B describes 4,464 relationships cited by the 700 Chinese entrepreneurs.
Vertical axis is mean respondent trust in the contact, measured on a five-point scale. Horizontal axis is the number of other people in a
respondent’s network connected with the contact being evaluated for trust. Test statistics are estimated in both graphs with controls for
differences in network size and adjusted for autocorrelation between relationships. Figure is adapted from Burt and Burzynska (2017: 234).
Prob
abili
ty th
at R
elat
ions
hip
is C
ited
Nex
t Yea
r as
Goo
d or
Out
stan
ding
A. Relations withCurrent Colleagues
(z = 14.88)
D. Relations with Continuing Colleagues(first cited two years
ago, z = 0.81)
10+
Western Analystsand Bankers
6+
Res
pond
ent E
valu
atio
n of
Tru
st in
Con
tact
(1 fo
r sus
pect
, 5 fo
r com
plet
e tru
st)
ChineseEntrepreneurs
Network ClosureNumber of Third Parties
Linking this YearEvaluator with Evaluated
Network ClosureNumber of Third Parties
Linking Respondentwith Contact
C. Relations with Founding ContactsC. Relations with Other Event ContactsB. Relations with Other Contacts
(t = 25.79)
(t = 10.19)
(t = 3.01)
Figure 4 in Burt and Burzynska, "Chinese entrepreneurs, social networks, and guanxi," (2017 Management and Organization Review). Detailed discussion of guanxi ties is given in Burt and Opper, "What is guanxi?" (2019).
Similar Patterns in American and Chinese Business(closure facilitates relations maturing into self-sustaining guanxi)
Western Analystsand Bankers
ChineseEntrepreneurs 6+
Z-score residuals when China trust is predicted with
Western model A (dots show 95% CI around mean).
Stra
tegi
c Lea
ders
hip
Clos
ure,
Trus
t, an
d Re
puta
tion
(pag
e 10)
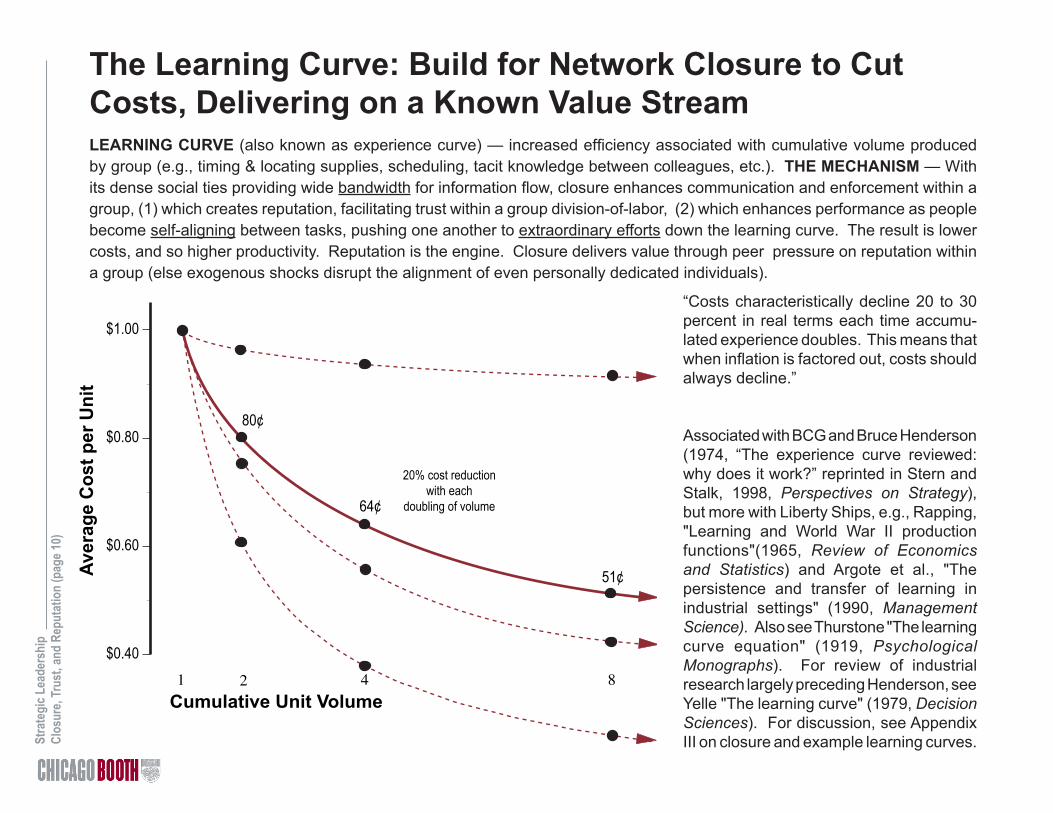
The Learning Curve: Build for Network Closure to Cut Costs, Delivering on a Known Value StreamLEARNING CURVE (also known as experience curve) — increased efficiency associated with cumulative volume produced by group (e.g., timing & locating supplies, scheduling, tacit knowledge between colleagues, etc.). THE MECHANISM — With its dense social ties providing wide bandwidth for information flow, closure enhances communication and enforcement within a group, (1) which creates reputation, facilitating trust within a group division-of-labor, (2) which enhances performance as people become self-aligning between tasks, pushing one another to extraordinary efforts down the learning curve. The result is lower costs, and so higher productivity. Reputation is the engine. Closure delivers value through peer pressure on reputation within a group (else exogenous shocks disrupt the alignment of even personally dedicated individuals).
“Costs characteristically decline 20 to 30 percent in real terms each time accumu-lated experience doubles. This means that when inflation is factored out, costs should always decline.”
Associated with BCG and Bruce Henderson (1974, “The experience curve reviewed: why does it work?” reprinted in Stern and Stalk, 1998, Perspectives on Strategy), but more with Liberty Ships, e.g., Rapping, "Learning and World War II production functions"(1965, Review of Economics and Statistics) and Argote et al., "The persistence and transfer of learning in industrial settings" (1990, Management Science). Also see Thurstone "The learning curve equation" (1919, Psychological Monographs). For review of industrial research largely preceding Henderson, see Yelle "The learning curve" (1979, Decision Sciences). For discussion, see Appendix III on closure and example learning curves.
$0.40
$0.60
$0.80
$1.00
1 2 4 8
Ave
rag
e C
ost
per
Un
it
Cumulative Unit Volume
80¢
64¢
51¢
20% cost reductionwith each
doubling of volume

Stra
tegi
c Lea
ders
hip
Clos
ure,
Trus
t, an
d Re
puta
tion
(pag
e 11)
Network brokers are valuable as a sourceof innovation and growth, but given the lack of
closure around them, are they more likely to behave badly with colleagues?
HINT: Are they less managed by the network governance provided by closure?

Stra
tegi
c Lea
ders
hip
Clos
ure,
Trus
t, an
d Re
puta
tion
(pag
e 12)
Figure 2 in Burt and Wang, 2019, "Network brokers and bad behavior."
Network Constraint (x 100)many ——— Structural Holes ——— few
Num
ber A
ccus
atio
ns R
ecei
ved
Num
ber A
ccus
atio
ns M
ade
Network Brokers Are
More Involved in Bad
BehaviorThese are 1,135 annual
observations of 398 bankers over three years. Each year, a
banker is at risk of being accused of bad behavior
by colleagues in the annual review, and of
having to report difficult colleagues for their bad
behavior.
Received 5 accusations in the second year, and a total of 8 across years. Colleague comments about him:
- Moody, unprofessional, poor manager- Single-mindedness about his job- Short & ill-tempered, standoffish, rude- Untrustworthy & difficult to work with- While extremely competent & motivated,
he can be overbearing and at times insulting
Made 13 accusations in the first year. Received 2 accusations that year, and a total of 5 across years. Colleague comments about her:
- Untrustworthy, lacking in team work/integrity- Extremely intimidating; impatient, belittling &
argumentative individual- Moody, doesn’t share information- She wants to control everything & her thinking
is narrow-minded- Not user friendly

Stra
tegi
c Lea
ders
hip
Clos
ure,
Trus
t, an
d Re
puta
tion
(pag
e 13)
Citations Received Citations SentA B C D
Log Network Constraint-.75[.11]
(-6.59)
-.31[.19]
(-1.61)
-.96[.16]
(-5.84)
-.44[.24]
(-1.83)
InDegree (all evaluations) —.043
[.006](7.07)
—.006
[.008](0.81)
OutDegree (all evaluations) —-.006[.004](-1.47)
—.012
[.004](2.97)
Intercept .88 -1.33 1.16 -.85
N 1,135 1,135 1,135 1,135
Clusters 398 398 398 398
Chi-Square 43.38 112.40 34.09 55.11
d.f. 1 3 1 3
Demography of Bad Behavior: More Citations Generate More Cites for Bad Behavior
NOTE – Poisson regression models predicting number of bad-behavior citations received or sent in the annual peerevaluations (0, 1, 2, 3 or more, as in Table 2). Brackets contain standard errors. Parentheses contain z-score teststatistics. Coefficients are estimated across the three annual panels (standard errors are adjusted up for correlationbetween relations cited by same person using the “cluster” option in Stata). InDegree is the total number of positiveand negative citations a banker receives in a year from within and beyond the study population (0 minimum, 78maximum, 20.11 average). OutDegree is the total number of positive and negative citations a banker makes in ayear within and beyond the study population (0 minimum, 213 maximum, 21.78 average).
Table 3 in Burt and Wang, 2019, "Network brokers and bad behavior."
Stra
tegi
c Lea
ders
hip
Clos
ure,
Trus
t, an
d Re
puta
tion
(pag
e 14)
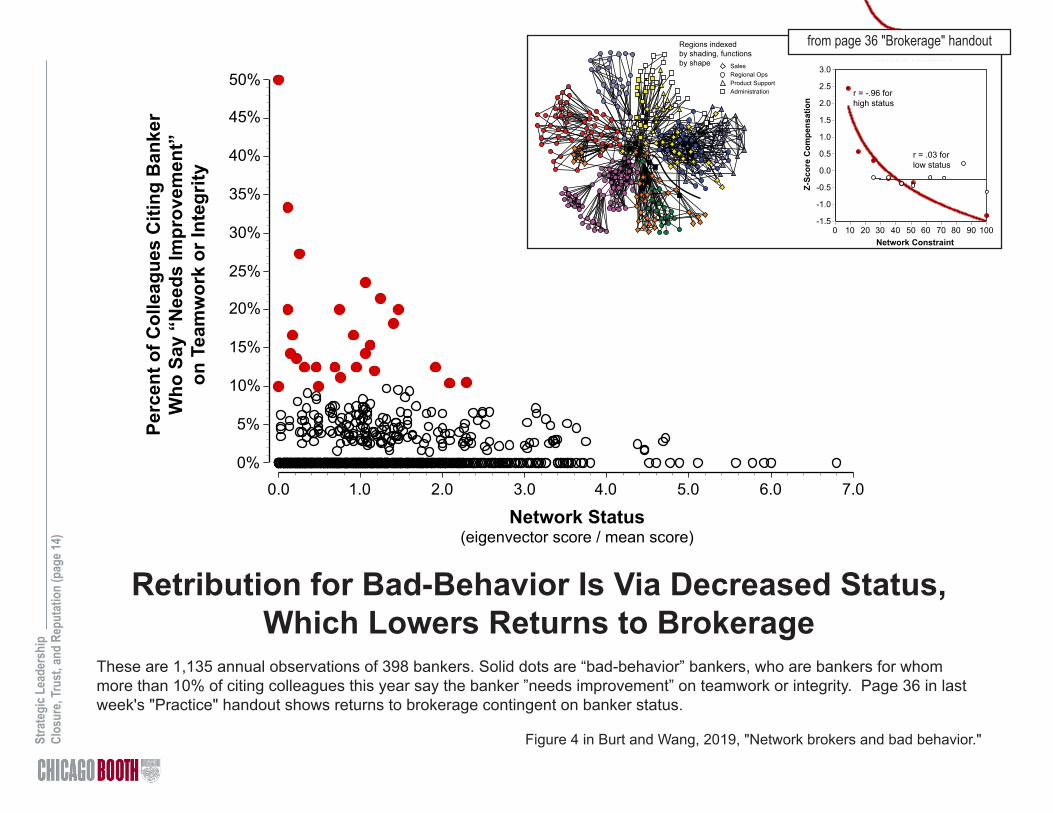
Retribution for Bad-Behavior Is Via Decreased Status, Which Lowers Returns to Brokerage
These are 1,135 annual observations of 398 bankers. Solid dots are “bad-behavior” bankers, who are bankers for whom more than 10% of citing colleagues this year say the banker ”needs improvement” on teamwork or integrity. Page 36 in last week's "Practice" handout shows returns to brokerage contingent on banker status.
Figure 4 in Burt and Wang, 2019, "Network brokers and bad behavior."
Network Status(eigenvector score / mean score)
Perc
ent o
f Col
leag
ues
Citi
ng B
anke
rW
ho S
ay “
Nee
ds Im
prov
emen
t”on
Tea
mw
ork
or In
tegr
ity
Stra
tegi
c Lea
ders
hip
Brok
erag
e Con
tinge
ncies
(pag
e 7)
Network Constraint
Z-Sc
ore
Com
pens
atio
nN
etw
ork
Stat
us(e
igen
vect
or s
core
/ m
ean
scor
e)
Sales Regional OpsProduct SupportAdministration
Regions indexedby shading, functions by shape
Network Constraint
R = .742
r = -.96 forhigh status
r = .03 forlow status
Audience Effect, II: Broker's Network Status Reassures or Concerns the Target Audience
Network status is on the vertical axis of the top graph. Status is defined in the same way that price is defined in the general
equilibrium model: Si = Sj zji Sj, where Si is status of person i, and zji is connection from j to i. Like price, status is only meaningful in reference to the status of some numeraire benchmark person.
Here, status is normalized at the mean, so a score of 1.0 indicates a person of average status in the network.
Sociogram is Figure 3.2 in Neighbor Networks and the graphs are from Figures 1 and 2 in Burt & Merluzzi discussion of the link between brokerage and network status as a reputation measures (2013, "Embedded brokerage," Research in the Sociology of Organizations)
Si = Sj zji Sjfrom page 36 "Brokerage" handout

Stra
tegi
c Lea
ders
hip
Clos
ure,
Trus
t, an
d Re
puta
tion
(pag
e 15)
Bottom-Line Performance Advantage of Closed Networks: Reputation Mechanism Generates Trust and Efficiency
By creating a wide bandwidth for information flow, closure enhances communication and personal visibility within a group,
(1) which creates reputation costs for individuals who express opinion or behavior inconsistent with group standards,
(2) which makes in-group bad behavior less likely, so trust is less risky,
(3) which enhances productivity as people become self-aligning in extraordinary efforts to preserve their reputation (lowering costs for labor, monitoring, quality, and speed).
Reputation is the mechanism by which closure has its effect. Closure delivers value by creating a reputation cost for deviation from cooperative, extraordinary effort. In other words, closure grows the bottom line. As illustrated by the examples on the previous page, you often see closure in the teamwork associated with successful efficiency programs such as TQM, SixSigma, and Lean Manufacturing.
See Appendix IV for industry differences in performance association with closure (strong culture).

Stra
tegi
c Lea
ders
hip
Clos
ure,
Trus
t, an
d Re
puta
tion
(pag
e 16)
In contrast to closure providing full information
("bandwidth"), closure in social networks
often creates selective reinforcement ("echo").
Third parties do not enhance information and protection so much as they create an echo that makes people feel more certain in their opinion of you.
Bias in selecting third parties (balance mechanism) — Faced with a decision about whether to trust you, the other person (ego) turns to trusted contacts before less close contacts for information on you. Trusted contacts are likely to have views similar to ego’s, so they are likely to report accounts of you consistent with ego’s own view. A preference for trusted third parties means that ego draws a sample of information on you consistent with his or her predisposition toward you.
Bias in what third parties say (etiquette mechanism) — It is polite in conversation to go along with the flow of sentiment being shared. We tend to share in conversations those of our facts consistent with the perceived predispositions of the people with whom we speak, and facts shared with other people are facts more likely to be remembered. The biased sample of facts shared in conversations becomes the population of information on, and so the reality of, the people discussed. For example (Higgans, 1992), an undergraduate subject is given a written description of a hypothetical person (Donald). The subject is asked to describe Donald to a second student who walks into the lab. The second person is a confederate who primes the conversation by leaking his predisposition toward Donald (“kinda likes” or “kinda dislikes” Donald). Subjects distort their descriptions of Donald toward the expressed predisposition. Positive predisposition elicits positive words about Donald’s ambiguous characteristics and neglect of negative concrete characteristics. Negative predisposition elicits negative words about Donald’s ambiguous characteristics and neglect of positive concrete characteristics. In sum, echo has the other person (ego) in vicarious play with you in gossip relayed by third parties. The sample of your behavior to which ego is exposed is biased by etiquette to be consistent with ego’s predisposition toward you. The result is that ego becomes ignorantly certain about you, and so more likely to trust or distrust you (as opposed to remaining undecided between the two extremes). Favorable opinion is amplified into trust. Doubt is amplified into distrust. The trust expected in strong relations is more likely and intense in relations embedded in strong third-party ties. The distrust expected in weak and negative relations is more likely and intense in relations embedded in strong third-party ties.
Third parties selectively repeat information and enforcement,
and so amplify relations
to extremes of trust and distrust.
See Section 4.1 inBrokerage and Closure,
Appendix V on why peopledon't discount gossip,
Dunbar (1996) Grooming, Gossip, and the Evolution of
Language.
Quidnunc (KWID-nunk, from Latin "what now", to English in 1709) - a person who seeks to know all the latest news or gossip. Example: I lowered my voice when I noticed that Nancy, the office quidnunc,
was standing right next to my cubicle hoping to overhear
what I was saying.
Civil Society
Felt Structural EquivalenceMobility (expats)
Highway ExperimentSingles Bar Rhetoric

Stra
tegi
c Lea
ders
hip
Clos
ure,
Trus
t, an
d Re
puta
tion
(pag
e 17)
Echo can be seen in the fact that
closure amplifies trust and distrust
such that
relations are balanced in their
intensity (certainty about the
colleague),
not in their direction (positive or negative about
the colleague).
J
J
JJ
J JJ
J JJ J J J J
J JJ
JJ
J
J J
J J
J J
J
JJ
J
JJ
J J
J J
JJ
J
J
10 or
more
10 or
more
8 6 4 2 0 0 2 4 6 8
J banker colleague
J
+
-
+
-
Number of NegativeThird-Party Ties
J banker colleague
J
+
-
-
+
Number of PositiveThird-Party Ties
J JJ
J0%
2%
6%
8%
14%
10%
12%
16%
18%
4%
Percent cited this year for trust
(outstanding for cooperation and integrity)
Percent cited this year for distrust
(poor or adequate in cooperation and integrity)
All Bankers Who Could Have Been Cited for Substantial Business Contact(118,680 relationships)
From Figure 3.4 and 4.3 in Brokerage and Closure.See Appendix I on measuring network closure/embedding.
Ilustrative Evidence: Positive Relations More Likely in Closed Networks — but Negative Are More Likely Also.
Stra
tegi
c Lea
ders
hip
Clos
ure,
Trus
t, an
d Re
puta
tion
(pag
e 18)
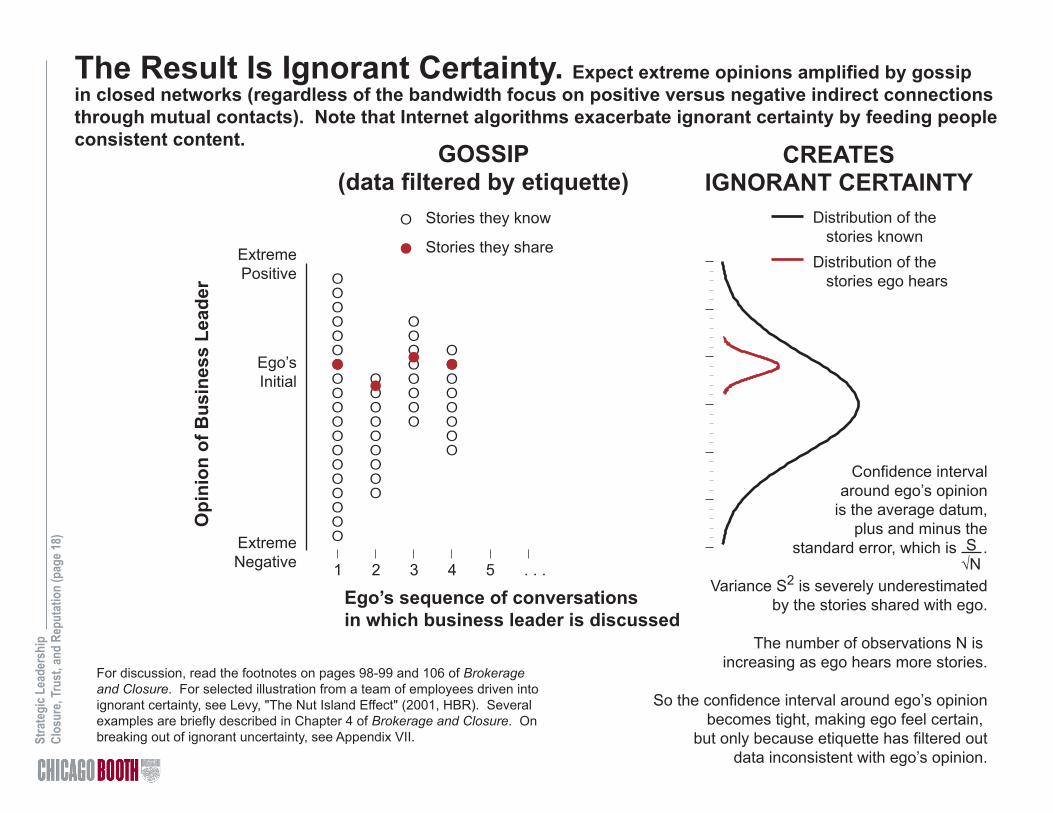
The Result Is Ignorant Certainty. Expect extreme opinions amplified by gossip in closed networks (regardless of the bandwidth focus on positive versus negative indirect connections through mutual contacts). Note that Internet algorithms exacerbate ignorant certainty by feeding people consistent content.
E
EEEEEEEEEEEEEEEEEE
EEEEEEEEE
EEEEEEEE
EEEEEEEE
J
J
JJ
1 2 3 4 5 . . .
E Stories they know
J Stories they shareExtremePositive
Ego’sInitial
ExtremeNegative
Ego’s sequence of conversations in which business leader is discussed
Distribution of the stories knownDistribution of the stories ego hears
Opi
nion
of B
usin
ess
Lead
er
GOSSIP(data filtered by etiquette)
CREATESIGNORANT CERTAINTY
Confidence intervalaround ego’s opinion
is the average datum,plus and minus the
standard error, which is .
Variance S2 is severely underestimatedby the stories shared with ego.
The number of observations N is increasing as ego hears more stories.
So the confidence interval around ego’s opinionbecomes tight, making ego feel certain,
but only because etiquette has filtered outdata inconsistent with ego’s opinion.
S √N
For discussion, read the footnotes on pages 98-99 and 106 of Brokerage and Closure. For selected illustration from a team of employees driven into ignorant certainty, see Levy, "The Nut Island Effect" (2001, HBR). Several examples are briefly described in Chapter 4 of Brokerage and Closure. On breaking out of ignorant uncertainty, see Appendix VII.

Stra
tegi
c Lea
ders
hip
Clos
ure,
Trus
t, an
d Re
puta
tion
(pag
e 19)
Echo Amplifies Opinions toExtremes in
ClosedNetworks:Character
Assassination
These are explanations from managers in electronic
equipment and financial services; from Table 1 in Burt “Entrepreneurs, Distrust, and Third Parties” (1999, Shared Cognition in Organizations).
Numbers in parentheses to the left are the hostility scores on
next page.
Some Managers Blame the Situation (n = 88) ( 0) conflict of goals; what was good for him was bad for my group( 25) different management style and motivation( 0) I do not know; most likely a misunderstanding of my work rather than him personally( 25) influential; has different view of importance and implementation of my current function( 0) language barrier was very difficult( 38) little or no interest in my functional area yet is my boss’ boss( 0) managed a parallel sales organization with a different philosophy( 13) personally we got along wonderfully, but people in her organization have a difficult style( 0) representative of an organization that has goals and objectives in opposition to to mine( 0) she is under a lot of pressure and it spills over to the people around her
Some Managers Blame the Other Person’s Competence (n = 200) ( 63) almost always makes unreasonable schedule and cost demands( 13) does not understand his functional area( 25) her planning requests do not take into account time difference between NY and Europe(100) incompetent; can not make a decision and stick with it( 75) inexperienced; too emotional and immature to manage his organization( 50) micromanagement; poor understanding of our client group's needs( 25) mixed messages; no road map of clear direction( 0) not able to effectively affect change in organizational direction( 88) promoted too high, too fast; beyond her level of experience( 75) wastes people's time requiring work be done over 20-30 times, eventually doing it herself
Some Managers Blame the Other Person’s Character (n = 228) (100) dishonest; self-serving; no integrity(100) divide and conquer person; takes credit for my work; disempowers(100) egotistical; self-oriented; liar; worst manager I have ever met(100) jerk; power-hungry; political; etc....(100) lone ranger type; my way is the only way( 88) loses her temper and has a very unprofessional attitude with myself and external clients(100) manipulative - insensitive to people - dishonest(100) most territorial, uncooperative person I know(100) my boss and a charlatan(100) nasty, ill-tempered bitch(100) not trustworthy; a back-stabber( 88) person can not accept females(100) secretive; insecure( 88) shared private information with manager & peers(100) unethical; uncooperative; unpleasant

Stra
tegi
c Lea
ders
hip
Clos
ure,
Trus
t, an
d Re
puta
tion
(pag
e 20)
Anger and Character Assassination in Closed Networks
From Figure 4.4 in Brokerage and Closure.
Blame Colleague’sCharacter (e.g., “unethical
charlatan,” “back-stabber,”“nasty, ill-tempered;’ n = 90)
0% 20% 40% 60% 80% 100% 0 20 40 60 80 100
Third-Party T ie s Surrounding Explained Relationship
Anger in the Explanation
(93.33 chi-square, 2 d.f., P < .001) (box shows 25%, mean, 75%; 11.56 t-test for
association with strong third-party ties, P < .001)
Weak third-party ties Strong third-party ties
79%
21%
47%
53%
4%
96%
Blame the Situation(e.g., “language barrier,”
“parallel organization,”conflict of goals;” n = 63)
Blame Colleague’sCompetence
(e.g., “promoted too high,too fast;” n = 103)

Stra
tegi
c Lea
ders
hip
Clos
ure,
Trus
t, an
d Re
puta
tion
(pag
e 21)
Figure 5 in Burt and Luo, "Angry entrepreneurs" (2020, Social Networks at Work)
More Specifically, Who Is Proneto Blaming Broker Character?

Stra
tegi
c Lea
ders
hip
Clos
ure,
Trus
t, an
d Re
puta
tion
(pag
e 22)
CA Index Predicts Difficulty and Blame (Plotted data are averages within .1 intervals of CA index.)
A. Who Is Cited as Most Difficult?
(Parentheses contain number of relations at each level of CA index.)
B. Who Blames Difficulty on Other’s Character?
(Parentheses contain number of respondents at each level of CA index.)
21.49 logit test statistic with700 respondent fixed effects4,464 observations
Coder 1 (8.53 test statistic)Coder 2 (6.20 test statistic)Adjudicated (7.39 test stat.)
700 observations
Figure 5 in Burt and Luo, "Angry entrepreneurs" (2020, Social Networks at Work)
Stra
tegi
c Lea
ders
hip
Clos
ure,
Trus
t, an
d Re
puta
tion
(pag
e 23)
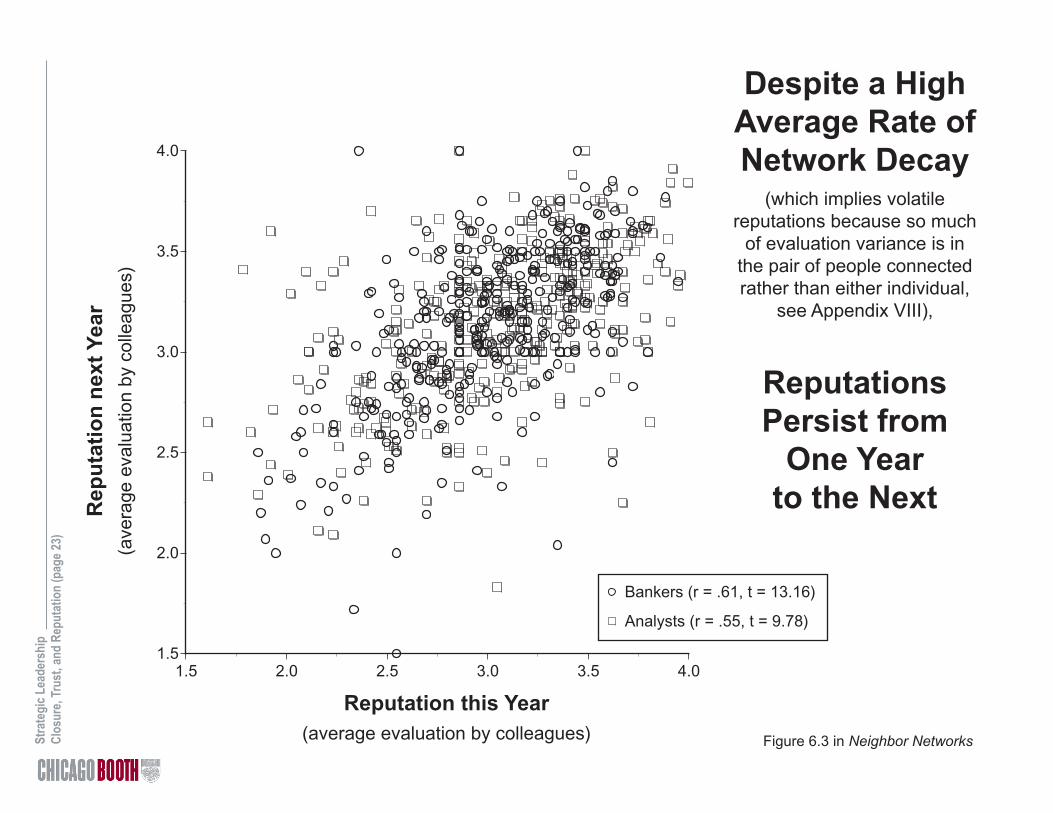
Despite a High Average Rate of Network Decay
(which implies volatile reputations because so much
of evaluation variance is in the pair of people connected rather than either individual,
see Appendix VIII),
Reputations Persist from
One Year to the Next
1.5
2.0
2.5
3.0
3.5
4.0
1.5 2.0 2.5 3.0 3.5 4.0
Bankers (r = .61, t = 13.16)
Analysts (r = .55, t = 9.78)
Reputation this Year(average evaluation by colleagues)
Rep
uta
tio
n n
ext
Yea
r(a
vera
ge e
valu
atio
n by
col
leag
ues)
Figure 6.3 in Neighbor Networks
Stra
tegi
c Lea
ders
hip
Clos
ure,
Trus
t, an
d Re
puta
tion
(pag
e 24)
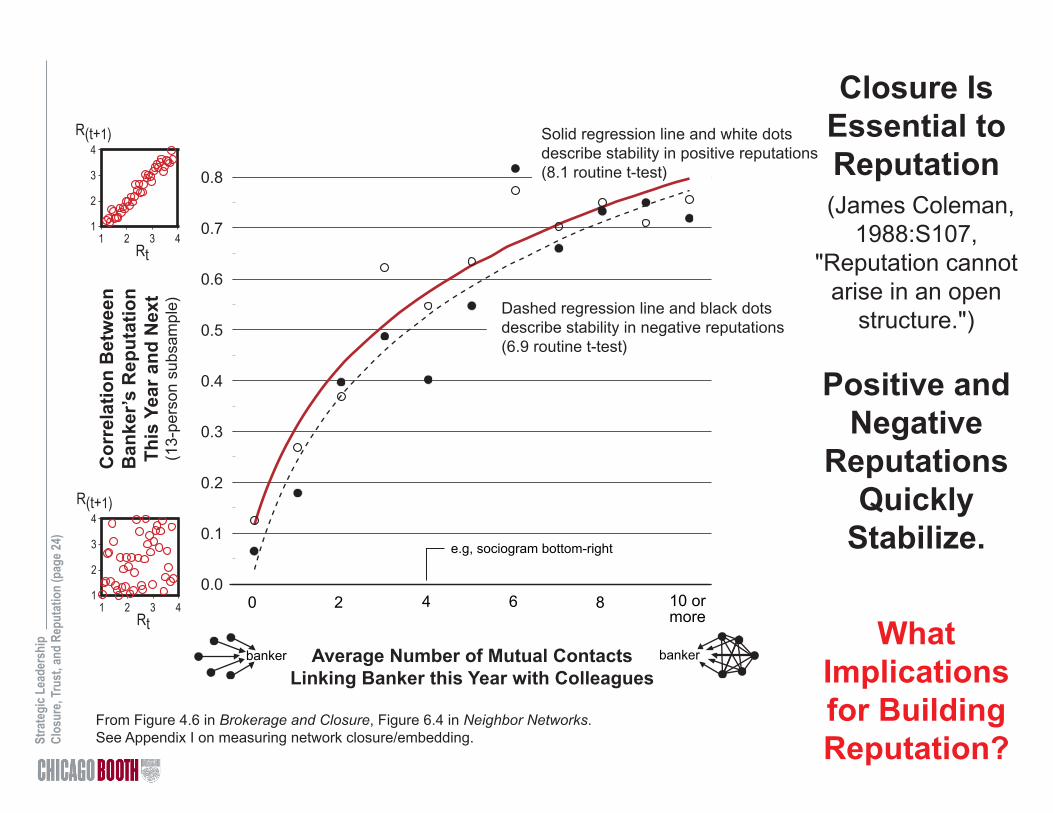
Closure IsEssential toReputation
(James Coleman, 1988:S107,
"Reputation cannot arise in an open
structure.")
Positive and Negative
Reputations Quickly
Stabilize.
WhatImplicationsfor Building Reputation?
From Figure 4.6 in Brokerage and Closure, Figure 6.4 in Neighbor Networks.See Appendix I on measuring network closure/embedding.
0.0
0.1
0.2
0.3
0.4
0.5
0.6
0.7
0.8
0 2 4 6 8 10 ormore
Co
rrel
atio
n B
etw
een
Ban
ker’
s R
epu
tati
on
Th
is Y
ear
and
Nex
t(1
3-pe
rson
sub
sam
ple)
1
2
3
4
1 2 3 4Rt
R(t+1)
1
2
3
4
1 2 3 4Rt
R(t+1)
Average Number of Mutual ContactsLinking Banker this Year with Colleagues
banker banker
e.g, sociogram bottom-right
Solid regression line and white dotsdescribe stability in positive reputations(8.1 routine t-test)
Dashed regression line and black dotsdescribe stability in negative reputations(6.9 routine t-test)

Stra
tegi
c Lea
ders
hip
Clos
ure,
Trus
t, an
d Re
puta
tion
(pag
e 25)
Implications for Managing Reputation
From Burt (2019, Structural Holes in Virtual Worlds).
Questions:
When Closure Creates Bandwidth (e.g., Amazon, eBay)
When Closure Creates Echo (most social networks)
1. What makes your reputation persist?
Your consistent behavior, on which others are informed. The bandwidth provided by a closed network enhances information distribution and consistency.
2. Therefore, who owns your reputation?
You do. It is defined directly and indirectly by your behavior.
3. So, what are the implications for effectively building reputation?
Behave well and get the word out.
4. How many reputations do you have? (Does the relevant network distribute or filter information?)
One reputation, defined by your behavior. Variation can exist from imperfect information distribution or conflicting interests, but variation is resolved by finding the true, authentic you.

Stra
tegi
c Lea
ders
hip
Clos
ure,
Trus
t, an
d Re
puta
tion
(pag
e 26)
Essential Closure Is Around Contacts, Maintaining the Reputations of Brokers and People in Closed Networks
Vertical axis is same as on page 24. Horizontal axis is average number of third party connections in the networks around banker's contacts (rounded to nearest whole number). Brokers are bankers with below-median network constraint this year. Regression lines go through averages plotted in the graph. Test statistics are adjusted down for correlation between repeated observations of the same bankers using the "cluster" option in Stata. Note that CA index on page 21 does not include closure around the person whose reputation is being evaluated.
Mea
n C
orre
latio
n fo
rB
anke
r’s R
eput
atio
nfr
om th
is Y
ear t
o N
ext
(13-
pers
on s
ubsa
mpl
e)
1
2
3
4
1 2 3 4
1
2
3
4
1 2 3 4
Mean Number of Third PartiesConnecting People in the Networksaround Banker’s Contacts this Year
banker banker
10 ormore
Brokers (8): Y = .248 + .202 log(X), n = 894, t = 13.0
Other (J): Y = -.047 + .274 log(X), n = 897, t = 15.1
X = 0 X = 1.5
From Burt (2019, Structural Holes in Virtual Worlds).

Stra
tegi
c Lea
ders
hip
Clos
ure,
Trus
t, an
d Re
puta
tion
(pag
e 27)
Drawing together characteristics of closed networks in the discussions we've had, it is a short step to infer that the comfort and safety of working within a closed network, protected by the reputation mechanism, combined with the character assassination facilatated by sympathetic colleagues within the closed network, combine to create a social barrier between "us" inside the network versus "them" outside the network.
Stra
tegi
c Le
ader
ship
Foun
datio
ns (p
age
21)
From Figure 4 and Table 1 in Opper, Burt, and Holm (2018), "Social network and cooperation with strangers."
Network Closureand
Cooperationwith Strangers
The more closed the inside, the more suspicious the outside,
Especially for people who have been successful with a closed network.
A Behavioral Measure of Cooperation “Like you, the other player is CEO of a Chinese firm, and a citizen of China.”
Move by Other Player
Your Move: Cooperate Defect
Cooperate 250, 250 50, 400
Defect 400, 50 100, 100
Network Closure(measured by network constraint)
Observations are averages for 5-point intervals on X, with tails of X truncated for infrequency. Correlation is computed from
data in the graph. Solid/hollow dots are averages for more/less successful entrepreneurs (respectively distinguished by
above/below median profit last year).
r = -.87
Adam Aronson in 1985Co-founded Mark Twain Bancshares in 1970,
at age 52, and sold in 1997; also founded severalnonprofit organizations dedicated to the arts.

Stra
tegi
c Lea
ders
hip
Clos
ure,
Trus
t, an
d Re
puta
tion
(pag
e 28)
See Erikson (1966), The Wayward Puritans, Boyer and Nissenbaum (1974), Salem Possessed, on social networks in the Salem witch hunt. See Brokerage and Closure on motivations in gossip (pp. 172-178), and Chapter 7 of Neighbor Networks on distrust of people who deemed not to be "mishpokhe."
Clockwise:
1692 map of Salem town and farms.
Examining accused witch for stigmata.
George Jacobs trial.
Especially When Those People Are Concerned or Afraidso they find security by enforcing the social boundary around people "like us" with witch hunts and mobbing. We define who we are in part by who we are not. The esprit of high-performance teams such as the Data General and Macintosh teams seen in class often comes at the price of designating a common enemy and castigating certain kinds of people as outsiders. More severe oppression of outsiders occurs when insiders are more insecure. Status insecurity, which can result from economic, political, social, even personal factors, is a traditional wellspring for witch hunts, known in contemporary organizations as "mobbing."
From Durkheim's (1893:102) classic study of identity and the division of labor: "Of course, we always love the company of those who feel and think as we do, but it is with passion . . . that we seek it immediately after discussions where our common beliefs have been greatly combated. Crime brings together upright consciences and concentrates them. We have only to notice what happens, particularly in a small town, when some moral scandal has just been commit-ted. They stop each other on the street, they visit each other, they seek to come together to talk of the event and to wax indignant in common." Hoffer (1951: 91) strips away the academic tone: ‘‘Mass movements can rise and spread without belief in a God, but never without belief in a devil. Usually the strength of a mass movement is proportionate to the vividness and tangibility of its devil.’’

Stra
tegi
c Lea
ders
hip
Clos
ure,
Trus
t, an
d Re
puta
tion
(pag
e 29)
In day-to-day business, insider-outsider distinctions occur in casual conversation as gossip-enforced stereotypes about "those people," which undermines the cooperation and coordination needed to harvest the value of brokerage across groups.
A pathology of closed networks is that insiders can find community with one another by jointly denouncing outsiders — kinds of people not "as good as" insiders (see Appendix IX on mobbing). Derogatory stories about outsiders, shared in gossip among insiders, strengthen insider relationships — to the detriment of people deemed outsiders. An organization or market has a diversity problem when proposals are discounted not because of proposal content, but because of the kind of person or group making the proposal. The youth of the young man in the video proposing FedEx to his older colleagues was an example in the previous session.
How can you identify the problem when you're not getting through to a target audience? Is it me, or is it them discounting people like me? Here are the three indicator metrics, in order of increasing sophistication, used to answer the question:
Quotas (Representative numbers at each grade? journalists)
Returns to Human Capital (Equal pay for equal work? lawyers)
Returns to Social Capital (Equal opportunity for equal work? executives)

Stra
tegi
c Lea
ders
hip
Clos
ure,
Trus
t, an
d Re
puta
tion
(pag
e 30)
Early
Pro
mot
ion
(in y
ears
)
C. Diversity
Women and Junior Menr = .30
t = 3.38P < .01
Senior Menr = -.40
t = -5.56P < .001
Network Constraint
Early
Pro
mot
ion
(in y
ears
)
"That's an excellent suggestion, Miss Triggs. Perhaps one of the men here would like to suggest it." (Punch, 8 January, 1988)
Diversity Problem Here is in the Returns to Social Capital, not Returns to Human Capital
Recall that trust & reputation are critical to successful network brokers. Every would-be broker is suspect from time to time, so occasional brokerage moves are bound to fail. But a category of people systematically denied returns to brokerage indicates a gossip-enforced barrier to coordination, as illustrated by the women and junior men here.
Stra
tegi
c Lea
ders
hip
Clos
ure,
Trus
t, an
d Re
puta
tion
(pag
e 31)
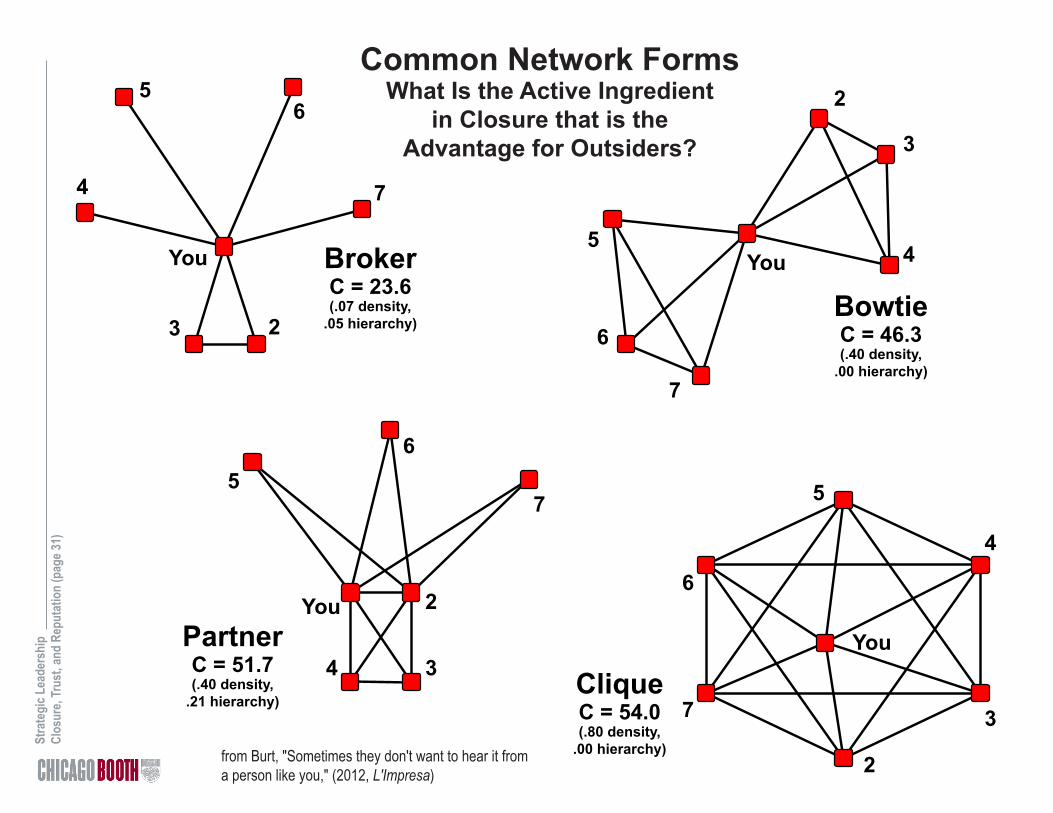
You
2
4
5
6
7CliqueC = 54.0(.80 density,
.00 hierarchy)
BowtieC = 46.3(.40 density,
.00 hierarchy)
PartnerC = 51.7(.40 density,
.21 hierarchy)
BrokerC = 23.6(.07 density,
.05 hierarchy)
You
2
45
6
7
You 2
4
56
7
You
2
4
56
7
3
3
3
3
Common Network FormsWhat Is the Active Ingredient
in Closure that is the Advantage for Outsiders?
from Burt, "Sometimes they don't want to hear it from a person like you," (2012, L'Impresa)
Stra
tegi
c Lea
ders
hip
Clos
ure,
Trus
t, an
d Re
puta
tion
(pag
e 32)
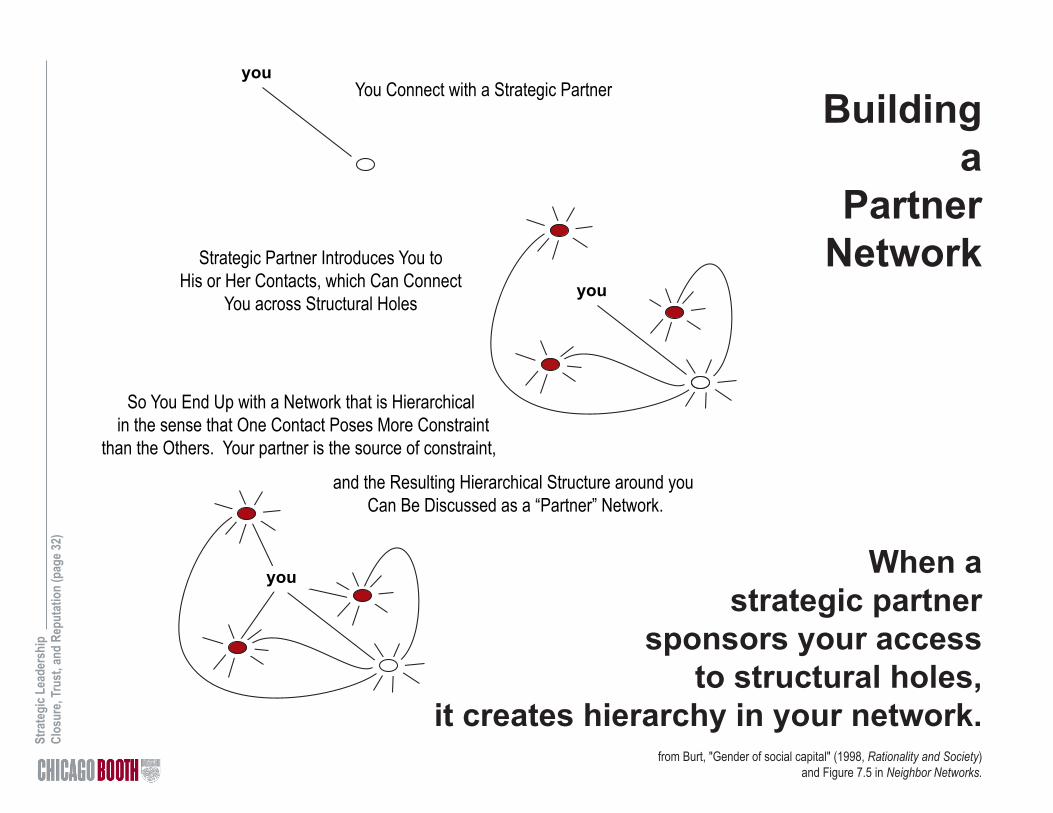
Building a
Partner Network
When a strategic partner
sponsors your access to structural holes,
it creates hierarchy in your network.
You Connect with a Strategic Partner
So You End Up with a Network that is Hierarchical in the sense that One Contact Poses More Constraint
than the Others. Your partner is the source of constraint,
you
you
Strategic Partner Introduces You toHis or Her Contacts, which Can Connect
You across Structural Holes
and the Resulting Hierarchical Structure around you Can Be Discussed as a “Partner” Network.
you
from Burt, "Gender of social capital" (1998, Rationality and Society) and Figure 7.5 in Neighbor Networks.
Stra
tegi
c Lea
ders
hip
Clos
ure,
Trus
t, an
d Re
puta
tion
(pag
e 33)
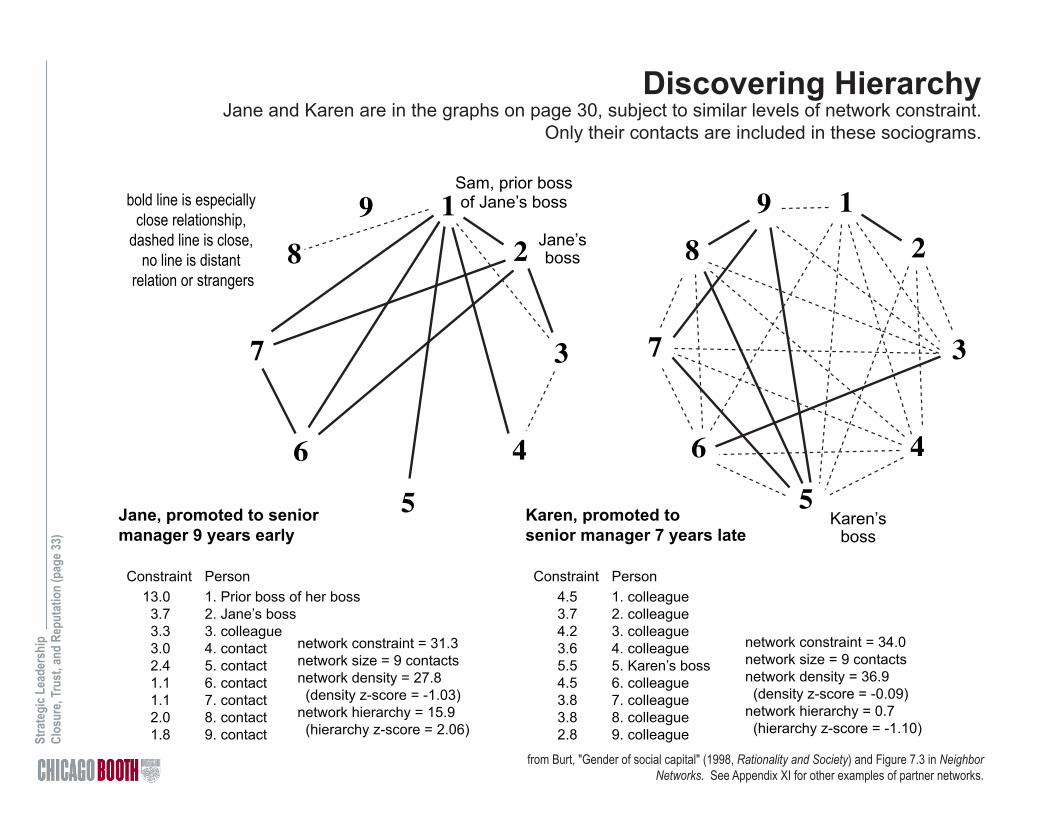
from Burt, "Gender of social capital" (1998, Rationality and Society) and Figure 7.3 in Neighbor Networks. See Appendix XI for other examples of partner networks.
Discovering HierarchyJane and Karen are in the graphs on page 30, subject to similar levels of network constraint.
Only their contacts are included in these sociograms.
1
5
46
37
289bold line is especially
close relationship, dashed line is close,
no line is distant relation or strangers
Jane’sboss
Sam, prior bossof Jane’s boss
Jane, promoted to seniormanager 9 years early
Constraint Person 13.0 1. Prior boss of her boss 3.7 2. Jane’s boss 3.3 3. colleague 3.0 4. contact 2.4 5. contact 1.1 6. contact 1.1 7. contact 2.0 8. contact 1.8 9. contact
Karen, promoted tosenior manager 7 years late
Constraint Person 4.5 1. colleague 3.7 2. colleague 4.2 3. colleague 3.6 4. colleague 5.5 5. Karen’s boss 4.5 6. colleague 3.8 7. colleague 3.8 8. colleague 2.8 9. colleague
network constraint = 34.0network size = 9 contactsnetwork density = 36.9 (density z-score = -0.09)network hierarchy = 0.7 (hierarchy z-score = -1.10)
network constraint = 31.3network size = 9 contactsnetwork density = 27.8 (density z-score = -1.03)network hierarchy = 15.9 (hierarchy z-score = 2.06)
Karen’sboss
1
5
46
37
289

Stra
tegi
c Lea
ders
hip
Clos
ure,
Trus
t, an
d Re
puta
tion
(pag
e 34)
Network MetricsReminder
Network Constraint decreases with number of contacts (size), increases with strength of connections between contacts (density), and increases with
sharing the network (hierarchy).
This is a page in Appendix IV to the first handout, "Brokerage." Appendix IV explains size, density,
hierarchy, and constraint measures of access to structural holes. Graph above plots density
and hierarchy for 1,989 networks observed in six management populations (aggregated in Figure 2.4 in Neighbor Networks to illustrate returns to
brokerage). Dot-circles are executives (MD or more in finance, VP or more otherwise). Hollow circles are
lower ranks. Executives have significantly larger, less dense, and less hierarchical networks. To keep the diagrams simple, relations with ego are not presented.
E B
D C
A
CliqueNetworks
3100
093
3131311.00.0
5100
065
13131313131.00.0
10100
0361.00.0
PartnerNetworks
3677
84
4420201.70.5
5402559
366666
3.43.0
102050418.2
18.0
BrokerNetworks
30033
1111113.03.0
50020
44444
5.010.0
100010
10.045.0
SmallNetworks
contactsdensity x 100
hierarchy x 100constraint x 100
from:ABC
nonredundant contactsbetweenness (holes)
LargerNetworks
contactsdensity x 100
hierarchy x 100constraint x 100
from:ABCDE
nonredundant contactsbetweenness (holes)
Still LargerNetworks
contactsdensity x 100
hierarchy x 100constraint x 100
nonredundant contactsbetweenness (holes)
E B
D C
A
A
C B
A
C D
A
C B
A
C B
E B
D C
A
Network Density
Net
wor
k H
iera
rchy
Partners
CliquesBrokers
Stra
tegi
c Lea
ders
hip
Clos
ure,
Trus
t, an
d Re
puta
tion
(pag
e 35)
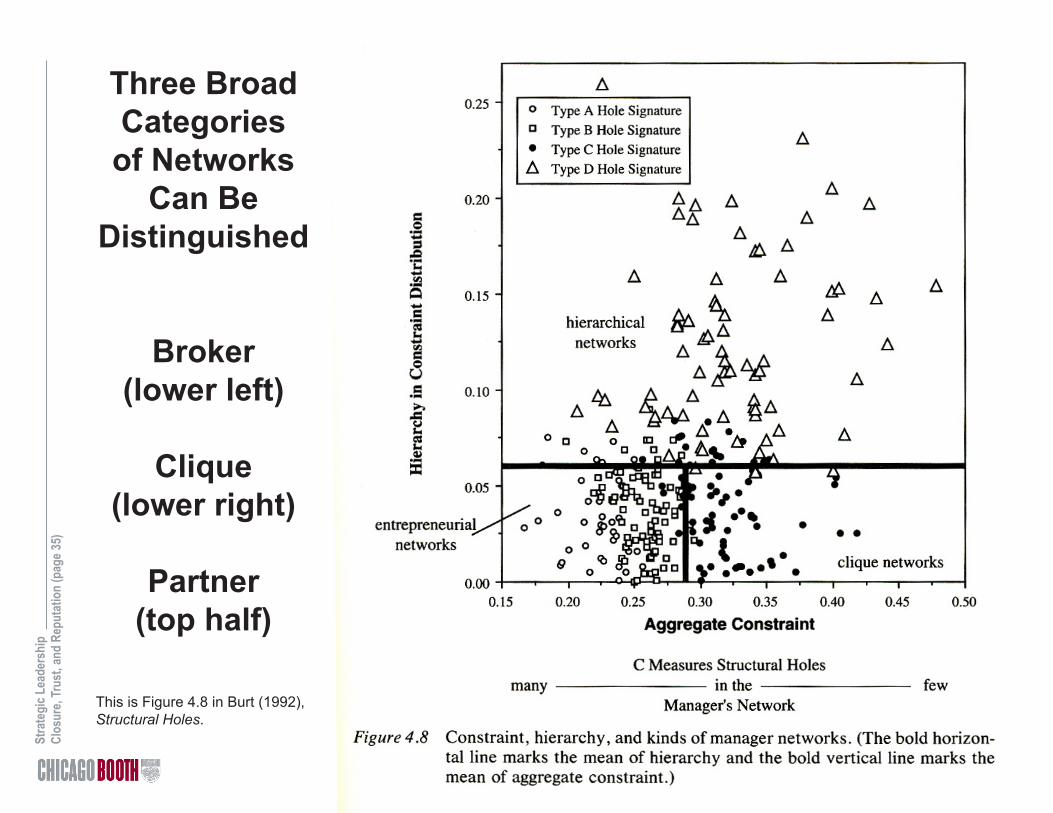
Three Broad Categories of Networks
Can Be Distinguished
Broker(lower left)
Clique(lower right)
Partner(top half)
This is Figure 4.8 in Burt (1992), Structural Holes.

Stra
tegi
c Lea
ders
hip
Clos
ure,
Trus
t, an
d Re
puta
tion
(pag
e 36)
0%
10%
20%
30%
40%
-2.0
-1.0
0.0
1.0
High-RankMen
Women andEntry-Rank Men
(71) (66)(N) (45) (46) (23)(33)
Mea
n E
arly
Pro
mot
ion
(in y
ears
)P
erce
nt M
anag
ers
42%
19%
39% 39%
20%
40%
1.4 years
-.3 years
-1.8 years
-.7 years
-1.8 years
0.9 years
Kinds of Networks AreSimilarly Likely across
Kinds of Managers (χ2 = 0.15, 2 d.f., P = .93)
Kinds of Networks HaveDifferent Consequencesfor Kinds of Managers
(F = 3.77, 5-278 d.f., P < .01)
Broker networkClique (closed dense network)Partner network (closed hierarchical)
Partnering Is the Active Ingredient that LinksNetwork Constraint with Success
for Outsiders
(In other words, pick a network for what it can do, not for the kind of people who picked it in the past.)
from Burt, "Gender of social capital" (1998, Rationality and Society) and Figure 7.4 in Neighbor Networks.

Stra
tegi
c Lea
ders
hip
Clos
ure,
Trus
t, an
d Re
puta
tion
(pag
e 37)
In Sum,There Are
ThreeNetwork Forms
ofSocial Capital
See Appendix X on seeming contradiction between strategic
partners and secondhand brokerage.
An asterisk here indicates a page in the initial handout,
"Brokerage."
from Burt, "Gender of social capital"(1998, Rationality & Society)
Broker Network: Create Valuesparse, flat structureindependent relations sustained by you (e.g., Bob & Yanjieon page 3*, Robert on page 6*, AFTER on page 11*)abundant structural holes, low redundancy,creates information access and control benefitsassociated with successful insiders
you
Partner Network: Sponsored Access to Create Valuesparse, center-periphery structureties sustained jointly by you and strategic partner(e.g., Jane on page 33 and managers on pages 62and 63 in this handout)structural holes borrowed from strategic partner mean second-hand information access and control benefitsassociated with successful outsiders (and unsuccessful insiders)
you
Clique Network: Deliver Valuedense, flat structure
interconnected relations sustain one another form you(e.g., James on page 6*, BEFORE on page 11*,
or Karen on page 33 in this handout)no structural holes, high redundacy,
creates social support, butminimal information access and control benefits
associated with unsuccessful insiders
you
NetworkIndices
N = 4D = 0.0H = 0.0C = 25.0
N = 4D = 100.0
H = 0.0C = 76.6
N = 4D = 50.0H = 16.8C = 68.4

Stra
tegi
c Lea
ders
hip
Clos
ure,
Trus
t, an
d Re
puta
tion
(pag
e 38)
The Situation Can Be Difficult To See
from Burt, "Gender of social capital" (1998, Rationality & Society).
-2.0
-1.0
0.0
1.0
0%
20%
40%
60%
80%Everything considered, my contact network is as effectiveas any at my level within the company.
Mea
n E
arly
Pro
mot
ion
(in y
ears
)P
erce
nt M
anag
ers
Say
Yes
1.4 years
-.3 years
-1.8 years
-.7 years
-1.8 years
0.9 years
65%
52%
66%69%
74%
65%
Kinds of Networks HaveDifferent Consequencesfor Kinds of Managers
(F = 3.77, 5-278 d.f., P < .01)
Regardless, ManagersBelieve That They Have
an Effective Network(χ2 = 6.97, 5 d.f., P = .22)
(and no association between early promotionand manager's belief that his or her network is
effective; 1.63 t-test, P = .20)
Broker networkClique (closed dense network)Parner network (closed hierarchical)
Stra
tegi
c Lea
ders
hip
Clos
ure,
Trus
t, an
d Re
puta
tion
(pag
e 39)
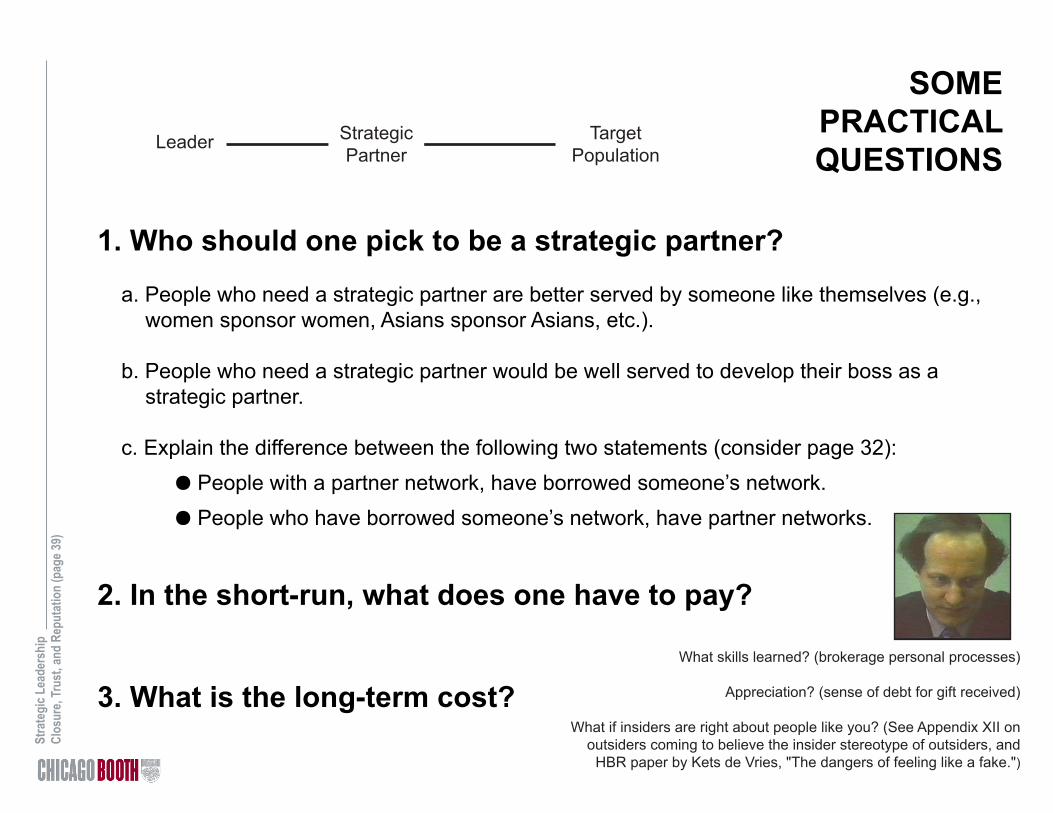
SOMEPRACTICALQUESTIONS
1. Who should one pick to be a strategic partner?
a. People who need a strategic partner are better served by someone like themselves (e.g., women sponsor women, Asians sponsor Asians, etc.).
b. People who need a strategic partner would be well served to develop their boss as a strategic partner.
c. Explain the difference between the following two statements (consider page 32): J People with a partner network, have borrowed someone’s network. J People who have borrowed someone’s network, have partner networks.
2. In the short-run, what does one have to pay?
3. What is the long-term cost?
Leader TargetPopulation
StrategicPartner
What skills learned? (brokerage personal processes)
Appreciation? (sense of debt for gift received)
What if insiders are right about people like you? (See Appendix XII on outsiders coming to believe the insider stereotype of outsiders, and
HBR paper by Kets de Vries, "The dangers of feeling like a fake.")
Stra
tegi
c Lea
ders
hip
Clos
ure,
Trus
t, an
d Re
puta
tion
(pag
e 40)
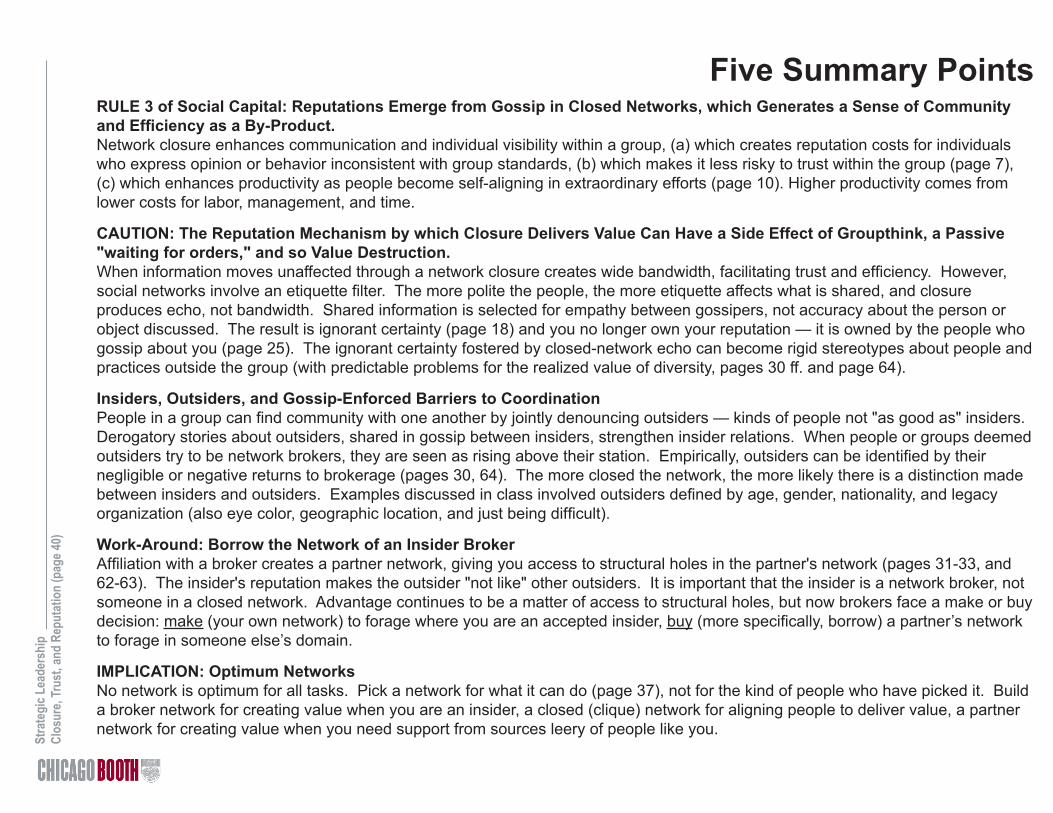
Five Summary PointsRULE 3 of Social Capital: Reputations Emerge from Gossip in Closed Networks, which Generates a Sense of Community and Efficiency as a By-Product.Network closure enhances communication and individual visibility within a group, (a) which creates reputation costs for individuals who express opinion or behavior inconsistent with group standards, (b) which makes it less risky to trust within the group (page 7), (c) which enhances productivity as people become self-aligning in extraordinary efforts (page 10). Higher productivity comes from lower costs for labor, management, and time.
CAUTION: The Reputation Mechanism by which Closure Delivers Value Can Have a Side Effect of Groupthink, a Passive "waiting for orders," and so Value Destruction. When information moves unaffected through a network closure creates wide bandwidth, facilitating trust and efficiency. However, social networks involve an etiquette filter. The more polite the people, the more etiquette affects what is shared, and closure produces echo, not bandwidth. Shared information is selected for empathy between gossipers, not accuracy about the person or object discussed. The result is ignorant certainty (page 18) and you no longer own your reputation — it is owned by the people who gossip about you (page 25). The ignorant certainty fostered by closed-network echo can become rigid stereotypes about people and practices outside the group (with predictable problems for the realized value of diversity, pages 30 ff. and page 64).
Insiders, Outsiders, and Gossip-Enforced Barriers to CoordinationPeople in a group can find community with one another by jointly denouncing outsiders — kinds of people not "as good as" insiders. Derogatory stories about outsiders, shared in gossip between insiders, strengthen insider relations. When people or groups deemed outsiders try to be network brokers, they are seen as rising above their station. Empirically, outsiders can be identified by their negligible or negative returns to brokerage (pages 30, 64). The more closed the network, the more likely there is a distinction made between insiders and outsiders. Examples discussed in class involved outsiders defined by age, gender, nationality, and legacy organization (also eye color, geographic location, and just being difficult).
Work-Around: Borrow the Network of an Insider BrokerAffiliation with a broker creates a partner network, giving you access to structural holes in the partner's network (pages 31-33, and 62-63). The insider's reputation makes the outsider "not like" other outsiders. It is important that the insider is a network broker, not someone in a closed network. Advantage continues to be a matter of access to structural holes, but now brokers face a make or buy decision: make (your own network) to forage where you are an accepted insider, buy (more specifically, borrow) a partner’s network to forage in someone else’s domain.
IMPLICATION: Optimum NetworksNo network is optimum for all tasks. Pick a network for what it can do (page 37), not for the kind of people who have picked it. Build a broker network for creating value when you are an insider, a closed (clique) network for aligning people to deliver value, a partner network for creating value when you need support from sources leery of people like you.

Stra
tegi
c Lea
ders
hip
Clos
ure,
Trus
t, an
d Re
puta
tion
(pag
e 41)
AppendixMaterials

Stra
tegi
c Lea
ders
hip
Clos
ure,
Trus
t, an
d Re
puta
tion
(pag
e 42)
Appendix I. Measuring Network Closure/EmbeddingLet a 2-step connection refer to a connection between two people through a mutual contact. For example, the “1” under “D” for Jim in the first row of the table refers to person 4 in the sociogram. Person 4 is the only contact linked directly to Jim and person 1. The “3” underneath the “1” in the table refers to three mutual contacts between Jim and person 2. The mutual contacts are persons 4, 6, and 7. Two-step connections are this chapter’s measure of direct structural embedding. Indirect structural embedding is measured in this chapter with 3-step connections. For example, the “1” under “I” for Jim in the second row of the table refers to persons 5 and 3 in the sociogram. Jim’s connections to 2 through persons 4, 6, and 7 are 2-step connections. Jim’s fourth contact, person 5, is not connected to person 2, but is connected to 3 who is connected to 2, so Jim has a 3-step connection to person 2 via person 5. In graph theoretic terms, I am looking for geodesics linking two people through one intermediary (direct structural embedding) or two intermediaries (indirect structural embedding). Since I want to know how indirect embedding adds to direct embedding, I only count distant connections in the absence of closer connections. For example, Jim is connected to person 6 who is connected to 3 who is connected to 2, which is an 3-step connection between Jim and person 2. However, Jim reaches 2 through 6 directly, so the table reports one 3-step connection (the 5-3-2 connection).
This is Figure 2 in Burt, "Closure and stability" in The Missing Links: Formation and Decay of Economic Networks, edited by J. Rauch (2007 Russell Sage Foundation). For elaboration and illustration of indirect connections, see Chapter 7 in the on-line network textbook, Introduction to
Social Network Methods, by Robert A. Hanneman and Mark Riddle (http://faculty.ucr.edu/~hanneman/nettext).
1
2
3
4
5
6
7
8
9
Jim
James
Mean per
Contact
(in box)
D
1
3
3
0
0
0
0
3
1
—
1
I
3
1
1
3
2
3
2
0
2
—
3
D
3
3
3
3
1
2
1
2
1
1
—
I
0
0
0
0
3
2
3
2
3
3
—
Jim James
Figure 2.
Network Closure from Direct and Indirect Embedding
Number of 2-Step (Direct) and
3-Step (Indirect) Connections
0.0 2.5 3.0 0.0

Stra
tegi
c Lea
ders
hip
Clos
ure,
Trus
t, an
d Re
puta
tion
(pag
e 43)
Appendix II: Closure/Embedding and the Theory of the Firm
The Source is John Commons’ Five-Player Unit
for Transactional Analysis
(1) MAY — range of behaviors allowed in relationship
(2) MUST — minimum obligations of relationship
(3) CAN — minimum rights in relationship
(4) CANNOT — behaviors prohibited in relationship
fifth player
Graphic is from Figure 7.1 in Structural Holes (Burt, 1992), see John R. Commons (1924), Legal Foundations of Capitalism, chapter on transactions, which set a stage for Coase's (1937) nobel-winning "The Nature of the Firm" in Economica, and subsequent work on "competitive strategy."

Stra
tegi
c Lea
ders
hip
Clos
ure,
Trus
t, an
d Re
puta
tion
(pag
e 44)
Appendix III: Closure and Learning Curvesby Michael Rothschild
Bruce Henderson certainly didn’t look like a revolutionary. No tattered army fatigues. No fiery rhetoric. He favored starched white shirts and pinstripe suits. He spoke softly, in the measured, almost halting, manner of a southern gentleman. But Bruce Henderson had the “right stuff” of a revolutionary — profoundly new ideas that change the way society works. The originator of modern corporate strategy and founder of The Boston Consulting Group (BCG), Bruce Henderson died this summer in his hometown of Nashville, Tennessee. He was 77.
Trained as an engineer, Bruce Henderson became fascinated with economic ideas for terribly practical business reasons. Back in the days before he established the discipline of corporate strategy, making the big decisions about a company’s long-term future was pretty much a “seat of the pants” affair. The CEO, with perhaps a few senior executives and board members, would sit around and talk until they came up with a plan that seemed sensible. “Bet-your-company” decisions like launching a new product line, acquiring a subsidiary, or shutting down a factory, were made on little more than intuition.
A rigorous analytical approach to making key decisions was impossible, because there were no guiding strategic prin-ciples, no theories that could be turned into quantifiable models. Standard economic models existed, of course, but every sophisticated businessman knew that the economists’ mythical kingdom of “perfect competition” bore no relationship to reality. To turn corporate strategy into a credible discipline — and consulting assignments that major clients would pay major money for — Henderson had to find a hard link between business and underlying economic forces.
Henderson’s search began with highly detailed analyses of production costs. Early in his career, while a purchasing manager for a Westinghouse division, he wondered why suppliers who produced their goods in virtually identical factories often put in bids at dramatically different prices. Economic theory said it wouldn’t happen. Producers using similar capital equipment were supposed to have similar unit costs and offer roughly the same prices. But economic theory was wrong. In case after case, actual unit costs varied dramatically among suppliers. Henderson didn’t know why, but he had zeroed in on the crucial question.
Then, in 1966, shortly after he founded BCG, a study for Texas Instruments’ semiconductor division revealed the answer. When TI’s unit cost data for a particular part was plotted against the company’s accumulated production experience, the cost of the part declined quite predictably. For example, if the 1000th unit off the line had cost $100 to make, the 2000th unit would cost 80% as much, or $80. By the time the 4000th unit was produced, it would cost just $64 ($80 x 80%). Every time cumula-tive experience doubled, unit costs dropped about 20%. Though it’s “old hat” among today’s high-tech managers, the notion of predictably declining costs was a radical concept when Bruce Henderson began teaching companies about the “experience curve” a quarter century ago.
(over)
This article appeared in a longer form in Upside (December 1992, Copyright 1992 The Bionomics Institute).

Stra
tegi
c Lea
ders
hip
Clos
ure,
Trus
t, an
d Re
puta
tion
(pag
e 45)
During the 1970s, Henderson’s concept became the foundation of modern corporate strategy. For the first time, it was possible to explain why building a factory just like your competitor’s didn’t mean you could match his costs. If he had a head start in experience, you could wind up chasing him down the experience curve. If you both sold at the market price, he’d make money on every unit, while you’d be lucky to break-even.
Once the experience curve was understood, the importance of being the first one to enter a new market became clear. Properly executed, the preemptive strike could mean long-term market leadership and long-term profits. Similarly, the experience curve explained why defending market share mattered. Raising prices to boost short-term profits sold off market share, slowed experience growth, and often handed over low cost leadership to an aggressive competitor. It’s a scenario that’s been played out hundreds of times as “experience conscious” Japanese competitors overtook their “profit conscious” American rivals.
Simply put, Bruce Henderson’s experience curve explained how an industry’s past shapes its future. Where conventional economics banished history by blithely assuming that “technology holds constant,” Henderson used the experience curve to show how the new insights generated by practical experience translated into higher productivity and lower costs. Where conventional economics taught the “law of diminishing returns,” Bruce Henderson taught the “law of increasing returns.” Where mainstream economics taught that marginal unit costs must rise at some point, Henderson showed that marginal unit costs can continually fall.
When the cost/performance potential of a particular technology is nearly exhausted, an industry will shift to a substitute technology and begin a new “experience curve.” For example, even as the airlines have shifted from one aircraft technology to the next, their cost/seat-mile keeps falling, opening up air travel to the entire population. By substituting new knowledge for labor and materials, experience-driven innovation keeps pushing costs down. As Henderson put it, when a firm is properly managed, its “product costs will go down forever.”
Though he concentrated on the practical problems of clients, Henderson knew full well that the experience curve had undermined the intellectual foundation of mainstream economics. In 1973, he wrote: The experience curve is a contradiction of some of the most basic assumptions of classical economic theory. All economics assumes that there is a finite minimum cost which is a function of scale. This is usually stated in terms of all cost/volume curves being either L shaped or U shaped. It is not true except for a moment in time. . . Our entire concept of competition, anti-trust, and non-monopolisitc free enterprise is based on a fallacy.
I’m often asked whether the work of the great Austrian economist F.A. Hayek inspired me to write Bionomics. Despite my unending admiration for Hayek, the short answer is no, I’d never read him. Bruce Henderson inspired me to rethink the received economic wisdom. Without his “experience curve,” there is no final and fully satisfying explanation for falling costs, rising incomes, and the phenomenon of economic growth. More than anyone else, he made it both possible and necessary for economic thinkers to break free of the static, zero-sum mentality that has gripped the “dismal science” for 200 years. Bruce Henderson gave us the key to “positive-sum” economics. Thanks for the revolution, Bruce.

Stra
tegi
c Lea
ders
hip
Clos
ure,
Trus
t, an
d Re
puta
tion
(pag
e 46)
Detail on Learning Curves,Productivity on the WW II Liberty Ships
from Figure 3.7 in Brokerage and Closure
Ñ
[[[
[[[[[
[
[
[[
[[[[[[[[[[[[[[
[[
[[
[[[[[[[[[[[
[[[[[[[[[[[[[
[
[
[
[[[[[[[[[[[[[[[
[[[[[[[[[[[[[[[[[[[
[
E
E
EEE
EE
EEEEEEEEEEEEEEEEEEEEEEEEE
Ñ
Ñ
Ñ
Ñ
Ñ
ÑÑ
ÑÑÑÑÑ
ÑÑÑÑÑÑÑÑÑÑÑÑÑÑÑÑÑÑ
BB
B
B
BBB
BBBBB
BBBBBBBBBBB
BBBBBBBBBBBB
BBBBB
BBB
JJ
JJ
JJ J
J
J
JJ
J
JJJJJJJ
JJJJJJJJJJJJ
JJJJJJJJJJ
Apr
Jul
Oct
Jan
Apr
Jul
Oct
Jan
Apr
Jul
Oct
Jan
Apr
Jul
Oct
Jan
Apr
Jul
0
50
100
150
200
250
300
Da
ys
fro
m S
tart
to
De
liv
ery
1941 1942 1943 1944 1945
Month that Work on Ship Began(Keel Laid)
E
E
E
EEE
EEEEEEEEEEEEEEEEEE
EEE
EEEE
E
EEEEEEEEEEEEEEEEEEEEEEEEEE
E
EEEEEEEEEEEEEEEEEEEEEEE
EE
EEEE
E
E
E
EEEEEEEEEEEEEEEEEEEEEEEEEEEE
E
EEEEEEEEEEEEEEEEEEEEEEEEEEEEEEEEEEEEEEEEEEEEEEEEEEEEEEEEEEEEEEEEEEEEEEEEEEEEEEEEEEEEEEEEEEEEEEEEEEEEEEEEEEEEEEEEEEEEE
EEEEEEEEEEEEEEEEEEEEEEEEEEEEEEEEEEEEEEEEEEEEEEEEEEEEEEEEEEEEEEEEEEEEEEEEEEEEEEEEEEEEEEEEEEEEEEEEEEEEEEE
EEEEEEEEEEE
[[[[[[
[[[[[[[[[[[[[[[[[[[[[[[[[[[[[[[[[[[[[[[[[[[[[[[[[[[[[[[[[[[[[[[[[[[[[[[[[[[[
[
[[[[[
[[[
[[[
[[[[[[[[[[[[[[[[[[[[[[[[
[[[[[[
[[[[[[[[[
[[[[[[[[[[[[[[[[[[[[[[[[[[[[[[[[[[[[[
B
BB
B
BBB
B
BBBBB
BBB
B
B
BBBB
BB
BBBBBBB
BBBB
BBBBBBBBBB
BBBBBBBBBBBBBBBBBBBBB
BBBBBBBBBBBBBBBBBBBB
BBBBBBBBBBBBBBBBBBBBBBBBBBBBBBBBBBBBBBBBBBBBBBBBBBBBBBBBBBBBBBBBB
BBBBBBBBBBBBBBBBBBBBBBBBBBBBBBBBBBBBBBBBBBBBBBBBBBBBBBBBBBBBBBBB
BBBBBBBBBBBBBBBBBBBBBB
BBB
B
B
B
B
JJ
JJJJ
J
J
JJ
J
J
J
J
J
J
JJ
JJJJJJJJJJJJJ
JJ
JJJ
JJJJJJJJJJJJJJJJJJJJJJJJJJJJJJJJJJJJJJJJJJJJJ
JJJ
JJJJJJJJJJJJJJJJ
JJJJJJJJJJJJJJJJJJJJJJJJJJJJJJJJJJJJJJJJJJJJJJJJJJJJJJJJJJJJJJJJJJJJJJJJJJJJJJJJJJJJJJJJJJJJJJJJJJJJJJJJJJJJJJJJJJJJJJJJJJJJJJJJJJ
JJJJJJJJJJJJJJJJJJJJJJJJJJJJJJJJJJJJJJJJ
JJJJJJJJJJJJJJJJJJJJJJJJJJJJJJJJJJJJJJJJJJJJJJJJJJJJJJJJJJ
JJ
JJJJJJJJJJJJJJJJJJJJJJJJJJJJJJJJJJJJJJJJJJJJJJJJJJJJJJ
T
T
TT
TTTT
T
TT
TTTTT
TTTTTTTTTTTTTTT
TTT
TTT
TTTTTTTTTTTTTTTTTTTTTTTTTTTTTT
TTTTTTTTTTTTTT
T
TTTTTTTTTTTTTTTTTTTTTTTTTTTTTTTTTTTTTTTTTTTTTTTTTTTTTTTTTTTTTTTTTTTTTTTTTTTTTTTTTTTTTTTTTTTTTTTTTTTTTTTTTTTTTTTTTTTTTTTTTTTTTTTTTTTTTTTTTTTTTTTTTTTTTTTTTTTTTTTTTTTTTTTTTTTTTTTTTTTTTTTTTTTTTTTTTTT
TTTTTTTTTTTTTTTTTTTTTTTTTTTTTTTTTTTTTTTTTTTTT
[[[[
[
[
[[[[[[[[[[[[[[[[[[[
[
[[
[[[[[[[[[[[[[[[[[[[[[[[[[[[[[[[[[[[[[[[[[[[[[[[[[[[[[[[[[[[[[[[[[[[[[[[[[[[[[[[[[[[[[[[[[[[[[[[[[[[[[[[[[[[[[[[[[[[[[[[[[
[[[[[[[[[[[[[[[[[[[[[[[[[[[[[[[[[[[[[[[[[[[[[[[[[[[[[[[[[[[
0
50
100
150
200
250
300
0 50 100 150 200 250 300 350 400
E California (Permanente Metals #2, 4-day Robert E. Peary)
B Maine (New England)
J Maryland (Bethlehem Fairfield)
T Oregon (10-day Joseph N. Teal)
Sequence of Shipin Shipyard Production
Da
ys
fro
m S
tart
to
De
liv
ery
Texas (Todd Houston)
Florida(St. Johns River)
[ Other (Florida, Georgia, Texas)
Georgia(Southeastern)
Robert E. PearyJoseph N. Teal
At the start of the programme some of Liberty
Ships suffered catastrophic fracture, though not necessarily so dramatically as the Schenectady. The stern of SS
John P Gaines is pictured here after the vessel split in two off the Aleutians in 1943. As noted in
website, later design changes reduced the fracture rate to 5%.
30%
Peter
Thompson's
The general technological fraternity was unaware of Fracture Mechanics principles when these ships were designed, and the reason for the disastrous fractures was a mystery since conventional safety assessments were unremarkable and the extremely short lives ruled out conventional fatigue as the culprit. It later became clear that the failures could be attributed to:
Recent recoveries from the Titanic suggest that poor steels in association with low temperatures might have contributed to that disaster too, although this vessel was
riveted throughout.
- the all- welded construction which eliminated crack- arresting plate boundaries which are present in riveted joints - the presence of crack- like flaws in welded joints performed by inexperienced operators pressed into service by the
exigencies of the programme - the use of materials whose low resistance to crack advance ( toughness ) was further reduced by low temperatures.
Closer to home, these photographs of the SS Bridgewater a 29,000 ton Liberian tanker, were shot by the author in Fremantle harbour early in 1962. The vessel though not a Liberty Ship broke in two after a cyclone in the Indian Ocean 400km west of Fremantle. All members of the crew were rescued, and the stern towed back to port.
(click to enlarge),
The first shot shows the what's left of the vessel, down at the stern and tied up at the wharf with a
crowd of curious onlookers examining the fracture just for'ard
of the ventilator.
A close-up of portion of the transverse fracture is shown on the
right. The author also was ignorant of Fracture Mechanics at
the time, so the shots are perhaps not so illuminating as they
might have been. However the photograph suggests strongly that the deck plating fractured instantaneously in
a brittle fashion with none of the ductile tearing which is evident elsewhere.
(arrowed)
10/31/05 10:02 AMDANotes: Fracture mechanics: Maritime examples
Page 2 of 3http://www.mech.uwa.edu.au/DANotes/fracture/maritime/maritime.html
Stern of the SS John P. Gainesin the Aleutian Islands

Stra
tegi
c Lea
ders
hip
Clos
ure,
Trus
t, an
d Re
puta
tion
(pag
e 47)
SOURCE: Graphs to the left are from Stern and Stalk (1998: pp. 14, 19), Perspectives on Strategy. The one below is from Thurstone (1919, p. 45) "The learning curve equation," Psychological Monographs. The association below can be described as Y = aXb, where Y is words typed in four minutes, X is cumulative words typed (at 250/page), and the estimated slope b is .42 (cf. slope estimates of .11 to .29 for ship production in Rapping, 1965, p. 65, "Learning and World War II production functions" Review of Economics and Statistics).
Research on semiconductor learning curves shows 20% decrease in cost with cumulative volume doubling, learning three times faster from one's own experience than from experience in another organization, and spillovers between organizations as likely within as between
countries (Irwin and Klenow, "Learning-by-doing spillovers in the semiconductor industry," 1994, Journal of Political Economy).
Some Example Learning Curves

Stra
tegi
c Lea
ders
hip
Clos
ure,
Trus
t, an
d Re
puta
tion
(pag
e 48)
Learning curves fromArgote’s 1999 book,
Organizational Learning.Units of cumulative output are omitted to protect confidentiality. Pizzadelivery is from page 9 in book. Squawks per aircraft is from page 8(originally in 1993 British Journal of Social Psychology, “Group andorganizational learning curves”). Hours per vehicle is from page 21
(originally in 1990 Science, “Learning curves in manufacturing.”).
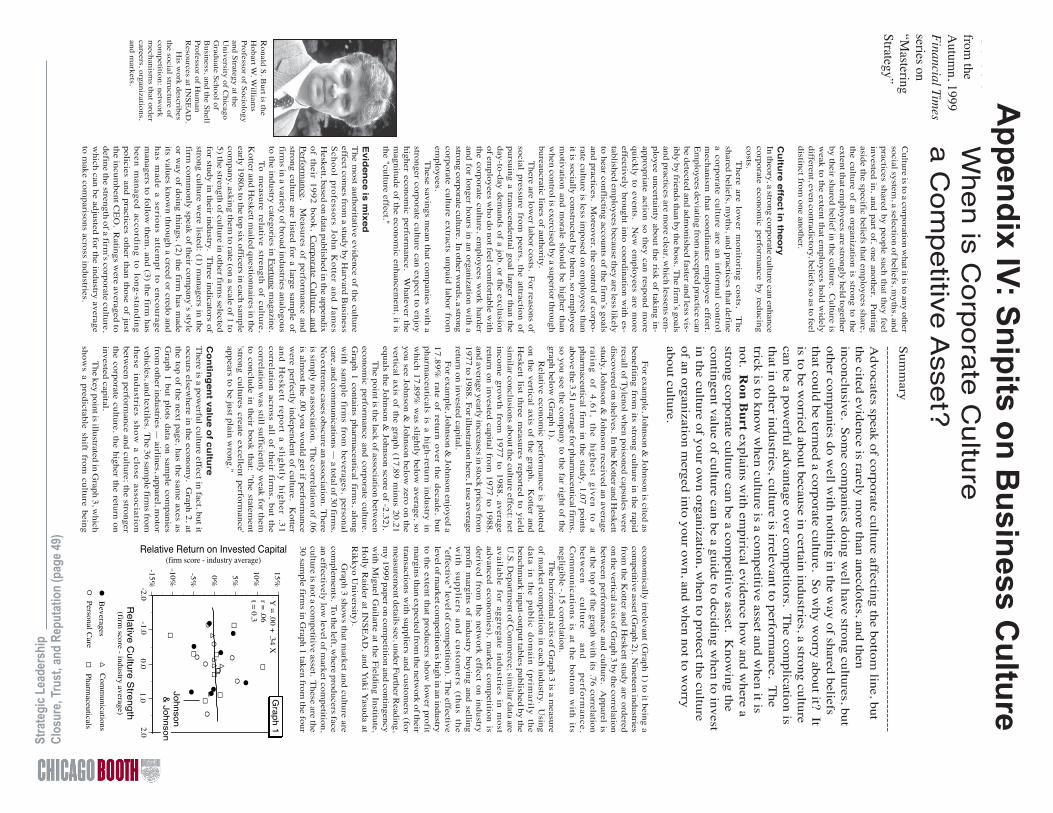
Stra
tegi
c Lea
ders
hip
Clos
ure,
Trus
t, an
d Re
puta
tion
(pag
e 49)
Ronald S
. Burt is the
Hobart W
. William
sP
rofessor of Sociology
and Strategy at the
University of C
hicagoG
raduate School of
Business, and the S
hellP
rofessor of Hum
anR
esources at INS
EA
D.
His w
ork describesthe social structure ofcom
petition: network
mechanism
s that ordercareers, organizations,and m
arkets.
When is C
orporate Culture
a Com
petitive Asset?
Sum
mary
-----------------------------------------------------------------------------------A
dvocates speak of corporate culture affecting the bottom line, but
the cited evidence is rarely more than anecdotes, and then
inconclusive. Som
e companies doing w
ell have strong cultures, butother com
panies do well w
ith nothing in the way of shared beliefs
that could be termed a corporate culture. S
o why w
orry about it? Itis to be w
orried about because in certain industries, a strong culturecan be a pow
erful advantage over competitors. T
he complication is
that in other industries, culture is irrelevant to performance. T
hetrick is to know
when culture is a com
petitive asset and when it is
not. Ron B
urt explains with em
pirical evidence how and w
here astrong corporate culture can be a com
petitive asset. Know
ing thecontingent value of culture can be a guide to deciding w
hen to investin the culture of your ow
n organization, when to protect the culture
of an organization merged into your ow
n, and when not to w
orryabout culture.
Culture is to a corporation w
hat it is to any othersocial system
, a selection of beliefs, myths, and
practices shared by people such that they feelinvested in, and part of, one another. P
uttingaside the specific beliefs that em
ployees share,the culture of an organization is strong to theextent that em
ployees are strongly held togetherby their shared belief in the culture. C
ulture isw
eak to the extent that employees hold w
idelydifferent, even contradictory, beliefs so as to feeldistinct from
one another.
Culture effect in theory
In theory, a strong corporate culture can enhancecorporate econom
ic performance by reducing
costs.T
here are lo
wer m
on
itorin
g co
sts. Th
eshared beliefs, m
yths, and practices that definea co
rpo
rate cultu
re are an in
form
al con
trol
mech
anism
that co
ord
inates em
plo
yee effo
rt.E
mployees deviating from
accepted practice canbe detected and adm
onished faster and less vis-ibly by friends than by the boss. T
he firm’s goals
and practices are more clear, w
hich lessens em-
ployee uncertainty about the risk of taking in-ap
pro
priate actio
n so
they
can resp
on
d m
ore
qu
ickly
to ev
ents. N
ew em
plo
yees are m
ore
effectively brought into coordination with es-
tablished employees because they are less likely
to hear conflicting accounts of the firm’s goals
and practices. Moreover, the control of corpo-
rate culture is less imposed on em
ployees thanit is socially constructed by them
, so employee
motivation and m
orale should be higher thanw
hen control is exercised by a superior throughbureaucratic lines of authority.
There are low
er labor costs. For reasons of
social p
ressure fro
m p
eers, the attractio
n o
fpursuing a transcendental goal larger than theday-to-day dem
ands of a job, or the exclusionof em
ployees who do not feel com
fortable with
the corporate culture, employees w
ork harderand for longer hours in an organization w
ith astrong corporate culture. In other w
ords, a strongco
rpo
rate cultu
re extracts u
np
aid lab
or fro
mem
ployees.T
hese savings mean that com
panies with a
stronger corporate culture can expect to enjoyhigher econom
ic performance. W
hatever them
agnitude of the economic enhancem
ent, it isthe "culture effect."
Evidence is m
ixedT
he most authoritative evidence of the culture
effect comes from
a study by Harvard B
usinessS
cho
ol p
rofesso
rs Joh
n K
otter an
d Jam
esH
eskett, based on data published in the appendixo
f their 1
99
2 b
oo
k, C
orp
orate C
ultu
re and
Perfo
rman
ce. Measu
res of p
erform
ance an
dstrong culture are listed for a large sam
ple offirm
s in a variety of broad industries analogousto the industry categories in F
ortune magazine.
To
measu
re relative stren
gth
of cu
lture,
Kotter and H
eskett mailed questionnaires in the
early 1980s to the top six officers in each sample
company, asking them
to rate (on a scale of 1 to5) the strength of culture in other firm
s selectedfor study in their industry. T
hree indicators ofstrong culture w
ere listed: (1) managers in the
firm com
monly speak of their com
pany’s styleor w
ay of doing things, (2) the firm has m
adeits values know
n through a creed or credo andh
as mad
e a seriou
s attemp
t to en
cou
rage
managers to follow
them, and (3) the firm
hasb
een m
anag
ed acco
rdin
g to
lon
g-stan
din
gpolicies and practices other than those of justthe incum
bent CE
O. R
atings were averaged to
define the strength of a firm's corporate culture,
which can be adjusted for the industry average
to make com
parisons across industries.
For exam
ple, Johnson & Johnson is cited as
benefiting from its strong culture in the rapid
recall of Tylenol w
hen poisoned capsules were
discovered on shelves. In the Kotter and H
eskettstudy, Johnson &
Johnson received an averagera
ting
o
f 4
.61
, th
e
hig
he
st g
ive
n
to
ap
harm
aceutical firm
in th
e stud
y, 1.0
7 p
oin
tsabove the 3.51 average for pharm
aceutical firms,
so you see the company to the far right of the
graph below (G
raph 1).R
elative economic perform
ance is plottedon the vertical axis of the graph. K
otter andH
eskett list th
ree measu
res repo
rted to
yield
similar conclusions about the culture effect: net
inco
me g
row
th fro
m 1
97
7 to
19
88
, averag
ereturn on invested capital from
1977 to 1988,and average yearly increases in stock prices from1977 to 1988. F
or illustration here, I use averagereturn on invested capital.
For exam
ple, Johnson & Johnson enjoyed a
17
.89
% rate o
f return
ov
er the d
ecade, b
ut
ph
armaceu
ticals is a hig
h-retu
rn in
du
stry in
which 17.89%
was slightly below
average, soyou see Johnson &
Johnson below zero on the
vertical axis of the graph (17.89 minus 20.21
equals the Johnson & Johnson score of -2.32).
The point is the lack of association betw
eeneconom
ic performance and corporate culture.
Graph 1 contains pharm
aceutical firms, along
with
samp
le firms fro
m b
everag
es, perso
nal
care, and comm
unications — a total of 30 firm
s.N
o extreme cases obscure an association. T
hereis sim
ply no association. The correlation of .06
is almost the .00 you w
ould get if performance
were perfectly independent of culture. K
ottera
nd
He
ske
tt rep
ort a
sligh
tly h
igh
er .3
1co
rrelation
across all o
f their firm
s, bu
t the
correlation was still sufficiently w
eak for themto conclude in their book that: "the statem
ent'stro
ng
cultu
res create excellen
t perfo
rman
ce'appears to be just plain w
rong."
Contingent value of culture
There is a pow
erful culture effect in fact, but itoccurs elsew
here in the economy. G
raph 2, atthe top of the next page, has the sam
e axes asG
raph
1 b
ut p
lots d
ata on
samp
le com
pan
iesfrom
other industries — airlines, apparel, m
otorvehicles, and textiles. T
he 36 sample firm
s fromth
ese ind
ustries sh
ow
a close asso
ciation
between perform
ance and culture; the strongerthe corporate culture, the higher the return oninvested capital.
The key point is illustrated in G
raph 3, which
sho
ws a p
redictab
le shift fro
m cu
lture b
eing
economically irrelevant (G
raph 1) to it being acom
petitive asset (Graph 2). N
ineteen industriesfrom
the Kotter and H
eskett study are orderedon the vertical axis of G
raph 3 by the correlationbetw
een performance and culture. A
pparel isat the top of the graph w
ith its .76 correlationb
etw
ee
n
cu
lture
a
nd
p
erfo
rma
nc
e.
Co
mm
un
ication
s is at the b
otto
m w
ith its
negligible -.15 correlation.T
he horizontal axis of Graph 3 is a m
easureof m
arket competition in each industry. U
singd
ata in th
e pu
blic d
om
ain (p
rimarily
the
benchmark input-output tables published by the
U.S
. Departm
ent of Com
merce; sim
ilar data areav
ailable fo
r agg
regate in
du
stries in m
ost
adv
anced
econ
om
ies), mark
et com
petitio
n is
deriv
ed fro
m th
e netw
ork
effect on
ind
ustry
profit margins of industry buying and selling
with
su
pp
liers
an
d
cu
stom
ers
(thu
s th
e"effective" level of com
petition). The effective
level of market com
petition is high in an industryto the extent that producers show
lower profit
margins than expected from
the network of their
transactions with suppliers and custom
ers (form
easurement details see, under F
urther Reading,
my 1999 paper on com
petition and contingencyw
ith Miguel G
uilarte at the Fielding Institute,
Holly R
aider at INS
EA
D, and Y
uki Yasuda at
Rikkyo U
niversity). G
raph 3 shows that m
arket and culture arecom
plements. T
o the left, where producers face
an effectively low level of m
arket competition,
culture is not a competitive asset. T
hese are the30 sam
ple firms in G
raph 1 taken from the four
Relative C
ulture Strength
(firm score - industry average)
0.0-1.0
-2.01.0
2.0
Y =
.00 + .34 X
r = .06
t = 0.3
Beverages
Pharm
aceuticalsP
ersonal Care
Com
munications
Relative Return on Invested Capital(firm score - industry average)
15%
10%5%0%
-5%
-10%
-15%
Johnson &
Johnson
Graph 1
Scheduled to
appear in anA
utumn, 1999
series in theF
inancial Times
on Mastering
Strategy
from the
Autum
n, 1999Financial Tim
esseries on“M
asteringStrategy”
Appendix IV: Snipits on B
usiness Culture

Stra
tegi
c Lea
ders
hip
Clos
ure,
Trus
t, an
d Re
puta
tion
(pag
e 50)
Fu
rther read
ing
:
J. P. Kotter and J. L
Heskett (1992)
Corporate C
ulture andP
erformance.
R. S
. Burt, S
. M.
Gabbay, G
. Holt, and
P. Moran (1994)
"Contingent
organization as anetw
ork theory: theculture-perform
ancecontingency function,"A
cta Sociologica
37:345-370.
J. B. S
ørensen (1998)
"The strength of
corporate culture andthe reliability of firmperform
ance," (http://gsbw
ww
.uchicago.edu/fac/jesper.sorensen/research).
R. S
. Burt, M
. Guilarte,
H. J. R
aider and Y.Y
asuda (1999)"C
ompetition,
contingency, and theexternal structure ofm
arkets," (http://gsbw
ww
.uchicago.edu/fac/ronald.burt/research; also here isthe industry appendixfrom
which the results
in the box are taken).
industries en
closed
by a d
otted
line in
the lo
wer-
left of G
raph 3
. These are co
mplex
, dynam
icm
ark
ets su
ch
as th
e c
om
mu
nic
atio
ns a
nd
ph
arm
aceu
tical in
du
stries, in
wh
ich
pro
fitm
argin
s are good, b
ut co
mpan
ies hav
e to stay
nim
ble to
take ad
van
tage o
f the n
ext sh
ift in th
em
arket. T
here is co
mpetitio
n to
be su
re (see the
1999 p
aper), b
ut th
e poin
t here is th
at a strong
co
rpo
rate
cu
lture
is n
ot a
sso
cia
ted
with
econ
om
ic perfo
rman
ce. (My
colleag
ue at th
eU
niv
ersity
of C
hic
ag
o, Je
sper S
øren
sen
, has
studied
these firm
s over tim
e, and d
escribes in
his 1
998 p
aper o
n reliab
le perfo
rman
ce how
the
cultu
re effect is weak
er for firm
s more su
bject
to m
arket ch
ange.)
At th
e oth
er extrem
e, to th
e right in
Grap
h3, w
here p
roducers face an
effectively
hig
h lev
el
of m
ark
et c
om
petitio
n, c
ultu
re is c
lose
lyasso
ciated w
ith eco
nom
ic perfo
rman
ce. These
are the 3
6 sam
ple firm
s in G
raph 2
taken
from
the fo
ur in
dustries en
closed
by a d
otted
line in
the u
pper-rig
ht o
f Grap
h 3
. In th
ese industries
of
effe
ctiv
ely
h
igh
m
ark
et
co
mp
etitio
n,
pro
ducers are easily
substitu
ted fo
r one an
oth
er,su
ppliers, cu
stom
ers or fo
reign p
roducers are
strong, an
d m
argin
s are low
.
Co
ntin
gen
cy fun
ction
Be
twe
en
th
e
two
m
ark
et
ex
trem
es,
the
perfo
rman
ce effect of a stro
ng co
rporate cu
lture
incre
ase
s with
mark
et c
om
petitio
n. T
he
nonlin
ear regressio
n lin
e in G
raph 3
(the so
lidbold
line), can
be u
sed as a co
ntin
gen
cy fu
nctio
nd
esc
ribin
g h
ow
cu
lture
's effe
ct v
arie
s with
mark
et com
petitio
n. F
or an
y sp
ecific level o
fm
arket co
mpetitio
n o
n th
e horizo
ntal ax
is, the
co
ntin
gen
cy
fun
ctio
n d
efin
es a
n e
xp
ecte
dco
rrelation o
n th
e vertical ax
is betw
een cu
lture
strength
and eco
nom
ic perfo
rman
ce.S
ince in
dustry
scores o
n th
e horizo
ntal ax
isare co
mputed
from
data p
ublicly
availab
le on
all in
du
stries, th
e e
xp
ecte
d v
alu
e o
f a stro
ng
co
rpo
rate
cu
lture
in a
ny
ind
ustry
can
be
ex
trap
ola
ted
from
the c
on
ting
en
cy
fun
ctio
n.
Resu
lts for a selectio
n o
f industries are g
iven
inth
e box to
the rig
ht.
Th
e h
igh
co
rrela
tion
for th
e c
on
ting
en
cy
functio
n sh
ow
s that th
e functio
n is an
accurate
desc
riptio
n o
f cu
lture
's effe
ct in
the d
iverse
mark
ets (r = .8
5, fo
r details o
n d
erivin
g, an
dex
trapolatin
g fro
m, th
e contin
gen
cy fu
nctio
n see
my 1
994 article o
n co
ntin
gen
t org
anizatio
n w
ithS
hau
l Gab
bay
at T
ech
nio
n, G
erh
ard
Ho
lt at
INS
EA
D, a
nd
Pete
r Mo
ran
at th
e L
on
do
nB
usin
ess Sch
ool).
At th
e level o
f indiv
idual firm
s, 44%
of th
evarian
ce in co
mpan
y retu
rns to
invested
capital
can b
e pred
icted b
y th
e industry
in w
hich
they
prim
arily o
perate, an
d th
eir relative stren
gth
of
corp
orate cu
lture acco
unts fo
r anoth
er 23%
of
the v
ariance. C
ultu
re accounts fo
r half ag
ain
the p
erform
ance v
ariance d
escribed
by in
dustry
differen
ces!
Th
inkin
g strateg
ically abo
ut cu
lture
Co
ntin
gen
t valu
e is th
e m
ain
po
int h
ere
. Astro
ng
co
rpo
rate
cu
lture
is neith
er a
lway
sv
alu
ab
le, n
or a
lway
s irrele
van
t. Valu
e is
contin
gen
t on m
arket. A
strong co
rporate cu
lture
can
be a
po
werfu
l co
mp
etitiv
e a
sset in
aco
mm
od
ity m
ark
et. In
a c
om
ple
x, d
yn
am
icm
arket, o
n th
e oth
er han
d, cu
lture is irrelev
ant
to eco
nom
ic perfo
rman
ce.T
he c
on
ting
en
t valu
e o
f cu
lture
can
be a
guid
e to th
inkin
g strateg
ically ab
out cu
lture. T
he
more y
our co
mpan
y’s in
dustry
resembles a co
m-
modity
mark
et, the m
ore eco
nom
ic return
you
can ex
pect fro
m in
vestin
g in
a strong co
rporate
cultu
re. Furth
er, when
you m
erge w
ith a n
ewco
mpan
y, ask ab
out its in
dustry. If th
e industry
resembles a co
mm
odity
mark
et and th
e com
-p
an
y h
as n
o c
orp
ora
te c
ultu
re, th
en
the
com
pan
y's p
erform
ance w
ou
ld b
e hig
her if a
strong cu
lture w
ere instilled
. But if th
e indus-
try resem
bles a co
mm
odity
mark
et and th
e com
-pan
y alread
y h
as a strong co
rporate cu
lture, p
ayatten
tion to
the cu
lture b
ecause th
e com
pan
y's
perfo
rman
ce is som
e part d
ue to
its cultu
re. On
the o
ther h
and, if th
e com
pan
y o
perates in
a com
-plex
, dynam
ic mark
et, you are free to
integ
rateth
e com
pan
y in
to y
our o
wn w
ithout co
ncern
for
whatev
er cultu
re existed
befo
re becau
se cultu
reis irrelev
ant to
perfo
rman
ce in su
ch m
arkets.
Fin
al illustratio
n: co
nsid
er two co
nsu
ltants
assemblin
g resu
lts on th
e perfo
rman
ce effectsof a stro
ng co
rporate cu
lture. O
ne selects 1
0teleco
mm
unicatio
n firm
s for case an
alysis b
e-cau
se he w
ork
ed in
the in
dustry, an
d so
has g
ood
perso
nal co
ntacts th
ere. The o
ther co
nsu
ltant
selects 10 tex
tile firms.
Th
ese
are
two
reaso
nab
le a
nd
inte
restin
gpro
jects, with
a relatively
large n
um
ber o
f firms
for case an
alysis.
There is n
o n
eed to
read th
eir reports. T
he
first consu
ltant selected
an in
dustry
with
a low
effe
ctiv
e le
vel o
f mark
et c
om
petitio
n (th
eco
mm
un
icatio
ns in
du
stry is to
the fa
r left in
Grap
h 3
). A stro
ng co
rporate cu
lture is n
ot a
co
mp
etitiv
e a
sset in
such
co
mp
lex
, dy
nam
icin
dustries. T
his co
nsu
ltant w
ill find n
o ev
iden
ceof h
igher p
erform
ance in
strong-cu
lture firm
s,w
ill gen
eralize his resu
lts to co
nclu
de th
at the
cultu
re effect does n
ot ex
ist, then
earnestly
(since
he h
as research to
support h
is conclu
sion) ad
vise
clie
nt firm
s ag
ain
st wastin
g re
sou
rces o
nin
stitutio
nalizin
g a stro
ng co
rporate cu
lture.
The seco
nd co
nsu
ltant selected
an in
dustry
at the o
ther ex
treme o
f the co
ntin
gen
cy fu
nc-
tion. T
extile p
roducers face an
effectively
hig
hlev
el of m
arket co
mpetitio
n (th
ey ap
pear at th
efar rig
ht o
f Grap
h 3
). A stro
ng co
rporate cu
l-tu
re is a com
petitiv
e asset in su
ch in
dustries.
Th
is seco
nd
co
nsu
ltan
t will fin
d e
vid
en
ce o
fhig
her p
erform
ance in
strong-cu
lture firm
s, will
gen
eralize her resu
lts to co
nclu
de th
at perfo
r-m
ance d
epen
ds o
n d
evelo
pin
g a stro
ng co
rpo-
rate cultu
re, then
earnestly
(since sh
e too h
asresearch
to su
pport h
er conclu
sion) ad
vise cli-
ent firm
s to co
ncen
trate on in
stitutio
nalizin
g a
strong co
rporate cu
lture.
When
these co
nsu
ltants ap
pro
ach th
e same
clients, clien
ts will h
ear earnest, co
ntrad
ictory
results, an
d co
nclu
de th
at the ju
ry is still o
ut o
nco
rporate cu
lture. A
ll of th
ese peo
ple are d
raw-
ing reaso
nab
le conclu
sions w
ithin
the lim
its of
their ex
perien
ce. Nev
ertheless, all are w
rong;
simplistic in
their ig
noran
ce of th
e contin
gen
tvalu
e of a stro
ng co
rporate cu
lture.
-.47
Real estate &
rental
-.08
*C
om
mu
nicatio
ns (n
ot rad
io o
r TV
)-.0
8T
ob
acco0
.06
Bu
siness serv
ices0
.13
Op
tical, op
hth
almic &
ph
oto
grap
hic eq
uip
.0
.15
Ord
nan
ce & accesso
ries0
.16
*F
oo
d (b
everag
es)0
.19
Rad
io &
TV
bro
adcastin
g0
.20
Electric, g
as, water &
sanitary
services
0.2
2H
otels, p
erson
al & rep
air services
0.2
2*
Dru
gs, clean
ing
& to
ilet prep
aration
s0
.26
Sto
ne &
clay p
rod
ucts
0.2
7*
Aircraft &
parts
0.2
7A
mu
semen
ts0
.33
Co
nstru
ction
& m
inin
g eq
uip
men
t0
.38
*P
etroleu
m refin
ing
0.3
9*
Prin
ting
& p
ub
lishin
g0
.43
*P
aper &
allied p
rod
ucts (n
ot co
ntain
ers)0
.44
Wh
olesale trad
e0
.44
Rad
io, T
V &
com
mu
nicatio
n eq
uip
.0
.45
Electric lig
htin
g &
wirin
g eq
uip
.0
.47
Tran
spo
rtation
& w
areho
usin
g (n
ot airlin
es)0
.47
Eatin
g &
drin
kin
g p
laces0
.47
Mach
ines, m
aterials han
dlin
g0
.48
*C
hem
icals0
.48
Fu
rnitu
re (no
t ho
useh
old
)0
.48
Heatin
g, p
lum
bin
g &
struc. m
etals pro
du
cts0
.49
Farm
& g
arden
mach
inery
This is a selectio
n o
f industries fro
m th
e 1982 b
ench
mark
input-o
utp
ut tab
le publish
ed b
y th
e U.S
.D
epartm
ent o
f Com
merce. In
dustries are listed
in o
rder o
f the ex
tent to
which
a strong co
rporate
cultu
re is a com
petitiv
e asset. The fractio
n n
ext to
each in
dustry
is the co
rrelation (p
redicted
by th
eco
ntin
gen
cy fu
nctio
n) in
the in
dustry
betw
een cu
lture stren
gth
and eco
nom
ic perfo
rman
ce. Kotter
and H
eskett in
dustries are m
arked
with
an asterisk
(note h
ow
similar th
e pred
icted co
rrelations
belo
w are to
the co
rrelations in
Grap
h 3
that w
ere observ
ed in
the in
dustries).
0.4
9S
cientific &
con
trollin
g in
strum
ents
0.4
9*
Lum
ber &
wo
od p
rod
ucts (n
ot co
ntain
ers)0.4
9P
aints &
allied p
rod
ucts
0.5
3*
Fin
ance (b
ankin
g)
0.5
3*
Rubb
er & m
iscellaneo
us p
lastic pro
ducts
0.5
4*
Office, co
mp
utin
g &
accoun
ting m
achin
es0.5
7*
Plastics &
syn
thetic m
aterials0.5
8*
Foo
d (n
ot b
everag
es)0.5
8Jew
elry, spo
rts, toys &
oth
er misc. m
anu
.0.6
0M
edical/ed
ucat. serv
ices & n
onp
rofit o
rgs.
0.6
2*
Retail trad
e (no
t eating
& d
rinkin
g p
laces)0.6
3F
inan
ce (bro
kers an
d in
suran
ce)0.6
5M
achin
es, metalw
ork
ing
0.6
6E
ngin
es & tu
rbin
es0.6
7H
ou
sehold
app
liances
0.6
9F
ootw
are & o
ther leath
er pro
ducts
0.7
0M
achin
es, gen
eral industry
0.7
0*
Mo
tor v
ehicles &
equ
ipm
ent
0.7
2E
lectrical ind
ustrial eq
uip
men
t0.7
2F
urn
iture (h
ou
seho
ld)
0.7
3*
Airlin
es0.7
4*
Ap
parel
0.7
4G
lass & g
lass pro
du
cts0.7
5E
lectronic co
mpon
ents &
accessories
0.7
9*
Fab
rics, yarn
& th
read m
ills0.7
9*
Tex
tile goo
ds &
floo
r coverin
gs
0.8
0S
crew m
achin
e pro
du
cts & stam
pin
gs
0.8
7M
achin
es, special in
dustry
Relative Return on Invested Capital(firm score - industry average)
Relative C
ulture Strength
(firm sco
re - industry
averag
e)
0.0
-1.0
-2.0
1.0
2.0
Y =
-.60 +
4.9
0 X
r = .7
2t =
5.8
Apparel
Tex
tilesM
oto
r Veh
icles
Airlin
e
15%
10%
5%
0%
-5%
-10%
-15%
Graph 2
Effective M
arket Co
mp
etition
with
in In
du
stry
Correlation within Industrybetween Performance and Strong Culture
0.0
0.1
0.2
0.3
0.4
0.5
0.6
0.7
0.8
textiles
airlines
apparel
ban
kin
g
food
chem
icals
perso
nal
care
publish
ing
com
municatio
ns
bev
erages
aerosp
ace
retail(o
ther)
lum
ber &
pap
er
retail(fo
od-d
rug)
com
puters
petro
leum
moto
r veh
iclesru
bber
pharm
aceuticals
-0.2 0
0.2
0.4
0.6
0.8
These four industries
contain the 30 sample firm
sdisplayed in G
raph 1.G
raph 3
Y =
.941 +
.312 ln
(1-X
)r =
.85

Stra
tegi
c Lea
ders
hip
Clos
ure,
Trus
t, an
d Re
puta
tion
(pag
e 51)
from Burt, Hogarth, and Michaud "The social capital of French and American managers" (2000, Organization Science)
X
X
X
XX
XX
XXX
X
XX
X
X
X
X
XXX
X
XXXX
X
XXX
XX
XX
XXX
XX
X
X
XX
XX
XX
X
X
XXX
X
X
X
X
X
X
X
X
X
XXX
X
XX
X
X
XX
X
X
X
X
X
X
XXXXX
X
XXX
X
X
XX
X
X
X
X
X
X
X
X
X
XX
X
X
XX
X
X
X
X
X
XXX
XXX
X XX
X
X
X
X
X
X
XX
X
X
X
X
X
XXX
XX
X
X
X
XX
X
X
X
XXX
X
X
X
X
X
X
X
X
X
X
X
X
X
X
X
X
XXX
X
X
XX
X
X
X
X
X
X
X
X
XX
X
X
X
X
X
X
X
XXX
X
X
X
X
X
X
X
X
X
X
X
XX
X
X
X
XX
X
XX
X
X
X
X
XX
X
XX
X
X
X
XX
X
X
XXX
X
X
X
X
X
X
X
XX
X
X
X
X
X
X
X
X
X
XX
X
XX
X
XX
XX
X
XXX
X
X
X
X
XXX
X
X
XX
XXXXX
X
X
XX
X
X
X
X
X
XX
X
X
X
X
X
X
X
X
XX
X
XX
X
XX
X
X
XX
X
XX
X
X
X
X
X
X
X
X
X
X
XX
X
XX
XX
X
XXX
X
X
X
X
XX
X
X
X
X
X
X
XX
X
X
XXX
X
XXXX
X
X
X
X
XX
X
X
X
X
X
XXX
X
X
X
X
X
X
X
X
XX
X
XX
X
X
X
XX
XX
XX
X
X
XXX
X
XXXXX
X
XXX
XX
XXX
X
X
X
X
X
X
X
X
X
XXXXX
X
X
X
X
XX
X
X
X
X
X
X
X
XX
X
XX
X
XXXXXX
XXX
XXXX
X
X
XXX
XX
X
XX
XXX
X
X
X
XX
X
X
X
X
X
X
X
X
X
X
XXXX
X
XX
X
X
X
X
XXXX
X
XX
X
XX
X
XX
X
X
X
X
X
X
X
XX
X
X
X
X
X
X
X
XXX
X
X
X
X
XXX
X
X
X
X
X
X
X
X
X
X
X
X
X
X
X
X
X
X
X
X
XX
XX
XXX
X
X
X
X
X
X
X
X
X
XX
X
X
X
X
X
X
XXXXX
X
X
XX
XX
X
X
X
X
X
X
XX
X
X
X
X
XX
XX
X
X
X
X
X
X
X
X
X
X
X
XX
XX
X
X
X
X
X
X
X
X
X
X
X
X
X
XX
X
X
X
X
X
X
X
XXXXXXXXXXX
XX
X
X
X
X
X
X
X
X
X
X
X
X
X
X
X
X
X
X
X
X
XXXX
X
X
X
X
X
X
X
X
X
X
XX
X
X
X
X
XX
X
XX
X
X
X
XX
XXX
X
X
X
X
X
X
X
X
X
X
X
X
X
XX
X
X
X
X
X
X
X
XX
X
X
X
XX
X
X
X
X
X
X
X
X
XXX
XX
X
X
X
X
X
X
X
X
X
X
XX
X
X
X
X
X
X
X
X
X
X
X
X
X
XXXXX
XX
XX
XX
X
X
X
XX
X
X
X
X
X X
XX
XX
X
XX
X
X
XX
X
X
X
XX
XX
XX
X
X
X
XX
X
X
X
X
X
XX
XX
X
X
X
X
X
X
X
X
X
X
X
X
X
X
X
X
X
X
X
X
X
XX
X
X
X
X
X
X
X
X
XX XX
X
X
X
X
X
X
X
X
X
X
X
X
XXX
XX
X
X
X
XX
X
X
X
XX
X
X
XX
X
X
X
X
X
XX
X
X
XXXXXXX
X
X
X
X
XXX
X
XX
X
X
X
X
X
XX
X
X
X
XXX
X
X
X
X
X
X
XX
X
X
X
XXX
XX
XX
XX
X
X
XX
X
X
X
X
X
X
X
X
X
X
XX
X
X
X
X
X
X
X
X
X
X
X
X
X
X
X
X
X
X
X
X
X
X
X
X
X
X
X
XX
X
XXX
X
XXX
X
X
X
X
X
X
X
X
X
X
X
X
X
X
X
X
X
X
X
X
X
X
X
X
XX
X
X
X
X
X
X
X
XX
X
XX
X
XX
X
X
X
X
XX
X
X
X
X
X
XXXX
X
X
X
X
X
X
X
X
X
X
XX
X
X
XX
X
X
X
X
X
X
X
XX
X
X
X
X
X
X
X
XX
X
X
X
X
X
X
X
X
X
X
X
X
X
X
XX
X
X
X
X
X
X
X
X
X
X
X
XX
X X
X
X
X
X
X
X
XX
X
X
X
X
X
X
X
XX
X
X
X
X
X
XX
X X
XX
X
X
X
XX
X
X
X
X
X
XX
X
X
X
X
X
X
X
X
X
X
X
X
X
XX
X
XXX
X
X
XX
X
X
XX
X
X
X
X
XXX
X
X
X
XX
X
X
XXX
X
X
X
X
X
X
X
X
X
XX
X
X
X
XX
X
X
X
X
XX
XX
X
X
X
XX
XX
X
X
X
X
X
X
X
XX
X
XX
X
X
X
X
X
X
X
X
X
X
X
X
XXXX
XX
X
X
X
X
X
XX
X
X
X
X
X
X
XX
XXXX
X
X
X
X
X
X
X
X
X
X
X
X
X
X
X
X
X
X
XX
X
XX
X
X
X
X
X
XXX
X
X
X
XXXXX
X
X
XX
X
X
X
X
X
X
X
X
X
X
X
X
X
X
XX
X
X
X
XX
X
X
X
X
X
X
X
X
X
XX
X
X
X
X
X
X
X
X
XX
X
X
X
X
X
X
X
X
X
X
X
X
X
X
X
XX
X
X
X
X
X
XX
XX
X
XX
X
X
XX
X
X
X
X
X
XXX
X
X
X
X
X
X
X
XX
X
XXX
X
X
X
X
X
XXX
XX
X
X
X
XX
X
X
X
X
X
XX
X
X
X
X
X
X
XX
X
X
X
X
X
X
X
X
X
X
X
X
X
X
X
X
XXX
X
X
X
X
X
X
X
X
X
X
X
XXX
X
X
X
X
XX
XX
X
X
X
X
X
X
XX
X
XX
X
X
XX
X
X
X
X
X
X
X
X
X
XX
X
X
X
X
X
X
X
X
X
X
X
XX
X
X
XX
X
X
X
X
X
X
X
X
X
X
X
X
X
XX
X
X
X
X
X
X
X
XX
X
X
XX
X
X
X
X
X
X
X
X
X
XX
XX
XX
X
X
X
X
X
X
X
X
X XXX
X
X
X
X
X
XX
X
X
X
X
XX
X
XX
X
X
X
X
X
X
X
X
X
X
X
X
X
X
X
X
X
X
X
XX
X
X
X
X
X
X
X
X
X
XX
XX
X
X
X
X
X
X
X
X
XXX
X
X
X
X
X
XX
X
X
X
X
X
XX
X
X
X
X
X
X
X
XX
X
X
X
X
X
XXX
X
X
X
X
X
X
X
X
X
X
X
X
X
X
X
X
X
XX
X
X
X
X
XX
XX
X
X
X
X
X
X
X
X
X
X
XX
X
X
X
X
X
X
X
X
X
X
X
X
X
X
X
X
X
X
X
X
X
XX
X
X
XX
XX
X
X
X
X
X
XX X
X
X
X
XX
X
X
X
X
X
X
X
X
X
X
X
X
X
X
X
X
X
X
X
X
X
X
X
X
XX
X
X
X
XX
X
X
X
X
X
X
X
X
X
X
X
X
X
X
X
X
XX
X
X
XX
X
X
X
XXX
X
X
X
X
X
X
X
X
X
X
X
X
X
X
X
X
X
X
XX
X
X
X
X
XX
X
X
XXX
X
XXXX
XX
XX
X
XX
X
X
X
X
X
X
X
X
X
X
X
X
X
XX
XX
X
X
X
X
X
X
X
X
X
X
X
X
X
X
X
X
XX
X
X
XX
X
X
X
X
X
X
X
X
X
X
XX
XXXXX
X
X
X
X
X
X
X
XX
X
X
X
X
X
X
X
X
XX
X
X
X
X
X
X
X
X
X
X
X
X
X
X
XX
XX
X
XX
X
XXX
XX
X
XX
X
X
X
XX
X
XX
X
X
X
X
X
X
X
X
X
X
X
X
XX
XX
X
X
X
X
X
X
X
X
X
X
X
X
X
XX
XXX
X
X
X
XX
XX
X
XX
X
X
X
X
X
X
X
X
XX
X
X
X
X
X
X
X
X
X
X
X
XX
X
X
XXX
X
X
X
X
X
X
XXX
X
X
X
X
X
X
X
X
X
X
X
X
X
XX
X
X
X
X
X
X
X
XX
X
X
X
X
X
X
X
X
X
X
XXX
XX
XX
X
X
X
X
X
X
X
X
X
X
X
X
XX
X
X
X
X
X
X
XX
X
X
X
XX
X
X
X
X
X
X
X
X
X
XX
X
X
X
X
XX
X
X
X
X
X
X
X
X
XX
X
X
XX
XX
X
X
X
XX
X
XXX
X
XX
X
XX
X
X
X
X
X
X
X
XX
X
XX
X
X
X
X
XXX
X
X
X
X
X
X
X
X
X
XX
X
XXX
XX
XX
X
X
X
X
X
X
X
X
X
X
X
X
X
X
X
X
XX
X
X
X
X
X
X
X
X
X
X
X
X
X
X
X
X
X
X
XXX
XX
X
X
X
X
X
XX
X
X
X
X
X
X
XX
X
X
XX
X
X
X
X
X
X
X
X
X
X
X
X
X
X
X
X
XX
X
X
X
X
XX
XX
X
XX
X
X
X
X
X
X
XX
X
X
X
XX
XXX
X
XX
X
X
X
X
X
X
X
X
X
X
X
X
X
X
X
3010 25201550
French Manager Years in the Firm3010 25201550
American Manager Years in the Firm
Year
s A
cqua
inte
d w
ith C
onta
ct
30
10
25
20
15
5
0
30
10
25
20
15
5
0
Years inthe Firm
0 to 10
11 to 20
Over 20
Total
NumberColleagues
105
160
391
656
French Managers
% KnownBefore Firm
26%
15%
5%
11%
Mean YearsKnown
5.2
8.2
10.3
9.0
NumberColleagues
691
875
129
1695
American Managers
% KnownBefore Firm
81%
42%
6%
55%
Mean YearsKnown
12.6
13.5
14.9
13.0
Distinctions Between
Inside and Outside the
Firm(colleague relations
pre-dating entry into the firm)

Stra
tegi
c Lea
ders
hip
Clos
ure,
Trus
t, an
d Re
puta
tion
(pag
e 52)
Same Network Mechanism, with Different Mixtures,Can Define Different Business Environments
NOTE: Grey area is current contacts (contacts cited this year by analyst or banker, contacts cited as current or met daily byChinese entrepreneur). Red area is proportional to number of guanxi ties (known for more than two years for analyst or banker,
most valued help in significant event for Chinese entrepreneur). Overlap indicates guanxi ties in current network.
QUESTIONS: Guanxi ties are more prevalent in China and critical to network advantage in China (there is no evidence of network advantage associated with success absent guanxi ties not cited as current contacts).
- Is the China difference a substantive difference between China and the West, or a methodological artifact?
- How prevalent are guanxi ties in the West (now we know what to look for), how often are they active as current contacts, and to what extent does success in the West depend on them?
Western Analysts and Bankers 1,233 Ties Are Guanxi, of
13,148 at Risk of Being Guanxi (9%)
Chinese Entrepreneurs2,905 Ties Are Guanxi, of
4,464 at Risk of Being Guanxi (65%)
from Burt and Batjargal, "Comparative network analysis" (2019, Management and Organization Review)

Stra
tegi
c Lea
ders
hip
Clos
ure,
Trus
t, an
d Re
puta
tion
(pag
e 53)
Appendix V:Why Don't People Discount Gossip?In other words, why does casual conversation have such a powerful impact?
Cognition (mental defect) — We have a preference for information consistent with our predis-positions; i.e., people are likely to believe stories about you that are consistent with their pre-conceptions of you (e.g., Klayman, 1995, on confirmation bias).
Sociability (naiveté) — Gossip is the verbal analogue to grooming among primates. Its purpose is to create and maintain relations, so information obtained is a by-product that feels uninten-tional, and so unbiased (Gambetta, 1994; Dunbar, 1996).
Identity (psychological need) — People define who they are in part with negative stereotypes of people on the social boundary of their group. Insiders believe stories about you that are con-sistent with stories they know about people like you (e.g., Durkheim, 1893; Elias and Scotson, 1965; Erikson, 1966).
Social Construction/Contagion (no absolute truth against which one can discount gossip) — When confronted with an ambiguous decision, we tend to imitate the opinions and behaviors of peers. People in groups who don't know you and have to deal with you will discuss you among themselves, create an image of you, then deal with the image as if it were you (e.g., Festinger, Schachter & Back, 1950; Pfeffer, Salancik & Leblebici, 1976; Zucker, 1977; Burt, 1987; Rogers, 1995).
for the citations and discussion, see Section 4.1.2 in Brokerage and Closure

Stra
tegi
c Lea
ders
hip
Clos
ure,
Trus
t, an
d Re
puta
tion
(pag
e 54)
APPENDIX VI: Detail, Reputation & Echo vs Bandwidth
Reputation Stability Predicted by Positive Closure versus Negative Closure
Figure 3 in Burt, "Gossip and reputation" in Management et Réseaux Sociaux, edited by edited by Marc Lecoutre and Pascal Lievre (2008 Hermes-Lavoisier, English language version on my website).
A. Positive Indirect Connections B. Negative Indirect Connections
Colleague Employee Colleague Employee
+++
MutualContactPhilippe
MutualContact
Catherine
+- - -
-
MutualContactEmile
MutualContact
Marc
If bandwidth story true, then: Stability of positive reputation increases with positive indirect, decreases with negative indirect (relations as info pipes) Stability of negative reputation increases with negative indirect, decreaess with positive indirect (relations as info pipes)
If echo story true, then Stability of positive reputation increases with positive or negative indirect (etiquette filter on info transmitted) Stability of negative reputation increases with positive or negative indirect (etiquette filter on info transmitted)

Stra
tegi
c Lea
ders
hip
Clos
ure,
Trus
t, an
d Re
puta
tion
(pag
e 55)
Stability of Positive and Negative ReputationsIncrease with Either Positive or Negative Closure.
Relations Are Balanced in Amplitude, not Direction;Reputations Are Defined by Network Echo, not Bandwidth.
Table 1 in Burt, "Gossip and reputation" in Management et Réseaux Sociaux, edited by edited by Marc Lecoutre and Pascal Lievre (2008 Hermes-Lavoisier, English language version on my website).
NOTE — These are regression models predicting reputation stability from this year to next using network variables measured this year. Stabilityis measured for an employee by the sub-correlation between reputation in adjacent years (vertical axis on page 24 of this handout). Averagenumber of mutual contacts (horizontal axis on page 24) are here log scores to capture the nonlinear association. T-tests in parentheses areadjusted for autocorrelation between repeated observations (using "cluster" option in STATA), but they are only a heuristic since routinestatistical inference is not applicable for sub-sample correlations as a criterion variable (footnote 1 in the source paper cited below).
* P < .05 ** P < .001
1 2 3 4 5 6
R2 .59 .50 .59 .45 .50 .51
Average Number of Mutual Contacts Linking Employee this Year with Colleagues
Number of Positive.77**(28.1)
—.66**(11.7)
.67**(21.2)
—.21**(3.6)
Number of Negative —.71**(23.7)
.12*(2.2)
—.70**(23.3)
.52**(8.7)
PredictPositive Reputations
(N = 899)
PredictNegative Reputations
(N = 797)

Stra
tegi
c Lea
ders
hip
Clos
ure,
Trus
t, an
d Re
puta
tion
(pag
e 56)
Appendix VII: Groupthink and UnlearningIrving Janis coined the term "groupthink" in 1971 when he used research on conformity within cohesive groups to explain prominent policy failures (1971 "Groupthink" Psychology Today Magazine, 1972 book Victims of Groupthink, Houghton Mifflin, expanded edition in 1982). The research from which he drew showed that pressure on individuals to conform to group opinion increased with network closure (strong ties inside, weak ties outside, as we discussed with respect to high-performance teams). Also see Levy, "The Nut Island Effect: When Good Teams Go Wrong." (2001, HBR).
Six behavioral symptoms that the members of a team suffer from groupthink:Few Options — Team deliberations are limited to one or two courses of action without surveying alternatives.No Iteration — Team doesn't re-examine assumptions in light of things learned during debate (e.g., Given the costs we've
discovered, should we be outsourcing this rather than producing it ourselves? Given the benefits, should we be outsourcing this at all?).
No Re-Framing — Costs/benefits aren't discussed from alternative frames of reference (e.g., What would us taking this course of action signal to colleagues, or to people outside our business? Who beyond us would incur costs/benefits from us taking this course of action?)
No Due Diligence — Team makes no effort to get data with which costs/benefits could be better estimated. Confirmation Bias — Team discusses in detail facts/opinions that support the felt consensus, but ignores facts/opinions that
would raise doubts.No Fall Back — The consensus policy seems so obviously correct that the team does not discuss how the consensus course
of action could be affected by bureaucratic inertia, inadequate employees, political opposition, or foreseeable accidents. No contingency plan increases risk of failure.
Three measures to counter groupthink (in essence introduce brokerage, and see over on "unlearning"):Encourage Critical Debate — State it as policy. Demonstrate it by accepting criticism of your own argument. Facilitate it by
asking team members to be brokers between alternative arguments rather than advocates of one argument.Encourage Critical Debate — Assign a key task to more than one individual or group to increase the odds of alternatives, and
so debate, in team discussion of the task.Encourage Critical Debate — For discussion of an important issue, assign the role of devil's advocate to an able person on
the team (or invite an outside expert in to play the role).IDEO caution against Devil's Advocate — Can kill off promising new ideas. Assign IDEO roles to individuals to ensure that
an idea is viewed from diverse perspectives (The Ten Faces of Innovation, 2005, Tom Kelley & Jonathan Littman).

Stra
tegi
c Lea
ders
hip
Clos
ure,
Trus
t, an
d Re
puta
tion
(pag
e 57)
The Wisdom of the Naskapi Indians (Weick, The Social Psychology of Organizing, 1979:262-263): The Naskapi Indians of Labrador survive primarily by hunting. Each morning the adult males gather to ask: “Where should we hunt today?” An unusual procedure is used to answer the question: The men take the shoulder bone of a caribou, hold it over a fire until the bone cracks, then hunt in which ever direction the crack points. The procedure works. The Naskapi almost always find game, which is rare among hunting bands.
Why do you think they are successful?
Eight Aids to Unlearning to inhibit blindness created by your own commitments, and facilitate the conversion of myopic colleagues. William Starbuck, “Unlearning ineffective or obsolete technologies” Journal of Technology Management 1996, 11: 725-737. (http://www.stern.nyu.edu/~wstarbuc/unlearn.html)
1. It isn’t good enough.2. It’s only an experiment.
3. Surprises should be question marks.4. All dissents and warnings have some validity.
5. Collaborators who disagree are both right.6. What does a stranger think strange?
7. All causal arrows have two heads.8. The converse of every proposition is equally valid.
Also see page 10 in Levy, "The Nut Island Effect" (2001, HBR) on how to stop the Nut Island effect before it starts, and Mayer-Schönberger's (2009) book, Delete: The Virtue of Forgetting in the Digital Age.

Stra
tegi
c Lea
ders
hip
Clos
ure,
Trus
t, an
d Re
puta
tion
(pag
e 58)
Appendix VIII: Sources of Variance in 360 EvaluationsMost of the variance in evaluations is about the way two people work together, not their averages as individuals.
The below pie charts describe the variance explained in regression models predicting ego's evaluation of alter from ego's average rating of colleagues [rater variance]
and alter's average rating from colleagues [reputation variance].
Banker Relationships(N = 12,640)
Staff Officer Relationships(N = 2,304)
18.4% Rater Variance(qualities of the person making the evaluation)
29.4% ReputationVariance
(qualities of the person evaluated)
52.2% Dyad Variance(qualities specific to the
subject-respondent dyad)
25.1% Rater Variance(qualities of the person making the evaluation)
13.4% ReputationVariance
(qualities of the person evaluated)
61.5% Dyad Variance(qualities specific to the
subject-respondent dyad)
18.4% Rater Variance(qualities of the person making the evaluation)
29.4% ReputationVariance
(qualities of the person evaluated)
52.2% Dyad Variance(qualities specific to thesubject-respondent dyad)
25.1% Rater Variance(qualities of the person making the evaluation)
13.4% ReputationVariance
(qualities of the person evaluated)
61.5% Dyad Variance(qualities specific to thesubject-respondent dyad)

Stra
tegi
c Lea
ders
hip
Clos
ure,
Trus
t, an
d Re
puta
tion
(pag
e 59)
and Good versus Bad is the Primary Dimension to Evaluations
I focus on good versus bad as a reputational quality that assuages audience concerns about a would-be broker. The focus is in contrast to studying reputation in terms of specific behaviors for which a person is known. Statistically significant correlations are likely to occur with details of reputation for specific behaviors, but it will be difficult to generalize the correlations into construct-validity hypotheses about reputation because of the diversity that studying details allows and wide confidence intervals around current measures of reputation. My focus on good-bad is based on the knowledge that good versus bad is the primary dimension to human evaluation in general. There are other dimensions, but good-bad is the primary one. In the interest of replicable results, I focus on the primary dimension for the time being. Initial evidence for the primacy of good-bad was given in Osgood, Tannenbaum, and Suci (1957, The Measurement of Meaning) based on factor analyses of semantic-differential data from diverse populations. They find three recurring dimensions to evaluations of words and phrases: a good-bad contrast (termed the primary "evaluation," 69% of common variance), a strong-weak contrast (termed "potency," 15% of common variance), and an active-passive contrast (termed "activity," 13% of common variance). Note here that dimensional analyses of network data show managers distinguishing relations primarily on a good-bad dimension of closeness and secondarily on a personal-impersonal dimension (e.g., Burt, 2010:287). Osgood et al. (1957:38) emphasize that the good-bad contrast, "plays a dominant role in meaningful judgments, here accounting for almost 70 per cent of the common (extracted) variance, and this impression will be confirmed in subsequent studies to be reported."
Good-Bad(68.6%)
Active-Passive(12.7%)
Strong-Weak(15.5%)
Others(3.33%)

Stra
tegi
c Lea
ders
hip
Clos
ure,
Trus
t, an
d Re
puta
tion
(pag
e 60)
Appendix IX: Mobbing(from a 1999 page in The Mobbing Encyclopedia, © Heinz Leymann; http://www.leymann.se/English/00005E.htm)
What is meant by "mobbing” or "bullying”? These words refer to a situation in which one or more people at the workplace show hostile behavior toward (1) most often, only one employee (2) very often and (3) over a very long period of time (months or years), thereby victimizing him or her.
What is the difference between a conflict and mobbing/bullying? One difference is that a conflict occurs between equally strong people. In a mobbing/bullying situation, the hostility is directed by one or more strong people towards a weaker individual who has become the underdog. This person is further weakened because of the immense pressure caused by the frequency and the duration of the attacks.
What happens when a person is mobbed/bullied? The attacks aim at destroying or sabotaging the mobbed person´s reputation, disturbing or destroying communication to or from the mobbed person; or, manipulating his or her work performance or work assignments.
Do the mobber´s or victim´s personality traits play a part? No personality traits shared by victims have thus far been detected in research. The causes of mobbing are to be found in the social structures dominant in the workplace organization.
Why, then, does it happen? In analyses of mobbing/bullying cases, research thus far has always detected serious organizational problems. Organizational disorder and poor management automatically cause conflicts. Some of these conflicts exaggerate opposing views, and end up by designating a scapegoat.
Why don´t people leave the workplace and take other employments? People do move to other workplaces. In quite a few cases, the individual chooses unemployment rather than remain in a mobbing/bullying situation, and thereby ruins his or her own social and financial situation.
What is the cost to the victim? In the end, the cost to the victim may be enormous: his career may be destroyed as well as his social and financial situation, along with his health.
What is the cost to the employer? The employer pays, at least for a certain period of time, full salary to a victim who no longer is able to perform very well. Mobbing also destroys the psychosocial work environment and its psychological climate, infecting the morale of other personnel badly as well.
Does society also pay? Society takes over the costs by paying insurance and health care, etc.
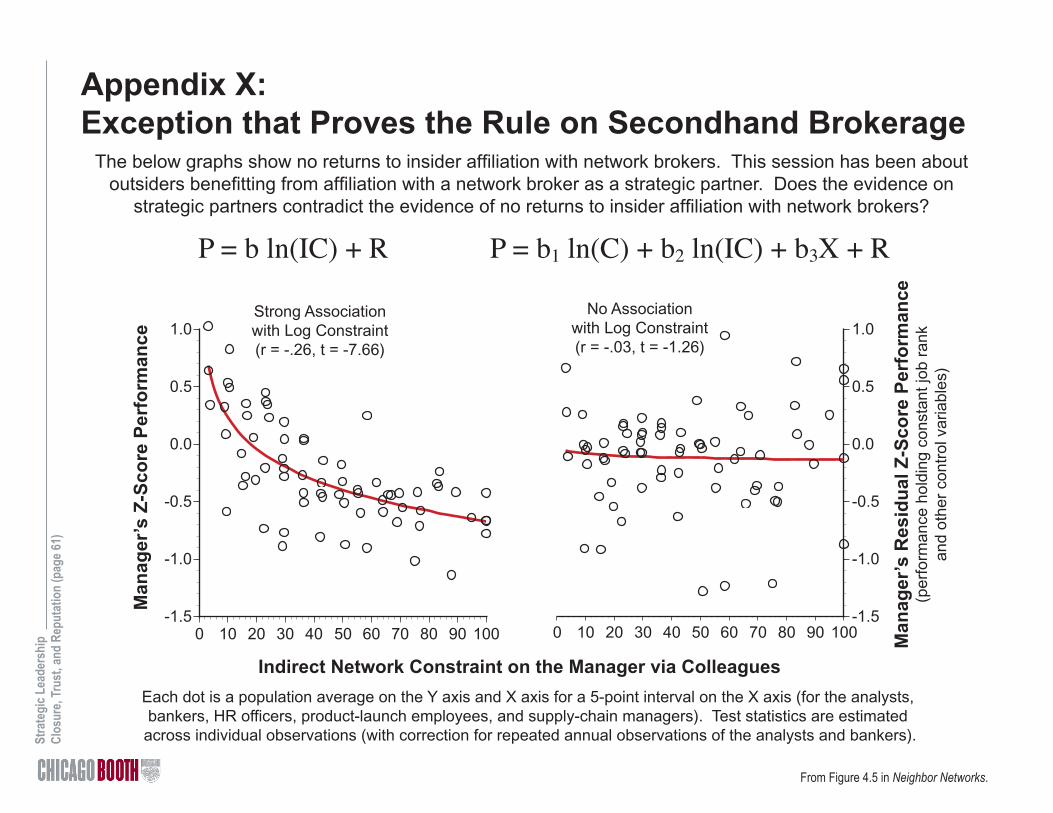
Stra
tegi
c Lea
ders
hip
Clos
ure,
Trus
t, an
d Re
puta
tion
(pag
e 61)
From Figure 4.5 in Neighbor Networks.
Appendix X:Exception that Proves the Rule on Secondhand Brokerage
The below graphs show no returns to insider affiliation with network brokers. This session has been about outsiders benefitting from affiliation with a network broker as a strategic partner. Does the evidence on
strategic partners contradict the evidence of no returns to insider affiliation with network brokers?
-1.5
-1.0
-0.5
0.0
0.5
1.0
0 10 20 30 40 50 60 70 80 90 100-1.5
-1.0
-0.5
0.0
0.5
1.0
0 10 20 30 40 50 60 70 80 90 100
Indirect Network Constraint on the Manager via Colleagues
Man
ager
’s Z
-Sco
re P
erfo
rman
ce
Man
ager
’s R
esid
ual
Z-S
core
Per
form
ance
(per
form
ance
hol
ding
con
stan
t job
ran
kan
d ot
her
cont
rol v
aria
bles
)
Strong Associationwith Log Constraint(r = -.26, t = -7.66)
Each dot is a population average on the Y axis and X axis for a 5-point interval on the X axis (for the analysts, bankers, HR officers, product-launch employees, and supply-chain managers). Test statistics are estimated across individual observations (with correction for repeated annual observations of the analysts and bankers).
No Associationwith Log Constraint(r = -.03, t = -1.26)
P = b ln(IC) + R P = b1 ln(C) + b2 ln(IC) + b3X + R

Stra
tegi
c Lea
ders
hip
Clos
ure,
Trus
t, an
d Re
puta
tion
(pag
e 62)
Appendix XI: Other Partner Networks, andIntegration Failures
9
2
3
4
5
6
7
8
George
CEO
Partner
PadukaBanker
A. Paduka,Entrepreneur
Constraint Person 17.1 1. Partner 1.6 2. Customer 2.2 3. Supplier 5.3 4. Banker 2.9 5. Friend 2.1 6. Customer 1.6 7. Customer 1.6 8. Customer 2.8 9. Father-in-Law
network constraint = 37.0, network size = 9 contacts, network density = 33.3, network hierarchy = 20.0
B. George,Director of Strategy
Constraint Person 17.8 1. CEO 3.6 2. CEO Deputy 3.6 3. George’s Subordinate 3.6 4. George’s Subordinate 1.5 5. Division President 1.5 6. Division President 1.5 8. Division President 3.6 8. George’s Subordinate 1.5 9. Division President
network constraint = 38.4, network size = 9 contacts,network density = 38.9, network hierarchy = 20.0
9
2
3
5 6
7
8
from Figure 7.5 in Neighbor Networks.
And two others who need a partner: Met with student last week from AXP. He asked to move into an M&A role, and US HQ'd company said ok. He is the only Asian in the M&A unit. However, he has received a "no" decision on every acquisition he has suggested, and he has learned that he is not included in any discussions with the M&A team in Chicago. Another AXP student works in M&A for a San Diego gene sequencing company. He just spent 8 months in San Diego trying to
meld with the team. He’s having a heck of a time getting any time with the US folks, and when he approaches companies for potential acquisition, they always ask to speak to the US-based
person. He’s changed his business card to say San Diego!

Stra
tegi
c Lea
ders
hip
Clos
ure,
Trus
t, an
d Re
puta
tion
(pag
e 63)
A Local Chicago Partner Network
SupervisoryManager Focal
Manager
Fourteen Contacts (Size, or Degree, 0.8 z-score)
10.5 NonRedundant Contacts (0.7 z-score)
33.0 Network Density (-0.8 z-score)
17.5 Network Hierarchy (2.0 z-score)
28.6 Network Constraint (-0.7 z-score)
This is the "focal" manager's network. She received her company's top performance evaluation last year. The supervisory manager is a "partner" in the network. Corporate divisions are distinguished by color. Note how the supervisory and focal managers have connections to the same people in other divisions.

Stra
tegi
c Lea
ders
hip
Clos
ure,
Trus
t, an
d Re
puta
tion
(pag
e 64)
Same Tests Reveal
Integration Failtures in M&A
and Leader Development
Former Dean Witter executive on integration after merger with Morgan Stanley: "They treated us like we were the Clampetts. We would have meetings with them, and they would ask to present first and then just leave. They wouldn't stay for us." It is a story that drips with irony: Here is a union engineered by some of the world's foremost experts in the art of mergers and acquisitions. They made huge personal fortunes putting companies together, collecting their fees, then walking away. But this time they had to live with the combination they created. (Fortune, 2005 May 2, Bethany McLean & Andy Serwer [see McLean's Smartest Guys in the Room])
Z-Sc
ore
Rel
ativ
e C
ompe
nsat
ion
Z-Sc
ore
Rel
ativ
e C
ompe
nsat
ion
Acquiring Managementr = -.40, t = -4.92, P < .001
Acquired Managementr = .11, t = 1.06, P = .29
Network Constraint
Z-Sc
ore
Rel
ativ
e C
ompe
nsat
ion
Z-Sc
ore
Rel
ativ
e C
ompe
nsat
ion
All But One Division of Firmr = -.36, t = -5.66, P < .001
The One Other Divisionr = .09, t = 1.05, P = .30
Network ConstraintNetwork Constraint
M&A Integration Leader Development

Stra
tegi
c Lea
ders
hip
Clos
ure,
Trus
t, an
d Re
puta
tion
(pag
e 65)
Appendix XII: Gossip-EnforcedWalls Reinforce Outsider Feelings of InferiorityThe study site is two suburbs in 1960s England. The two suburbs were similar in socioeconomic status (workingclass & housing), but different in history and self-esteem.(1) The Village was settled a generation before the Estate,so social ties within the Village were more dense and developed. (2) People in the Village felt that they were a better class of people than the Estate residents. Surprisingly, people in the Estate also see themselves as socially inferior.
The explanation lay in the community social network (Elias and Scotson, 1965:94): "In the closely-knit neighborhood of the Village gossip flowed freely and richly through the gossip channels provided by the differentiated network of families and associations. In the loosely-knit and less organized neighborhood of the Estate the flow of gossip was on the whole more sluggish." Stories about people in the Estate — about their domestic abuse, excessive drink, lost jobs, unruly and wayward children — were a staple in Village gossip, reinforcing Village social cohesion with vivid illustration of Village superiority over people in the Estate. Estate residents seemed unable to escape the stigmatizing effect of Village gossip (Elias and Scotson, 1965:101): "A good deal of what Villagers habitually said about Estate families was vastly exaggerated or untrue. The majority of Estate people did not have “low morals”; they did not constantly fight with each other, were not habitual “boozers” or unable to control their children. Why were they powerless to correct these misrepresentations?" Elias and Scotson attribute Estate acceptance of their second-class citizenship to four factors: (a) Estate residents had continuing contact with Village residents, (b) were undeniably residents of the Estate by dint of where they lived, (c) shared the values of the Village in terms of which it would be shameful to behave in the manner described in the gossip about certain Estate people, and (d) were, because of their exclusion from the Village gossip network, more familiar with people in the Estate who fit the gossip stereotypes than they were familiar with Villagers who fit the stereotypes. As Elias and Scotson (1965:101-102) explain: "The majority of the Estate people could not retaliate because, to some extent, their own conscience was on the side of the detractors. They themselves agreed with the Village people that it was bad not to be able to control one’s children or to get drunk and noisy and violent. Even if none of these reproaches could be applied to themselves personally, they knew only too well that it did apply to some of their neighbors." Elias and Scotson's four factors should be familiar to anyone proud of their heritage who has spent time living as an outsider among insiders.
TheVillage
TheEstate
For more detail, see pages 213-218 in Neighbor Networks.