Embed Size (px)
Citation preview

1045-9219 (c) 2015 IEEE. Personal use is permitted, but republication/redistribution requires IEEE permission. Seehttp://www.ieee.org/publications_standards/publications/rights/index.html for more information.
This article has been accepted for publication in a future issue of this journal, but has not been fully edited. Content may change prior to final publication. Citationinformation: DOI 10.1109/TPDS.2015.2398438, IEEE Transactions on Parallel and Distributed Systems
IEEE TRANSACTIONS ON PARALLEL AND DISTRIBUTED SYSTEMS, TPDS-2014-07-0595 R1 (MINOR REVISION) 1
Cloud Performance Modeling and Benchmark Evaluation of Elastic Scaling Strategies
Kai Hwang, Fellow IEEE, Xiaoying Bai, Member IEEE, Yue Shi,
Muyang Li, Wen-Guang Chen and Yongwei Wu, Member IEEE
Abstract— In this paper, we present generic cloud performance models for evaluating Iaas, PaaS, SaaS, and
mashup or hybrid clouds. We test clouds with real-life benchmark programs and propose some new
performance metrics. Our benchmark experiments are conducted mainly on IaaS cloud platforms over scale-
out and scale-up workloads. Cloud benchmarking results are analyzed with the efficiency, elasticity, QoS,
productivity, and scalability of cloud performance. Five cloud benchmarks were tested on Amazon EC2:
namely YCSB, CloudSuite, HiBench, BenchClouds, and TPC-W. To satisfy production services, the choice of
scale-up or scale-out solutions should be based on the workload patterns and resources utilization rates
required. Scaling-out machine instances have much lower overhead than those experienced in scale-up
experiments. However, scaling up is found more cost-effective in sustaining from higher workload. The cloud
productivity is greatly attributed to system elasticity, efficiency, QoS and scalability. We find that auto-scaling
is easy to implement but tends to over provision the resources. Lower resource utilization rate may result from
auto-scaling, compared with using scale-out or scale-up strategies. We also demonstrate that the proposed cloud
performance models can be applied to evaluate PaaS and SaaS clouds as well.
Index Terms— Cloud computing, benchmark suites, scale-up, and scale-out. —————————— ——————————
1 INTRODUCTION AND MOTIVATION
he hype of cloud computing is entering the disillusionment
stage to reach the plateau of productivity in the next
decade. Following a pay-as-you-go business model, cloud
platforms are gradually adopted by the main stream of IT
industry. Cloud computing attempts to provide an integrated
platform to benefit many users at the same time. This multi-
tenant and on-demand service model is achieved through
virtualization on all shared utilities and resources [6, 21].
This paper models cloud performance for IaaS, PaaS and
SaaS clouds at different abstraction levels. We assesse various
benchmarks targeted at clouds, and analyze new performance
results. We assess the state of cloud computing from the
perspectives of performance. This work is extended from
previous works by [2-4,7-11, 15, 16, 20, 22-27,30-37].
Up to now, the original cloud design goals are only
partially fulfilled. We are still climbing a steep hill to deliver
sustained cloud productivity. To reduce the cost of leased
resources and to maximize utilization, elastic and dynamic
resource provisioning are the foundation of cloud performance.
NIST [28] has identified that cloud computing demands
scalable performance, economics of scale, measurable
productivity, high availability and energy efficiency. With
guaranteed SLA (service-level agreement), cloud automatically
allocates more resources by scale-up or scale-out resources
[14,29], when the workload increases beyond certain threshold.
The system releases unused resources by scale-down or scale-
in [5, 19, 30] when the load reduces.
Cloud scaling is enabled by using virtualized resources.
Hence, the scale of computing power needs to be calculated at
the abstraction level of virtual resources. To handle workload
composed of large number of small jobs, performance
concerns are the average response time and throughput, rather
than completion time of individual tasks. Hence, scalability
needs to upgrade the system capability to handle large number
of small users. Cloud productivity is tied to the performance
cost ratio.
To meet the demand, we propose some new cloud
performance metrics terms of efficiency and productivity. The
resources are scaled in terms of virtual machine instances. The
scalability is driven by cloud productivity, taking both QoS and
price into consideration. Various benchmark suites have been
suggested to evaluate cloud performance under different
workloads in the past.
We chose a set of widely used cloud benchmarks to test
the scale-out and scale-up capabilities of EC2-like cloud
platforms. The workload patterns include large scale data
processing and data analytics, web search and service. Five
benchmarks applied on EC2 include the BenchCloud at USC,
YCSB from CloudSuite [14], HI Bench [20], and TPC-W [35].
Cloud relies on virtualization technique to enable elastic
resource provisioning or de-provisioning. Hence, the
effectiveness of virtualization becomes crucial to cloud
performance. From the software perspective, multi-tenant
architecture is introduced with clouds to support big-data
processing and Internet/web services.
T
————————————————
Manuscript submitted July 30, 2014 and revised Dec.15, 2014, to appear in IEEE Transactions on Parallel and Distributed Systems. All rights
reserved by IEEE publishers and the coauthors.
K. Hwang is with Departments of Electrical Engineering and Computer Science, University of Southern California. He is the corresponding author.
Contact him by email: [email protected].
X. Y. Bai is with Dept. of Computer Science and Technology, Tsinghua
University. China. Contact her at E-mail: baixy@ tsinghua.edu.cn.
Y. Shi is with the Dept. of Electrical Engineering, University of Southern
California, Los Angeles, CA. Email: [email protected]
M. Y. Li is with Department of Computer Science and Technology,
Tsinghua University, China. Email: [email protected].
W. G. Chen is with Dept. of Computer Science and Technology, Tsinghua University, China,. Contact him at: cwg@ tsinghua.edu.cn.
Y. W. Wu is with the Dept. of Computer Science and Technology, Tsinghua University, China,. Contact him at: wuyw@ tsinghua.edu.cn.
grade a small machine instance to a bigger one while scale down does the
opposite.
The concept of scaling can be also extended from machine
sizes (such as machine instances, memory demand, etc.) to

1045-9219 (c) 2015 IEEE. Personal use is permitted, but republication/redistribution requires IEEE permission. Seehttp://www.ieee.org/publications_standards/publications/rights/index.html for more information.
This article has been accepted for publication in a future issue of this journal, but has not been fully edited. Content may change prior to final publication. Citationinformation: DOI 10.1109/TPDS.2015.2398438, IEEE Transactions on Parallel and Distributed Systems
2 IEEE TPDS-2014-07-0595 R1
2
In the remaining sections, we cover cloud workload,
benchmarks tested and performance metrics including some
newly discovered ones. Then we provide an elasticity analysis
and study the interplay between efficiency, productivity and
scalability of cloud platforms. We also reveal the tradeoffs
between scaling out and scaling up policies. Our benchmark
experiments were conducted on Amazon EC2.
2 SCALING STRATEGIES AND BENCHMARK SUITES
Due to multi-tenant demands, clouds are facing all sorts of workloads including multi-tasking, batch processing, streaming, data-mining and analytics. The cloud workload must be matched with adequately configured resources to achieve high performance and sustained productivity.
2.1 Auto-scaling, Scale-out, Scale-up and Mixed Strategies
Clouds are used primarily for data-intensive and latency-sensitive jobs, search engines, OLTP/business processing, social-media networking, data warehousing and big-data analytics. Cloud workloads are characterized by their dataset size, algorithms, memory-access pattern, and service model applied. We demonstrate
three cloud resource scaling techniques in Fig.1.
The Auto scaling shown in Fig.1c is a brutal-force
strategy to increase or decrease resources in a cloud. The
idea is to add more machine instances when a specific
resource (like CPU) utilization rate exceeds a preset
threshold during a fixed observation period.
Practicing auto scaling can enhance the cloud
performance at the expenses of always provisioning
more resources above the workload demand.
As seen from Fig.1, auto-scaling is easy to implement
with a utilization-thresholding approach. However, it
tends to waste higher in over-provisioned resources. We
illustrate the ideas of scaling up resources in Fig.1 (a) and
scaling-out resources in Fig.1 (b). These scaling
strategies and their possible mixtures are characterized
below:
Auto-scaling strategy applies a threshold to increase
the machine instance automatically, once the
instance utilization rate exceeds a preset threshold
(say 85%) for a preset period (say 60 sec). Auto-
scaling tends to over-provision resources to satisfy
the user at run time.
Scale-out strategy allows adding more machine
instances or processing nodes of the same type based
on the quota agreed in the service-level agreement
(SLA). Obviously, scaling out appeals more to the
use of homogeneous clusters with identical nodes.
Scale-up strategy is implemented with scaling the
cloud from using small nodes to more powerful
nodes with better processor, memory or storage.
Mixed scaling strategy allows one to scale up (or
scale-down) the instance type and adjust the instance
quantity by scale-out (or scale-in) resources at the
same time. Mixed scaling appeals better with using
heterogeneous clusters.
(a) Scale-up instance type (capacity) (b) Scale-out in instance quantity (c) Brutal-force auto-scaling
Figure 1: Auto-scaling, scale-out and scale-up machine instance resources in elastic IaaS clouds, where over-provisioning and under-provisioning of machine resources are shown in differently shaded areas above and below the workload curves. .
We will evaluate the relative performance of the three
scaling strategies in subsequent sections. In general, the scale-
up approach (Fig.1a) takes longer overhead to reconfigure and
has the lowest elasticity among all scaling approaches. Scaling-
up or down take longer time and thus results in both over-
provisioning and under-provisioning of resources as seen by
the shaded areas above or below the workload curve.
Scale-out strategy (Fig.1b) matches the workload
variation closely. Thus it has the lowest over- or under-
provisioning of resources. The auto-scaling (Fig.1c) wastes
resources in over-provisioning. But it will not cause any
interruption in client services committed. This is the main
reason why scale-out is more often practiced in cloud
platforms than the scale-up approach.
2.2 Cloud Benchmark Suites Tested
Table 1 summarizes 5 open-source cloud benchmark suites
we have tested. The Yahoo YCSB and TPC-W are developed
by industry. The BenchClouds and CloudSuite are developed
in the academia. The CloudSuite [9] was developed at EPFL in Lausane. All source codes and datasets are available
in these open-source benchmarks. The BenchCloud is still
under development at USC. This suite collects users programs
and datasets mainly from social-media applications.
HI Bench is specifically tailored for running Hadoop
programs on most clouds. The suite was developed for
measuring the speed, throughput, HDFS bandwidth, and
resources utilization in a large suite of programs. The
1045-9219 (c) 2015 IEEE. Personal use is permitted, but republication/redistribution requires IEEE permission. Seehttp://www.ieee.org/publications_standards/publications/rights/index.html for more information.
This article has been accepted for publication in a future issue of this journal, but has not been fully edited. Content may change prior to final publication. Citationinformation: DOI 10.1109/TPDS.2015.2398438, IEEE Transactions on Parallel and Distributed Systems
HWANG, ET AL, CLOUD PERFORMANCE MODELING AND BENCHMARK EVALUATION OF ELASTIC SCALING STRATEGIES PAGE 13
3
YCSB is a Yahoo! Cloud Serving Benchmark [7]. Other
cloud benchmarks include the CloudCmp [16], Phoronix
[17], TPC-W [18], CloudStone [19], and C-meter [20].
Interested readers are refer to the assessment by Farber
and Kounev [8] for cloud benchmarking trends. Two
commercial cloud evaluations were conducted recently.
Nine large cloud providers were evaluated by BitCurrent [3]
and 144 cloud sites were examined by CloudHarmonics [6].
However, the performance metrics they have applied are far
from being adequate to cover the QoS and productivity in
clouds. Performance in cloud environment.
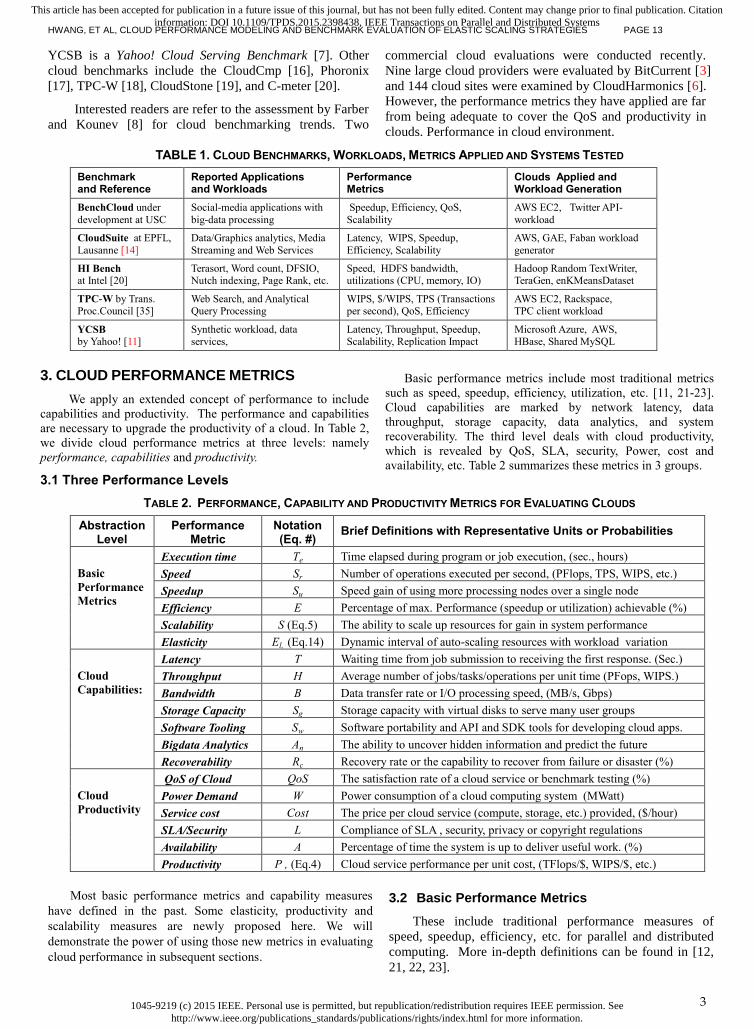
TABLE 1. CLOUD BENCHMARKS, WORKLOADS, METRICS APPLIED AND SYSTEMS TESTED
Benchmark and Reference
Reported Applications and Workloads
Performance Metrics
Clouds Applied and Workload Generation
BenchCloud under
development at USC
Social-media applications with
big-data processing
Speedup, Efficiency, QoS,
Scalability
AWS EC2, Twitter API-
workload
CloudSuite at EPFL,
Lausanne [14]
Data/Graphics analytics, Media
Streaming and Web Services
Latency, WIPS, Speedup,
Efficiency, Scalability
AWS, GAE, Faban workload
generator
HI Bench
at Intel [20] Terasort, Word count, DFSIO, Nutch indexing, Page Rank, etc.
Speed, HDFS bandwidth, utilizations (CPU, memory, IO)
Hadoop Random TextWriter, TeraGen, enKMeansDataset
TPC-W by Trans. Proc.Council [35]
Web Search, and Analytical Query Processing
WIPS, $/WIPS, TPS (Transactions per second), QoS, Efficiency
AWS EC2, Rackspace, TPC client workload
YCSB
by Yahoo! [11]
Synthetic workload, data
services,
Latency, Throughput, Speedup,
Scalability, Replication Impact
Microsoft Azure, AWS,
HBase, Shared MySQL
3. CLOUD PERFORMANCE METRICS
We apply an extended concept of performance to include
capabilities and productivity. The performance and capabilities
are necessary to upgrade the productivity of a cloud. In Table 2,
we divide cloud performance metrics at three levels: namely
performance, capabilities and productivity.
3.1 Three Performance Levels
Basic performance metrics include most traditional metrics
such as speed, speedup, efficiency, utilization, etc. [11, 21-23].
Cloud capabilities are marked by network latency, data
throughput, storage capacity, data analytics, and system
recoverability. The third level deals with cloud productivity,
which is revealed by QoS, SLA, security, Power, cost and
availability, etc. Table 2 summarizes these metrics in 3 groups.
TABLE 2. PERFORMANCE, CAPABILITY AND PRODUCTIVITY METRICS FOR EVALUATING CLOUDS
Abstraction Level
Performance Metric
Notation (Eq. #)
Brief Definitions with Representative Units or Probabilities
Basic
Performance
Metrics
Execution time Te Time elapsed during program or job execution, (sec., hours)
Speed Sr Number of operations executed per second, (PFlops, TPS, WIPS, etc.)
Speedup Su Speed gain of using more processing nodes over a single node
Efficiency E Percentage of max. Performance (speedup or utilization) achievable (%)
Scalability S (Eq.5) The ability to scale up resources for gain in system performance
Elasticity El, (Eq.14) Dynamic interval of auto-scaling resources with workload variation
Cloud
Capabilities:
Latency T Waiting time from job submission to receiving the first response. (Sec.)
Throughput H Average number of jobs/tasks/operations per unit time (PFops, WIPS.)
Bandwidth B Data transfer rate or I/O processing speed, (MB/s, Gbps)
Storage Capacity Sg Storage capacity with virtual disks to serve many user groups
Software Tooling Sw Software portability and API and SDK tools for developing cloud apps.
Bigdata Analytics An The ability to uncover hidden information and predict the future
Recoverability Rc Recovery rate or the capability to recover from failure or disaster (%)
Cloud
Productivity
QoS of Cloud QoS The satisfaction rate of a cloud service or benchmark testing (%)
Power Demand W Power consumption of a cloud computing system (MWatt)
Service cost Cost The price per cloud service (compute, storage, etc.) provided, ($/hour)
SLA/Security L Compliance of SLA , security, privacy or copyright regulations
Availability A Percentage of time the system is up to deliver useful work. (%)
Productivity P , (Eq.4) Cloud service performance per unit cost, (TFlops/$, WIPS/$, etc.)
Most basic performance metrics and capability measures
have defined in the past. Some elasticity, productivity and
scalability measures are newly proposed here. We will
demonstrate the power of using those new metrics in evaluating
cloud performance in subsequent sections.
3.2 Basic Performance Metrics
These include traditional performance measures of
speed, speedup, efficiency, etc. for parallel and distributed
computing. More in-depth definitions can be found in [12,
21, 22, 23].

1045-9219 (c) 2015 IEEE. Personal use is permitted, but republication/redistribution requires IEEE permission. Seehttp://www.ieee.org/publications_standards/publications/rights/index.html for more information.
This article has been accepted for publication in a future issue of this journal, but has not been fully edited. Content may change prior to final publication. Citationinformation: DOI 10.1109/TPDS.2015.2398438, IEEE Transactions on Parallel and Distributed Systems4 IEEE TPDS-2014-07-0595 R1
4
Speed (S): Number of millions of operations per second
(Mops). The operation could be integer or floating-point
like MFlops. The speed is also known as throughput by
TPC-W benchmark, measured by millions of web
interactions per second (WIPS).
Speedup (Su): Speed gain of using multiple nodes
Efficiency (Ef): Percentage of peak performance achieved
Utilization (U): Busy resources (CPU, memory, storage).
Scalability (Sc) : Scaling ability to upgrade performance.
3.3 Cloud Capabilities and Productivity
These are macroscopic metrics that describe the
hardware, software, reconfiguration and networking
capabilities of a cloud as listed below: These metrics are
good indicators of cloud’s performance basis.
Latency (L): System response time or access latency
Bandwidth (B): This is data transfer rate or I/O rate.
Elasticity (El ): The ability for cloud resources to scale
up/down or scale in/out to match with workload variation
Software (Sw) : Software portability, API and SDK tooling
Big-data Analytics:(An): The ability to uncover hidden
information or predict trends in big data.
For the first time, we introduce cloud productivity as a
compound function of QoS, availability, power efficiency,
and performance-cost ratio. These attributes are defined
below. More details are given in subsequent sections.
Quality of Service (QoS): Satisfaction on user services
System availability (A): The system up time per year.
Service costs (Co): User renting costs and provider cost.
Power Demand (W): Cloud power consumption (MWatt).
SLA/Security (L) : Compliance of SLA, security, ETC.
Productivity (P) : QoS-satisfied performance per unit cost
4. EFFICIENCY, PRODUCTIVITY AND SCALABILITY
In this section, we analyze three mutually related factors
toward productive cloud performance. The scalability concept
was developed with the parallel computing community [22].
The elasticity was introduced with the inception of cloud
computing [18]. Productivity of clouds is newly introduced in
this paper extending our preliminary work reported in
CloudCom 2014 [23]. We attempted to relate cloud productivity
to QoS-satisfied performance over business gains in cloud
computing systems.
4.1 Cloud Efficiency and Productivity
We specify a cloud configuration on the resources
provisioned at a given time instance. The configuration is
described by a resources matrix as follows.
(1)
In this resource matrix, we have
1) are machine instances;
2) are resources types in instances;
3) are resource quantity .
Consider a cluster configuration Λ. Let T(1) be the execution time of an application code on a 1-ECU instance. Let 𝑇(𝛬) be the execution time of the same code on a virtual cluster Λ. The speedup is defined by Speedup (Λ) = T(1) / 𝑇(𝛬). Assume that the cluster is built with n instance types. The type-I has ni instances, each with an ECU count ci. We calculate the total cluster ECU count by:
N(𝛬) = ∑ 𝑛𝑖 × 𝑐𝑖 𝑖=𝑛𝑖=1 (2)
This N(𝛬) count sets a ceiling of the cluster speedup. Now, we are ready to define the cloud efficiency for the cluster Λ in question as follow:
Efficiency (Λ) = Speedup (Λ) / N(𝛬)
= T(1) / { 𝑇(𝛬) × ∑ 𝑛𝑖 × 𝑐𝑖 𝑖=𝑛𝑖=1 } (3)
In general, the cloud productivity is driven by three
technical factors that are related to the scaling factor.
1) System performance such as throughput in terms of
transactions per second or response time.
2) System availability as an indicator of QoS measured
by percentage of uptime.
3) Cost for rented resources measured by price.
Let Λ be a cloud configuration in use. We define the
cloud productivity by three factors, all are functions of Λ.
𝑃(Λ) =𝑝(Λ)×𝜔(Λ)
𝐶(Λ) (4)
Where 𝑝(Λ) is a performance metric used, which could the
speed or throughput selected from Table 2. The 𝜔(Λ) is the
QoS of the cloud. For simplicity, one can approximate the
QoS by the service availability measure. According to
CloudHarmonics Report on 144 cloud web sites [5], more
than half have 99% or higher availability. The 𝐶(Λ) is the
user cost to rent resources to form the virtual cluster Λ.
4.2 Production-Driven Scalability
For different workload, scalable performance is often tied
to different resource types, even though instances are often
provisioned in configuration package. The performance of
CPU-bound jobs is primarily decided by machine instance
numbers. Memory-bound problems are limited by the memory
(including cache) allocated within the machine instances. The
storage-bound problems are limited by the network latency and
disk storage and I/O bandwidth encountered.
The cloud scalability is driven by the productivity and
QoS of a cloud system. This measure is inversely
proportional to the service costs As we scale from
configuration Λ1 to another Λ2. This metric evaluates the
economy of scale by a pair of productivity ratio. The higher
is the value of a scalability measure, the more opportunity
exists to target the desired scaling scheme.
kmija ][
},...,2,1|{ kjj
vV
},...,2,1|{ mirR i
)1,1( kjmiaij
mkmm
k
k
m
k
aaa
aaa
aaa
r
r
r
vvv
...
............
...
...
...
...
21
22221
11211
2
1
21

1045-9219 (c) 2015 IEEE. Personal use is permitted, but republication/redistribution requires IEEE permission. Seehttp://www.ieee.org/publications_standards/publications/rights/index.html for more information.
This article has been accepted for publication in a future issue of this journal, but has not been fully edited. Content may change prior to final publication. Citationinformation: DOI 10.1109/TPDS.2015.2398438, IEEE Transactions on Parallel and Distributed SystemsHWANG, ET AL, CLOUD PERFORMANCE MODELING AND BENCHMARK EVALUATION OF ELASTIC SCALING STRATEGIES PAGE 13
5
𝑆(Λ1, Λ2) =𝑃(Λ2)
𝑃(Λ1)=
𝑝(Λ2)×𝜔(Λ2)×𝐶(Λ1))
𝑝(Λ1)×𝜔(Λ1)×𝐶(Λ2) (5)
With comparable QoS and cost estimation, the scalability is
directly proportional to productivity (Eq.4). Therefore, will
demonstrate the measured productivity results and skip the
scalability plots in subsequent sections.
Table 3 shows some machine instances applied in our
experiments on EC2. The provider rents resources by instance
types and quantity. AWS has defined a term ECU (EC2
Compute Unit) as an abstract unit to quantify the computing
power of each instance type. By 2009 standard, the
performance of a 1 ECU instance is equivalent to a CPU built
with 1.2 GHz 2007 Xeon processor [1]. The memory and
storage capacity also affect the ECU count. For example, a
system may rent three instances on EC2 for general purpose
applications with two instance types.. We use an instance
vector 𝑉 = {𝑚1. 𝑙𝑎𝑟𝑔𝑒, 𝑚3. 𝑙𝑎𝑟𝑔𝑒} built with 𝑎𝑚1.𝑙𝑎𝑟𝑔𝑒 = 1
and 𝑎𝑚3.𝑙𝑎𝑟𝑔𝑒 = 2 instances. To assess the cost effectiveness,
we list also the instance renting prices in 2014.
TABLE 3. MACHINE INSTANCE TYPES IN AMAZON EC2 IN 2014
Instant
Type
ECU Virtual
Cores
Memory
(GB)
Storage
(GB)
Price
($/hour)
m1.small 1 1 1.7 1 ×160 0.044
m1.medium 2 1 3.7 1×410 0.087
m3.medium 3 1 3.75 1 x 4 SSD 0.07
m1.xlarge 8 4 15 4×420 0.350
m3.xlarge 13 4 15 2×40 (SSD) 0.280
c1.xlarge 20 8 7 4×420 (SSD) 0.520
c3.xlarge 14 4 7.5 2×40 (SSD) 0.210
5. CLOUD PERFORMANCE MODELS
Depending on the cloud service models applied, the
resources could be controlled by users, vendors, or by both
jointly. As a comparison, control of desktop computing systems
falls in the hands of users, except the control of networking
facility which is shared. This adds a great burden on the part of
users. The control of cloud resources shifts the burden from
users to vendors as we change to IaaS, PaaS, and SaaS clouds.
5.1 Generic Cloud Performance Model
First, we introduce a generic cloud performance model.
Then we will show how to extend or refine the generic
framework to model all types of cloud computing services. The
performance of a cloud, denoted as F(Cloud), is modeled by a
performance function F, consisting of a 5-tuple expression.
F (Cloud) = {Service Model, Service Offerings,
Performance, Capabilities, Availability} (6)
where the Cloud is identified by the cloud site name. The
Service Model could be one or more of the available service
modes such as IaaS, PaaS, SaaS, DaaS (Data as a Service),
TaaS (Testing as a Service), HaaS (Health-care as a Service),
NaaS (Network as a Service), LaaS (Location as a Service),
CaaS (Communication as a Service), etc.
The performance here refers to a subset of performance
metrics selected from Category 1 in Table 2. To illustrate the
modeling ideas, we first specify three basic cloud service
models, namely IaaS, PaaS and SaaS. Then we show how to
extend the model to cover hybrid clouds or cloud mashups.
5.2 IaaS Performance Model
We test the following set of performance-attributes in
evaluating an IaaS cloud. This model specification could be
specially tailored to special user groups or providers. Figure 2
shows 3 Keviate charts for 3 cloud service models. Each spoke
of the polygon represents an attribute dimension. The attribute
scale is proportional to the directional length along the spoke.
The further away from the center, the higher performance is
expressed in a scale from 0 to 5. Where value “0” means the
least performance and “5” the highest.
(a) IaaS (Amazon EC2) [3, 9, 30, 38]
(b) PaaS (Google AppEngine) [3, 9, 13, 27]
(c) SaaS (Salesforces) [3, 9, 21, 37].
Figure 2 Performance maps of three representative platforms for IaaS, PaaS and SaaS clouds, where the polygon data points are extracted from the cited reports on Amazon EC2, Google AppEngine, and Salesforce cloud.
The polygon area offers an average or approximated
indicator of the overall performance of the cloud along those
dimensions. Let be a set of n performance
attributes. In general, the larger is the area of the polygon
(Eq.7), the higher is the average performance demonstrated.
Here we assume that all six dimensions are equally weighted.
(7)
Three representative cloud configurations are modeled in
Fig.2 along different sets of performance metrics. They differ in
resources provisioned, performance level achieved,
performance results recorded, etc. The runtime conditions
cannot be fully predicted or captured by users.
0
2.5
5Speedup(Su)
Scalability(S)
Elasticity(El)
Availability(A)
Costs(Co)
NetworkBandwidth(B)
0
2.5
5Software(Sw)
SLA/Security(L)
Scalability(S)
PowerDemand(W)
Latency(T)
Efficiency(E)
0
2.5
5Speedup(Su)
P-Scalability(Φp)
Analytics(An)
Throughput(H)
Software(Sw)
Productivity(P)
},....,2,1|{ nipi
1)2sin(5.0 ii ppnArea

1045-9219 (c) 2015 IEEE. Personal use is permitted, but republication/redistribution requires IEEE permission. Seehttp://www.ieee.org/publications_standards/publications/rights/index.html for more information.
This article has been accepted for publication in a future issue of this journal, but has not been fully edited. Content may change prior to final publication. Citationinformation: DOI 10.1109/TPDS.2015.2398438, IEEE Transactions on Parallel and Distributed Systems6 IEEE TPDS-2014-07-0595 R1
6
In general, we suggest the following 5-tuple to model the
performance of an infrastructure IaaS cloud:
F (Infrastructure cloud) = {< IaaS >, < Compute,
Storage >, <Su, El , S >, < B >, < A, Co > } (8)
where the 6 metrics are selected from Table 2. Figure 2(a)
shows the Amazon EC2 performance map, where the polygon
data points are extracted and normalized from previous reports
in [ 3, 9, 30, 38]. With some modifications, the model can be
applied to evaluate other IssS clouds like Rackspace, GoGrid,
FlexiScale, Joyent [21].
5.3 PaaS and SaaS Cloud Performance
The PaaS cloud platforms are used mainly in developing
user applications. Therefore, Eq. 9 a special set of performance
metrics are selected, different from those used to evaluate IaaS
models. For application developers, the major concern is
programmability or the effective use of software development
kits (SDK), etc. as in Fig.2(b). Again the dimensional
performance is based on previous reports [4, 10. 14, 27].
F (Platform Cloud) = { < PaaS >, < Apps Development,
TaaS>, < E, S >, < B, Sw >, < W, L > } (9)
where the 6 performance metrics are selected from in Table 2.
This model can modified to evaluate many PaaS platforms like
Microsoft Azure, Google AppEngine, and Salesforce
Force.com, Amazon Elastic MapReduce, and Aneka [21].
Multi-tenant architecture is reflected in a SaaS model. It
allows for a single software instance to be shared by many
tenants. Each user may work in a dedicated environment. Listed
below are commonly concerned issues that relate to SaaS
performance. For simplicity, we show in Eq. 10 the SaaS map
model in 6 performance dimensions.
F (Application Cloud) = { < SaaS >, < Marketing, Social
Media >, < Su, Φp >, < H, Sw, An >, < P > } (10)
Where the six metrics are selected from Table 1. In Fig.2(c), we
plot two performance polygons for Salesforce in CRM
(customer relation management) applications. The data are
points extrapolated from [4, 10, 21, 36]. This model can be
modified to evaluate many SaaS clouds like Google Gmail,
IBM Lotus Live, Microsoft Dynamic CRM, and Salesforce
CRM, etc.
5.4 Modeling Hybrid Clouds or Mashups
Private clouds are used by organization or enterprise
employees. They are used for research/development or
providing messaging or CaaS (Communication as a Service),
etc. Private clouds have better security, cost factors and
availability. Private cloud users are more concerned about raw
speed, utilization and productivity, etc.
Hybrid clouds are built with private cloud interacting
closely with some public clouds. They are also known as cloud
mashups. Given below in Eq. 11 is an example performance
model for hybrid clouds or mashups.
F (Hybrid Cloud) = { < IaaS, PaaS, SaaS >, < Social Media, Compute, Backup Storage, etc. >, < Su, U, E, Φ , Sr, Te >, < T, H, B, Sg, Sw >, < A, Co > } (11)
The first relative performance model is specified in Eq.(19).
The objective is to compare the relative performance of several
benchmark suites running on the same cloud platform. This
model specified in Eq.12 was applied to compare the
performance of HI Bench and BenchClouds in Fig.11(a).
F (YCSB, CloudStone, BenchCloud) = { < AWS EC2 and
S3>, <YCSB, CS, BC >, < Raw speed (Sr), Utilization (U),
Service Costs (C0), Productivity (P) > } (12)
Consider k cloud platforms <C1, C2, …, Ck>. Which are under the test by p benchmark programs < B1, B2, … ,Bp >. Assume that the clouds are tested by m performance metrics < M1, M2, …, Mm >. The following model (E.q.13) reveals the relative performance of multiple cloud platforms. For example, EC2 and Rackspace are evaluated in Fig.11 (b) for the case of choosing k=2, p=1 and m=6.
F (C1, C2, …,Ck ) = {< C1, C2, …., Ck >, < B1, B2, …., Bp >,
< M1, M2, …., Mm > } (13)
6. PROPERTIES OF CLOUD ELASTICITY
Elasticity cannot be achieved without virtualization. Multi-
tenancy architecture demands elastic resources with auto-
scaling to yield scalable performance. Differences in abstract
levels (IaaS, PaaS, SaaS in Table 4) also affect the system
reconfiguration capability or simply-put the elasticity. In the
past, physical computer resources may take hours to
reconfigure. Thus the elasticity is very low due to large
reconfiguration overhead.
Thus, elasticity was introduced to evaluate cloud scalability
from two perspectives [30]: (1) How fast or timely to change
the resources state in a cloud? (2) How precisely the resources
are provisioned to address the workload variations?
Elasticity has made possible to reconfigure within a very short
time by machine virtualization.
This is illustrated in Fig.3, where the elasticity is measured
with two parameters: speed and precision. Speed is calculated
by the time delay (θ) of the provisioning or de-provisioning
process, while precision is the offset (μ) with under- or over-
provisioning. The concept of elasticity is illustrated in Fig.3 in
connection with these two parameters.
The ideal scaling curve
The actual scaling curve
μ
θ Time
Figure 3. Illustration of cloud resource provisioning, where θ is the overhead time and μ is the offset between actual scaling and an auto scaling process.
By Herbst, et al [18], Elasticity defines the degree to which
a system is able to adapt to workload changes by provisioning
and de-provisioning resources in an autonomic manner, such
that at each time the available resources match the current
demand as closely as possible”. Let θ be the average time to
switch from an under-provisioned state to an elevated state and
The step jump by auto scaling.
The actual scaling curve.
θθ
μ
Time
Res
ou
rces
pro
vis
ion
ed

1045-9219 (c) 2015 IEEE. Personal use is permitted, but republication/redistribution requires IEEE permission. Seehttp://www.ieee.org/publications_standards/publications/rights/index.html for more information.
This article has been accepted for publication in a future issue of this journal, but has not been fully edited. Content may change prior to final publication. Citationinformation: DOI 10.1109/TPDS.2015.2398438, IEEE Transactions on Parallel and Distributed SystemsHWANG, ET AL, CLOUD PERFORMANCE MODELING AND BENCHMARK EVALUATION OF ELASTIC SCALING STRATEGIES PAGE 13
7
µ be the average percentage of under-provisioned resources
during the scaling process. The elasticity is defined by the
following expression:
. El = 1 / (θ × µ) (14)
Figure 4 plots the elasticity as a function of the reconfiguration
overhead (θ) under different provisioning offsets (μ) from the
actual scaling curve. When the offset is small (μ=10%), the
elasticity drops sharply as the overhead (θ) increases. When the
offset gets to 70%, the elasticity drops to 0.04 from 0.25, when
the average provisioning time θ is at 40 sec. Then the elasticity
stay rather low flatly as θ increases.
Figure 4. The cloud elasticity plotted from Eq.14.
The message being conveyed here is that in order to
increase the elasticity of a cloud system, we should minimize
the provisioning time and keep the provision offset as low as
possible. The elasticity is a necessary condition for scalability,
but not sufficient. The built-in auto-scaling mechanism
(illustrated in Fig.3) is greatly affected by the elasticity
measure. The fluctuation of resource usage and the delay of
instance replication or upgrading are all affecting the
performance in cloud applications.
7. MEASURED CLOUD BENCHMARK RESULTS
We have performed extensive cloud benchmark
experiments on the Amazon AWS EC2 with EMR (Elastic
MapReduce) library support. These experiments execute five
distinct benchmarks: BenchClouds, Yahood! YCSB, HI Bench,
and TPC-W as listed in Table 1. The purpose is to check the
performance of EC2 under different benchmark programs over
varying data sizes.
The experimental setting applies a fixed instance type to
scale out. For scale-up experiments, we have to change the
instance types by program direction. Manual scaling is applied
under program control in all experiments. Auto-scaling is not
applied in scaling experiments on EC2 due to its brutal force
provisioning policy. Some load-balancing was automatically
practiced on the EC2 under the control of the EMR library.
7.1 Elasticity Effects in Scale-Out Strategy
We have conducted three scale-out benchmark experiments on EC 2 using the USC Benchcloud, HI Bench, and TPC-W, respectively in Figs. 5 ~ 7.
(A). Filtering of Twitter Spams on EC2
This is a benchmark testing the performance a mashup of
two clouds (Twitter and EC2). In testing the BenchClouds
benchmark, we scan through large amount of social media data
(Tweets) collected from the Twitter cloud. Elastic MapReduce
(EMR) software on EC2 is used to perform the fast spam
filtering operations. The purpose is to filter out unwanted
Spams from large Tweet dataset in a very short time [31].
In Fig.5, we apply the m1small machine instance as listed
in Table 3. This instance has a computing power of 1 ECU
(Elastic compute unit) with 1 vCPU. The instance has 1.7 GB
of RAM memory and 160 GB storage. Each instance is charged
with $0.044/hour with EMR surcharge applied. The data sets
tested range from 10 GB to 100 GB and 1 TB.
(a) Spam filtering time (b) Speedup
(c) Productivity (d) Scalability for 1TB dataset
Figure 5. Scale-out BenchClouds results on MapReduce filtering twitter spams over AWS EC2 of various sizes. Parts (a, b, c) apply the same legend. Part &d) shows both scalability measures by scaling from 3 distinct instances.
For a small 10GB dataset, there exists no apparent benefit
by scaling out beyond 8 instances (Fig.12a). Efficiency drops
sharply as the number of machine instances increase (Fig.12c).
The filtering process reaches the peak speedup with 128 nodes.
(Fig.12b). For a large dataset of 1 TB, the execution time
decreases by 58 times (Fig12.5a) with 128 nodes. Thus good
speedup of 58 and 45% efficiency were achieved at 128 nodes
(Fig.12b, c). The small dataset shows poor productivity (such as
0
0.1
0.2
0.3
0 20 40 60 80 100 120 140 160 180 200 220 240
Ela
stic
ity
, E
l
Average provisioning time θ (sec)
μ=10% μ=30% μ=50% μ=70%
1
10
100
1,000
10,000
100,000
1 2 4 8 16 32 64 128
Exxe
cuti
on
tim
e
(se
c)
Number of instances
1TB 100GB 10GB
0
20
40
60
1 2 4 8 16 32 64 128
Spe
ed
up
Number of instances
0
0.5
1
1.5
1 2 4 8 16 32 64 128
Eff
icie
ncy
Number of instances
0
2
4
6
8
1 2 4 8 16 32 64 128
Sca
lab
ilit
y
Number of instances

1045-9219 (c) 2015 IEEE. Personal use is permitted, but republication/redistribution requires IEEE permission. Seehttp://www.ieee.org/publications_standards/publications/rights/index.html for more information.
This article has been accepted for publication in a future issue of this journal, but has not been fully edited. Content may change prior to final publication. Citationinformation: DOI 10.1109/TPDS.2015.2398438, IEEE Transactions on Parallel and Distributed Systems8 IEEE TPDS-2014-07-0595 R1
8
40 at 32 nodes in Fig.12.d), while the large dataset results in a
peak productivity value at 32 nodes.
The scalability drops as we scale out from 2, 4, or 8 nodes
up to 128 nodes (Fig.5.d) the drop in scalability (Fig.5.d) is
closely correlated to the fast dropping in efficiency. On the
other hand, the scalability in Fig.5.d varies closely with the
change in productivity (Fig.5.c). The 1 TB curves (marked by a
diamond legend) show that one can reach the peak productivity
and thus peak scalability at 32 nodes.
(B).HI Bench Results on Word Count
In HI Bench scale-out experiments, we increase the
quantity of the same machine instances used. We plot the
efficiency and productivity results in Fig.6 by running the
HiBench-WordCount program using the EMR clusters up to
16 m1.small nodes. In general, the efficiency (Fig.6a)
decreases as we scale out to more nodes. However, for large
data sets, the efficiency increases to a local peak at 8 nodes
and then it decreases slowly beyond 8 nodes.
Depending on the data size, the productivity increases
to different peak levels at different machine sizes. Foe
example, the peak occurs at 12, 8 and 4 nodes for 10 GB, 5
GB and 1 G, respectively. After the peak, the productivity
decreases more rapidly for small data size and slowly or
flatly for larger data sizes. This trend is caused by the QoS
and cost factors involved in Eq. (4). Other programs in HI
Bench, such as Sort, can be also applied in the scaling
experiments to be reported in Subsection 7.5.
(a) Scale-out efficiency (b) Scale-out productivity
Figure 6. Scale-out performance of HI Bench on EC2 built with up to 16 m1.small machine instances. Three curves correspond to executing 3 workload sizes in the Word Count program.
(C). TPC-W Scale-Out Results
This experiment is designed to test the TPC-W
performance on EC2 under scale-out workload. The workload
is generated by TPC client. We consider the workloads from
200 up to 2,400 users. In the scaling out process, we increase
from 1, 4, 8 and 16 nodes up to 32 nodes. The m1.small
instances are used in all scaling experiments. We report the
throughput in WIPS (web interactions per section) and QoS
measures in Figs. 7(a, b).
With small workloads (200 or 800 users), the WIPS count
is rather flat after 4 nodes. The throughput reaches its peak of
340 WIPS at 12 nodes for 2,400 users. With 4,000 users, the
peak value of 560 WIPS is reached at 20 nodes. The QoS
reaches its peak value (100%) quickly after increasing the
nodes to 4, 12 and 20, respectively (Fig.7.b). Figure 7.c shows
the variation of productivity for different workloads. Again, the
peak values occur at 4, 12 and 20 nodes for 800, 2,400 and
4,000 users, respectively.
The scalability plots in Fig7.d start from 1, 4, 8 and 16
nodes. Due to 2-order of magnitude difference of the 1-node
curve (marked by x in Fig7.d), we apply the wider scale on the
left y-axis for this curve. The remaining 3 curves are scaled by
the right y-axis. Accordingly, the scalability with 800 users
(Fig.7.d) has a sky rocket rise from 2 to 4 nodes. Similarly, we
see the peak rises of p-Scalability at 4, 8 and 16 instances,
respectively for more users. All scalability drops steadily after
reaching their peaks. TPC-W does not scale well beyond certain
cluster size.
7.2 Results of Scaling-Up Experiments
In scale-up experiments, we upgrade the machine instances
from small to medium, large and extra-large types as given in
Table 3 in order of increasing computing power (ECU and
vCPU), memory and storage capacities. Of course, the renting
cost increases from small to large, accordingly. Three scale-up
experiments performed on the EC2 by running the YCSB, HI
Bench, and TPC-W respectively.
In YCSB experiments, the EC2 system scales over 5 large or
xlarge instances along the x-axis in Fig.8. In TPC-W scale-up
experiments, we follow the scaling sequence: m1.small,
m1.medium, m3.medium, m1.lrage, and m1.xlarge. All scaling
are done by program control in the experiments. Auto scaling
cannot be implemented to automate the scaling-up process due
to heavy overhead or low elasticity encountered.
0
0.2
0.4
0.6
0.8
1
1.2
1 2 4 8 12 16
Eff
icie
ncy
# of instances
10GB 5GB 1GB
0
10
20
30
40
1 2 4 8 12 16
Prod
ucti
vit
y (
MB
/sec/$
)
# of instances
10GB 5GB 1GB

1045-9219 (c) 2015 IEEE. Personal use is permitted, but republication/redistribution requires IEEE permission. Seehttp://www.ieee.org/publications_standards/publications/rights/index.html for more information.
This article has been accepted for publication in a future issue of this journal, but has not been fully edited. Content may change prior to final publication. Citationinformation: DOI 10.1109/TPDS.2015.2398438, IEEE Transactions on Parallel and Distributed SystemsHWANG, ET AL, CLOUD PERFORMANCE MODELING AND BENCHMARK EVALUATION OF ELASTIC SCALING STRATEGIES PAGE 13
9
(a) Throughput (b) Quality of Service (QoS)
(c) Productivity (d) Scalability for 800 users, where the 1-curve (marked by x) applies
the right scale and remaining 3 curves apply the left scale.
Figure 7. Scale-out performance of TPC-W benchmark on Amazon EC2 cloud over increasing workload from 200 to 4,000 users. Parts (a, b, c) have the same legend. Part (d) scales from 4 initial conditions.
(A). Yahoo! YCSB Performance on EC2
We run the Yahoo! YCSB as part of the Cloudsuite data
serving benchmark on AWS Hbase 0.92.0 cluster. We applied a
write-intensive workload with 100K and 5M memory access
operations on different types of instances. We use the default
setting of Hbase. Figures 8(a, b) report the throughput and QoS,
respectively. The cluster scales up to m3.large nodes.
Figures 8(a) shows that for all three workloads, performance
increases apparently when scaling up from m1.large to
m3.xlarge instance, however for c3.xlarge and c1.xlarge,
throughput and execution time almost remain the same as
m3.xlarge instance. From Fig.8 (b), the efficiency drops rapidly
from m1.large to m1.xlarge and from c3.xlarge to c1.xlarge.
This is due to the fact that scaling up does not catch the
hardware resources increase.
We plot the productivity in Fig 8(c) for 5M memory
operations. Here, we the set the QoS (cloud availability) to be
100%. As we scale up, the productivity reaches the peak values
for all workloads at c3.xlarge. Figure 8(d) is based on 5M
operations. The message being conveyed is that YCSB shows
heavy memory-intensive database operations, and we can reach
the highest productivity at c3.xlarge instance.
(a) Throughput (b) Efficiency
(c) Productivity (d) Scalability for 5M memory writes
Figure 8. Scale-up performance of Yahoo! YCSB on EC2 over increasing workload from 100K to 5 M memory-access operations, where the same legend in Part (a) applies in all Parts. All instance types are specified in Table 3.
0
100
200
300
400
500
600
0 4 8 12 16 20 24 28 32
Thro
ugh
Pu
t (W
IPS)
Number of Instances
200
800
2400
4000
0
20
40
60
80
100
120
0 4 8 12 16 20 24 28 32
Qo
s(%
)
Number of Instances
0
0.2
0.4
0.6
0.8
1
1.2
0 4 8 12 16 20 24 28 32
Pro
du
ctiv
ity
Number of Instances
0
0.5
1
1.5
0
500
1000
0 4 8 12 16 20 24 28 32
Scal
abili
ty
# of Instances
From 1 From 4From 8 From 16
2,000
4,000
6,000
8,000
10,000
12,000
14,000
16,000
m1.large m1.xlarge m3.xlarge c3.xlarge c1.xlarge
Th
ro
ug
hp
ut
(op
s/se
c)
Instance type
0.1 M
1 M
5 M
0
50
100
150
200
m1.large m1.xlarge m3.xlarge c3.xlarge c1.xlarge
Pro
du
cti
vit
y(M
op
s/s/
$)
Instance type
0
0.5
1
1.5
2
2.5
3
m1.large m1.xlarge m3.xlarge c3.xlarge c1.xlarge
Sca
lab
ilit
y
Instance type
0
0.2
0.4
0.6
0.8
1
1.2
m1.large m1.xlarge m3.xlarge c3.xlarge c1.xlarge
Eff
icie
ncy
Instance type

1045-9219 (c) 2015 IEEE. Personal use is permitted, but republication/redistribution requires IEEE permission. Seehttp://www.ieee.org/publications_standards/publications/rights/index.html for more information.
This article has been accepted for publication in a future issue of this journal, but has not been fully edited. Content may change prior to final publication. Citationinformation: DOI 10.1109/TPDS.2015.2398438, IEEE Transactions on Parallel and Distributed Systems10 IEEE TPDS-2014-07-0595 R1
10
(B) TPC-W Scale-Up Performance
We run the TPC-W benchmark with various workloads on
5 instance types with increasing computing power as seen in
Table 3. The throughput increases with increasing workload in
Fig.9 except the 200-user curve is rather flat due to lack of
work for scaling up to more powerful nodes. In Fig.9.b, the
QoS for the 800-user curve is the low for smaller instance types
due to overloading them.The QoS increases quickly to 100%.
In Figs. 9(c), we scale up from 3 node types under the
workload of 800 users. Based on Eq.4, we plot the productivity
curves in Fig.10 (d). The low value for 800-user curve is caused
by its low QoS curve observed in Fig.10.b. All three curves
reach the peak with the use of m3.medium node. We observe
that with 800 or more users, the p-scalability reaches the peak
with the m1.medium instance. After that, using more powerful
nodes does not pay off. With even larger workload, say 4,000
users, the peak scalability may move further towards the right
with larger instance nodes.
Note that the TCP-W results plotted in Fig.9 have similar
patterns as those YCSB results plotted in Fig.7. However, they
do differ in magnitude and peak performances. The main reason
lies in different instance types used and different workloads
applied. The operations counted in YCSB differ from the user
count in TPC-W workload. They differ in about two orders in
magnitude.
(a) Throughput (b) Quality of service (QoS)
(c) Productivity (d) Scalability for 800 users
Figure 9. Scale-up performance of TPC-W benchmark on Amazon EC2 clouds of various instant types over increasing workloads from 200 to 4,000 users. Parts (a, b, c, e) apply the same legend and Parts (d, f) have the same legend.
7.3. Mixed Scale-Up and Scale-Out Performance
For mixed scaling, 4 cluster configurations are specified
along the x-axis in Fig.10. The leftmost cluster has 8 small
instances with a total ECU count of 8. The next has 4
medium and 4 small instances with 12 ECUs. The next one
has 3 large and 2 medium instances with 16 ECUs. The
right cluster has 3 xlarge and 2 large instances with a total
of 32 ECUs. Figure 10 reports the HI Bench Word Count
execution results.
Mixed strategy offers a wider range of ECU increase.
The monotonic increase in speed (Fig.10a) clearly supported
this claim. For small data sizes (1 or 5 GB), the productivity
(Fig.8b) also decreases with large cluster used. For very
large data set (10GB), the productivity drops to a minimum
point at the third large cluster and then increases again to a
higher value for the rightmost cluster applied.
(a). Speed (throughput) (b) Productivity
Figure 10: HI Bench Word Count performance results on 4 EC2 clusters with mixed scale-up and scale-out nodes.
0
50
100
150
Thro
ugh
Pu
t (W
IPS)
Instance Type
200 400
020406080
100120
Qo
s(%
) Instance type
00.20.40.60.8
11.21.4
Pro
du
ctiv
ity
Instance type
0
2
4
6
8
Scal
abili
ty
Instance type
0
10
20
30
40
50
m1.small(8) m1.medium(4)
and
m1.small(4)
m1.large(3) and
m1.medium(2)
m1.xlarge(3)
and m1.large(2)
Sp
eed
(M
B/s
ec)
Instance Type and Number
10GB 5GB 1GB
0
5
10
15
20
25
30
35
m1.small(8) m1.medium(4)
and m1.small(4)
m1.large(3) and
m1.medium(2)
m1.xlarge(3) and
m1.large(2)Pro
du
cti
vit
y (
MB
/sec
/$)
Instant Type and Number
10GB 5GB 1GB

1045-9219 (c) 2015 IEEE. Personal use is permitted, but republication/redistribution requires IEEE permission. Seehttp://www.ieee.org/publications_standards/publications/rights/index.html for more information.
This article has been accepted for publication in a future issue of this journal, but has not been fully edited. Content may change prior to final publication. Citationinformation: DOI 10.1109/TPDS.2015.2398438, IEEE Transactions on Parallel and Distributed SystemsHWANG, ET AL, CLOUD PERFORMANCE MODELING AND BENCHMARK EVALUATION OF ELASTIC SCALING STRATEGIES PAGE 13
11
7.4 Effects of Changing Benchmarks or Cloud Platforms
Applying the relative performance models in Eqs.11 and 12,
we compare three benchmark programs: HiBbench, YCSB and
BenchClouds and two cloud platforms: EC2 and Rackspace.
These comparative studies reveal the strength and weakness in
different benchmarks or cloud platforms.
(A). HI Bench vs. BenchCloud Results
Figure 11(a) compares the performance of three cloud
benchmarks in 6 dimensions. The polygon data points are
extracted and normalized from those in previous Figures.
YCSB applies the scale-up workload with a higher
throughput, productivity and scalability than the other two
benchmarks.
The HighBench and BenchClouds apply the Elastic
MapReduce resources with scale-out workload, they end up
with comparable performance and higher cost than using the
YCSB. HI Bench performs better in efficiency and e-
scalability due to scaling out from a few to larger number of
nodes. In general, we conclude that scaling-out should be
practiced when the elasticity is high and scaling-up is in favor
of using more powerful nodes with higher efficiency.
(B) TPC-W on EC2 vs. Rackspace Clouds
As plotted in Fig.11 (b), we run the same TCP-W
benchmark with 800 users on both EC2 and Rackspace
platforms. The data of EC2 is extracted from Fig.7. The
Rackspace data are performed under similar workload and
machine configurations. There is no performance difference in
WIPS rate and QoS.
(a) HI Bench and BenchCloud benchmark tested on EC2
(Data points are normalized from Figs.5 and 6)
(b). EC2 and Rackspace tested with TPC-W
Figure 11. Relative performance of compute clouds running
different benchmarks in (a) and the same benchmark in (b).
It is crucial to choose the proper set of performance
metrics in cloud benchmarking experiments. From Fig.2 and
Fig.10, we offered 5 different sets of performance metrics for
modeling the IaaS, PaaS, SaaS, hybrid and mashup cloud
configurations. Five benchmark programs are tested by which
YCSB was embedded as part of the CloudSuite. These
performance models can be modified to test other or new
cloud benchmark suites as well.
8. ELASTIC ANALYSIS OF SCALING PERFORMANCE
Scaling out, scaling-up and mixed strategies are evaluated
below. We compare their relative merits through executing two
benchmark programs, Sort and Wordcount in HI Bench suite,
on the AWS EC2 platform. The workload for these two
programs has 10 GB of data elements. We measure the HI
Bench performance of these two programs along six
performance dimensions: throughput, scalability, QoS,
productivity, costs and efficiency.
The QoS is mainly indicated by system availability
which was recorded 99.95% ~ 100% for all cluster
configurations. Cost wise for the Word Count, the scale-out
small cluster (solid polygons in Fig.12 (a, d) has the least
service costs. The scale-up clusters in Fig.12 (b, e) cost
more and the mixed cluster is the most expensive one to
implement. Mixed scaling demands lot more considerations
on tradeoffs between performance and cost incurred.
Speed wise, all mixed strategy for Sort (Fig.12c and
Fig.12 (e) have the fastest throughput (or speed). The Word
Count program shows slow throughput in all cases. The
scale-up cluster shows very high efficiency for Word Count.
The Sort clusters (dash-line polygons) show poor efficiency
and throughput except high throughput for the mixed mode
for sorting very large cluster in Fig.12 (f.)
In Fig.12a, we see higher productivity for the large
cluster (16 nodes) configuration. The peak values are
application-dependent. Different benchmarks may lead to
different conclusions. In general, scaling-out should be
practiced when the elasticity speed is high.
These performance maps are compared in Table 4 in
terms of their polygon area values. Under each scaling case,
we compare two cluster configurations. The polygon areas
reported in Fig.12 and Table 4 simply demonstrate a radar-
chart method to compare the relative performance of testing
various cluster configurations with a common benchmark.
Table 4 Performance Polygon Areas on Radar Charts in Fig.12
Scale-Out
Mode
(Figs.4a, d)
Cluster Config. 2 small nodes 16 small nodes
Word Count 34.53 46.85 Sort 17.02 23.65
Scale-Up
Mode
(Figs.4b, e)
Cluster Config. 2 medium
nodes
2 xlarge nodes
Word Count 37.25 31.42 Sort 41.84 21.22
Mixed
Scaling Mode
(Figs. 4c, f)
Cluster Config. 4 medium
and 4 small
3 large and
2 xlarge
Word Count 23.39 18.28 Sort 22.81 11.90
0
2.5
5Throughput(H)
e-Scalability(Φe )
p-Scalability(Φp)
Productivity(P)
Costs(Co)
Efficiency(E)
HiBench BenchClouds YCSB
0
2.5
5WIPS
e-Scalability
p-Scalability
Productivity
Efficiency
QoS
RackSpace BC2EC2

1045-9219 (c) 2015 IEEE. Personal use is permitted, but republication/redistribution requires IEEE permission. Seehttp://www.ieee.org/publications_standards/publications/rights/index.html for more information.
This article has been accepted for publication in a future issue of this journal, but has not been fully edited. Content may change prior to final publication. Citationinformation: DOI 10.1109/TPDS.2015.2398438, IEEE Transactions on Parallel and Distributed Systems12 IEEE TPDS-2014-07-0595 R1
12
(a) Word Count with scaling out (b) Word Count with scaling up (c) Word Count with mixed scaling out/up
(d) Sort with scaling out (e) Sort with scaling up (f) Sorting with mixed scaling out/up
Figure 12. The performance maps of two HI Bench programs on two EC2 cluster configurations for the scale-out, scale-up, and mixed scale-up/scale-out workloads over 10 GB of data elements.
In Table 5, we give a qualitative assessment of the 3
scaling techniques evaluated in HI Bench experiments on
various EC2 configurations. The assessment is based on those
quantitative measures reported in previous sections. We take a
macroscopic view of the reported numerical results to reach
some generalized observations on cloud performance under
various operating constraints.
Over all, we find that scaling-out is the easiest one to
implement on homogeneous clusters. The elasticity overhead is
also lower in these cluster configurations. Scaling up is more
complex to implement than scaling out due to the switching of
node types. This will reduce the elasticity speed and prolong
the reconfiguration overhead. The mixed scaling is the most
difficult one to implement but offers the best flexibility to
match with the workload change.
Table 5: Assessment of Three Scaling Techniques based on HI Bench Benchmarking Findings on The EC2
Impact
Factors
Scale-Out
Technique
Scale-Up
Technique
Mixed Scaling
Technique
Elasticity
speed, scaling
complexity and
overhead
Fast elasticity, possibly
supported by auto-scaling and
heuristics
High overhead to reconfigure and
cannot support auto scaling
Most difficult to scale with wide
range of machine instances
Effects on
performance,
efficiency, and
scalability
Expect scalable performance if
the application can exploit
parallelism
Switching among heterogeneous
nodes may reduce scalability
Flexible app , low efficiency,
and resource utilization
QoS, costs,
fault recovery,
and cloud
productivity
Cost the least, Easy to recover,
Incremental
productivity
More cost-effective, but
Reduced QoS may
weaken the productivity
High costs, difficult to
recover, expect
the highest productivity
8. CONCLUSIONS AND SUGGESTIONS
In general, the higher efficiency promotes the
productivity, but the converse may not hold, necessarily. The QoS is based on user’s objective. Different users may set their own satisfaction threshold for the QoS they can accept. The efficiency is controlled by the providers considering the interest of all user interests at the same time. We summarize below our major research
findings from the comprehensive cloud benchmark
experiments performed in 2014. Then, we suggest a few
directions for further R/D in promoting cloud computing
applications.
8.1 Summary of Benchmarking Findings
Over all, we find that scaling-out is the easiest one to
implement on homogeneous clusters. The elasticity overhead is
also lower in these cluster configurations. Scaling up is more
complex to implement than scaling out due to the switching of
node types. This will reduce the elasticity speed and prolong
the reconfiguration overhead. The mixed scaling is the most
difficult one to implement but offers the best flexibility to
match with the workload change. Our research contributions
are summarized below in 5 technical aspects:
(1). New performance metrics and benchmarking models are
proposed and tested in cloud benchmark experiments. We
study the scalability performances driven by efficiency and
productivity, separately. This approach appeals to different
user groups with diversified performance demands.
(2). Sustained performance of clouds comes mainly from fast
elastic resources provisioning to match with the workload
variation. Scaling-out should be practiced when the
elasticity is high, Scaling-up is in favor of using more
powerful nodes with higher efficiency and productivity.
(3). To achieve productive services, both scale-up and scale-out
schemes could be practiced. Scale-out reconfiguration has
lower overhead to implement than those experienced in
scaly-up experiments. The elasticity speed plays a vital role
0
2.5
5Throughput
Scalability
QoS
Productivity
Costs
Efficiency
2 m1.small instances
16 m1.small instances
0
2.5
5Throughput
Scalability
QoS
Productivity
Costs
Efficiency
2 m1.medium instances2 m1.xlarge instances
0
2.5
5Throughput
Scalability
QoS
Productivity
Costs
Efficiency
4 m1.medium and 4 m1.small instances
3 m1.large and 2 m1.xlarge instances
0
2.5
5Throughput
Scalability
QoS
Productivity
Costs
Efficiency
2 m1.small instances
16 m1.small instances
0
2.5
5Throughput
Scalability
QoS
Productivity
Costs
Efficiency
2 m1.medium instances2 m1.xlarge instances
0
2.5
5Throughput
Scalability
QoS
Productivity
Costs
Efficiency
4 m1.medium and 4 m1.small instances3 m1.large and 2 m1.xlarge instances
1045-9219 (c) 2015 IEEE. Personal use is permitted, but republication/redistribution requires IEEE permission. Seehttp://www.ieee.org/publications_standards/publications/rights/index.html for more information.
This article has been accepted for publication in a future issue of this journal, but has not been fully edited. Content may change prior to final publication. Citationinformation: DOI 10.1109/TPDS.2015.2398438, IEEE Transactions on Parallel and Distributed SystemsHWANG, ET AL, CLOUD PERFORMANCE MODELING AND BENCHMARK EVALUATION OF ELASTIC SCALING STRATEGIES PAGE 13
13
in minimizing the over-provisioning or under-provisioning
gaps of resources.
(4). we reveal high scale-out performance in HI Bench and
BenchClouds experiments. On the other hand, we show
that scaling up is more cost-effective with higher
productivity and p-scalability in YCSB and TPC-W
experiments. These findings may be useful to predict other
benchmark performance if they attempt to scale out or
scale-up with similar cloud setting and workload.
(5). The cloud productivity is greatly attributed to system
elasticity, efficiency, and scalability driven by
performance. The cloud providers must enforce
performance isolation for quota-abiding users at the
8.2 Suggestions for Further Work
Three suggestions are made below for further work. The
ultimate goal is to generate commonly accepted cloud
benchmarks and testing techniques. These tasks are naturally
extendable from the work reported in this paper.
(6) Other cloud benchmarks: CloudStone [36] CloudCmp [27],
and C-meter [38], could be also tested with the new
performance models presented. Future benchmarks are
encouraged to evaluate PaaS and SaaS clouds.
(7). To make clouds universally acceptable, we encourage
cloud researchers and developers to work jointly in
developing a set of application-specific benchmarks for
important cloud and big-data application domains.
(8). The cloud community is short of benchmarks to test cloud
capability in big-data analytics and machine learning
intelligence. This area is widely open, waiting for major
research/development challenges.
ACKNOWLEDGEMENTS:
The research reported here was supported in parts by National
Basic Research (973) Program of China under Grant
No.2011CB302505, National High-Tech Research and
Development (863) Program of China under Grant
No.2012AA012600, National Science Foundation of China under
Grant No.61073003. Kai Hwang wants to acknowledge the
subsequent funding supports of his academic visits to THU from
the EMC Co. and Intellectual Ventures Inc. since 2009.
REFERENCES
[1] Appuswamy, R., et al, “Scale-Up vs Scale-Out for Hadoop:
Time to Rethink”, Proc.. of ACM SoCC’13, Santa Clara,
Oct.2013
[2] Bai, X., Wang, Y., Dai, G., Tsai, W. T. & Chen, Y., “A
Framework for Contract-based Collaborative Verification and
Validation of Web services”, in Component-Based Software
Engineering , Springer, 2007.
[3] Binnig, C., Kossmann, D., Kraska, T., and Loesing, S. (2009,
June). How is the weather tomorrow?: towards a benchmark
for the cloud. ACM Second Int’l Workshop on Testing
Database Systems, June 2009.
[4] Bitcurrent, Inc., Cloud Computing Performance Report,
http://www.bitcurrent.com, 2010.
[5] Bondi, A. , “Characteristics of Scalability and their Impact on
Performance”, Proc. of the 2nd Inte’l Workshop on Software
and Performance, 2000..
[6] Buyya, R., Yeo, C. S., Venugopal, S., Broberg, J., & Brandic,
I. (2009). Cloud computing and emerging IT platforms:
Vision, Hype, and Reality for delivering computing as the 5th
utility. Future Generation computer systems, 25(6), 599-616.
[7] J. Cao, K. Hwang, K. Li, and A. Zomaya, "Optimal
Multiserver Configuration for Profit Maximization in Cloud
Computing", IEEE Trans. Parallel ,and Distributed Systems,
Special issue on Cloud Computing, Vol. 24, No.6, June 2013
[8] Chen, G., Bai, X., Huang, X., Li, M. and L. Zhou, L.
“Evaluating Services on the Cloud Using Ontology QoS
Model,” Proc. IEEE Int’l Symp. on Service Oriented System
Engineering, 2011.
[9] Chen, Y., Ganapathi, A., Griffith, R., & Katz, R. , “The Case
for Evaluating MapReduce Performance using Workload
suites. IEEE Int,l Symp. on Modeling, Analysis & Simulation
of Computer and Telecom Systems (MASCOTS), 2011.
[10] CloudHarmony, “Benchmark Evaluation of 114 Public
Clouds”, http://cloudharmony.com/clouds, 2014
[11] Cooper, B., Silberstein, A., Tam, E., Ramakrishnan, R., and
Sears, R., “Benchmarking Cloud Serving Systems with
YCSB”, Proc. of the 1st ACM symp. on Cloud computing,
2010, pp.143-154.
[12] Dongarra, J. Martin, J. and Worlton, “Computer
Nenchmarking: Paths and Pitfalls”, IEEE Spectrum, Julu
1986.
[13] Farber M. and Kounev, S., “Existing Cloud Benchmark
Efforts and Proposed Next Steps”, Slide Presentation,
Karlsruhe Institute for Technology (KIT), Aug.31, 2011.
[14] Ferdman, M., et al, “Clearing The Clouds: A Study of
Emerging Scale-Out Workloads on Modern Hardware”, The
ACM 17th Int’l Conf. on Architectural Support for
Programming Languages and Operating System (ASPLOS),
London, UK, March 2012.
[15] E. Folkerts, A. Alexander, K. Sacks, A. Iosup, Markl, and
Tosun, C. “Benchmarking in The Cloud: What It Should, Can
and Cannot Be”, The 4th TPC Technology Conf. on
Performance Evaluateion and Benchmarking, Istanbul,
Turkey, August 2012.
[16] Gao, J., Bai, X., and Tsai, W. T., “Cloud-Testing: Issues,
Challenges, Needs and Practice”, Int’l Journal Software
Engineering: 2011.
[17] Gupta, A.and Kumar, V. “Performance Properties of Large
Scale Parallel Systems”, Proc. of the 26th Hawaii
International Conference on System Sciences, 1993
[18] Herbst, N. Kounev, S. and Reussner, R., “Elasticity in Cloud
Computing: What It Is, and What It Is Not”, Inte’l Conf. on
Autonomic Computing (ICAC 2013), San Jose, June 2013.
[19] Hill, M. “What is Scalability ?”, ACM SIGARCH Computer
Architecture News, 1990.
[20] Huang, S., Huang, J., Dai, J., and Xie, T., and Hong, B., “The
HI Bench Benchmark Suite: Characterization of The
MapReduce-based Data Analysis, Int’l Conf. on Data
Engineering Workshops, March 2010.
[21] Hwang, K., Fox, G. and Dongarra, J, Distributed and Cloud
Computing, Morgan Kaufmann Publisher, 2012.
[22] Hwang, K. and Xu, Z. Scalable Parallel Computing, Chapter
2 on Performance Benchmarking, McGraw-Hill, 1998.
[23] Hwang, K. Yue Shi and X, Bai, “Scale-Out and Scale-Up
Techniques for Cloud Performance and Produtivity”, IEEE
Cloud Computing Science, Technology and Applications
(CloudCom 2014) , Workshop on Emerging Issues in Clouds,
Singapore, Dec. 18, 2014.
[24] Iosup, A., Ostermann, S., Yigitbasi, M., Prodan, R., Fahringer,
T., and Epema, D. 2011. Performance Analysis of Cloud
Computing Services for Many-Tasks Scientific Computing.
IEEE Trans. on Parallel and Distributed Systems 2011.
[25] Krebs, R. Momm, C. and Knounev, S., “Metrics and
Techniques for Quantifying Performance Isolation in Cloud
Environments, ACM QoSA’12, Bertino, Italy, June 2012.
1045-9219 (c) 2015 IEEE. Personal use is permitted, but republication/redistribution requires IEEE permission. Seehttp://www.ieee.org/publications_standards/publications/rights/index.html for more information.
This article has been accepted for publication in a future issue of this journal, but has not been fully edited. Content may change prior to final publication. Citationinformation: DOI 10.1109/TPDS.2015.2398438, IEEE Transactions on Parallel and Distributed Systems14 IEEE TPDS-2014-07-0595 R1
14
[26] Li, A., Yang, X., Kandula, S., and Zhang, M., “CloudCmp:
Comparing Public Cloud Providers”, Proc. of the 10th
Annual Conference on Internet Measurement. Nov. 2010.
[27] Li, Z., O'Brien, L., Zhang, H., and Cai, R., “On a Catalogue
of Metrics for Evaluating Commercial Cloud Services.
ACM/IEEE 13th Int’l Conf. on Grid Computing, Sept. 2012.
[28] Mell, P. and Grance, T. “The NIST Definition of Cloud
Computing”, NIST special pub. 800(145), July 2011
[29] Michael, M., Moreira, J., Shiloach, D., and Wisniewski, R.
“Scale-up x Scale-out : A Case Study using Nutch/Luene”,
IEEE Int’l Parallel and Distri. Proc. Symp. March 26, 2007.
[30] Ostermann, S., Iosup, A., Yigitbasi, N., Prodan, R. Fahringer,
T. and. Epema, D., “A Performance Analysis of EC2 Cloud
Computing Services for Scientific Computing,” Proc. Int’l
Conf. on Cloud Computing, Springer 2010.
[31] Pham, C. “QoS for Cloud Computing”, Slide presentation,
Univ. of Pau, France, May 10, 2011.
[32] Plummer, D., et al,”Five Refining Attributes of Public and
Private Cloud Computing”, Gartner Research, 2009.
http:www.gartner.com/DisplayDocument?doc-cd=167182.
[33] Sharma, U. Shenoy, P., Sahu, S. and Shaikh,A. "A Cost-
Aware Elasticity Provisioning System for the Cloud," IEEE
Int’l Conf. on Distributed Comp. Systems, June, 2011.
[34] Smith, W., “TCP-W: Benchmarking : An E-commerce
Solution”, Intel, 2005.
[35] Sobel, W., Subramanyam, S., Sucharitakul, A., Nguyen, J.,
Wong, H., Patil, and Patterson, D. “Cloudstone: Multi-
platform, Multi-language Benchmark and Measurement
Tools for Web 2.0”, Proc. of First Workshop on Cloud
Computing and App., Oct. 2008.
[36] Tsai, W., Huang, Y., and Shao, Q., “Testing the scalability of
SaaS applications. IEEE Int’l Conf. on Service-Oriented
Computing and Applications”, 2011.
[37] Yigitbasi, N., Iosup, A., Epema, D., and Ostermann, S. “ C-
Meter: A Framework for Performance Analysis of
Computing Clouds”, IEEE/ACM Proc. of 9th Int’l Symp. on
Cluster Computing and the Grid, (CCGrid). 2009.
Kai Hwang is a Professor of EECS
at the University of Southern
California. Presently, he is also an
EMC-endowed visiting Chair
Professor at Tsinghua University,
China. He earned the Ph.D. degree
from UC Berkeley. An IEEE Life
Fellow, he has published
extensively in the areas of
computer architecture, parallel
processing, network security, P2P
and cloud computing. Goolgle
scholars cited his works more than
14,000 times with an h-index of 50.
Contact him via Email:
Xiaoying Bai is an Associate
Professor of Computer Science and
Technology at Tsinghua University,
China. She received the Ph.D. in
Computer Science from Arizona
State University. She specializes in
software engineering, web services
and cloud computing. Dr. Bai has
published 90 research papers. She
can be reached via:
Yue Shi is a PhD student of
Electrical Engineering at the
University of Southern California.
She received the B.S from
Huazhong Univ. of Science and
Technology in China and M.S.
degree at USC. She is interested in
big data analytics, mobile and cloud
systems, social networks and
mashup applications. She can be
reached by: [email protected].
Muyang Li is currently a graduate
student at Tsinghua University
working toward M.S. degree in
Computer Science. He received his
B.S. degree in Computer Science
and Technology from Tsinghua
University in 2013. He can be
reached by Email:
Wen-Guang Chen is a Professor of
Computer Science and Technology
at Tsinghua University, where he
received the B.S. and Ph.D. degrees
in computer science in 1995 and
2000 respectively. His research
interest is in parallel and distributed
computing, programming model,
cloud computing, and performance
evaluation. Contact him via:
Yongwei WU received PhD degree
from Chinese Academy of Sciences
in 2002. Presently, he is a Professor
in Computer Science and
Technology at Tsinghua University,
China. His research interests
include parallel and distributed
processing, and cloud storage. An
IEEE member, he can be reached
via Email: [email protected].