Embed Size (px)
Citation preview
Clustering Heterogeneous Samples During Model Selection
Kathleen Gates, Ph.D.Assistant Professor
L.L. Thurstone Psychometric LabDepartment of Psychology
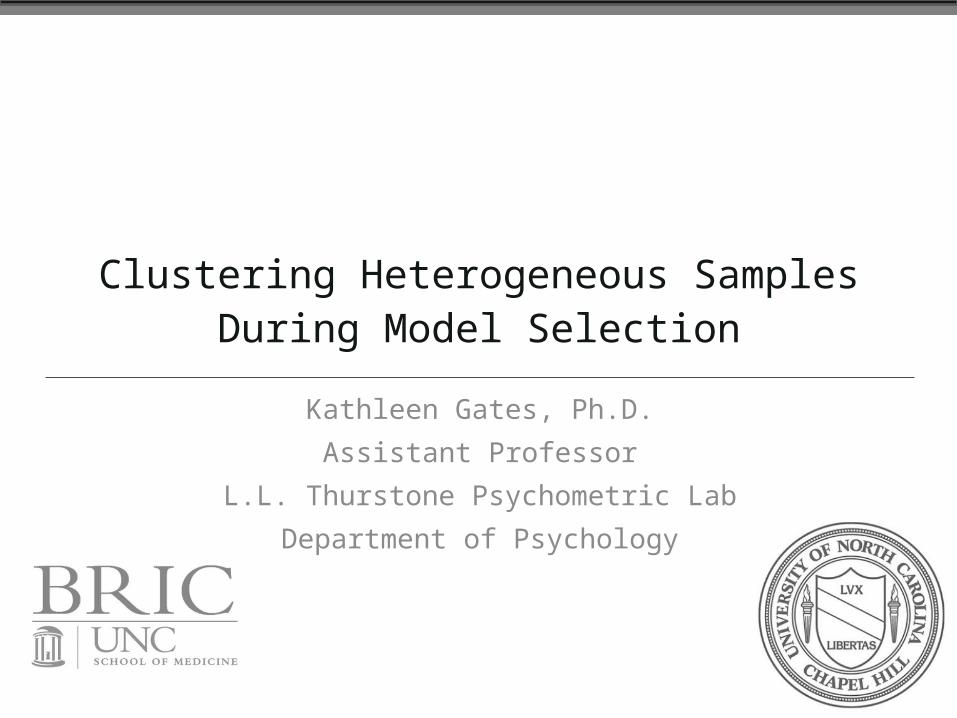
Research Group
Stephanie Lane, M.A.
Teague Henry, B.S.
Zachary Fisher, M.S.
• Heterogeneity in functional MRI Data• Group Iterative Multiple Model Estimation (GIMME)• Subgrouping within GIMME
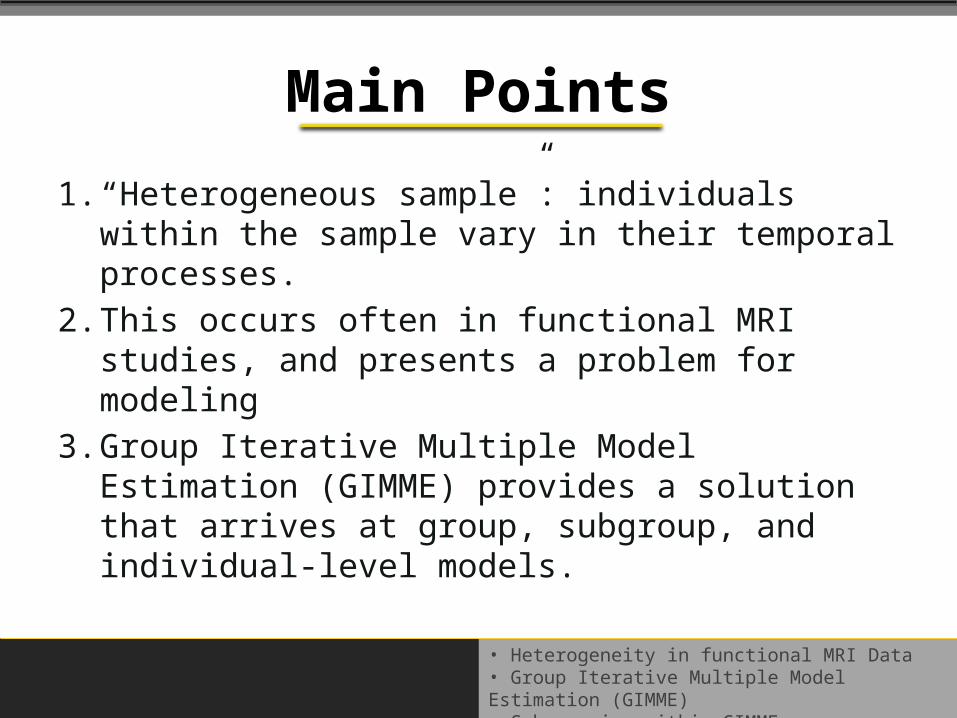
Main Points
1. “Heterogeneous sample”: individuals within the sample vary in their temporal processes.
2. This occurs often in functional MRI studies, and presents a problem for modeling
3. Group Iterative Multiple Model Estimation (GIMME) provides a solution that arrives at group, subgroup, and individual-level models.
• Heterogeneity in functional MRI Data• Group Iterative Multiple Model Estimation (GIMME)• Subgrouping within GIMME
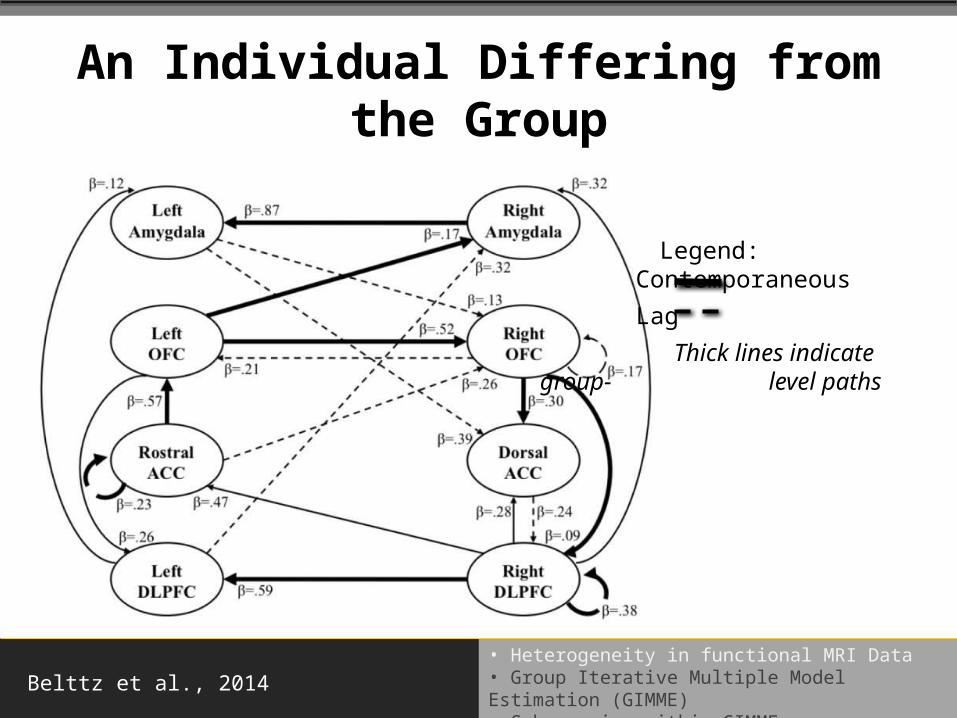
An Individual Differing from the Group
Belttz et al., 2014
Legend:
Contemporaneous
Lag
Thick lines indicate group- level paths
• Heterogeneity in functional MRI Data• Group Iterative Multiple Model Estimation (GIMME)• Subgrouping within GIMME
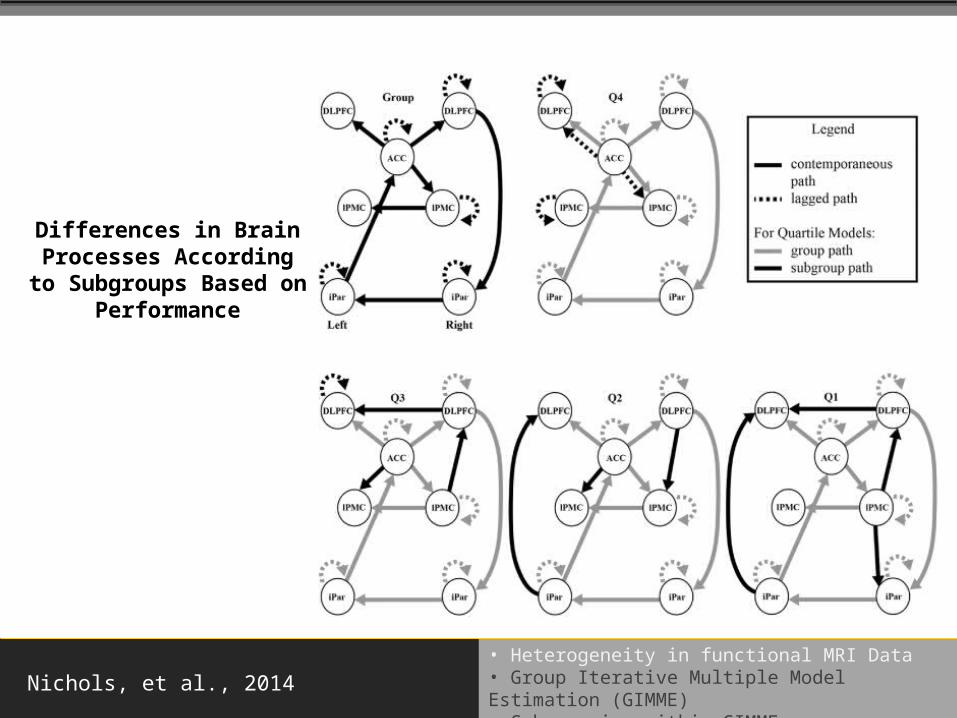
Differences in Brain Processes According to Subgroups Based
on Performance
Nichols, et al., 2014
• Heterogeneity in functional MRI Data• Group Iterative Multiple Model Estimation (GIMME)• Subgrouping within GIMME
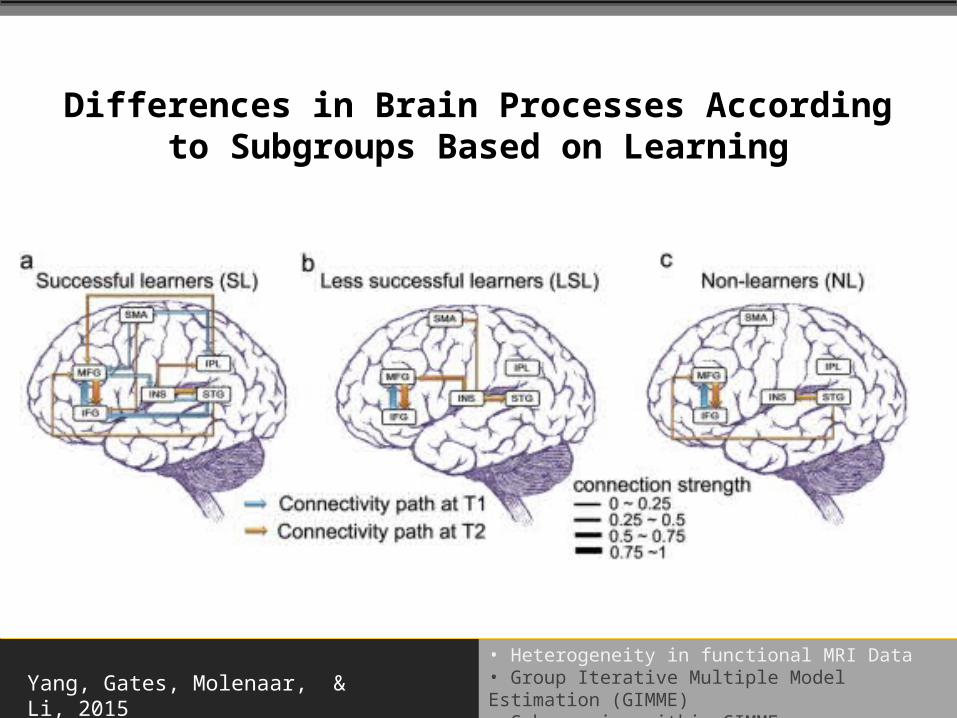
Differences in Brain Processes According to Subgroups Based on Learning
Yang, Gates, Molenaar, & Li, 2015
• Heterogeneity in functional MRI Data• Group Iterative Multiple Model Estimation (GIMME)• Subgrouping within GIMME
Problem: We don’t always know the best “subgroup” for individuals
• Biologically, some individuals may be more similar to individuals that are in a different subgroup than the one in which they were arbitrarily placed.
• There is often heterogeneity within groups (such as ADHD or ASD diagnoses; Fair et al., 2013; Volkmar et al., 2011), suggesting there may be subgroups within these populations.
• Heterogeneity in functional MRI Data• Group Iterative Multiple Model Estimation (GIMME)• Subgrouping within GIMME
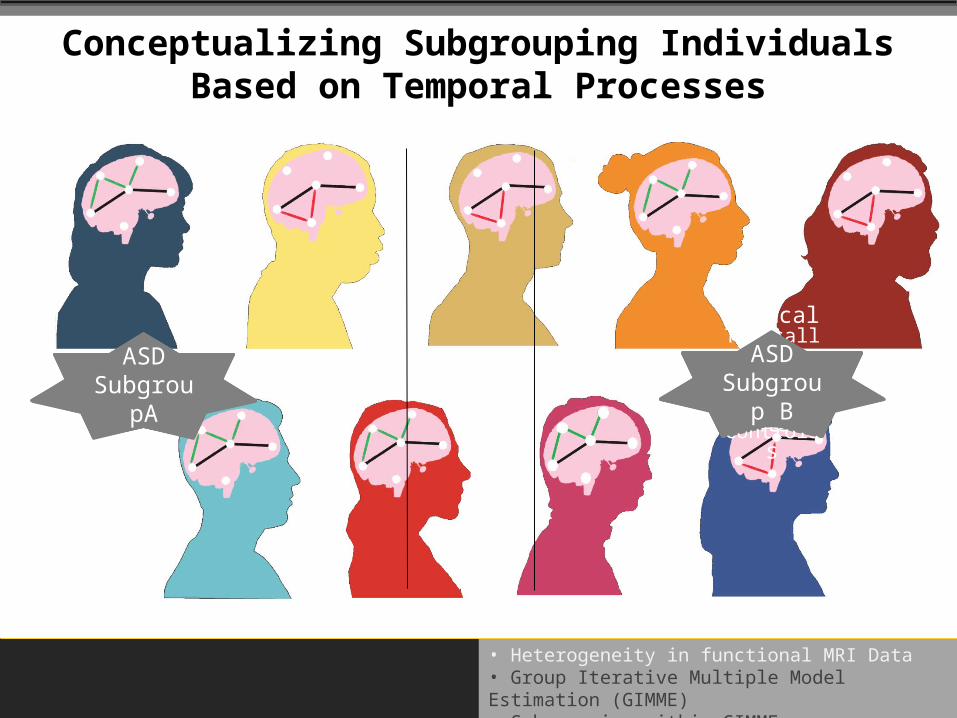
Female MaleADHD
Typically Developi
ng Controls
ASDTypically
Developing Controls
ASD Subgrou
p B
ASD Subgrou
pA
Conceptualizing Subgrouping Individuals Based on Temporal Processes
• Heterogeneity in functional MRI Data• Group Iterative Multiple Model Estimation (GIMME)• Subgrouping within GIMME
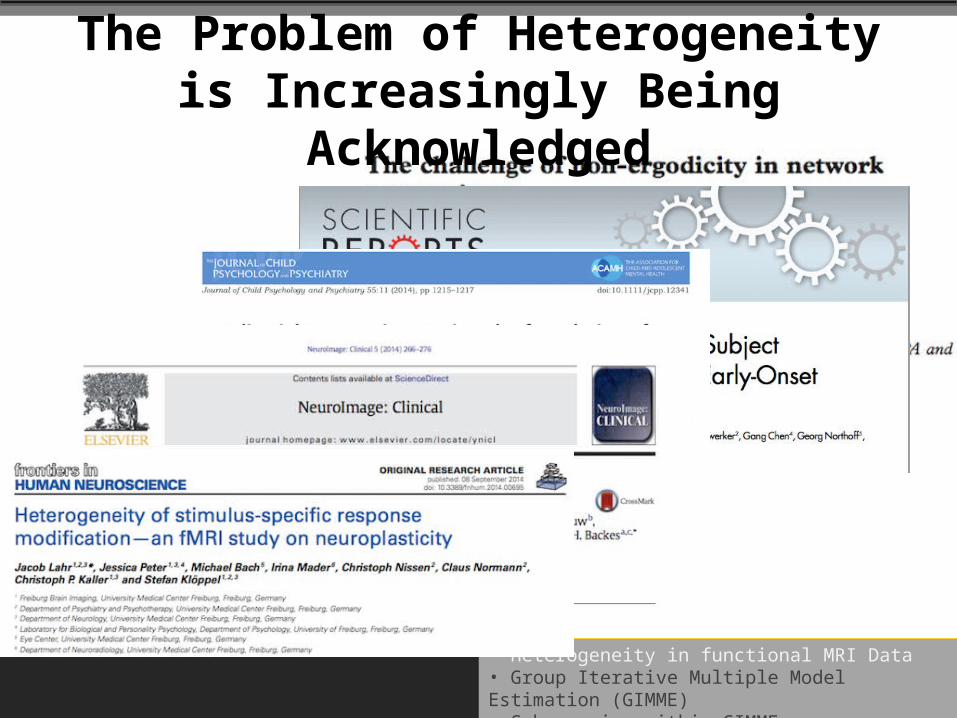
The Problem of Heterogeneity is Increasingly Being
Acknowledged
• Heterogeneity in functional MRI Data• Group Iterative Multiple Model Estimation (GIMME)• Subgrouping within GIMME
How could identifying subgroups in a data-driven manner be helpful?
• Subgrouping individuals according to their brain processes is complementary to using arbitrarily predefined groups and thus can be a validity check.
• Researchers could identify biological underpinnings related to specific behaviors within a heterogeneous sample.
• Heterogeneity in functional MRI Data• Group Iterative Multiple Model Estimation (GIMME)• Subgrouping within GIMME
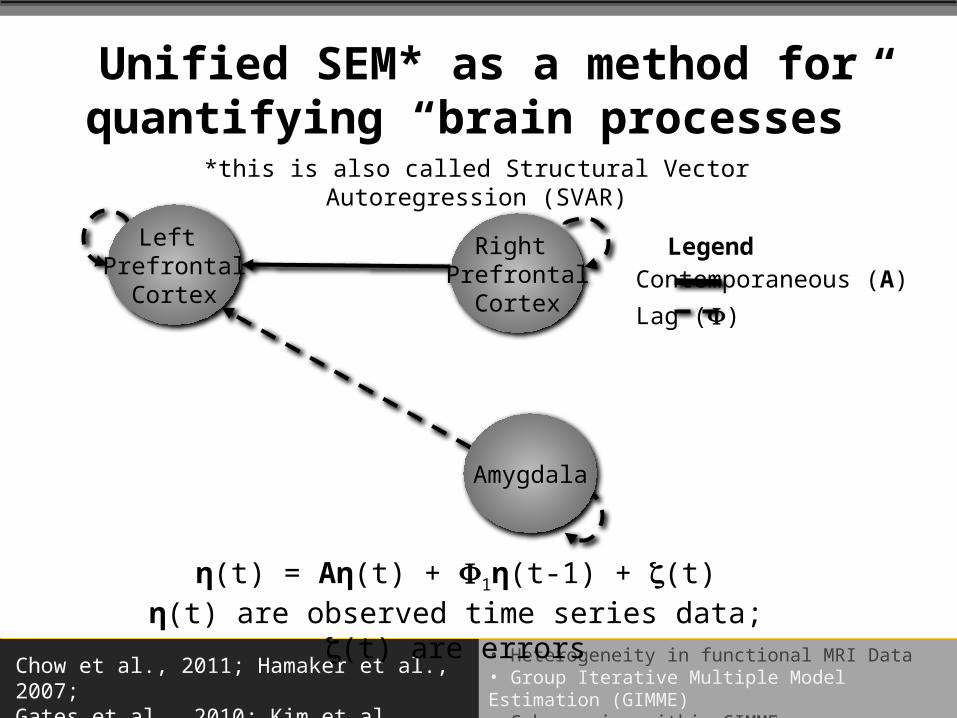
Unified SEM* as a method for quantifying “brain processes”
Chow et al., 2011; Hamaker et al., 2007; Gates et al., 2010; Kim et al., 2007
Contemporaneous (A)
Lag ()
LegendLeft Prefrontal
Cortex
Right Prefrontal
Cortex
Amygdala
η(t) = Aη(t) + 1η(t-1) + (t)η(t) are observed time series data; (t) are
errors
*this is also called Structural Vector Autoregression (SVAR)
• Heterogeneity in functional MRI Data• Group Iterative Multiple Model Estimation (GIMME)• Subgrouping within GIMME
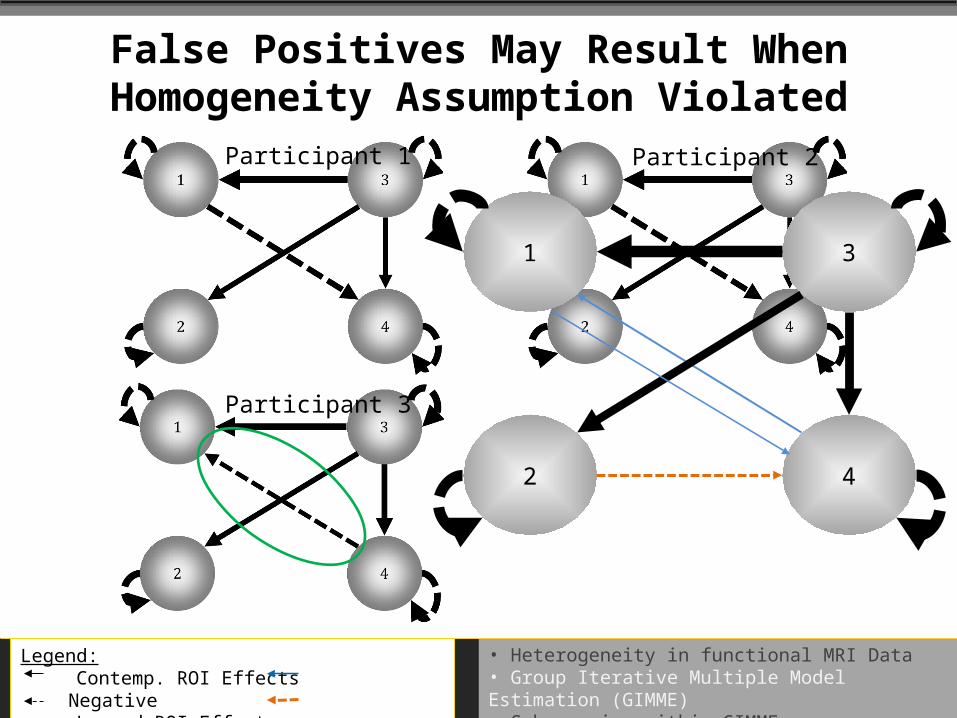
False Positives May Result When Homogeneity Assumption Violated
Legend: Contemp. ROI Effects
Negative Lagged ROI Effects
False Positive
1 3
2 4
Participant 1 Participant 2
Participant 3
• Heterogeneity in functional MRI Data• Group Iterative Multiple Model Estimation (GIMME)• Subgrouping within GIMME
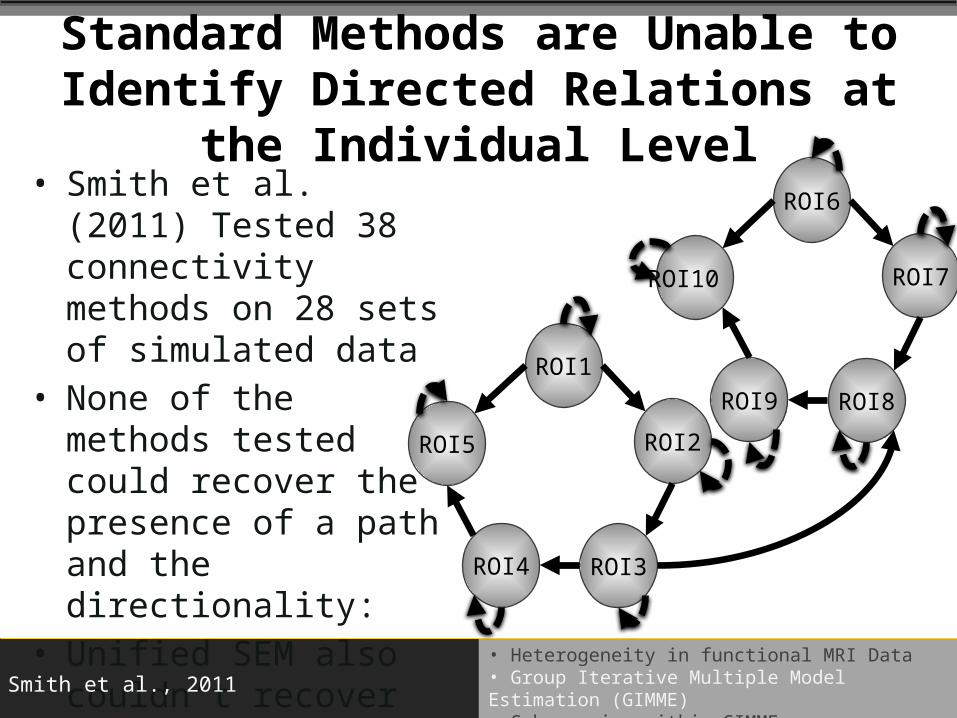
Standard Methods are Unable to Identify Directed Relations
at the Individual Level• Smith et al. (2011)
Tested 38 connectivity methods on 28 sets of simulated data
• None of the methods tested could recover the presence of a path and the directionality:
• Unified SEM also couldn’t recover the direction, nor could LiNGAM, GES, or PC.
ROI6
ROI8
ROI7
ROI9
ROI10
ROI1
ROI3
ROI2
ROI4
ROI5
Smith et al., 2011
• Heterogeneity in functional MRI Data• Group Iterative Multiple Model Estimation (GIMME)• Subgrouping within GIMME
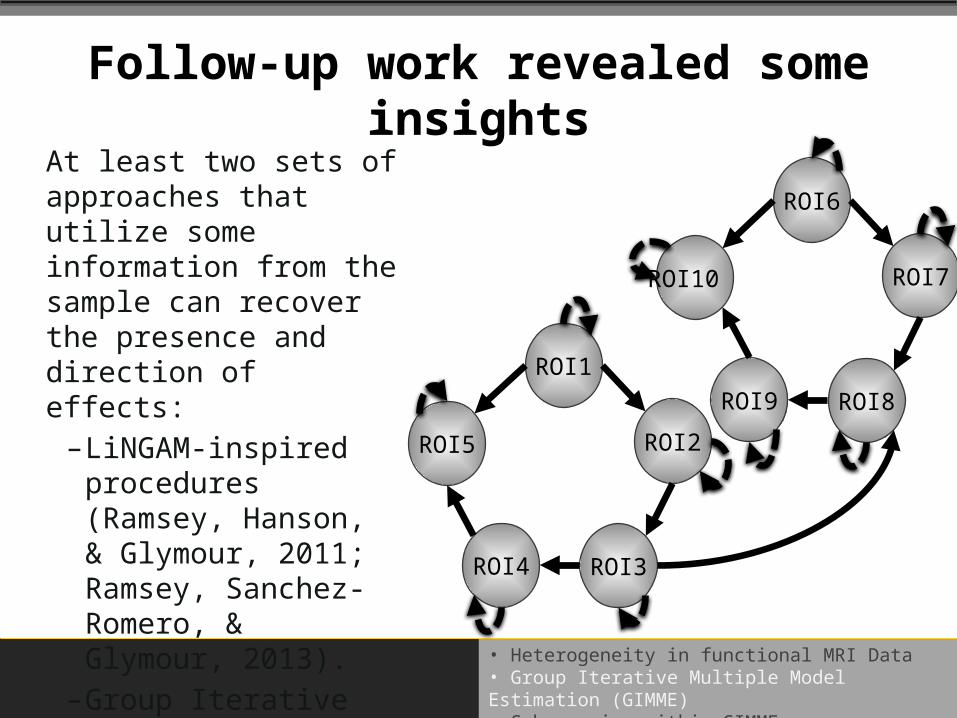
Follow-up work revealed some insights
At least two sets of approaches that utilize some information from the sample can recover the presence and direction of effects:–LiNGAM-inspired
procedures (Ramsey, Hanson, & Glymour, 2011; Ramsey, Sanchez-Romero, & Glymour, 2013).–Group Iterative
Multiple Model Estimation (GIMME; Gates & Molenaar, 2012).
ROI6
ROI8
ROI7
ROI9
ROI10
ROI1
ROI3
ROI2
ROI4
ROI5
• Heterogeneity in functional MRI Data• Group Iterative Multiple Model Estimation (GIMME)• Subgrouping within GIMME
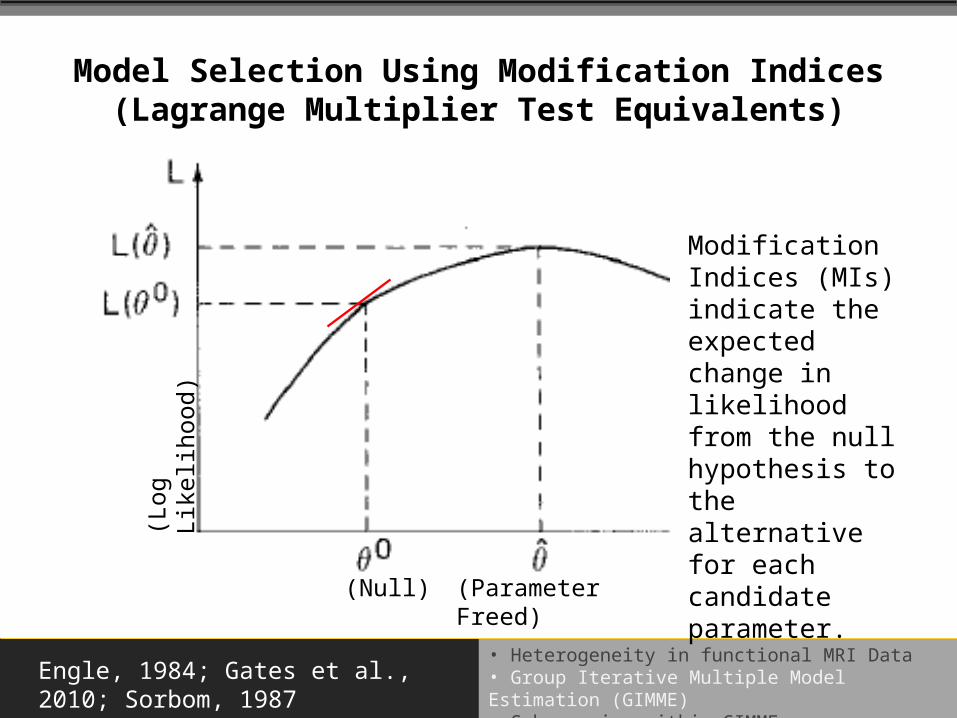
Model Selection Using Modification Indices (Lagrange Multiplier Test Equivalents)
Engle, 1984; Gates et al., 2010; Sorbom, 1987
(Log
Like
lihood)
(Null) (Parameter Freed)
Modification Indices (MIs) indicate the expected change in likelihood from the null hypothesis to the alternative for each candidate parameter.
• Heterogeneity in functional MRI Data• Group Iterative Multiple Model Estimation (GIMME)• Subgrouping within GIMME
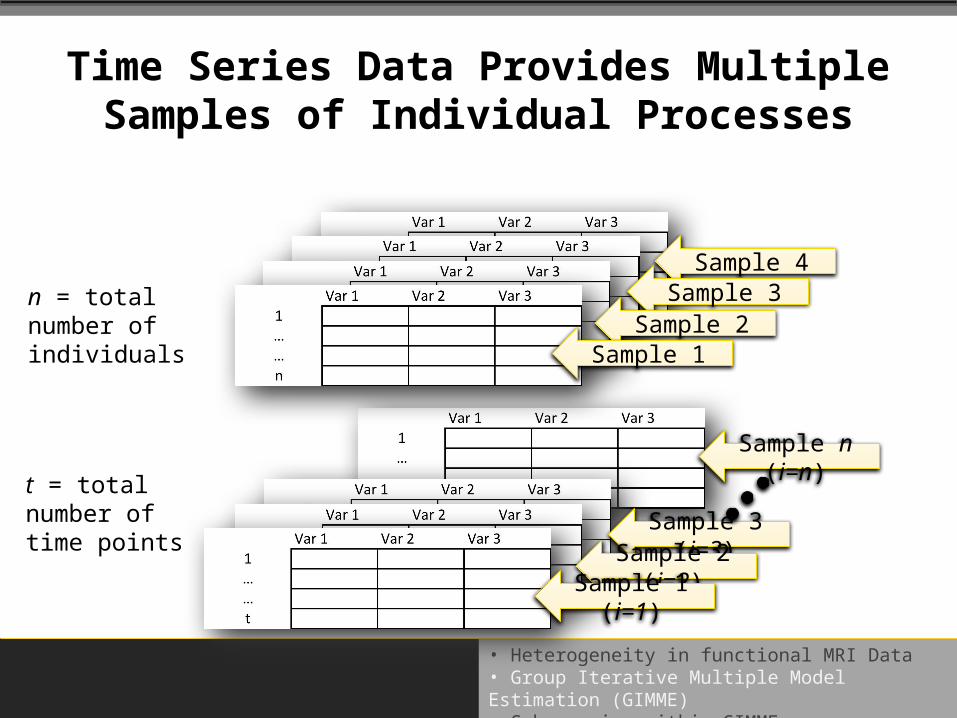
Time Series Data Provides Multiple Samples of Individual Processes
Sample 4Sample 3
Sample 2Sample 1
Sample n (i=n)
Sample 3 (i=3)Sample 2
(i=2)Sample 1 (i=1)
n = total number of individuals
t = total number of time points
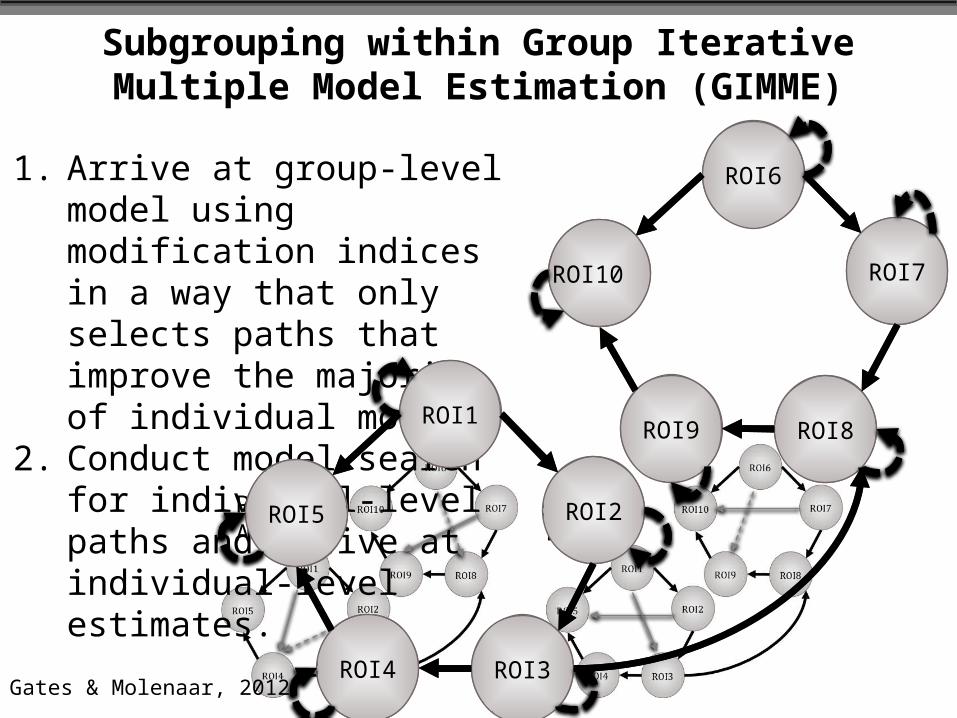
Subgrouping within Group Iterative Multiple Model Estimation (GIMME)
1. Arrive at group-level model using modification indices in a way that only selects paths that improve the majority of individual models.
2. Conduct model search for individual-level paths and arrive at individual-level estimates. 17/18
Person A
Person B
ROI6
ROI8
ROI7
ROI9
ROI10
ROI1
ROI3
ROI2
ROI4
ROI5
ROI6
ROI8
ROI7
ROI9
ROI10
ROI1
ROI3
ROI2
ROI4
ROI5
Gates & Molenaar, 2012
• Heterogeneity in functional MRI Data• Group Iterative Multiple Model Estimation (GIMME)• Subgrouping within GIMME
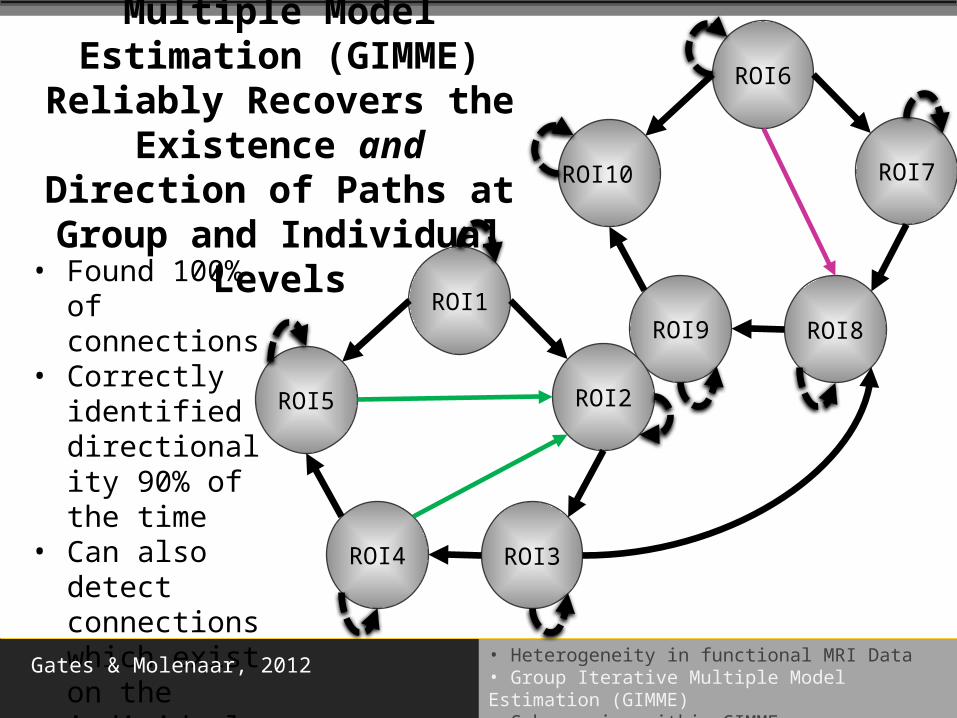
Group Iterative Multiple Model
Estimation (GIMME) Reliably Recovers the
Existence and Direction of Paths at Group and Individual
Levels
ROI6
ROI8
ROI7
ROI9
ROI10
ROI1
ROI3
ROI2
ROI4
ROI5
• Found 100% of connections
• Correctly identified directionality 90% of the time
• Can also detect connections which exist on the individual level
Gates & Molenaar, 2012
• Heterogeneity in functional MRI Data• Group Iterative Multiple Model Estimation (GIMME)• Subgrouping within GIMME
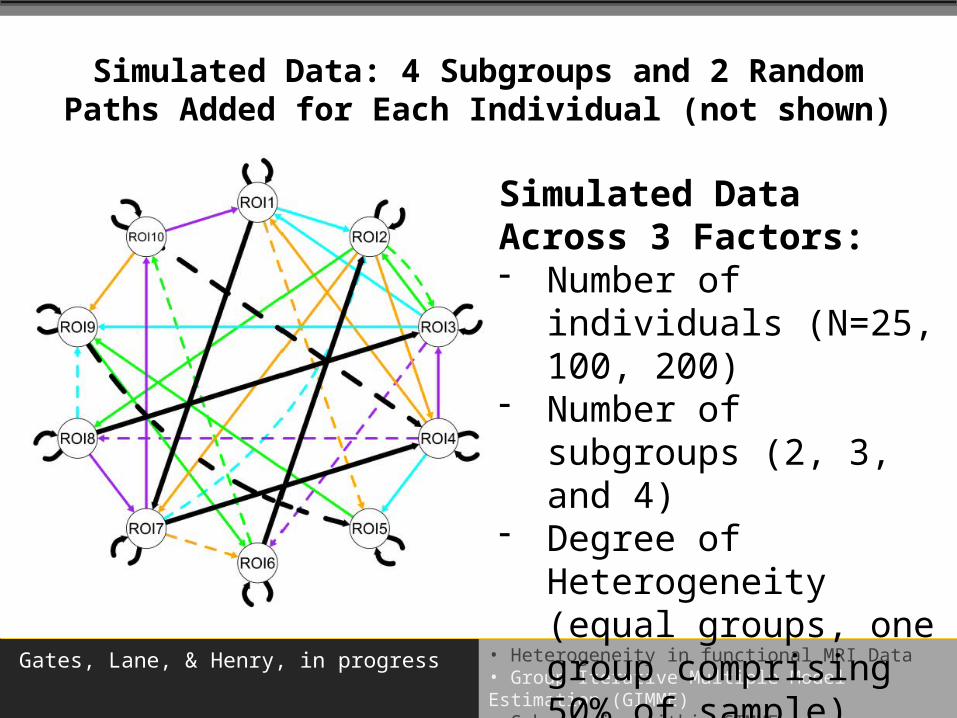
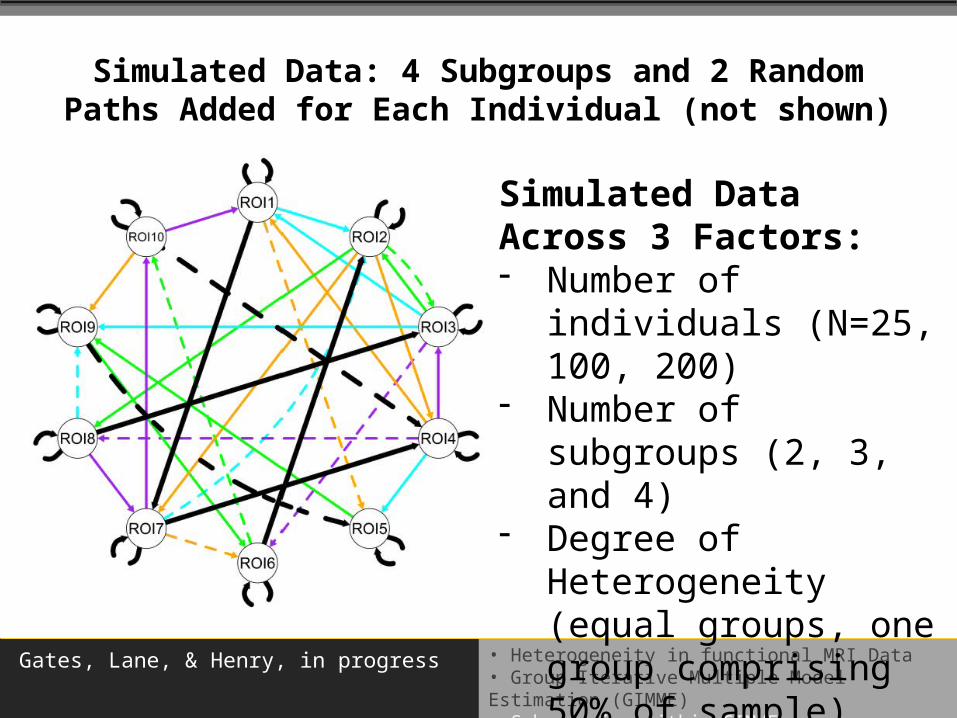
Simulated Data: 4 Subgroups and 2 Random Paths Added for Each Individual (not shown)
Simulated Data Across 3 Factors:- Number of individuals
(N=25, 100, 200)- Number of subgroups
(2, 3, and 4)- Degree of
Heterogeneity (equal groups, one group comprising 50% of sample)
Gates, Lane, & Henry, in progress
• Heterogeneity in functional MRI Data• Group Iterative Multiple Model Estimation (GIMME)• Subgrouping within GIMME
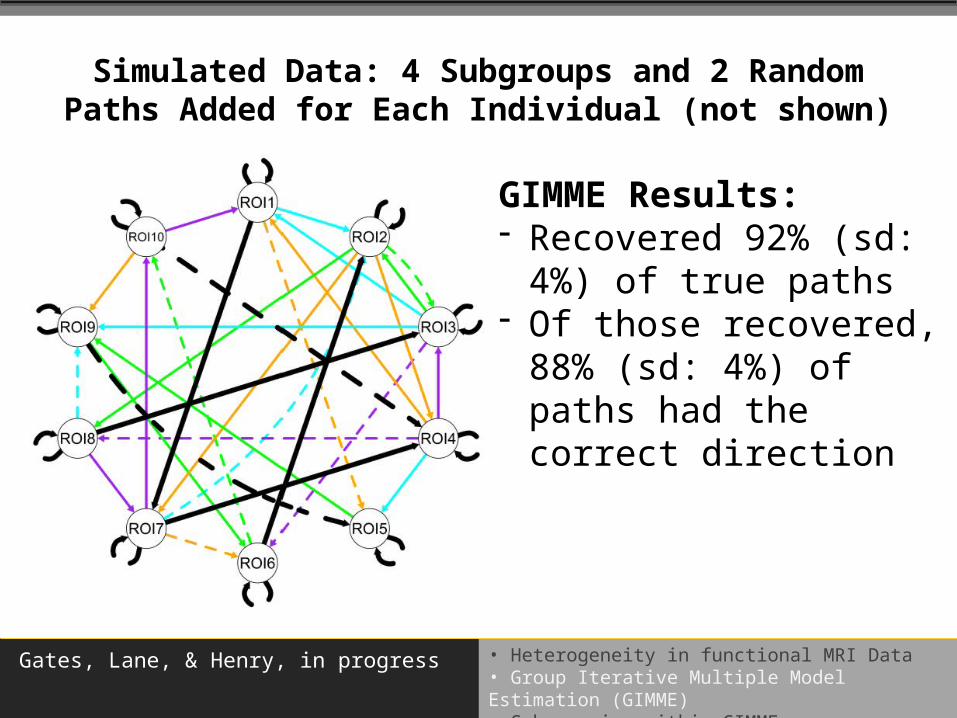
Simulated Data: 4 Subgroups and 2 Random Paths Added for Each Individual (not shown)
GIMME Results: - Recovered 92% (sd:
4%) of true paths - Of those recovered,
88% (sd: 4%) of paths had the correct direction
Gates, Lane, & Henry, in progress
• Heterogeneity in functional MRI Data• Group Iterative Multiple Model Estimation (GIMME)• Subgrouping within GIMME
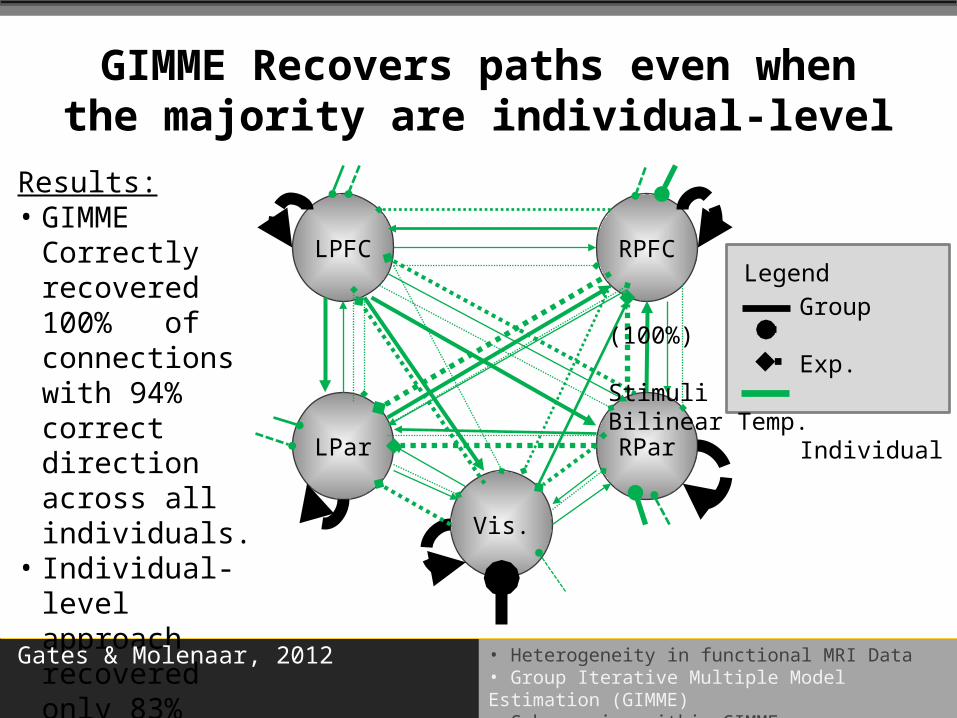
GIMME Recovers paths even when the majority are individual-level
LPFC RPFC
Vis.
RParLPar
Group (100%)
Exp. Stimuli
Bilinear Temp.
Individual
Legend
Results:• GIMME Correctly
recovered 100% of connections with 94% correct direction across all individuals.
• Individual-level approach recovered only 83%
Gates & Molenaar, 2012
• Heterogeneity in functional MRI Data• Group Iterative Multiple Model Estimation (GIMME)• Subgrouping within GIMME
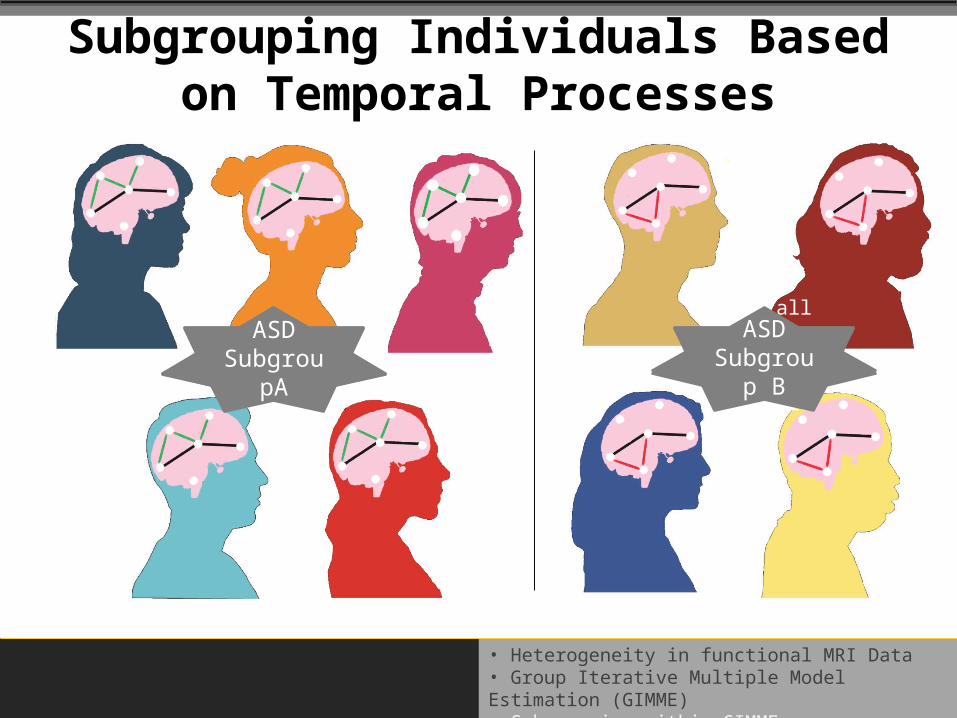
ASDTypically
Developing Controls
ASD Subgrou
p B
ASD Subgrou
pA
Subgrouping Individuals Based on Temporal Processes
• Heterogeneity in functional MRI Data• Group Iterative Multiple Model Estimation (GIMME)• Subgrouping within GIMME
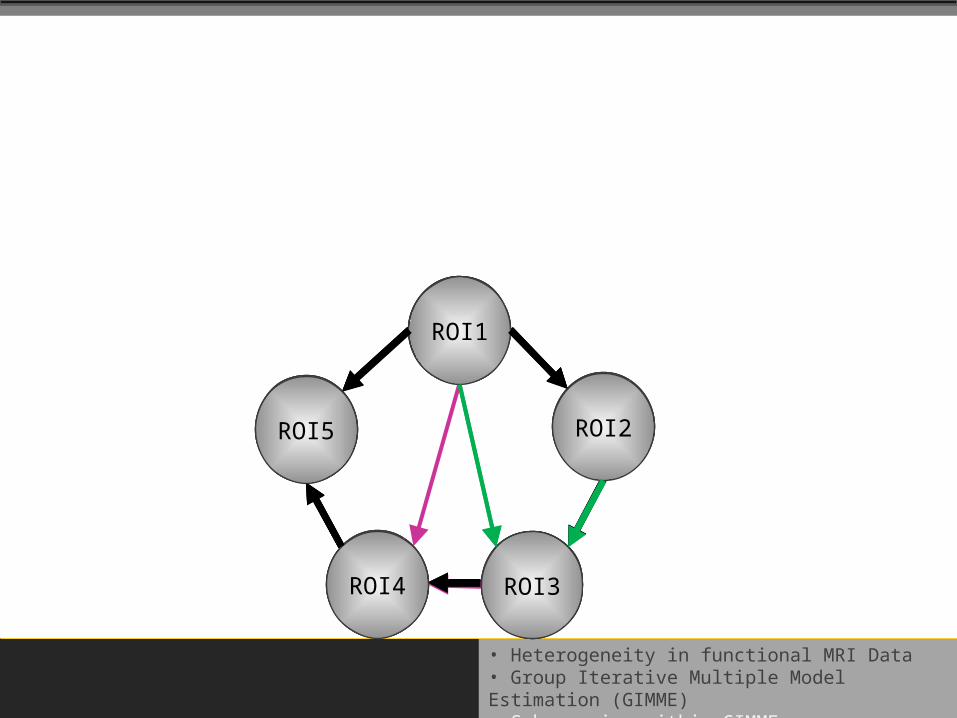
ROI1
ROI3
ROI2
ROI4
ROI5
ROI1
ROI3
ROI2
ROI4
ROI5
ROI1
ROI3
ROI2
ROI4
ROI5
ROI1
ROI3
ROI2
ROI4
ROI5
• Heterogeneity in functional MRI Data• Group Iterative Multiple Model Estimation (GIMME)• Subgrouping within GIMME
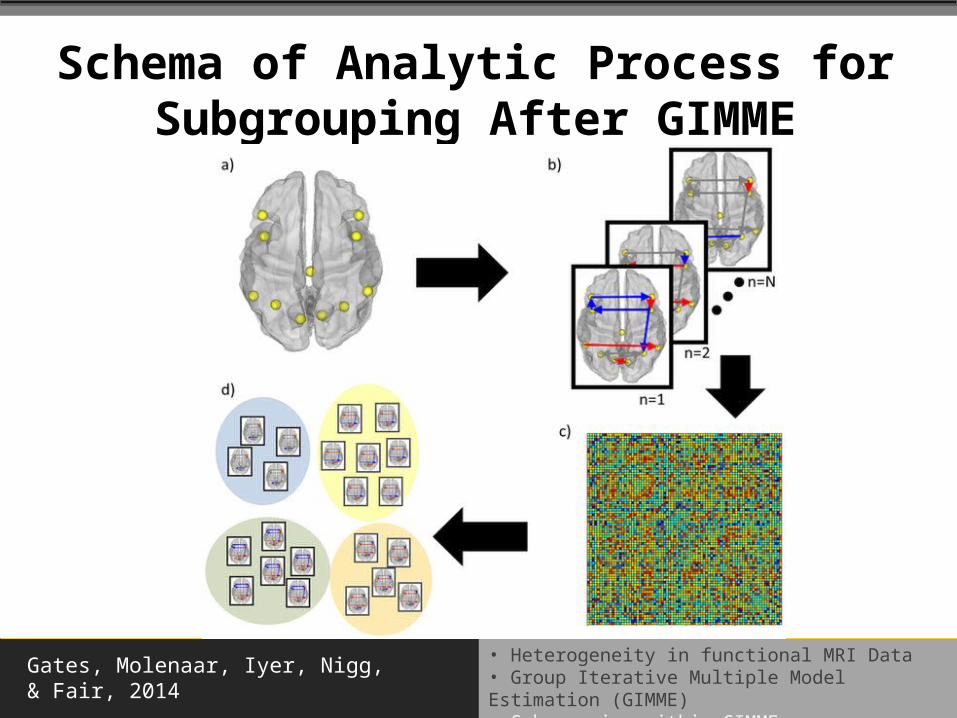
Schema of Analytic Process for Subgrouping After GIMME
Gates, Molenaar, Iyer, Nigg, & Fair, 2014
• Heterogeneity in functional MRI Data• Group Iterative Multiple Model Estimation (GIMME)• Subgrouping within GIMME
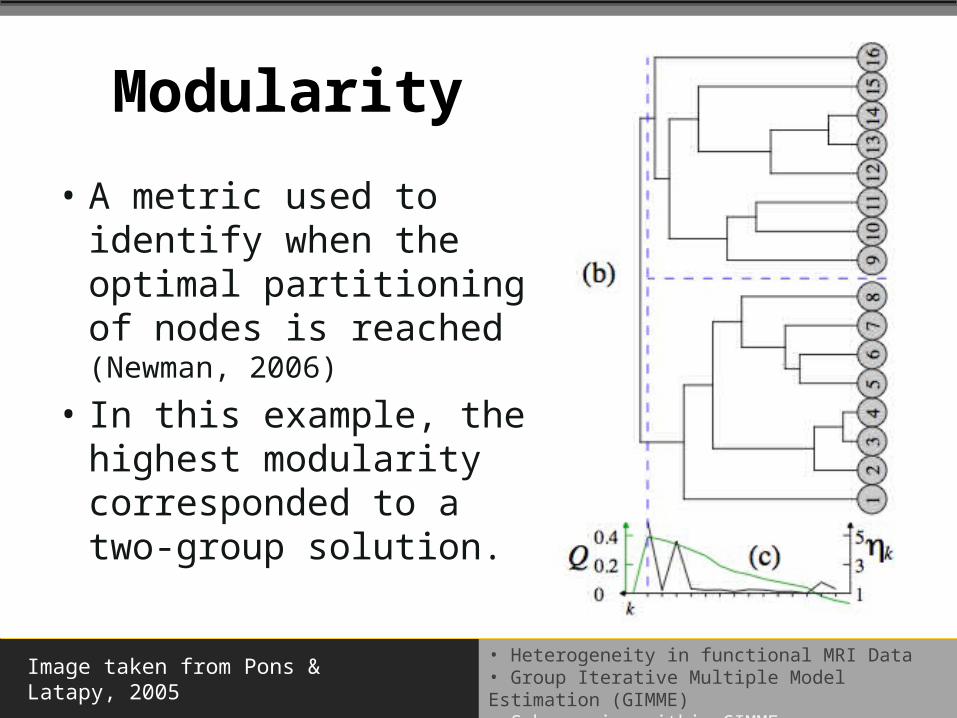
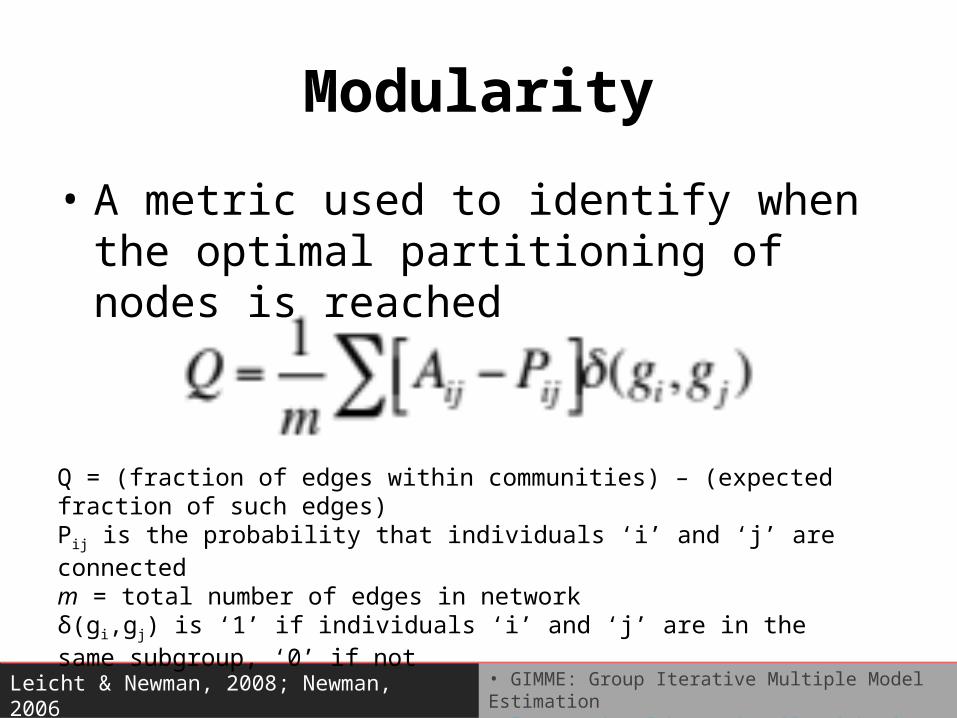
Modularity
• A metric used to identify when the optimal partitioning of nodes is reached (Newman, 2006)
• In this example, the highest modularity corresponded to a two-group solution.
Image taken from Pons & Latapy, 2005
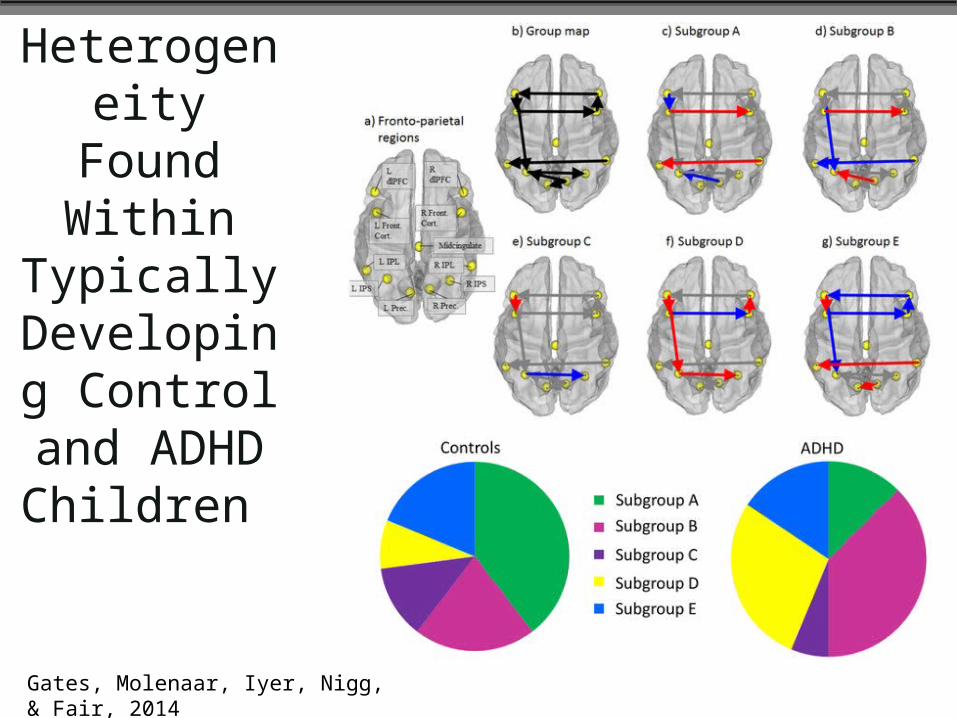
Heterogeneity Found
Within Typically
Developing Control and
ADHD Children
Gates, Molenaar, Iyer, Nigg, & Fair, 2014
• Heterogeneity in functional MRI Data• Group Iterative Multiple Model Estimation (GIMME)• Subgrouping within GIMME
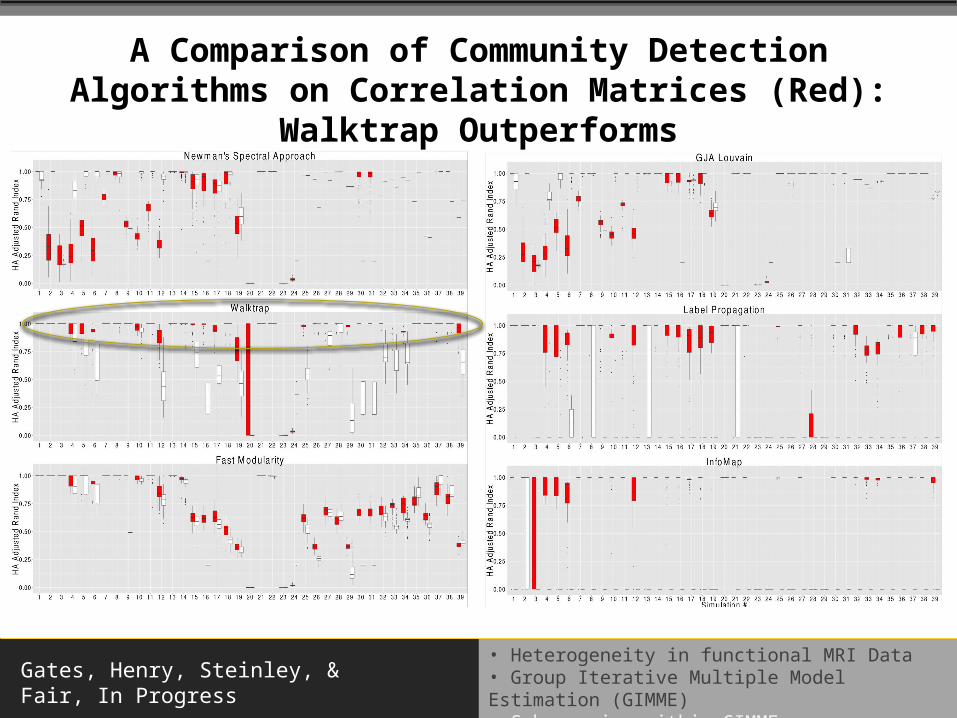
A Comparison of Community Detection Algorithms on Correlation Matrices (Red):
Walktrap Outperforms
Gates, Henry, Steinley, & Fair, In Progress
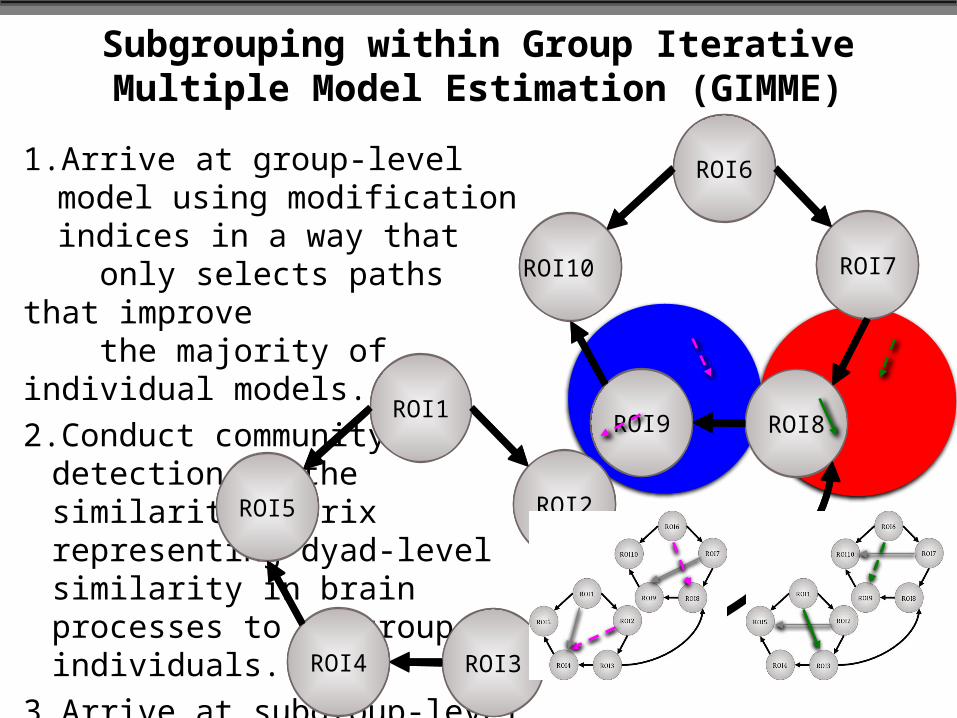
Subgrouping within Group Iterative Multiple Model Estimation (GIMME)
1.Arrive at group-level model using modification indices in a way that
only selects paths that improve the majority of individual models. 2.Conduct community
detection on the similarity matrix representing dyad-level similarity in brain processes to subgroup individuals.
3.Arrive at subgroup-level model using same criteria as in step 1.
4.Conduct model search for individual-level paths and arrive at individual-level estimates.
ROI6
ROI8
ROI7
ROI9
ROI10
ROI1
ROI3
ROI2
ROI4
ROI5
ROI6
ROI8
ROI7
ROI9
ROI10
ROI1
ROI3
ROI2
ROI4
ROI5
ROI6
ROI8
ROI7
ROI9
ROI10
ROI1
ROI3
ROI2
ROI4
ROI5
• Heterogeneity in functional MRI Data• Group Iterative Multiple Model Estimation (GIMME)• Subgrouping within GIMME
Two Benefits of Clustering During Model Selection
1. Can better tease out signal from noise because group-level similarities are removed.
2. Individual-level paths with be even more reliable if subgroup-level paths are considered.
• Heterogeneity in functional MRI Data• Group Iterative Multiple Model Estimation (GIMME)• Subgrouping within GIMME
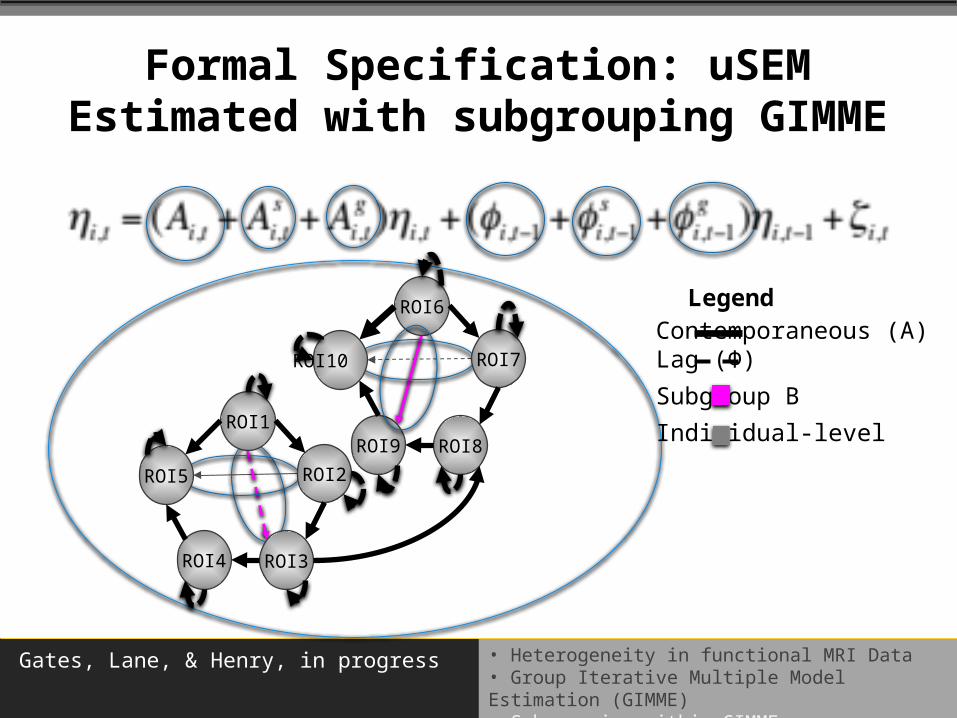
Formal Specification: uSEM Estimated with subgrouping GIMME
Contemporaneous (A) Lag (Φ)
Subgroup B
Individual-level
Legend
Gates, Lane, & Henry, in progress
ROI6
ROI8
ROI7
ROI9
ROI10
ROI1
ROI3
ROI2
ROI4
ROI5
• Heterogeneity in functional MRI Data• Group Iterative Multiple Model Estimation (GIMME)• Subgrouping within GIMME
Simulated Data: 4 Subgroups and 2 Random Paths Added for Each Individual (not shown)
Simulated Data Across 3 Factors:- Number of individuals
(N=25, 100, 200)- Number of subgroups
(2, 3, and 4)- Degree of
Heterogeneity (equal groups, one group comprising 50% of sample)
Gates, Lane, & Henry, in progress
• Heterogeneity in functional MRI Data• Group Iterative Multiple Model Estimation (GIMME)• Subgrouping within GIMME
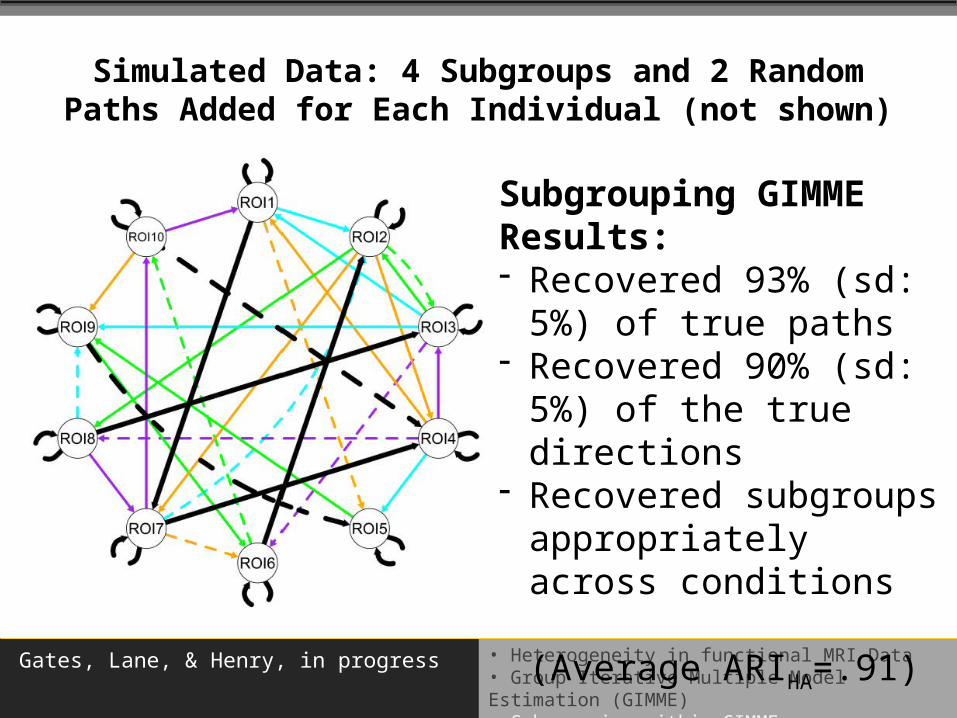
Simulated Data: 4 Subgroups and 2 Random Paths Added for Each Individual (not shown)
Subgrouping GIMME Results: - Recovered 93% (sd:
5%) of true paths - Recovered 90% (sd:
5%) of the true directions
- Recovered subgroups appropriately across conditions (Average ARIHA=.91)
Gates, Lane, & Henry, in progress
• Heterogeneity in functional MRI Data• Group Iterative Multiple Model Estimation (GIMME)• Subgrouping within GIMME
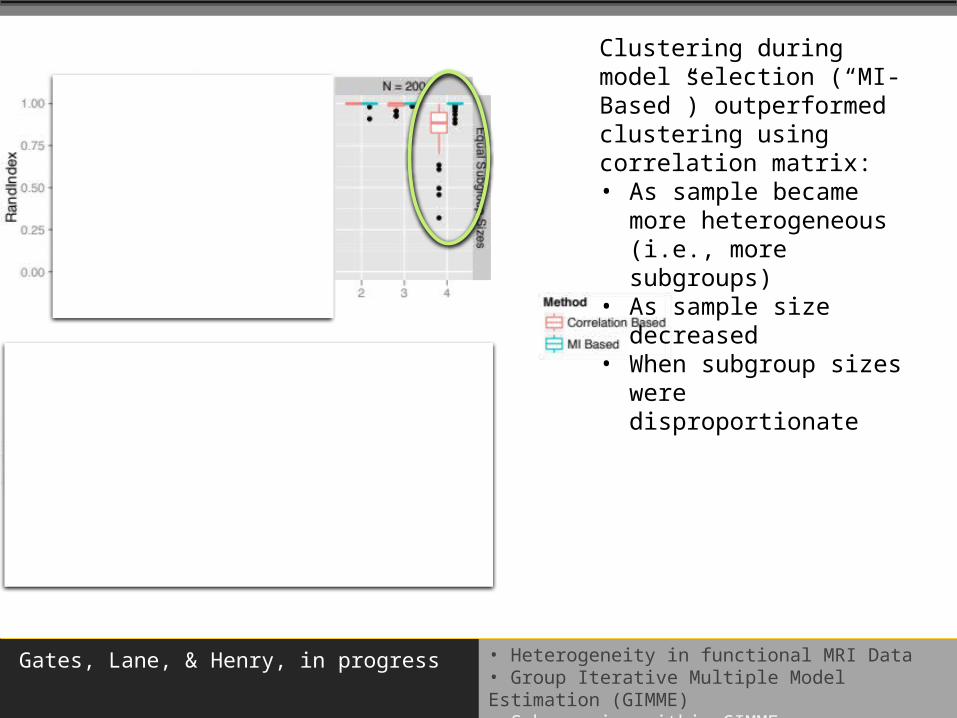
Clustering during model selection (“MI-Based”) outperformed clustering using correlation matrix:• As sample became more
heterogeneous (i.e., more subgroups)
• As sample size decreased
• When subgroup sizes were disproportionate
Gates, Lane, & Henry, in progress
• Heterogeneity in functional MRI Data• Group Iterative Multiple Model Estimation (GIMME)• Subgrouping within GIMME
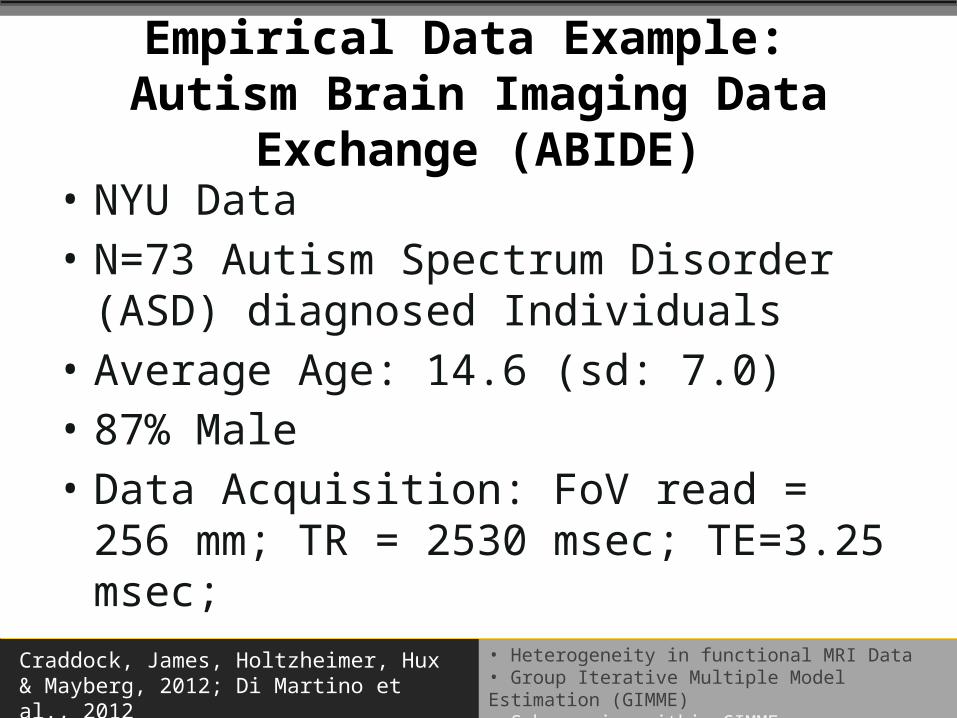
Empirical Data Example: Autism Brain Imaging Data
Exchange (ABIDE)• NYU Data • N=73 Autism Spectrum Disorder
(ASD) diagnosed Individuals• Average Age: 14.6 (sd: 7.0)• 87% Male• Data Acquisition: FoV read = 256
mm; TR = 2530 msec; TE=3.25 msec;
Craddock, James, Holtzheimer, Hux & Mayberg, 2012; Di Martino et al., 2012
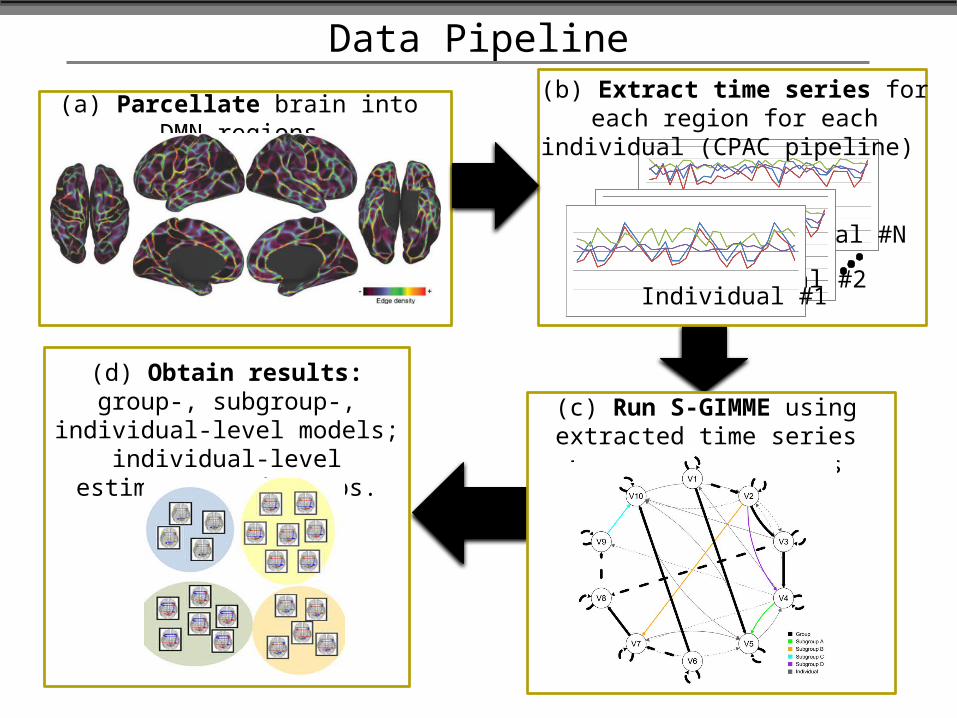
Data Pipeline
(a) Parcellate brain into DMN regions
(c) Run S-GIMME using extracted time series for all
individuals
Individual #N
(b) Extract time series for each region for each individual
(CPAC pipeline)
Individual #2Individual #1
(d) Obtain results: group-, subgroup-, individual-level
models; individual-level estimates; subgroups.
• Heterogeneity in functional MRI Data• Group Iterative Multiple Model Estimation (GIMME)• Subgrouping within GIMME
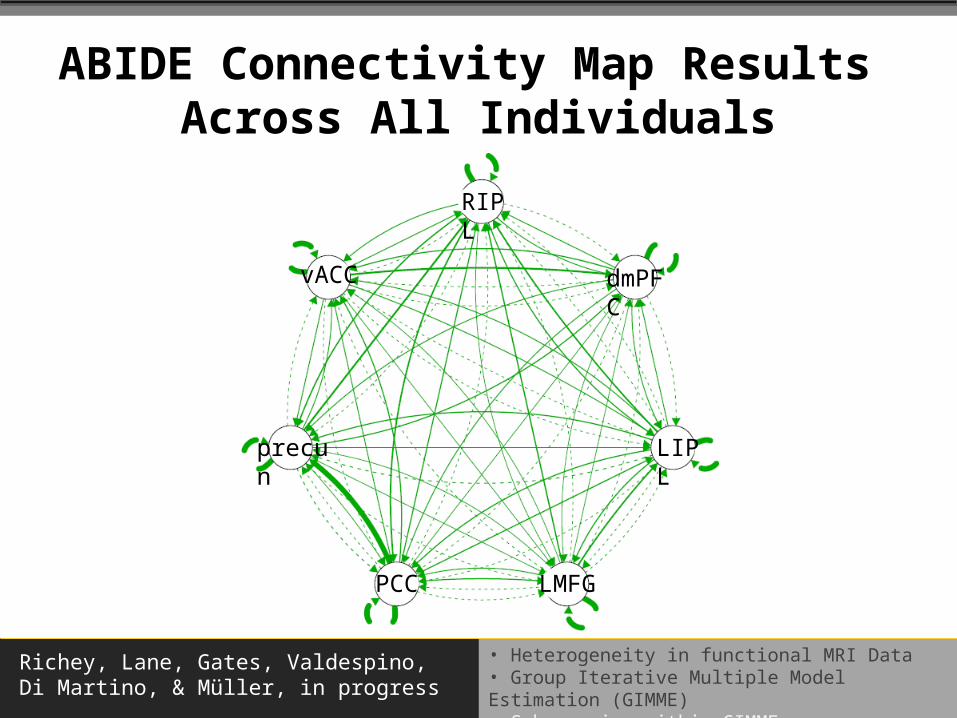
ABIDE Connectivity Map Results Across All Individuals
LIPL
dmPFC
RIPL
LMFGPCC
precun
vACC
Richey, Lane, Gates, Valdespino, Di Martino, & Müller, in progress
• Heterogeneity in functional MRI Data• Group Iterative Multiple Model Estimation (GIMME)• Subgrouping within GIMME
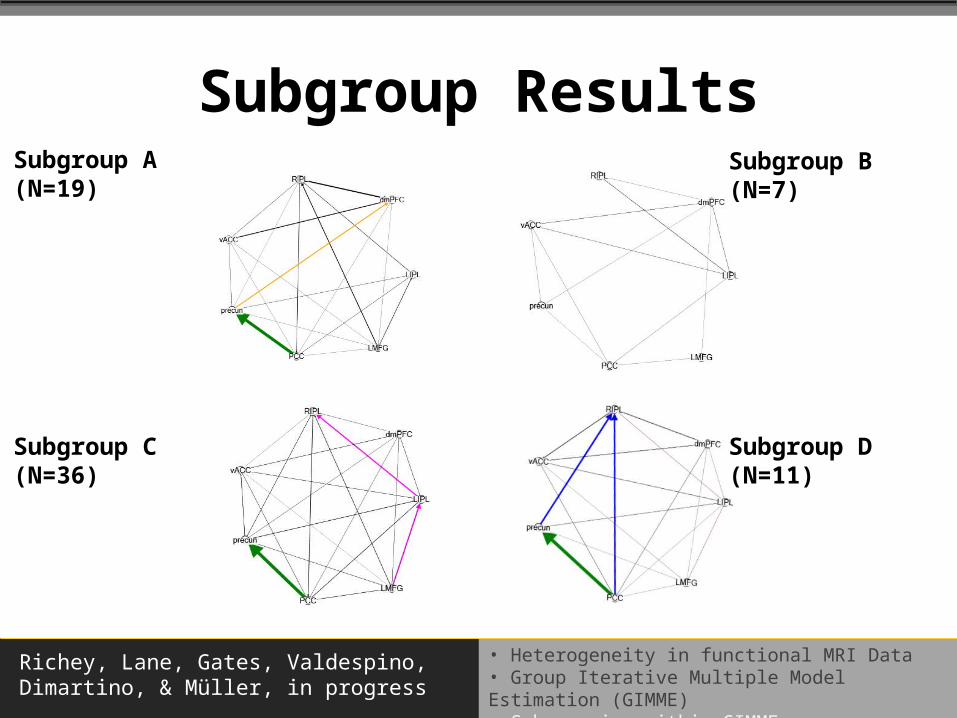
Subgroup ResultsSubgroup A (N=19)
Subgroup B (N=7)
Subgroup D (N=11)
Subgroup C (N=36)
Richey, Lane, Gates, Valdespino, Dimartino, & Müller, in progress
• Heterogeneity in functional MRI Data• Group Iterative Multiple Model Estimation (GIMME)• Subgrouping within GIMME
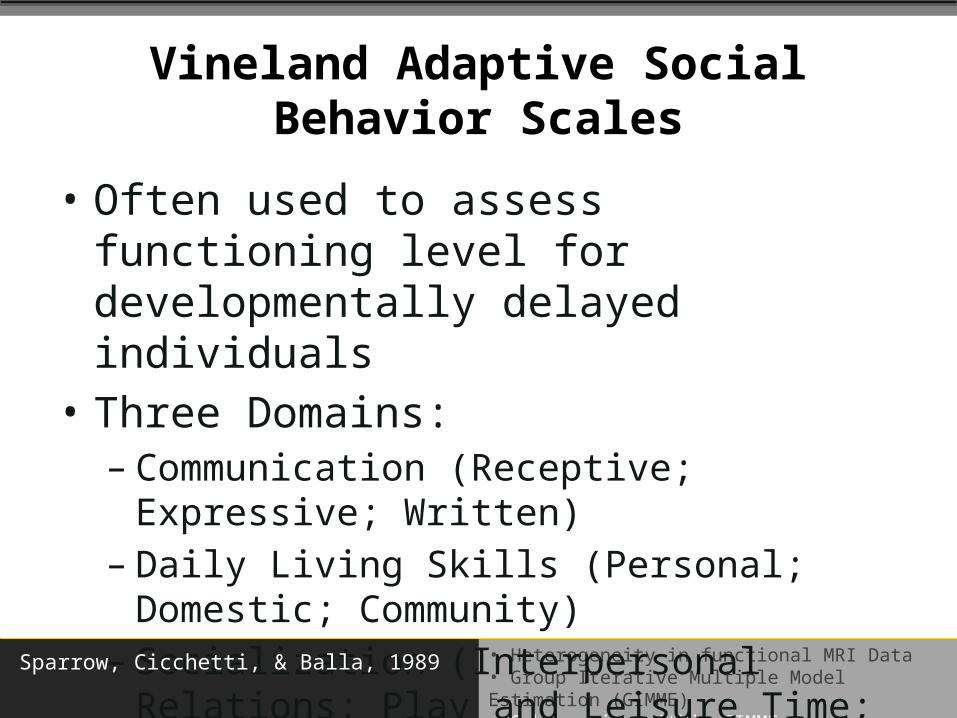
Vineland Adaptive Social Behavior Scales
• Often used to assess functioning level for developmentally delayed individuals
• Three Domains:– Communication (Receptive; Expressive;
Written)– Daily Living Skills (Personal; Domestic;
Community)– Socialization (Interpersonal Relations;
Play and Leisure Time; Coping)Sparrow, Cicchetti, & Balla, 1989
• Heterogeneity in functional MRI Data• Group Iterative Multiple Model Estimation (GIMME)• Subgrouping within GIMME
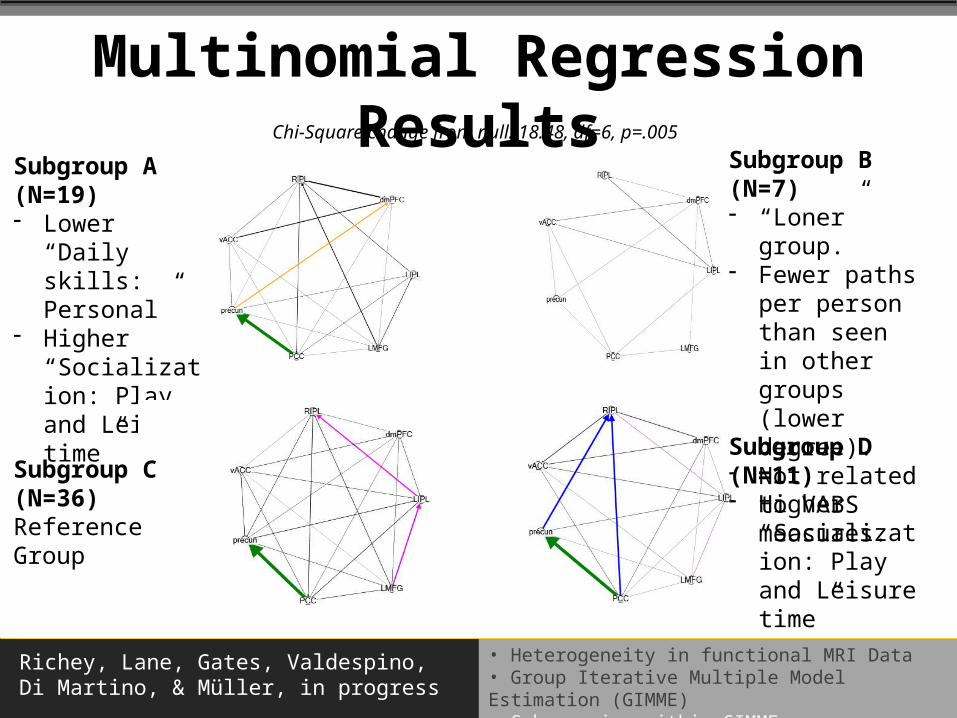
Multinomial Regression Results
Subgroup A (N=19) - Lower “Daily
skills: Personal”
- Higher “Socialization: Play and Leisure time”
Subgroup B (N=7) - “Loner”
group.- Fewer paths
per person than seen in other groups (lower degree).
- Not related to VABS measures.
Subgroup D (N=11) - Higher
“Socialization: Play and Leisure time”
Subgroup C (N=36) Reference Group
Chi-Square change from null: 18.48, df=6, p=.005
Richey, Lane, Gates, Valdespino, Di Martino, & Müller, in progress
• Heterogeneity in functional MRI Data• Group Iterative Multiple Model Estimation (GIMME)• Subgrouping within GIMME
Guiding Principals for Using GIMME
• Arriving at paths:– Improved reliable recovery seen with as few as 10
individuals in a sample– Make sure variables are not highly correlated
• Arriving at subgroups:– Subgroups are reliably obtained when there are at
least 25 individuals
• Data-driven searches:– Not a replacement for hypotheses, but helpful if the
state of the science prevents arriving at informed hypotheses
Gates, Lane, & Henry, In Prep; Gates & Molenaar, 2012
• Heterogeneity in functional MRI Data• Group Iterative Multiple Model Estimation (GIMME)• Subgrouping within GIMME
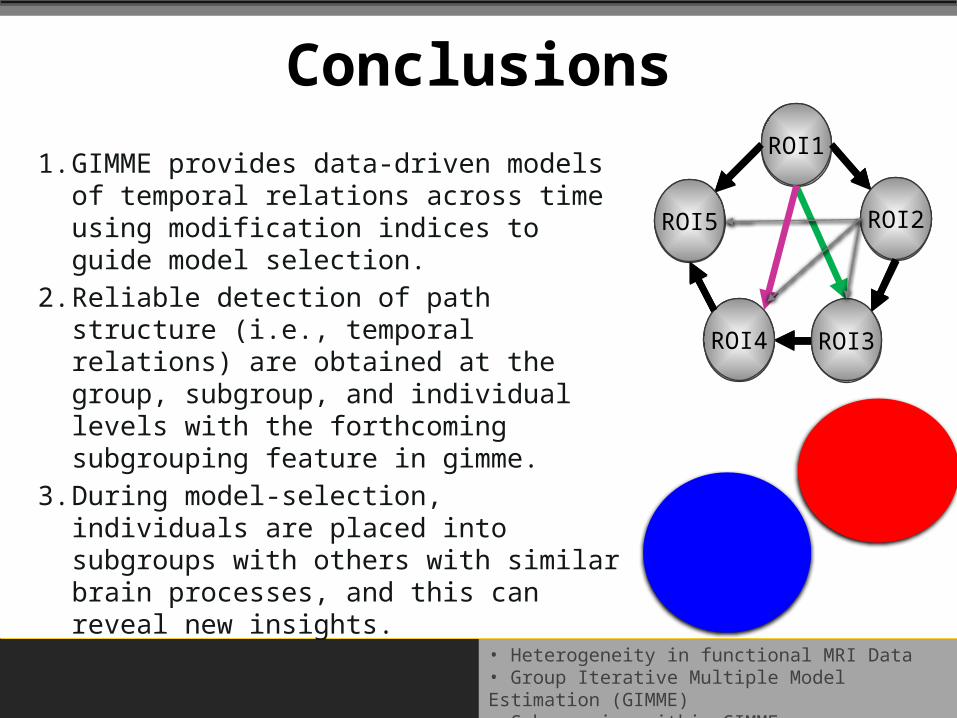
Conclusions
1. GIMME provides data-driven models of temporal relations across time using modification indices to guide model selection.
2. Reliable detection of path structure (i.e., temporal relations) are obtained at the group, subgroup, and individual levels with the forthcoming subgrouping feature in gimme.
3. During model-selection, individuals are placed into subgroups with others with similar brain processes, and this can reveal new insights.
ROI1
ROI3
ROI2
ROI4
ROI5
ROI1
ROI3
ROI2
ROI4
ROI5
ROI1
ROI3
ROI2
ROI4
ROI5
• Heterogeneity in functional MRI Data• Group Iterative Multiple Model Estimation (GIMME)• Subgrouping within GIMME
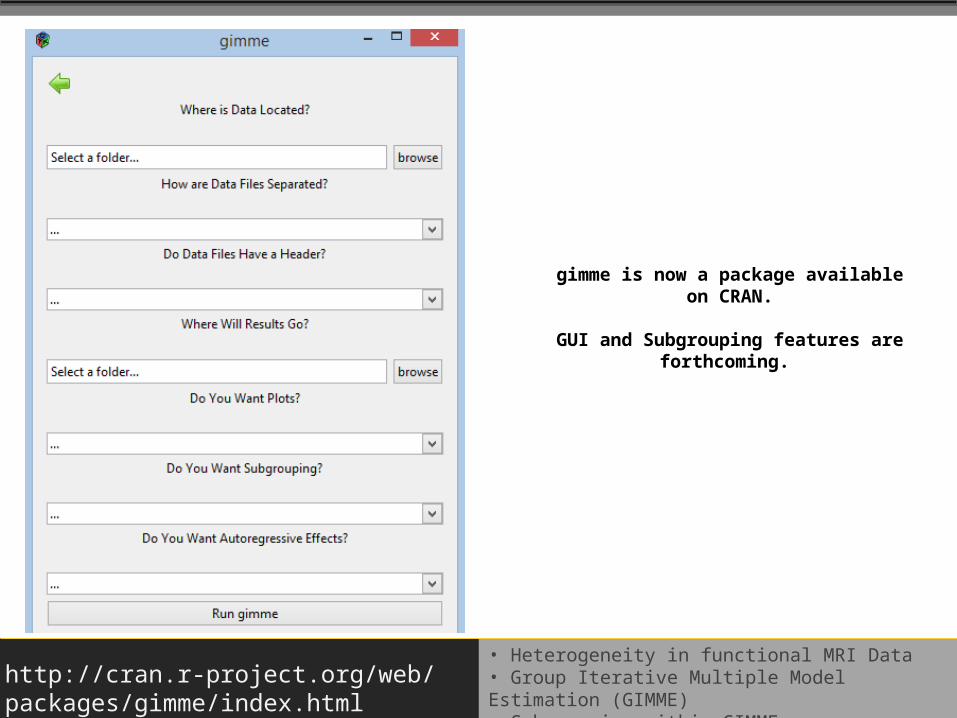
gimme is now a package available on CRAN.
GUI and Subgrouping features are forthcoming.
http://cran.r-project.org/web/packages/gimme/index.html
AcknowledgementsDamien Fair
OHSU
Clark Glymour, Ph.D. (Carnegie Melon)Joe Ramsey, Ph.D. (Carnegie Melon)
Siwei Liu, Ph.D. (UC- Davis)Daniele Marinazzo, Ph.D. (Ghent
University)Jing Yang, Ph.D. (Guangdong University)
Adriene Beltz, Ph.D. (Penn State)Dan Elbich, M.A. (Penn State)
Suzy Scherf, Ph.D. (Penn State)Steve Wilson , Ph.D. (Penn State)
Michael Hallquist, Ph.D. (University of Pitt)Aidan Wright, Ph.D. (University of Pitt)
Doug Steinley, Ph.D. (University of Missouri)
Mariya Schiyko, Ph.D. (Northeastern)This work has been supported by NIH/NIBIB Grant R21 EB015573-01A1
PI: Kathleen M. Gates - [email protected]
John RicheyVirginia Tech
Charlotte Boettiger, Ph.D. (UNC)Laura Castro-Schilo, Ph.D. (UNC)Stacey Daughters, Ph.D. (UNC)Kelly Giovenello, Ph.D. (UNC)Kevin Guiskewicz, Ph.D. (UNC)Joseph Hopfinger, Ph.D. (UNC)
Wei Li, Ph.D. (UNC)Kristen Lindquist, Ph.D. (UNC)
Peter Mucha, Ph.D. (UNC)Thurstone Psychometric Lab (UNC)
Consulting on the ABIDE project: Adriana Di Martino, Ph.D. (NYU)Ralph-Axel Müller, Ph.D. (SDSU)
Peter MolenaarPenn State
• GIMME: Group Iterative Multiple Model Estimation• Integrating Subgrouping Algorithm into GIMME
Leicht & Newman, 2008; Newman, 2006
Q = (fraction of edges within communities) – (expected fraction of such edges)Pij is the probability that individuals ‘i’ and ‘j’ are connectedm = total number of edges in networkδ(gi,gj) is ‘1’ if individuals ‘i’ and ‘j’ are in the same subgroup, ‘0’ if not
Modularity
• A metric used to identify when the optimal partitioning of nodes is reached