Embed Size (px)
Citation preview

CMC/CC A
Visual Communication
Master IK, CIW, MMI
L.M. Bosveld-de Smet
Mon. 27/11/06; 16.00-18.00

Outline
Varieties of visualizations Visual communication in general Obvious advantages of pictures Important general concepts

Carbon Cycle

Elastic Collision
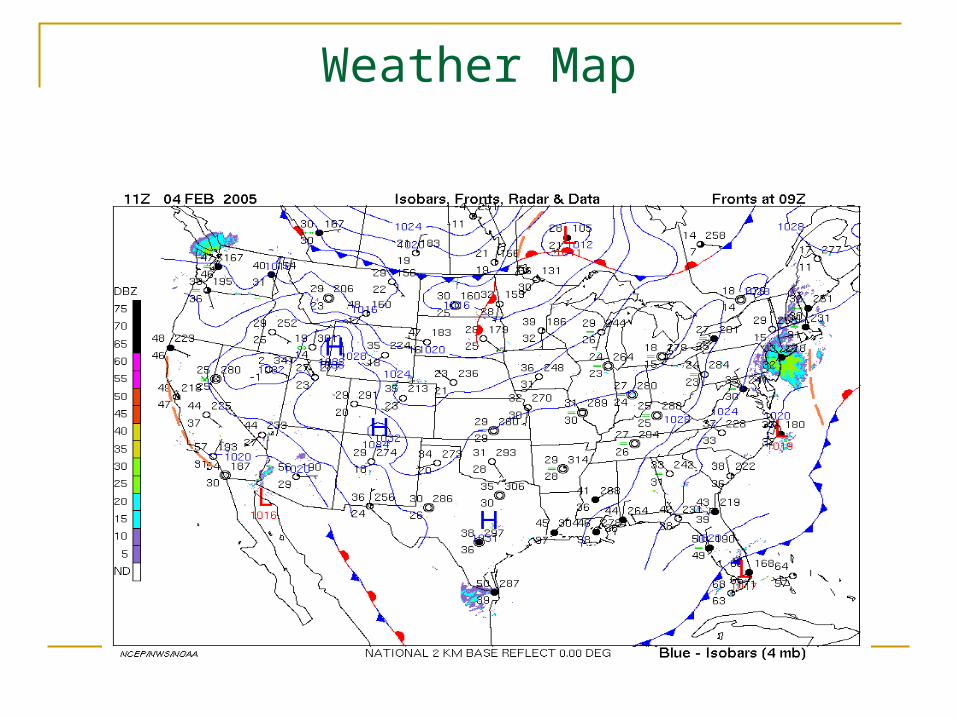
Weather Map

Alzheimer’s Disease Brains
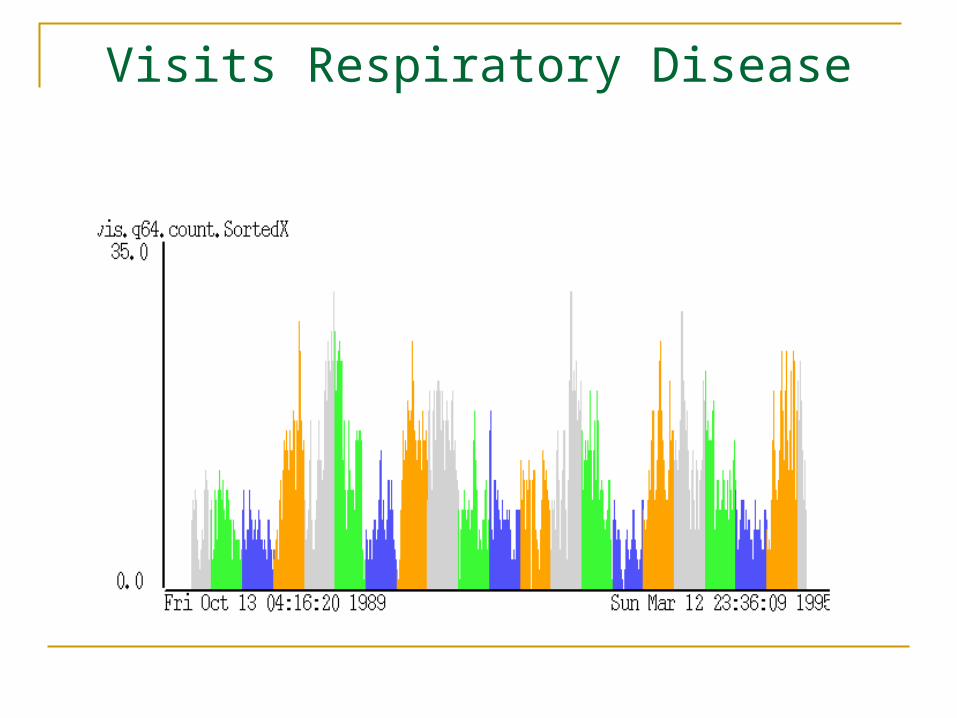
Visits Respiratory Disease

Differences

Good and Bad Pictures
Bertin, 1967“Combien de dessins admirablement exécutés et richement reproduits […] ne communiquent qu’une information dérisoire et inutile? Que de papier et de couleurs perdus. Tandis que des croquis malhabiles mais correctement construits deviennent les meilleurs instruments de la découverte et de la pédagogie”
Tufte, 1983Graphical excellence“consists of complex ideas communicated with clarity, precision, and efficiency”“is that which gives the viewer the greatest number of ideas in the shortest time with the least ink in the smallest space”“requires telling the truth about the data”

Visual Communication: simplified

Natural vs. Unnatural Link
a
b
c
a
b
c

Misleading Link
Bill
Charles
Gregory

Visual Communication: more complex
Raw Data
Data Tables
Visual Structures
Views
Data Transformations
Visual Mappings
View Transformations

Monk Puzzle (Winn, 1987)
“A monk went to the temple at the top of a holy mountain to meditate and pray. He started out early one morning along the path that led up to the temple. Because he was an old man, and the way was steep and arduous, he frequently slowed his pace, and even sat and rested a while beside the path. Toward evening, he came to the temple at the top.
After several days of meditation and prayer, it was time for him to leave. Early in the morning, he set off back down the path. Again, he frequently changed his pace and rested by the way. He arrived back at the bottom in the evening.
Show that there is one single point on the path up the mountain where the monk will be at precisely the same time both when he goes up and when he comes down.”
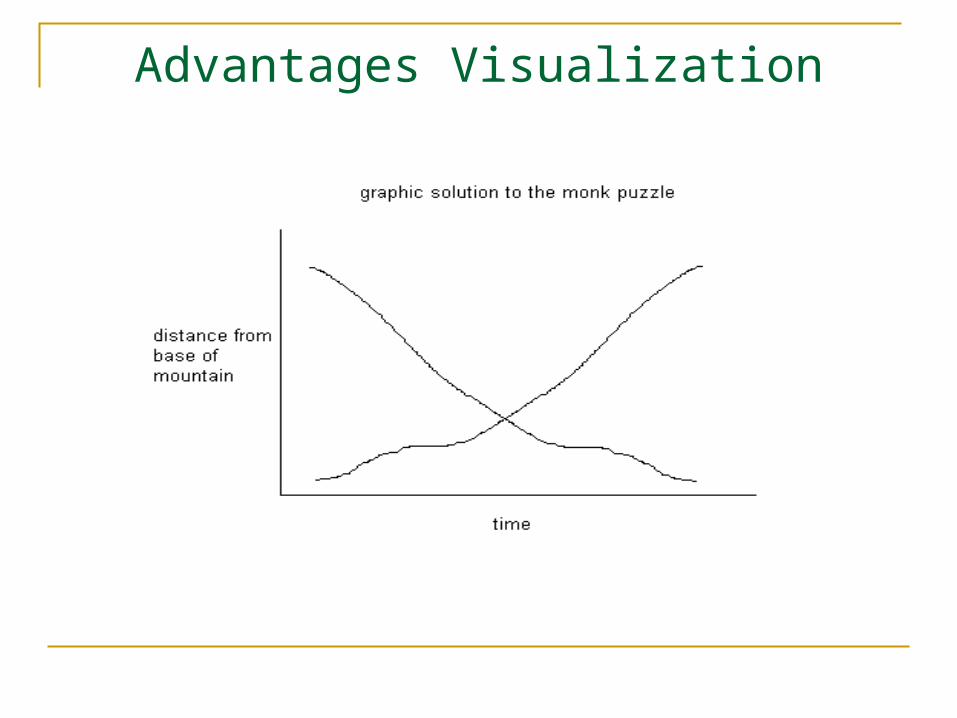
Advantages Visualization

Shimojima (2004)
“Inferential and Expressive Capacities of Graphical Representations: Survey and Some Generalizations”
Crucial traits of varieties of visual representations
Free ride properties Auto-consistency Over-specificity Meaning derivation properties
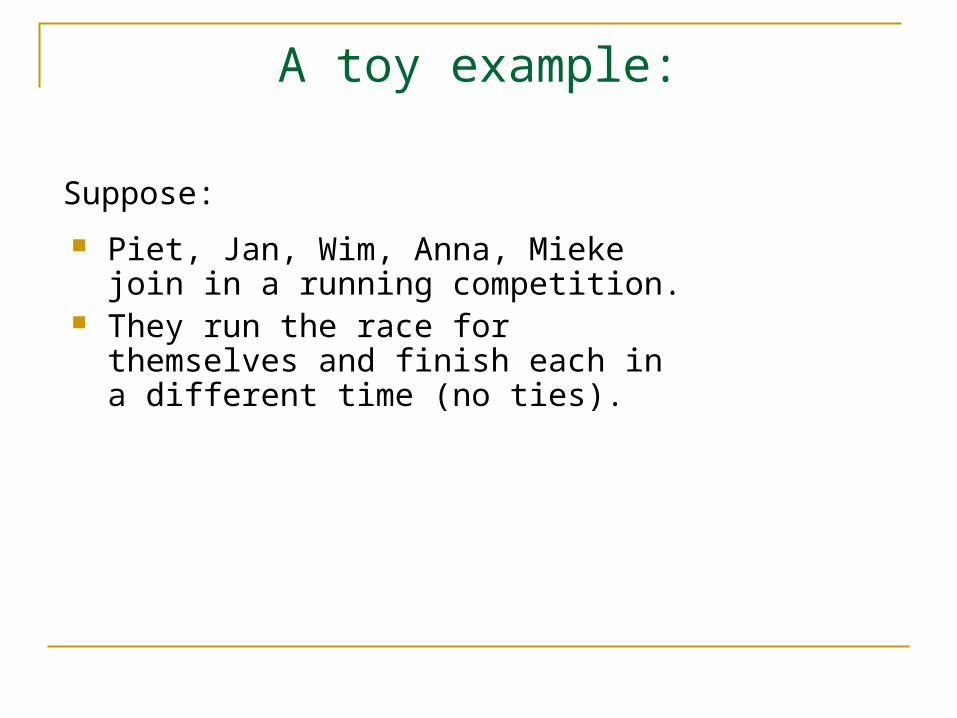
A toy example:
Piet, Jan, Wim, Anna, Mieke join in a running competition.
They run the race for themselves and finish each in a different time (no ties).
Suppose:

We can use different representations for the information that Jan’s score is better than Piet’s
Comparison of different modalities
DEFEAT(jan,piet)
Jan defeated Piet.
Jan Piet

DEFEAT (jan , piet)
Jan defeated Piet.
Jan Piet
Formula first-order logic (FOL)• 2-place predicate:
DEFEAT• with 2 arguments:
jan and piet

DEFEAT (jan, piet)
Jan defeated Piet.
Jan Piet
Position diagram (PD):Horizontal relation of names indicates order of arrival of participants.

DEFEAT (jan, piet)
Jan defeated Piet.
Jan Piet
English well-formed sentence meaning that Jan defeated Piet, i.e. that Jan ran the race faster than Piet did.

PD more in detail
Syntactic rules: Two or more of the names
“Jan”, “Piet”, “Wim”, “Anna”, and “Mieke” appear in a horizontal row.
The same name appears at most once.
Semantic rules: If the name X appears to
the left of the name Y, the bearer of X defeated the bearer of Y.

1. Free Ride

Difference 1
DEFEAT (jan, piet) & DEFEAT (piet, mieke)
FOL
Jan defeated Piet and Mieke was beaten by Piet.
ENGL.
Jan Piet MiekePD
Represent the following information:Jan: 16.34; Piet: 20.80; Mieke: 25.40
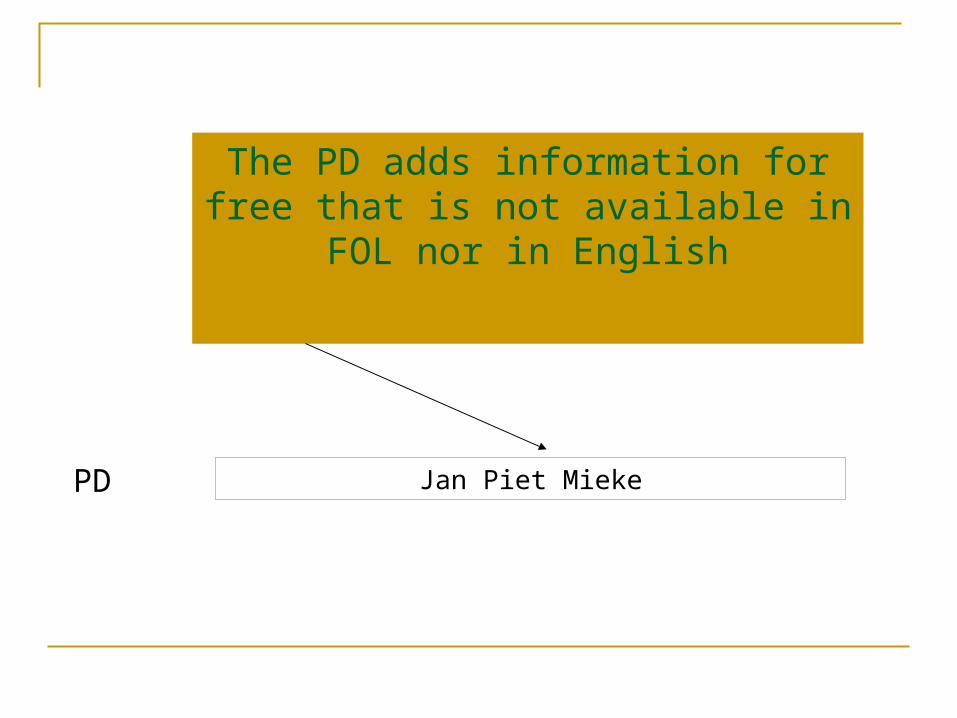
Jan Piet MiekePD
The PD adds information for free that is not available in FOL nor in English

In PD, expressing certain sets of information results in the expression of additional, consequential information.
Free rides=

Other example:Venn diagrams
Represent: All A’s are B’s; No B’s are C’s.
As
Bs Cs
As
Bs Cs
As
Bs Cs
Expressing certain sets of information results in the expression of additional, consequential information:
No A’s are C’s

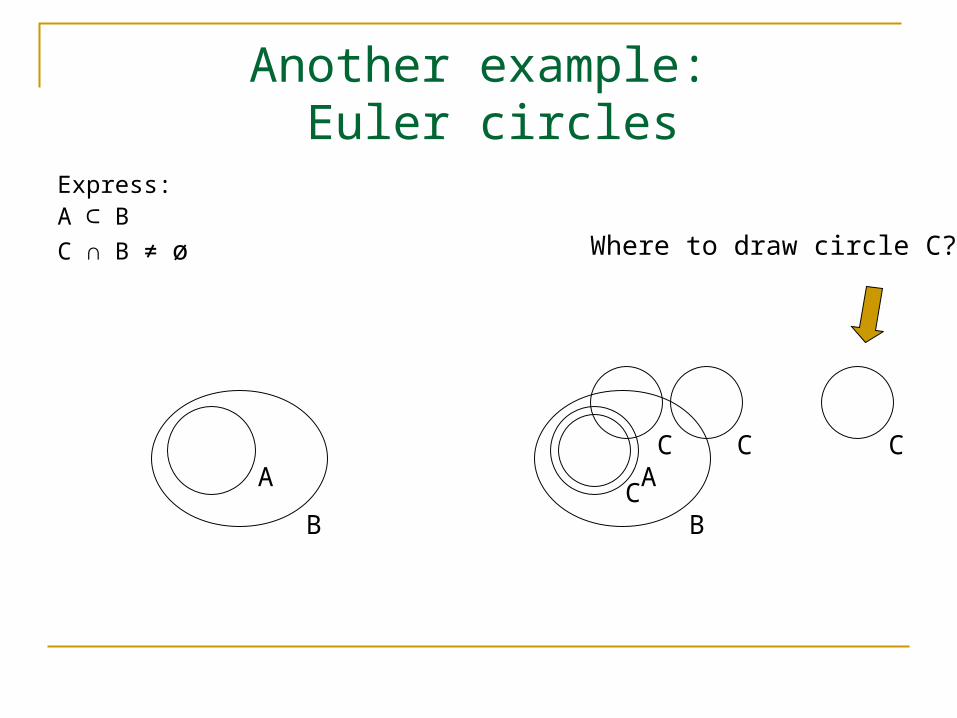
Other example:Euler circles
Express:A B⊂C ∩ B = Ø
A
B
CA
B
Free ride: C ∩ A = Ø

Another example: maps
Express:B’s house is in front of F’s house on the other side of the river.
S
C
D 1
PE
F
L
A7
M
W
S
C
D 1
PE
F
L
A7
M
W
B

Diagrams are physical situations….As such, they obey their own set of constraints…By choosing a representational scheme appropriately, so that the constraints on the diagrams have a good match with the constraints on the described situation, the diagram can generate a lot of information that the user never need infer. Rather, the user can simply read off facts from the diagram as needed.
Barwise & Etchemendy (1990)

Assumption:
indicates
Property a
Property a’Represented object Y
Representation X
A representation X expresses information about the represented object Y by having a property that indicates the corresponding property of Y.

Example of PDs
indicates
[name “Jan” appears to the left of name “Piet”]
[Jan defeated Piet] A particular competition
A specific PD
Jan Piet

Example: Euler circles
indicates
[ circle “A” appears inside circle “B”]
[A ⊂ B]A specific group of circles
A specific Euler diagram
A
B

Condition for Free Ride in PD system
The name “Mieke” appears to the right of the name “Piet”
The name “Jan” appears to the left of “Mieke”.
The name “Jan” appears to the left of the name “Piet”
Jan defeated Mieke.Jan defeated Piet.
Mieke was beaten by Piet.
indicates indicates indicates

Free Ride: Euler Diagram
A circle “C” and circle “B” do not overlap.
Circle “C” and circle “A” do not overlap.
A circle “A” appears inside another circle “B”.
C ∩ A = øA B⊂ C ∩ B = ø
indicates indicates indicates
constraint
constraint

Condition for Free Ride: General
indicates indicates indicates
constraint
constraint………
………
Constraints on representations themselves track constraints in the represented domain.
(Shimojima 1996a, 1996b)

Thus:
A system with a free-ride property supports deductive inference through physical manipulation of representations on an external display, not in the head.
A (paradigm) case of distributed cognition
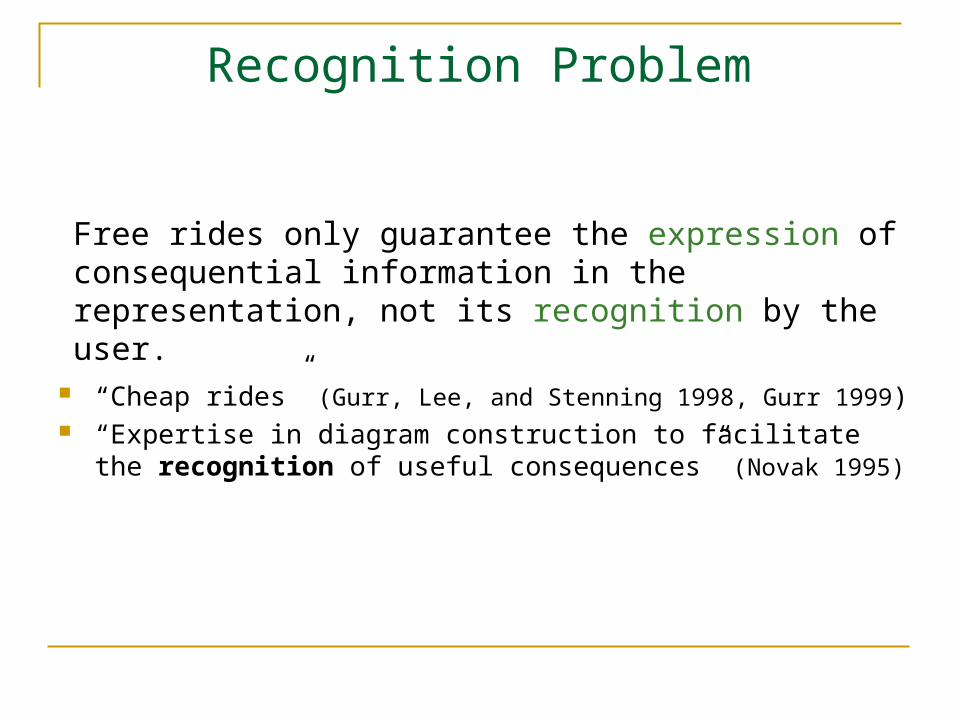
Recognition Problem
“Cheap rides” (Gurr, Lee, and Stenning 1998, Gurr 1999) “Expertise in diagram construction to facilitate the recognition of
useful consequences” (Novak 1995)
Free rides only guarantee the expression of consequential information in the representation, not its recognition by the user.

2. Over-Specificity

Difference 2
Express:Jan defeated Piet.Mieke defeated Piet.
DEFEAT (jan,piet) & DEFEAT (mieke,piet)
FOL
Jan defeated Piet and Mieke defeated Piet.
English
Jan Mieke PietPD Mieke Jan Piet? ?

Jan Mieke PietPD Mieke Jan Piet? ?
PD system can’t express the info without additional info…while FOL and English can!
Druk uit:Jan defeated Piet.Mieke defeated Piet.
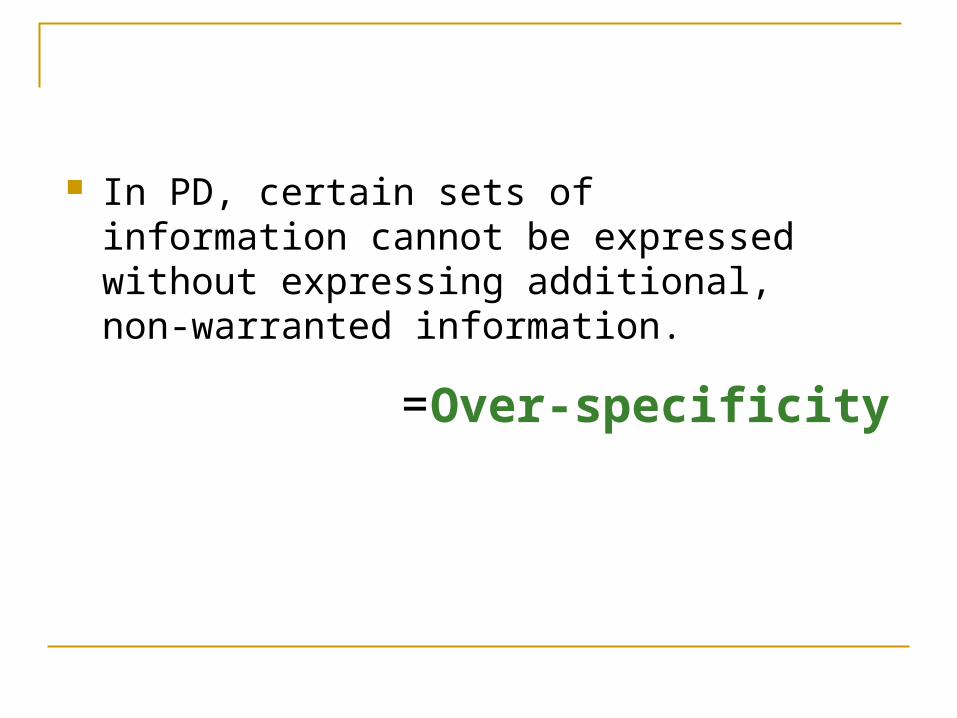
In PD, certain sets of information cannot be expressed without expressing additional, non-warranted information.
Over-specificity=
Another example: Euler circles
Express:A ⊂ BC ∩ B ≠ ø
A
B
A
B
C
Where to draw circle C?
CC
C

Another example: Maps
Express:K’s house is located between A’s house and B’s house.
S
C
D 1
PE
F
L
A7
M
W
B
K
Where to put this house?
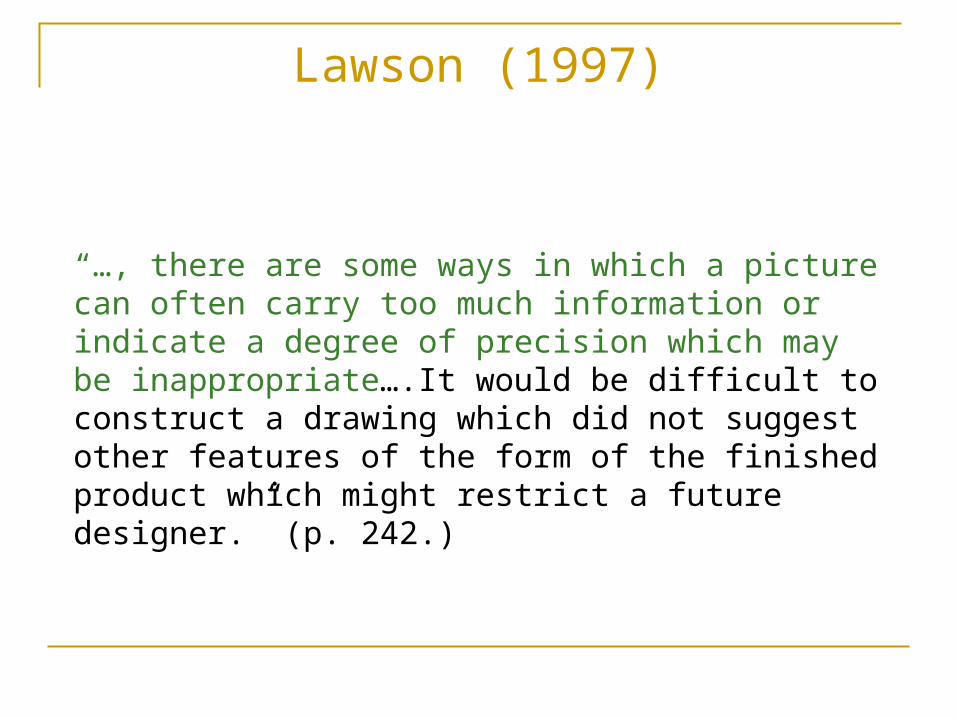
“…, there are some ways in which a picture can often carry too much information or indicate a degree of precision which may be inappropriate….It would be difficult to construct a drawing which did not suggest other features of the form of the finished product which might restrict a future designer.” (p. 242.)
Lawson (1997)

Analysis of over-specificity in PD
indicates indicates indicates
constraint
indicates
(1’)
(1’) “Jan” at left of “Piet”.
(2’)
(2’) “Mieke” at left of “Piet”.
(2)
(2) Mieke defeated Piet
(1) Jan defeated Piet
(1)
(4’) “Mieke” at left of “Jan”.
(4’)
(3’) “Jan” at left of “Mieke”.
(3’)
constraint
(3)
(3) Jan defeated Mieke
(4)
(4) Mieke defeated Jan

Analysis of over-specificity: General
indicates indicates indicates
constraint
constraint
indicates
………
………
………
………
(Shimojima 1996b)

3. Derived Meaning

Difference 3
Express:Jan defeated Piet.Anna defeated Jan.Piet defeated Mieke.Mieke defeated Wim
DEFEAT (jan,piet) & DEFEAT (piet,mieke) &
DEFEAT (anna,jan) & DEFEAT (mieke,wim)
FOL
Jan defeated Piet, Piet defeated Mieke, Anna defeated Jan and Mieke defeated Wim.English
Anna Jan Piet Mieke WimPD
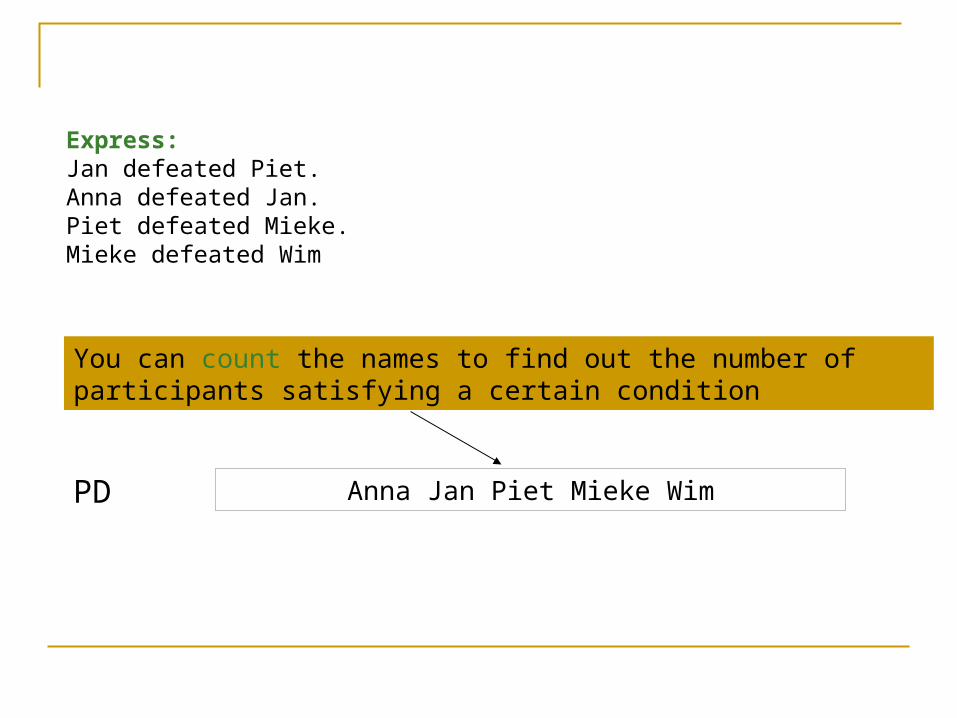
Anna Jan Piet Mieke WimPD
You can count the names to find out the number of participants satisfying a certain condition
Express:Jan defeated Piet.Anna defeated Jan.Piet defeated Mieke.Mieke defeated Wim
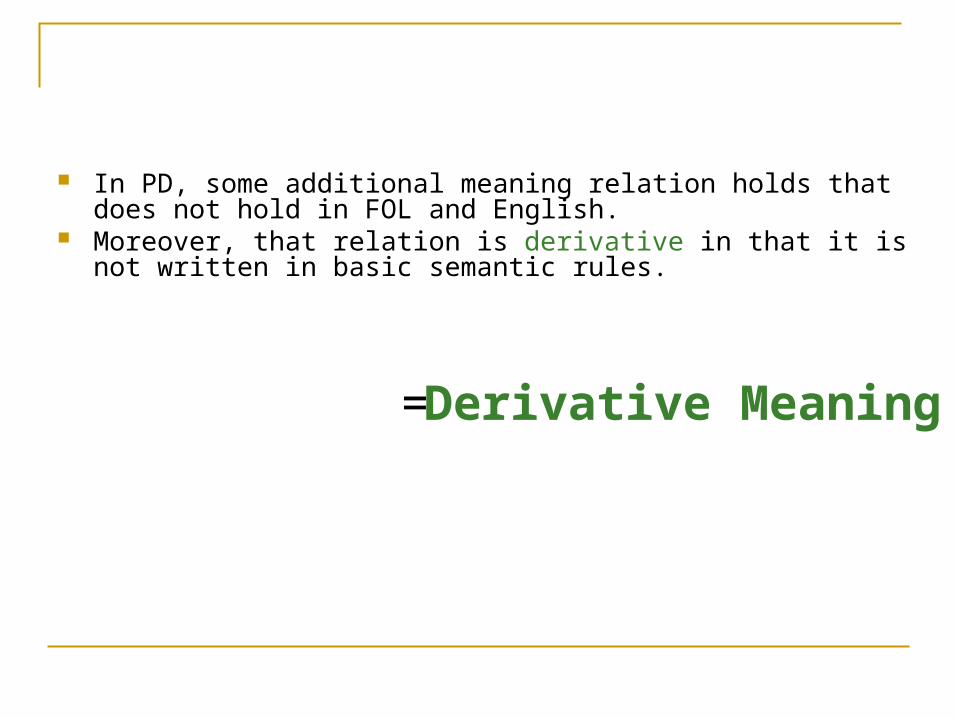
In PD, some additional meaning relation holds that does not hold in FOL and English.
Moreover, that relation is derivative in that it is not written in basic semantic rules.
Derivative Meaning=

Another example: Table
Anna Jan Piet Mieke Wim
Number of circles in a row means the number of participants that are defeated
Number of circles in a column means the number of participants that are not defeated
Extra meaning relation
Jan Mieke Wim Anna Piet
Jan O O O
Mieke O
Wim
Anna O O O O
Piet O O
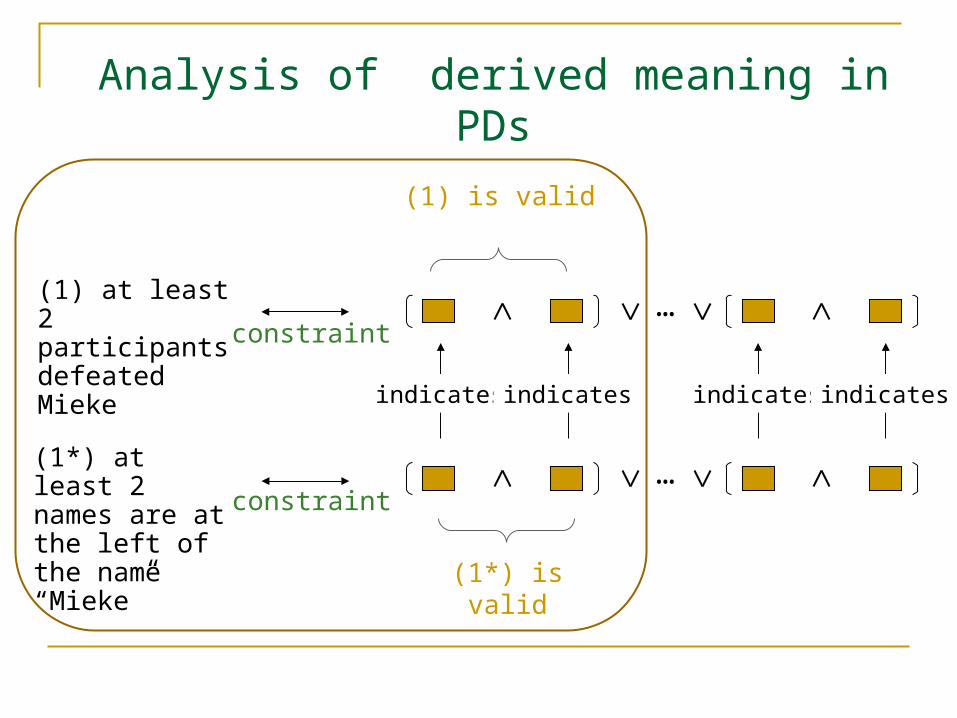
Analysis of derived meaning in PDs
(1) at least 2 participants defeated Mieke
indicates
constraint
indicates
(1*) at least 2 names are at the left of the name “Mieke”
constraint
…
…
indicates indicates
(1*) is valid
(1) is valid

Another example: Scatter plots
15
10
5
020100
15
10
5
020100
I II
The shape formed by dots means a general fact about the distribution:
• Existence of correlation, • Its strength, • Existence of an exceptional instance, etc.
Additional meaningrelation
From Tufte (1983)
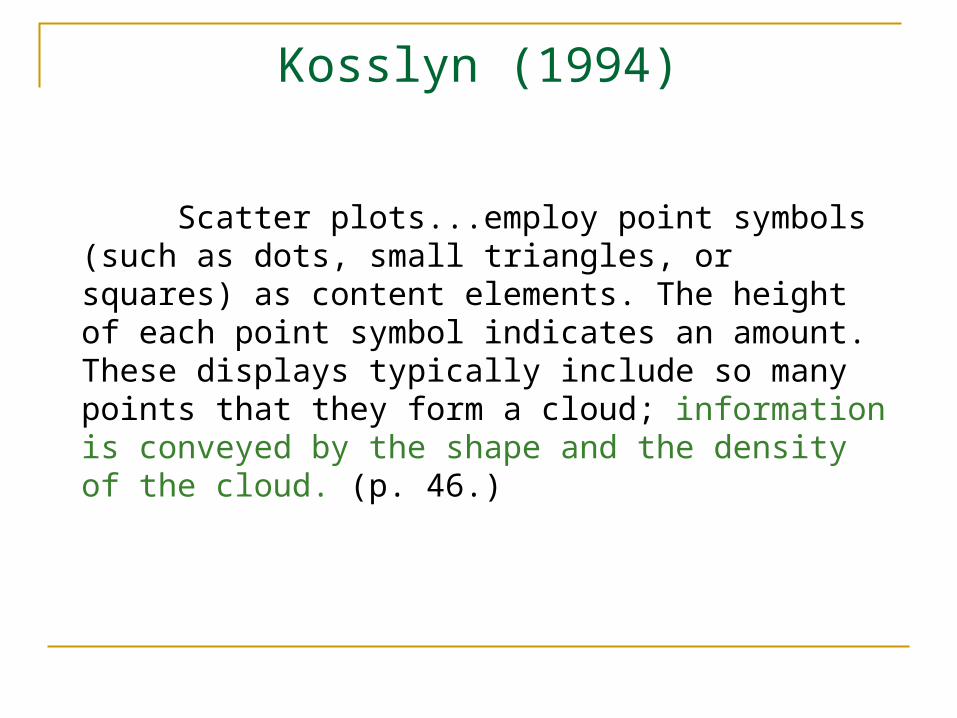
Scatter plots...employ point symbols (such as dots, small triangles, or squares) as content elements. The height of each point symbol indicates an amount. These displays typically include so many points that they form a cloud; information is conveyed by the shape and the density of the cloud. (p. 46.)
Kosslyn (1994)
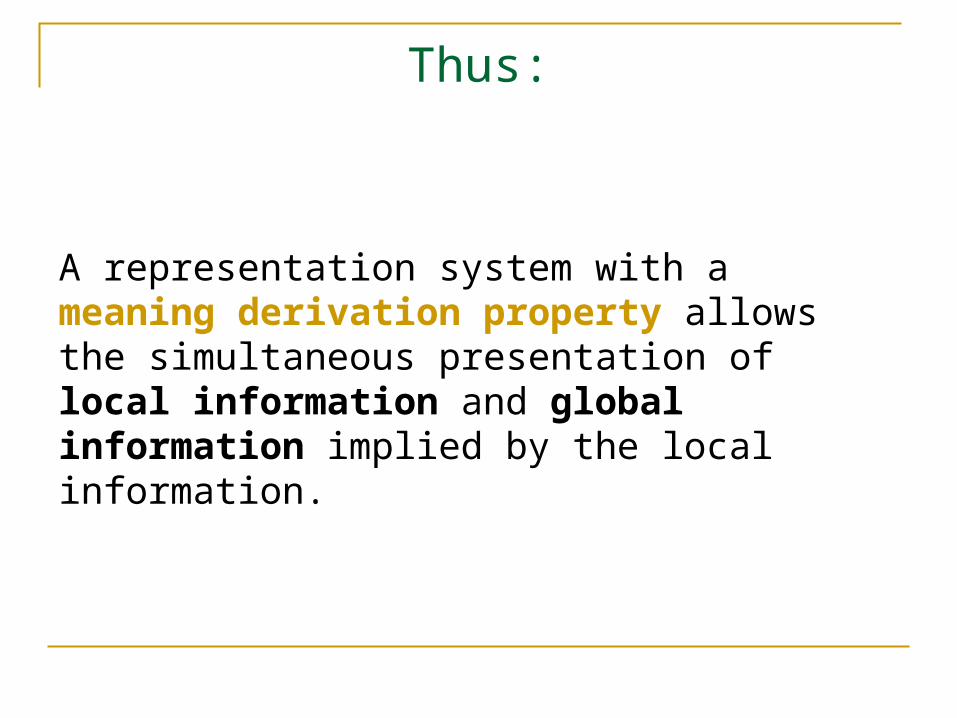
Thus:
A representation system with a meaning derivation property allows the simultaneous presentation of local information and global information implied by the local information.

“Indeed, the central purpose of many scientific diagrams is to depict relationships and interactions….If students are to understand such diagrams, they need to be able to do more than just decode the symbols used. They must also be able to uncover and assimilate salient relationships between the symbols that constitute a diagram and appreciate how these relationships map onto the real-world situation being represented.” (p. 28.)
Lowe (1989)

Influencing Factors
Context (educational, professional, …) Nature of task (recall, recognition, problem
solving, …) User ‘s prior knowledge, skills, preferences,
experiences, …


![CIW Online Dating Market Insights for Q1 2014 [CIW Whitepaper]](https://img.pdfslide.net/doc/110x75/55a58fd61a28ab6f6c8b470a/ciw-online-dating-market-insights-for-q1-2014-ciw-whitepaper.jpg)
