Embed Size (px)
Citation preview

CMPT 884, SFU, Martin Ester, 1-09 1
Graph Mining and Network Analysis
Martin Ester
Simon Fraser University
School of Computing Science
CMPT 884
Spring 2009

CMPT 884, SFU, Martin Ester, 1-09 2
Graph Mining and Network AnalysisOutline
• Graphs and networksdefinitions, examples, graph properties
• Graph pattern mining [Borgwardt & Yan 2008]frequent subgraphs, dense subgraphs
• Graph classification [Borgwardt & Yan 2008] feature-based, kernel-based
• Graph clusteringhierarchical clustering, graph cuts, block models
• Graph evolution [Leskovec & Faloutsos 2007]generative models, propagation of information
• Social network analysis [Leskovec & Faloutsos 2007]community identification, viral marketing, influential people
• Analysis of biological networksfunctional modules, evolution of protein-protein interaction networks

CMPT 884, SFU, Martin Ester, 1-09 3
Graphs and Networks
Basic Definitions
• Graph G = (V,E) V: set of vertices / nodes E V x V: set of edges
• Adjacency matrix (sociomatrix)alternative representation of a graph
• Network: used as synonym to graphmore application-oriented term
otherwise0
),(if1,
Evvy ji
ji

CMPT 884, SFU, Martin Ester, 1-09 4
Graphs and Networks
Basic Definitions
• Labeled graph set of lables L f: V L
|L| typically small
• Attributed graph
set of attributes with domains D1, . . ., Dd
f: V D1x . . . x Dd
|Di| typically large, can be continuous domain

CMPT 884, SFU, Martin Ester, 1-09 5
Graphs and Networks
Examples

CMPT 884, SFU, Martin Ester, 1-09 6
Graphs and Networks
More DefinitionsNeighbors
Degree
Clustering coefficient of node vfraction of pairs of neigbors of v that are connected
Betweenness of node vnumber of shortest paths (between any pair of nodes) in Gthat go through v
Betweenness of edge enumber of shortest paths in G that go through e
}),(|{
:nodeof
EvvVvN
vN
jiji
ii
||)deg(
:nodeof)deg(
iNv
vv

CMPT 884, SFU, Martin Ester, 1-09 7
Graphs and Networks
More DefinitionsShortest path distance between nodes v1 and v2
length of shortest path between v1 and v2 also called minimum geodesic distance
Diameter of graph Gmaximum shortest path distance for any pair of nodes in G
Effective diameter of graph G distance at which 90% of all connected pairs of nodes can be reached
Mean geodesic distance of graph G average minimum geodesic distance for any pair of nodes in
G

CMPT 884, SFU, Martin Ester, 1-09 8
Graphs and Networks
More DefinitionsSmall-world network
network with „small“ mean geodesic distance / effective diameter
MicrosoftMessenger
network

CMPT 884, SFU, Martin Ester, 1-09 9
Graphs and Networks
More Definitions
Scale-free networksnetworks with a power law degree distribution
typically between 2 and 3
)()( xfcxf
kkP )(
degree k
P(k)

CMPT 884, SFU, Martin Ester, 1-09 10
Graphs and Networks
Data Mining Scenarios
One large graph• mine dense subgraphs or clusters• analyze evolution
Many small graphs• mine frequent subgraphs
Two collections of many small graphs• classify graphs

CMPT 884, SFU, Martin Ester, 1-09 11
Graph Pattern Mining
Frequent Pattern Mining
• Given a graph dataset DB,
i.e. a set of labeled graphs G1, . . ., Gn
and a minimum support
• Find the graphs that are contained in at least of the graphs of DB
•Assumption: the more frequent, the more interestinga graph
• G contained in Gi :
G is isomorph to a subgraph of Gi
10,
n

CMPT 884, SFU, Martin Ester, 1-09 12
Graph Pattern Mining
Example

CMPT 884, SFU, Martin Ester, 1-09 13
Graph Pattern Mining
Anti-Monotonicity Property
•If a graph is frequent, ALL of its subgraphs are
frequent.
•Can prune all candidate patterns that have an
infrequent
subgraph, i.e. disregard them from further
consideration.
• The higher , the more effective the pruning

CMPT 884, SFU, Martin Ester, 1-09 14
Graph Pattern Mining
Algorithmic Schemes

CMPT 884, SFU, Martin Ester, 1-09 15
Graph Pattern Mining
Duplicate Elimination• Given existing patterns G1, . . ., Gm and newly discovered pattern G
Is G a duplicate?
• Method 1(slow)
check graph isomorphism of G with each of the Gi
graph isomorphism test is a very expensive operation
• Method 2 (faster)
transform each graph Gi into a canonical form and hash it
into a hash table
transform G in the same way and check whether there is already
a graph Gi with the same hash value
test for graph isomorphism only if such Gi already exists

CMPT 884, SFU, Martin Ester, 1-09 16
Graph Pattern Mining
Duplicate Elimination• Method 3 (fastest)
define a canonical order of subgraphs and explore them in that order
e.g., graphs in same equivalence class, if they have the same
canonical
spanning tree
and define order on the spanning trees
does not need isomorhism tests

CMPT 884, SFU, Martin Ester, 1-09 17
Graph Pattern Mining
Conclusion
• Lots of sophisticated algorithms for mining
frequent
graph patterns: MoFa, gSpan, FFSM, Gaston, . . .
• But: number of frequent patterns is exponential
• This implies three related problems:
- very high runtimes
- resulting sets of patterns hard to interpret
- minimum support threshold hard to set.

CMPT 884, SFU, Martin Ester, 1-09 18
Graph Pattern Mining
Research Directions
• Mine only closed or maximal frequent graphs
i.e. frequent graphs so that no supergraph has the same
(has at least ) support
• Summarize graph patterns
e.g., find the top k most representative graphs
• Constraint-based graph pattern mining
find only patterns that satisfy certain conditions on their
size, density, diameter . . .

CMPT 884, SFU, Martin Ester, 1-09 19
Graph Pattern Mining
Dense Graph Mining
•Assumption: the denser a graph, the more interesting
• Can add density constraint to frequent graph mining
•In the scenario of one large graph, just want to find
the dense subgraphs
•Density of graph G
•Want to find all subgraphs with density at least
•Problem is notoriously hard, even to solve
approximately
)1|(|||
||2)(
VV
EGdensity

CMPT 884, SFU, Martin Ester, 1-09 20
Graph Pattern Mining
Weak Anti-Monotonicity Property
• If a graph of size k is dense, (at least) ONE of its subgraphs of size k-1 is dense.
• Cannot prune all candidate patterns that have a subgraph which is not dense.
• But can still enumerate patterns in a level-wise manner, extending only dense patterns by another node
G’ denser than subgraph G
density = 8/12 density = 14/20

CMPT 884, SFU, Martin Ester, 1-09 21
Graph Pattern Mining
edges)1|(| V
Quasi-Cliques
• graph G is -quasi-clique if every node has at least
Gv

CMPT 884, SFU, Martin Ester, 1-09 22
Graph Pattern Mining
Mining Quasi-Cliques [Pei, Jiang & Zhang 05]
• for <1, the -quasi-clique property is not anti-monotone, not even weakly anti-monotone
G is 0.8-quasi-clique|none of the size 5 subgraphs of G is an 0.8-quasi-clique since they all have a node with degree 3 < 0.8(5-1) = 3.2

CMPT 884, SFU, Martin Ester, 1-09 23
Graph Pattern Mining
Mining Quasi-Cliques
• enumerate (all) the subgraphs
•prune based on maximum diameter of -quasi-clique G

CMPT 884, SFU, Martin Ester, 1-09 24
Graph Classification
Introduction
• given two (or more) collections of (labeled) graphs one for each of the relevant classes• e.g., collections of program flow graphs to distinguish faulty graphs from correct ones

CMPT 884, SFU, Martin Ester, 1-09 25
Graph Classification
Feature-based Graph Classification
• define set of graph featuresglobal features such as diameter, degree
distributionlocal features such as occurence of certain
subgraphs• choice of relevant subgraphs
based on domain knowledgedomain expert
based on frequencypattern mining algorithm [Huan et al 04]

CMPT 884, SFU, Martin Ester, 1-09 26
Graph Classification
)'(),()',( xxxxk
Kernel-based Graph Classification•kernel-based map two graphs x and x‘ into feature space via function compute similarity (inner product) in feature space
kernel k avoids actual mapping to feature space
•many graph kernels have been proposed e.g. [Kashima et al 2003]
•graph kernels should capture relevant graph features
and be efficient to compute [Borgwardt & Kriegel 2005]
)'(),( xx

CMPT 884, SFU, Martin Ester, 1-09 27
Graph Clustering
Introduction• group nodes into clusters such that nodes within a cluster have similar relationships (edges) while nodes in different clusters have dissimilar relationships•compared to graph classification: unsupervised•compared to graph pattern mining: global patterns,
typically every node belongs to exactly one cluster •main approaches
- hierarchical graph clustering- graph cuts- block models

CMPT 884, SFU, Martin Ester, 1-09 28
Graph Clustering
Divisive Hierarchical Clustering [Girvan and Newman 2002]
• for every edge, compute its betweenness
• remove the edge with the highest betweenness
• recompute the edge betweenness
• repeat until no more edge exists
or until specified number of clusters produced
• runtime O(m2n) where m = |E| and n = |V|
produces meaningful communities,
but does not scale to large networks

CMPT 884, SFU, Martin Ester, 1-09 29
Graph Clustering
Example
friendship network from Zachary’s karate club
hierarchical clustering(dendrogram)
shapes denote the true community

CMPT 884, SFU, Martin Ester, 1-09 30
Graph Clustering
j
iji ea
Agglomerative Hierarchical Clustering [Newman 2004]
•divisive hierarchical algorithm always produces a
clustering,
whether there is some natural cluster structure or
not
•define the modularity of a partitioning to measure its
meaningfulness (deviation from randomness)
• eij: percentage of edges between partitions i and j
• modularity Q
)( 2 i
iii ae

CMPT 884, SFU, Martin Ester, 1-09 31
Graph Clustering
Agglomerative Hierarchical Clustering
• start with singleton clusters
• in each step, perform the merge of two clusters
that leads to the largest increase of the modularity
• terminate when no more merges improve modularity
or when specified number of clusters reached
• need to consider only connected pairs of clusters
• runtime O((m+n) n) where m = |E| and n = |V|
scales much better than divisive algorithm
clustering quality quite comparable

CMPT 884, SFU, Martin Ester, 1-09 32
Graph Clustering
college football network, shapes denote conferences (true communities)

CMPT 884, SFU, Martin Ester, 1-09 33
Graph Clustering
Graph Cuts
• graph cut is a set of edges whose removal partitions the set of vertices V into two (disconnected) sets S and T
• cost of a cut is the sum of the weights of the cut edges• edge weights can be derived from node attributes, e.g. similarity of attributes (attribute vectors)• minimum cut is a cut with minimum cost

CMPT 884, SFU, Martin Ester, 1-09 34
Graph Clustering
Graph Cuts [Shi & Malik 2000]
• minimum cut tends to cut off very small, isolated components
• normalized cut
where assoc(A, V) = sum of weights of all edges in V that touch A
),(
),(
),(
),(
VBassoc
BAcut
VAassoc
BAcut

CMPT 884, SFU, Martin Ester, 1-09 35
Graph Clustering
Graph Cuts
• minimum normalized cut problem is NP-hard • but approximation can be computed by solving generalized eigenvalue problem

CMPT 884, SFU, Martin Ester, 1-09 36
Graph Clustering
Block Models [Faust &Wasserman 1992]
• actors in a social network are structurally equivalent if they
have identical relational ties to and from all the actors in a
network
•partition V into subsets of nodes that have the same relationships
i.e., edges to the same subset of V• graph represented as sociomatrix • partitions are called blocks

CMPT 884, SFU, Martin Ester, 1-09 37
Graph Clustering
Example
graph(sociomatrix)
block model(permuted and
partitionedsociomatrix)

CMPT 884, SFU, Martin Ester, 1-09 38
Graph Clustering
Algorithms
• agglomerative hierarchical clustering• CONCOR algorithm repeated calculations of correlations between rows (or columns) will eventually result in a correlation matrix consisting of only +1and -1 - calculate correlation matrix C1 from sociomatrix - calculate correlation matrix C2 from C1 - iterate until the entries are either +1 or -1
CMPT 884, SFU, Martin Ester, 1-09 39
Graph Clustering
Stochastic Block Models
• requirement of structural equivalence often too
strict
• relax to stochastic equivalence:
two actors are stochastically equivalent if the actors
are
“exchangeable” with respect to the probability
distribution
• Infinite Relational Model
[Kemp et al 2006]

CMPT 884, SFU, Martin Ester, 1-09 40
Graph Clustering
Generative Model •assign nodes to clusters
•determine link (edge) probability between clusters
•determine edges between nodes

CMPT 884, SFU, Martin Ester, 1-09 41
Graph Clustering
)()|()|( zPzRPRzP
ab
abab
B
mmBzRP
),(
),()|(
Generative Model • assumption edges conditionally independent given cluster assignments• prior P(z) assigns a probability to all possible partitions of the nodes• find z that maximizes P(z|R)
function Beta theB(.,.) and
b and a clustersbetween edges missing ofnumber theis m and
b and a clustersbetween edges ofnumber theis m where
ab
ab

CMPT 884, SFU, Martin Ester, 1-09 42
Graph Clustering
Inference
• sample from the posterior P(z|R)
using Markov Chain Monte Carlo
• possible moves:
- move a node from one cluster to another
- split a cluster
- merge two clusters
• at the end, can be recoveredab

CMPT 884, SFU, Martin Ester, 1-09 43
Graph Evolution
Introduction
•so far, have considered only the static structure of networks•but many real life networks are very dynamic and evolve rapidly in the course of time•two aspects of graph evolution
- evolution of the structure (edges): generative models
- evolution of the attributes: diffusion models •questions, e.g.
does the graph diameter increase or decrease?how does information about a new product
spread?what nodes should be targeted for viral
marketing?

CMPT 884, SFU, Martin Ester, 1-09 44
Graph Evolution
Generative Models
• Erdos Renyi model - connect each pair of nodes i.i.d. with probability p lots of theory, but does not produce power law degree distribution• Preferential attachment model - add a new node, create m out-links to existing nodes - probability of linking an existing node is proportional to its degree produces power law in-degree distribution but all nodes have the same out-degree
CMPT 884, SFU, Martin Ester, 1-09 45
Graph Evolution
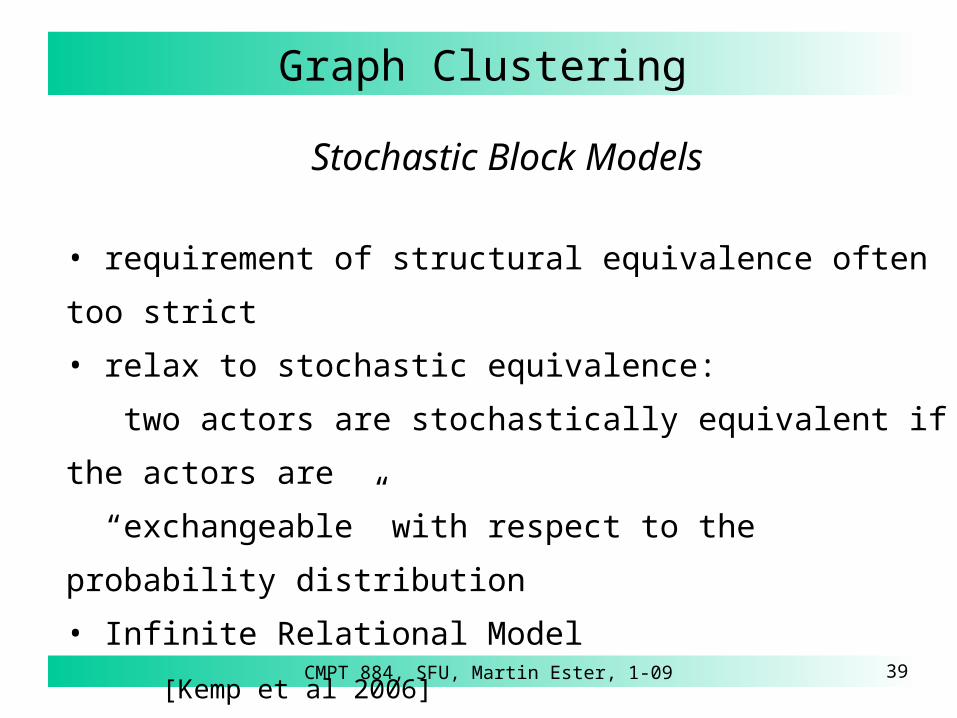
Generative Models
• Copy model - add a node and choose k, the number of edges to add - with probability β select k random vertices and link to them - with probability 1- β edges are copied from a randomly chosen node generates power law degree distributions with exponent 1/(1-β) generates communities

CMPT 884, SFU, Martin Ester, 1-09 46
Graph Evolution
Diffusion Models
• each edge (u,v) has probability puv / weight wuv
• initially, some nodes are active (e.g., a, d, e, g, i)
CMPT 884, SFU, Martin Ester, 1-09 47
Graph Evolution
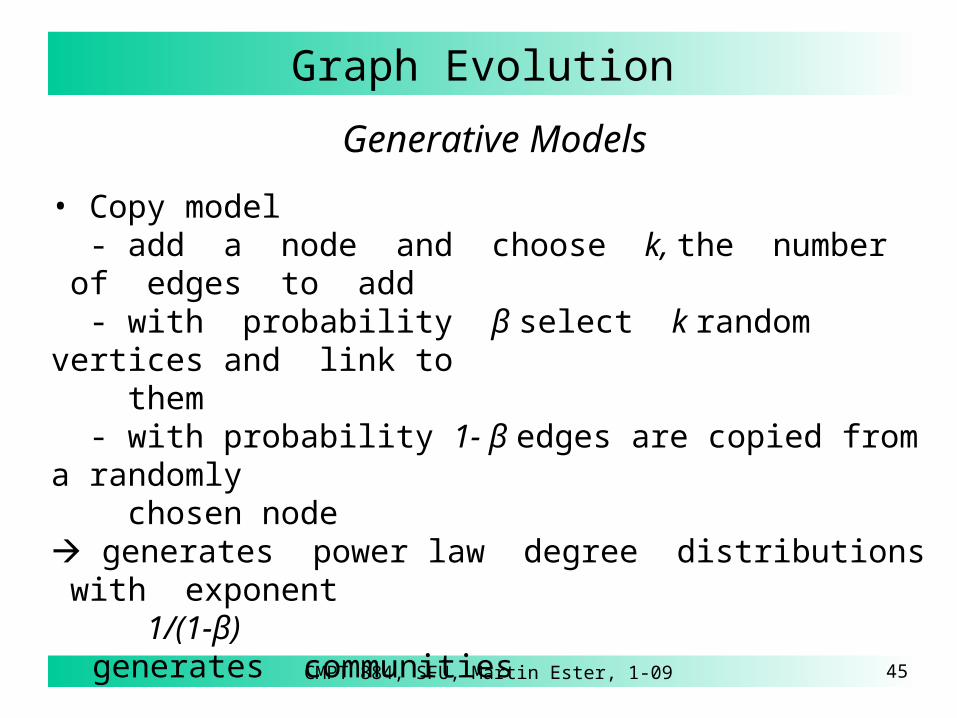
Diffusion Models
• Threshold model [Granovetter 78]
- each node has a threshold t - node u is activated when
where active(u) are the active neighbors of u - deterministic activation• Independent contagion model [Dodds & Watts 2004] - when node u becomes active, it activates each of its neighbors v with probability puv
- a node has only one chance to influence its neighbors - probabilistic activation
)(uactivevuv tw

CMPT 884, SFU, Martin Ester, 1-09 48
Social Network Analysis
Viral Marketing
• Customers becoming less susceptible to mass marketing• Mass marketing impractical for unprecedented variety of products online•Viral marketing successfully utilizes social networks for marketing products and services• We are more influenced by our friends than strangers• 68% of consumers consult friends and family before purchasing home electronics (Burke 2003)• E.g., Hotmail gains 18 million users in 12 months, spending only $50,000 on traditional advertising

CMPT 884, SFU, Martin Ester, 1-09 49
Social Network Analysis
Most Influential Nodes [Kempe et al 2003]
• S: initial active node set • f(S): expected size of final active set •Most influential set of size k: the set S of k nodes producing largest f(S), if activated

CMPT 884, SFU, Martin Ester, 1-09 50
Social Network Analysis
Most Influential Nodes
• Can use various diffusion models• Diminishing returns: pv(u,S) ≥ pv(u,T) if S ⊆T where pv(u,S) denotes the marginal gain of f(S) when adding u to S• Independent contagion model has diminishing returns• Greedy algorithm repeatedly select node with maximum marginal gain•Performance guarantee solution of greedy algorithm is within (1‐1/e) ~63% of optimal solution• Reason: f is submodular f submodular: if S ⊆T then f(S∪{x}) –f(S) ≥ f(T∪{x}) –f(T)

CMPT 884, SFU, Martin Ester, 1-09 51
Social Network Analysis
Viral Marketing
Probability of buying increases with the first 10 recommendationsDiminishing returns for further recommendations (saturation)
DVD purchases

CMPT 884, SFU, Martin Ester, 1-09 52
Social Network Analysis
Viral Marketing
Probability of joining community increases sharply with the first 10 friends in the community Absolute values of probabilities are very small
LiveJournalcommunitymembership

CMPT 884, SFU, Martin Ester, 1-09 53
Social Network Analysis
Role of Communities
• Consider connectedness of friends• E.g., x and y have both three friends in the community
- x’s friends are independent- y’s friends are all connected
•Who is more likely to join the community?

CMPT 884, SFU, Martin Ester, 1-09 54
Social Network Analysis
Role of Communities
• Competing sociological theories
• Information argument [Granovetter 1973]
unconnected friends give independent support
• Social capital argument [Coleman 1988]
safety / trust advantage in having friends
who know each other• In LiveJournal, community joining probability increases with more connections among friends in community Independent contagion model too simplistic for real life data

CMPT 884, SFU, Martin Ester, 1-09 55
Analysis of Biological Networks
Genes and Proteins
• Proteins are the basic building blocks of cells and of life
protein = sequence of amino-acids (20 letters)• Genes are protein blueprints, coding the information necessary to assemble proteins
gene = sequence of nucleotides / bases (4 letters)•Gene expression constructs proteins in two steps: 1) Transcription
process of synthesizing RNA from DNA template
2) TranslationRNA is deciphered to synthesize
protein

CMPT 884, SFU, Martin Ester, 1-09 56
Analysis of Biological Networks
Transcription
Enzyme (RNA polymerase)synthesizes a complementarystrand of mRNA from aportion of unwound DNAin three steps:- initiation,- elongation,- termination.

CMPT 884, SFU, Martin Ester, 1-09 57
Analysis of Biological Networks
Transcription factors
• operon: set of genes regulated / expressed as a unit
• two types of operons
operon turned ON by some transcription factor (promoter protein)
operon turned OFF by transcription factor (repressor protein)
Promoter – binding site
Repressor – binding site
Structural Genes – DNA sequence for specific proteins
OperatorGene 1 Gene 3Gene 2
Promoter

CMPT 884, SFU, Martin Ester, 1-09 58
Analysis of Biological Networks
Transcription factors
repressibleoperon

CMPT 884, SFU, Martin Ester, 1-09 59
Analysis of Biological Networks
Translation• codon = triplet of DNA bases• 64 codons make up the “alphabet” of proteins
each coding a specific amino acid• three of the codons code for termination of the message
• codons contained in mRNA are translated into proteins
site of translation is the ribosome

CMPT 884, SFU, Martin Ester, 1-09 60
Analysis of Biological Networks
Systems Biology
• Reductionist biology reduces biological systems to
small
components and analyzes them separately
e.g., expression pattern of single gene.
• Systems biology studies the interactions between the
components of biological systems, and how these
interactions
give rise to the function and behavior of that system.
• Networks are essential formalism to represent
biological
systems.
CMPT 884, SFU, Martin Ester, 1-09 61
Analysis of Biological Networks
Biological Networks
•Nodes often represent proteins or genes
•Edges represent some sort of bio-chemical
interactions
•Many types of networks, e.g.
- gene regulatory networks
- protein-protein interaction networks

CMPT 884, SFU, Martin Ester, 1-09 62
Analysis of Biological Networks
Gene Regulatory Networks
• Genes interact with each other (indirectly through their RNA and protein expression products)• control the rates at which genes in the network are transcribed into mRNA

CMPT 884, SFU, Martin Ester, 1-09 63
Analysis of Biological Networks
Protein-Protein Interaction Networks [Wodak 2006]
Network of physically interacting proteins
B
Complexesare the cell’sfactories, e.g.
ribosome

CMPT 884, SFU, Martin Ester, 1-09 64
Analysis of Biological Networks
Protein-Protein Interaction Networks
2R = 0.90
1
10
100
1000
1 10 100 1000Degree
Num
ber
of p
rote
ins
Average node degree = 12.530 Average complex size = 5.245
R2 = 0.72
1
10
100
1000
1 10 100 1000
Complex size
Num
ber
of c
ompl
exes

CMPT 884, SFU, Martin Ester, 1-09 65
Analysis of Biological Networks
Data analysispipeline
(I)
(II)
(V)
(III)
(IV)
Validation and Analysis
MALDI/MS
LC/MS
Deriving the PPI Network
Identifying Functional Modules
CMPT 884, SFU, Martin Ester, 1-09 66
Analysis of Biological Networks
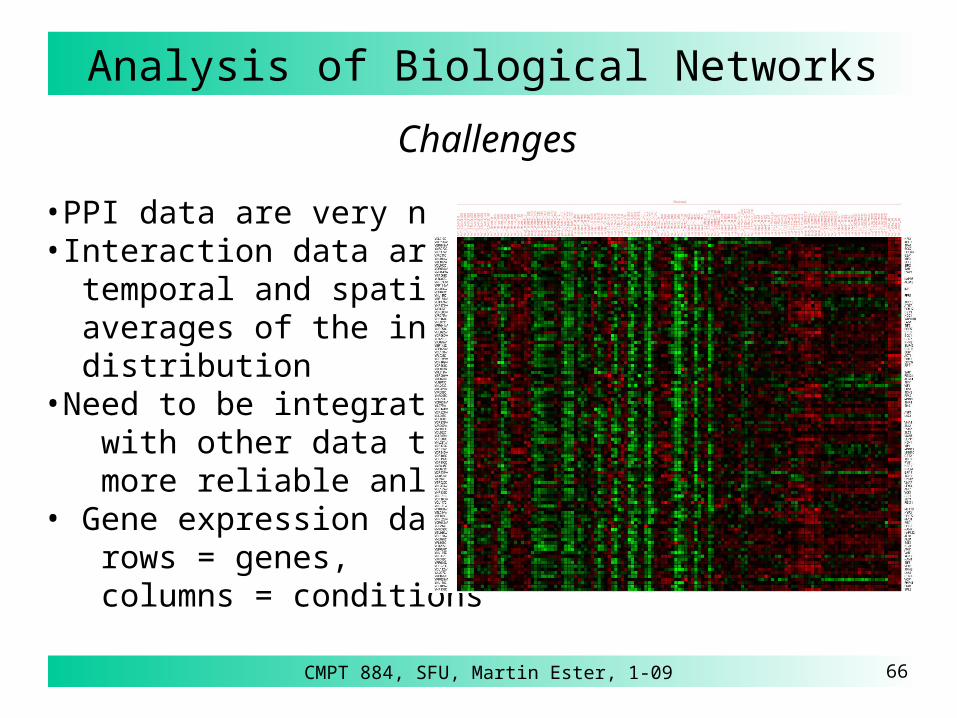
Challenges
•PPI data are very noisy•Interaction data are temporal and spatial averages of the in-vivo distribution•Need to be integrated with other data types for more reliable anlysis• Gene expression data rows = genes, columns = conditions
CMPT 884, SFU, Martin Ester, 1-09 67
Analysis of Biological Networks
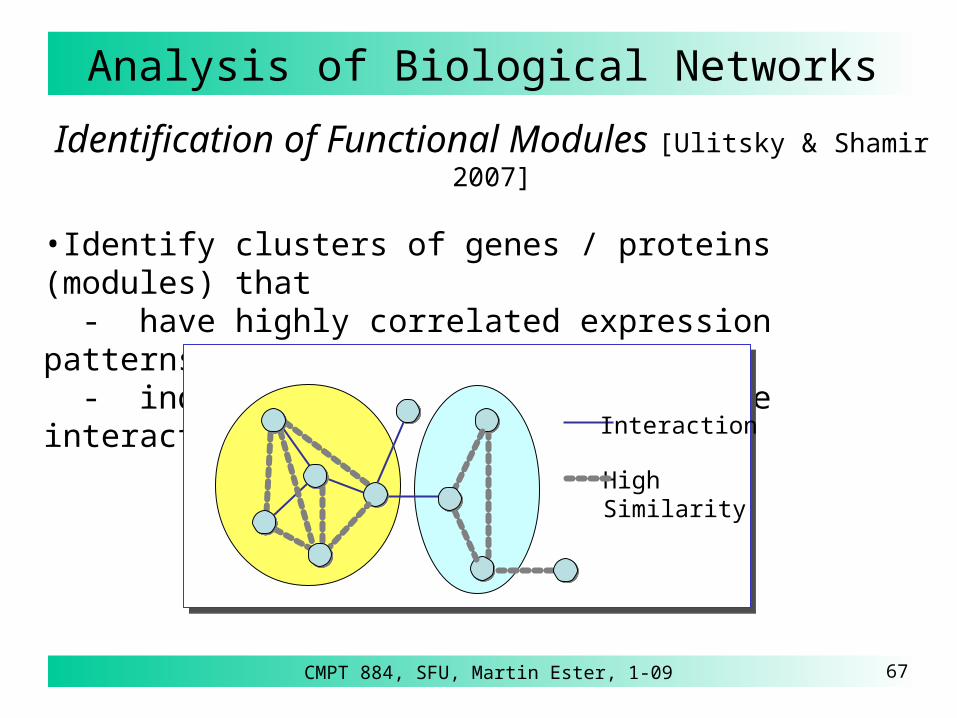
Identification of Functional Modules [Ulitsky & Shamir 2007]
•Identify clusters of genes / proteins (modules) that - have highly correlated expression patterns, and - induce connected subgraphs in the interaction network
Interaction
HighSimilarity

CMPT 884, SFU, Martin Ester, 1-09 68
Analysis of Biological Networks
Identification of Functional Modules
Sample clusters

CMPT 884, SFU, Martin Ester, 1-09 69
Analysis of Biological Networks
)|( ijij MSP
Problem Definition
• module finding as a hypothesis testing problem
• assume that the observed pairwise similarity values
Sij are a
mixture of two Gaussian distributions:
- for pairs of genes that are co-expressed (mates):
- for non-mate gene pairs:• assume that large fraction βm of pairs within cluster are mates
• null hypothesis H0: cluster is a set of unrelated genes
• alternative hypothesis H1: cluster genes are related,
i.e. cluster contains a much higher proportion of mates than gene pairs that do not belong to the same cluster
)|( ijij MSP

CMPT 884, SFU, Martin Ester, 1-09 70
Analysis of Biological Networks
jimmij
ijjmijjij
mijij
RR
MSiPMiSPHSP
where
)|()1()|()|( 1
jimnij
ijjnijjij
nijij
RRp
MSiPMiSPHSP
where
)|()1()|()|( 0
Problem Definition
•
and Ri, Rj prior probabilities of genes i, j, to be highly
expressed (regulated)
•
pm: probability of mates among all the regulated
genes
•use likelihood ratio between two hypotheses as edge
weights:)|(
)|(log
0
1
HSP
HSPw
ij
ijij

CMPT 884, SFU, Martin Ester, 1-09 71
Analysis of Biological Networks
Algorithm
• find disjoint sets U1, U2,..., Um that induce connected
and heavy subgraphs
• exact optimization intractable
• heuristic algorithm with three phases:
- seed generation
- greedy optimization
- significance filtering

CMPT 884, SFU, Martin Ester, 1-09 72
Analysis of Biological Networks
Algorithm
• simultaneous optimization of all the seeds
• potential moves:
- node addition
- node removal
- assignment change
- module merge

CMPT 884, SFU, Martin Ester, 1-09 73
Analysis of Biological Networks
Experimental EvaluationSubnetwork Size Front Enriched GO terms P-value TFs P-Value
1 120 119 processing of 20S pre-rRNA < 0.001 Fhl1 4.82E-16rRNA processing < 0.001 Rap1 2.89E-1135S primary transcript processing < 0.001 Sfp1 2.98E-08ribosomal large subunit assembly and maintenance 0.019rRNA modification < 0.001ribosome biogenesis 0.029
2 120 118 translational elongation < 0.001 Fhl1 1.03E-053 120 118 processing of 20S pre-rRNA < 0.001
rRNA processing 0.0335S primary transcript processing 0.011ribosomal large subunit assembly and maintenance 0.019ribosomal large subunit biogenesis < 0.001
5 120 112 signal transduction during filamentous growth 0.01 Ste12 5.41E-13conjugation with cellular fusion < 0.001 Dig1 5.41E-13
6 120 99 transcription from RNA polymerase III promoter < 0.001transcription from RNA polymerase I promoter 0.006
7 120 107 ergosterol biosynthesis < 0.001hexose transport 0.019
8 114 85 chromatin remodeling 0.0511 120 114 pseudohyphal growth 0.01 Msn2 3.17E-04
response to stress < 0.001 Msn4 1.82E-1214 120 102 ubiquitin-dependent protein catabolism 0.04715 120 96 nuclear mRNA splicing, via spliceosome < 0.00116 89 61 ubiquitin-dependent protein catabolism < 0.001 Rpn4 6.44E-0617 120 109 response to stress < 0.001 Msn4 1.74E-03
mitochondrial electron transport < 0.00118 87 59 nuclear mRNA splicing, via spliceosome 0.01220 46 35 pyridoxine metabolism 0.045
GO:Gene
Ontology
p-value: probability
that all genes of cluster share GO term by chance

CMPT 884, SFU, Martin Ester, 1-09 74
Analysis of Biological Networks
Experimental Evaluation
0
20
40
60
80
100
120
Matisse Co-Clustering CLICK Random
GO-Process
GO-Compartment
MIPS Phenotypes
KEGG Pathw ays
% o
f m
od
ule
s
% of modules with enriched GO term at p< 10-3

CMPT 884, SFU, Martin Ester, 1-09 75
Graph Mining and Network Analysis
References
• R. Albert and A.L. Barabasi: Emergence of scaling in random networks, Science, 1999• Karsten M. Borgwardt, Hans-Peter Kriegel: Shortest-Path Kernels on Graphs, ICDM 2005• Karsten Borgwardt, Xifeng Yan: Graph Mining and Graph Kernels, Tutorial KDD 2008• Peter Sheridan Dodds and Duncan J.Watts: Universal Behavior in a Generalized Model of Contagion, Phys. Rev. Letters, 2004• P. Erdos and A. Renyi: On the evolution of random graphs, Publication of the Mathematical Institute of the Hungarian Acadamy of Science, 1960• K. Faust and S.Wasserman: Blockmodels: Interpretation and evaluation, Social Networks,14, 1992• Girvan M. and Newman M. E. J., Community structure in social and biological networks, Natl. Acad. Sci. USA, 2002

CMPT 884, SFU, Martin Ester, 1-09 76
Graph Mining and Network Analysis
References (contd.)
• Mark Granovetter: Threshold Models of Collective Behavior, American Journal of Sociology, Vol. 83, No. 6, 1978• J. Huan, W. Wang, D. Bandyopadhyay, J. Snoeyink, J. Prins, and A. Tropsha: Mining spatial motifs from protein structure graphs, RECOMB 2004 • H. Kashima,K. Tsuda, and A. Inokuchi: Marginalized kernels between labeled graphs, ICML 2003• Kemp, C., Tenenbaum, J. B., Griffiths, T. L., Yamada, T. & Ueda, N.: Learning systems of concepts with an infinite relational model, AAAI 2006• D. Kempe, J Kleinberg, É Tardos: Maximizing the spread of influence through a social network, KDD 2003• J.Kleinberg, S. R.Kumar, P.Raghavan, S.Rajagopalan and A.Tomkins: The web as a graph: Measurements, models and methods, COCOON 1998• Jure Leskovec and Christos Faloutsos: Mining Large Graphs, Tutorial ECML/PKDD 2007

CMPT 884, SFU, Martin Ester, 1-09 77
Graph Mining and Network Analysis
References (contd.)
• M. E. J. Newman: Fast algorithm for detecting community structure in networks, Phys. Rev. E 69, 2004 • Jian Pei, Daxin Jiang, Aidong Zhang: On Mining CrossGraph QuasiCliques, KDD 2005• Jianbo Shi and Jitendra Malik: Normalized Cuts and Image Segmentation, IEEE Transactions on Pattern Analysis and Machine Intelligence, Vol. 22, No. 8, 2000• Igor Ulitsky and Ron Shamir: Identification of Functional Modules using Network
Topology and High-Throughput Data, BMC Systems Biology 1:8, 2007• Shoshana Wodak: From High Throughput Pull-Downs To Protein Complexes: Building a Model of the Physical Interactome of Yeast, Swiss-Prot Fortaleza 2006
![SFU, CMPT 741, Fall 2009, Martin Ester 350 Graph Mining and Social Network Analysis Outline Graphs and networks Graph pattern mining [Borgwardt & Yan 2008]](https://img.pdfslide.net/doc/110x75/56649d265503460f949fcaac/sfu-cmpt-741-fall-2009-martin-ester-350-graph-mining-and-social-network.jpg)