Embed Size (px)
Citation preview
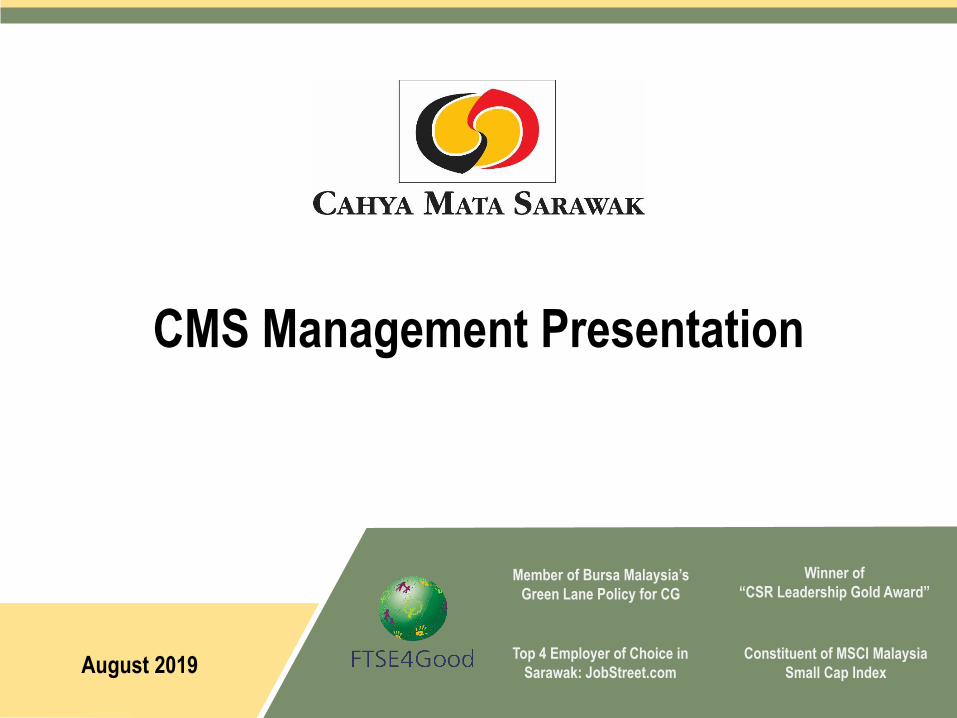
Constituent of MSCI Malaysia
Small Cap Index
Member of Bursa Malaysia’s
Green Lane Policy for CG
Winner of
“CSR Leadership Gold Award”
Top 4 Employer of Choice in
Sarawak: JobStreet.com August 2019
CMS Management Presentation

This presentation may contain forward-looking statements that involve assumptions, risks and uncertainties.
Actual future performance, outcomes and results may differ materially from those expressed in forward-looking
statements as a result of a number of risks, uncertainties and assumptions. Representative examples of these
factors include (without limitation) general industry and economic conditions, interest rate trends, cost of capital
and capital availability, competition from other developments or companies, changes in operating expenses
(including employee wages, benefits and training costs), governmental and public policy changes and the
continued availability of financing in the amounts and the terms necessary to support future business. You are
cautioned not to place undue reliance on these forward-looking statements, which are based on the current view
of management on future events.
The information contained in this presentation has not been independently verified. No representation or
warranty expressed or implied is made as to, and no reliance should be placed on, the fairness, accuracy,
completeness or correctness of the information or opinions contained in this presentation. Neither Cahya Mata
Sarawak Berhad (“CMSB”) or any of its affiliates, advisers or representatives shall have any liability whatsoever
(in negligence or otherwise) for any loss howsoever arising, whether directly or indirectly, from any use, reliance
or distribution of this presentation or its contents or otherwise arising in connection with this presentation.
The past performance of CMSB is not indicative of the future performance of CMSB.
The value of shares in CMSB (“Shares”) and the income derived from them may fall as well as rise. Shares are
not obligations of, deposits in, or guaranteed by, CMSB or any of its affiliates. An investment in Shares is subject
to investment risks, including the possible loss of the principal amount invested.
2
Disclaimer
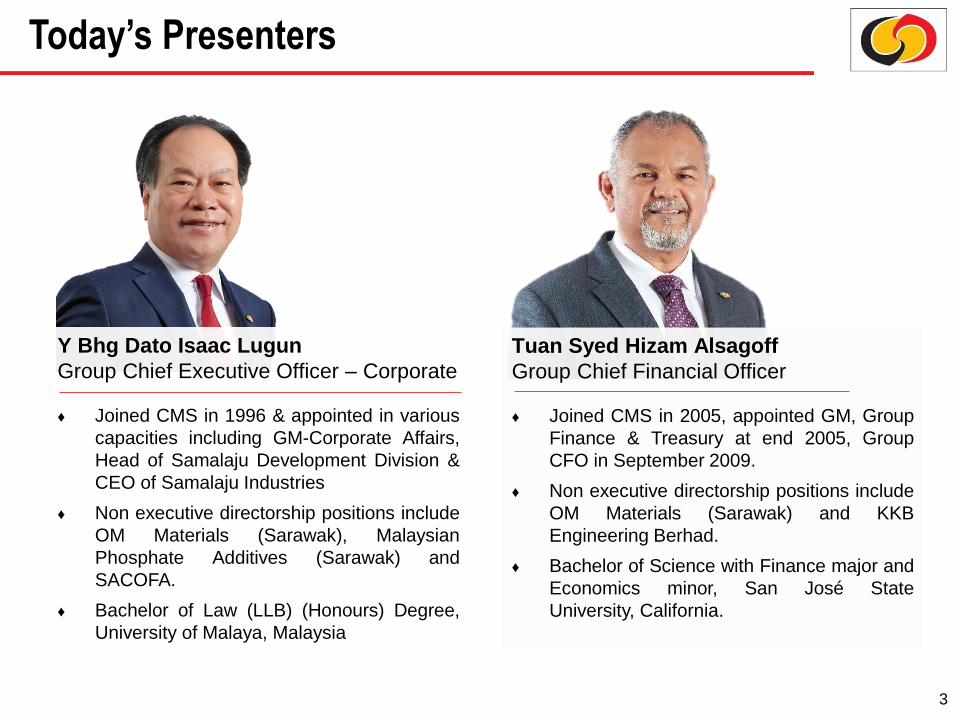
Today’s Presenters
Tuan Syed Hizam Alsagoff
Group Chief Financial Officer
♦ Joined CMS in 2005, appointed GM, Group
Finance & Treasury at end 2005, Group
CFO in September 2009.
♦ Non executive directorship positions include
OM Materials (Sarawak) and KKB
Engineering Berhad.
♦ Bachelor of Science with Finance major and
Economics minor, San José State
University, California.
3
Y Bhg Dato Isaac Lugun
Group Chief Executive Officer – Corporate
♦ Joined CMS in 1996 & appointed in various
capacities including GM-Corporate Affairs,
Head of Samalaju Development Division &
CEO of Samalaju Industries
♦ Non executive directorship positions include
OM Materials (Sarawak), Malaysian
Phosphate Additives (Sarawak) and
SACOFA.
♦ Bachelor of Law (LLB) (Honours) Degree,
University of Malaya, Malaysia
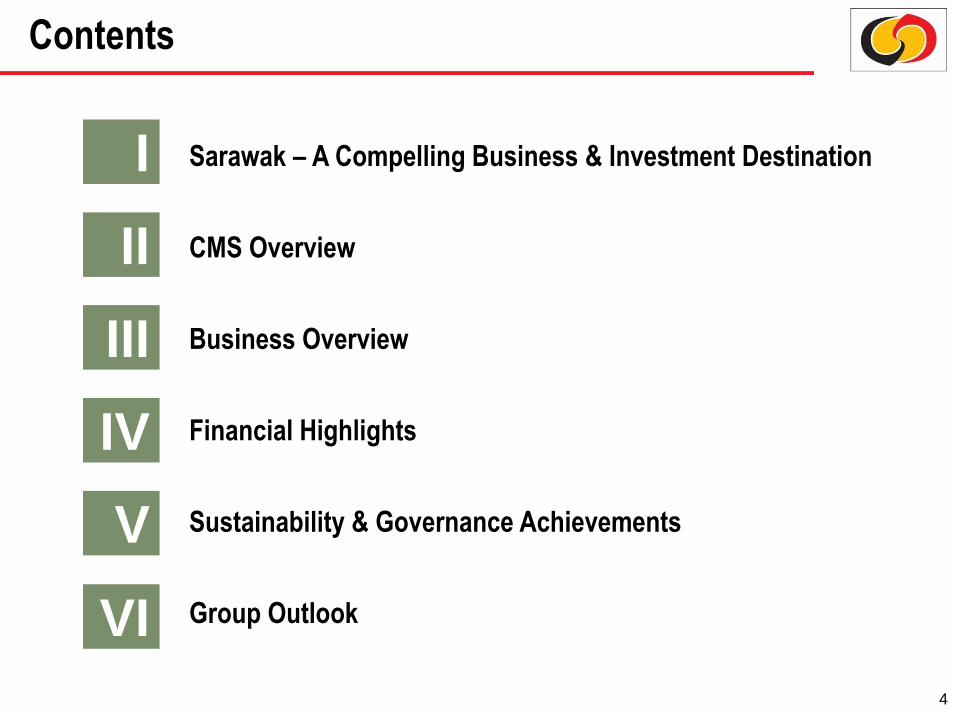
Contents
Sarawak – A Compelling Business & Investment Destination
CMS Overview
Business Overview
Financial Highlights
Sustainability & Governance Achievements
Group Outlook
I
II
III
IV
V
VI
4

5
I. Sarawak – A Compelling Business & Investment Destination
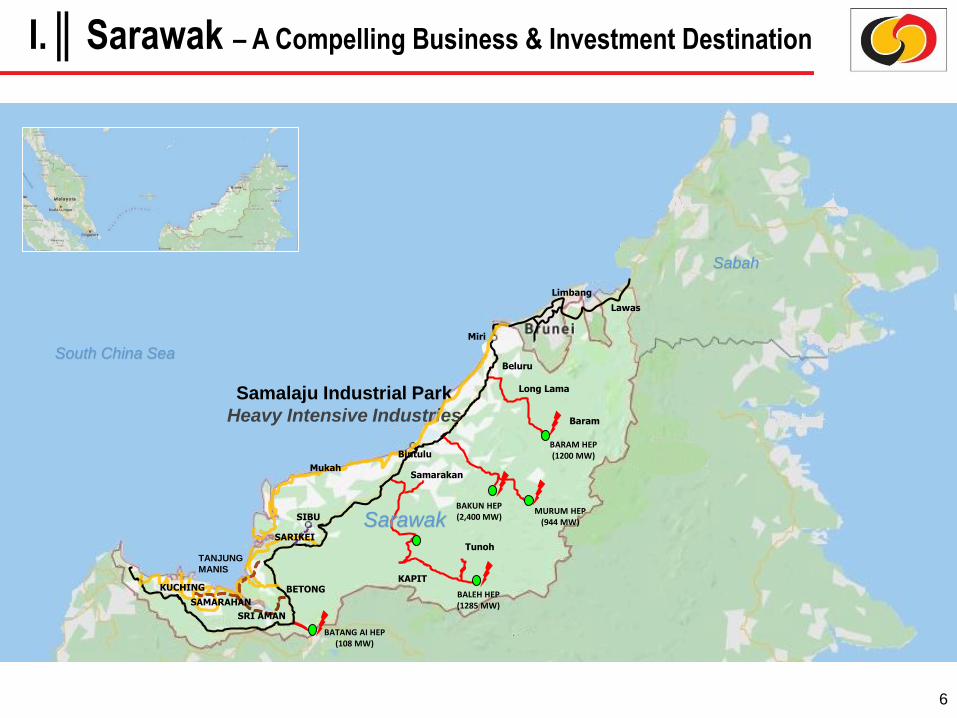
I. ║Sarawak – A Compelling Business & Investment Destination
Lawas
Miri
KAPIT
BAKUN HEP(2,400 MW)
BALEH HEP(1285 MW)
BARAM HEP (1200 MW)
Long Lama
Beluru
MURUM HEP (944 MW)
TunohTANJUNG
MANIS
Baram
Samarakan
BATANG AI HEP(108 MW)
BETONG
SIBU
Samalaju Industrial Park
Heavy Intensive Industries
South China Sea
Sabah
Sarawak
Bintulu
Mukah
KUCHING
SARIKEI
SAMARAHAN
SRI AMAN
Limbang
6
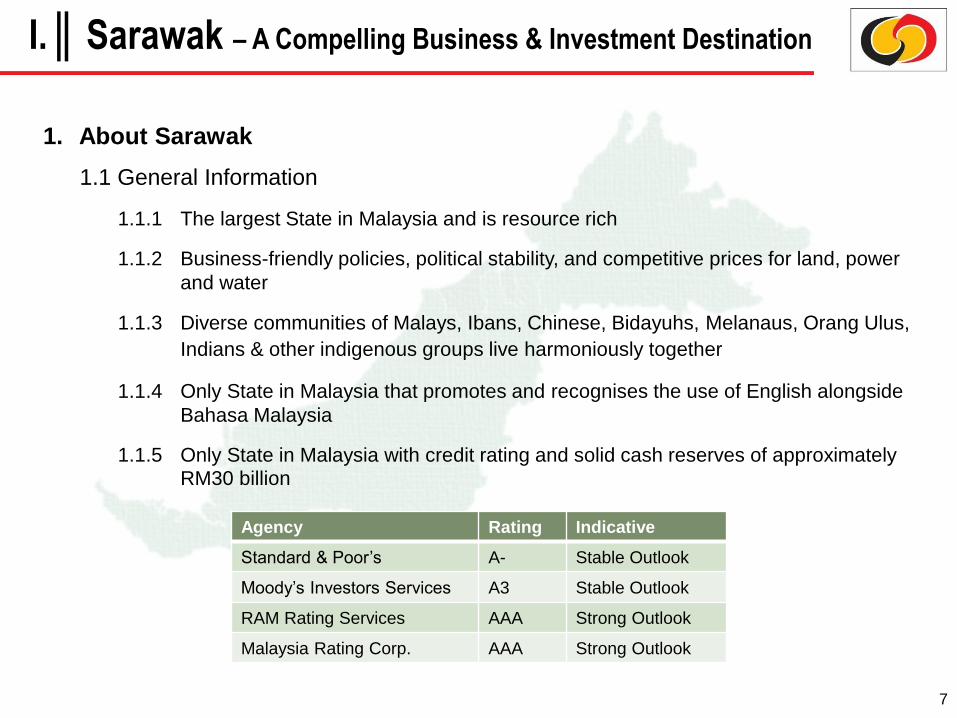
1. About Sarawak
1.1 General Information
1.1.1 The largest State in Malaysia and is resource rich
1.1.2 Business-friendly policies, political stability, and competitive prices for land, power
and water
1.1.3 Diverse communities of Malays, Ibans, Chinese, Bidayuhs, Melanaus, Orang Ulus,
Indians & other indigenous groups live harmoniously together
1.1.4 Only State in Malaysia that promotes and recognises the use of English alongside
Bahasa Malaysia
1.1.5 Only State in Malaysia with credit rating and solid cash reserves of approximately RM30 billion
7
Agency Rating Indicative
Standard & Poor’s A- Stable Outlook
Moody’s Investors Services A3 Stable Outlook
RAM Rating Services AAA Strong Outlook
Malaysia Rating Corp. AAA Strong Outlook
I. ║Sarawak – A Compelling Business & Investment Destination
8
II. CMS Overview
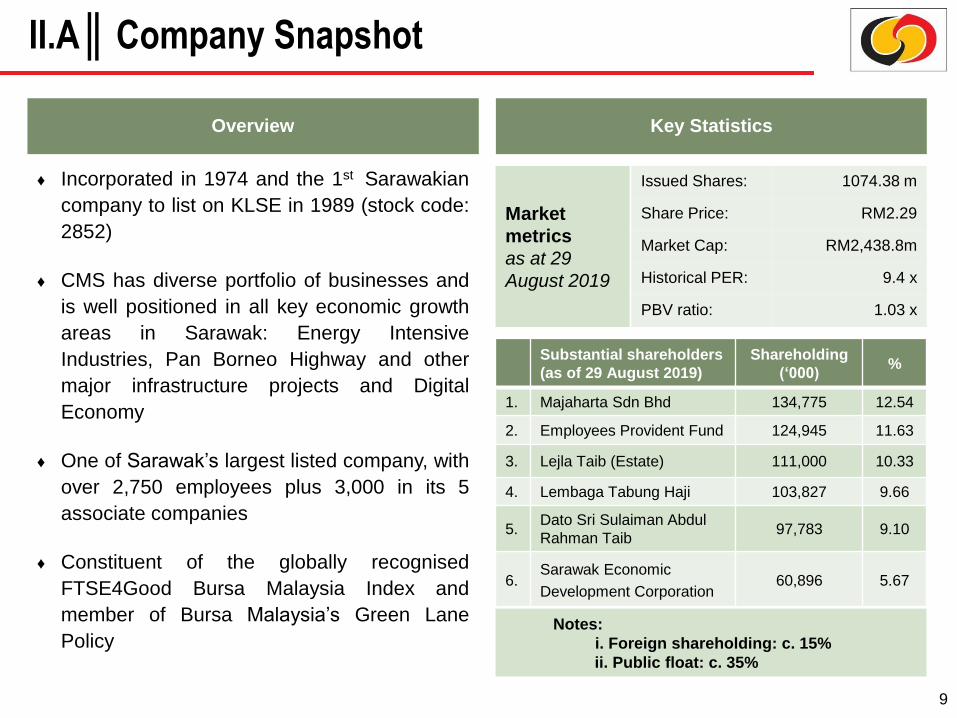
Overview Key Statistics
Issued Shares: 1074.38 m
Share Price: RM2.29
Market Cap: RM2,438.8m
Historical PER: 9.4 x
PBV ratio: 1.03 x
Market
metrics
as at 29
August 2019
♦ Incorporated in 1974 and the 1st Sarawakian
company to list on KLSE in 1989 (stock code:
2852)
♦ CMS has diverse portfolio of businesses and
is well positioned in all key economic growth
areas in Sarawak: Energy Intensive
Industries, Pan Borneo Highway and other
major infrastructure projects and Digital
Economy
♦ One of Sarawak’s largest listed company, with
over 2,750 employees plus 3,000 in its 5
associate companies
♦ Constituent of the globally recognised
FTSE4Good Bursa Malaysia Index and
member of Bursa Malaysia’s Green Lane
Policy
Substantial shareholders
(as of 29 August 2019)
Shareholding
(‘000)%
1. Majaharta Sdn Bhd 134,775 12.54
2. Employees Provident Fund 124,945 11.63
3. Lejla Taib (Estate) 111,000 10.33
4. Lembaga Tabung Haji 103,827 9.66
5.Dato Sri Sulaiman Abdul
Rahman Taib97,783 9.10
6.Sarawak Economic
Development Corporation 60,896 5.67
Notes:
i. Foreign shareholding: c. 15%
ii. Public float: c. 35%
II.A ║Company Snapshot
9
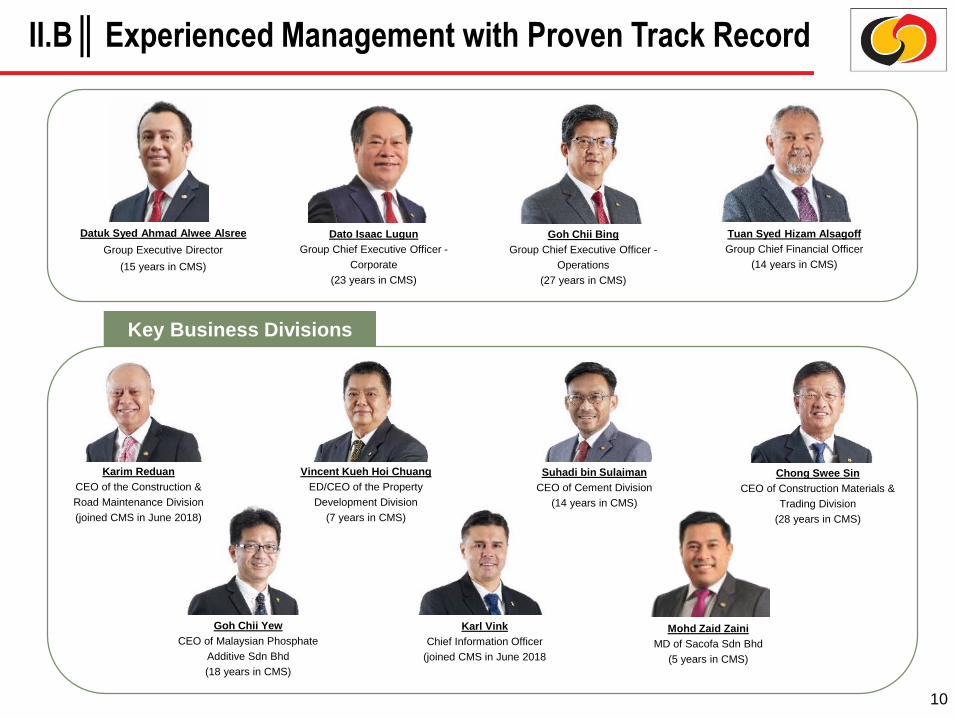
II.B ║Experienced Management with Proven Track Record
Goh Chii Yew
CEO of Malaysian Phosphate
Additive Sdn Bhd
(18 years in CMS)
Karl Vink
Chief Information Officer
(joined CMS in June 2018
Mohd Zaid Zaini
MD of Sacofa Sdn Bhd
(5 years in CMS)
Chong Swee Sin
CEO of Construction Materials &
Trading Division
(28 years in CMS)
Suhadi bin Sulaiman
CEO of Cement Division
(14 years in CMS)
Vincent Kueh Hoi Chuang
ED/CEO of the Property
Development Division
(7 years in CMS)
Karim Reduan
CEO of the Construction &
Road Maintenance Division
(joined CMS in June 2018)
Key Business Divisions
Dato Isaac Lugun
Group Chief Executive Officer -
Corporate
(23 years in CMS)
Goh Chii Bing
Group Chief Executive Officer -
Operations
(27 years in CMS)
Tuan Syed Hizam Alsagoff
Group Chief Financial Officer
(14 years in CMS)
Datuk Syed Ahmad Alwee Alsree
Group Executive Director
(15 years in CMS)
10

Rationalisation of businesses to focus on key competencies in
Sarawak & SCORE
♦ Commenced
manufacturing
Ordinary
Portland
Cement at
Sarawak’s 1st
grinding plant.
♦ Restructuring of
financial
services
business.
♦ CMS’ futures &
stockbroking
businesses
merged with
Kenanga in
exchange for
shares in
Kenanga
♦ Disposed
RHB Bhd for
RM2.25b
♦ Disposal of
UBG Bhd♦ Acquired
50% stake in
SACOFA
♦ OM Materials
achieved
commercial
production
♦ CMS ushered
into a new era
of leadership
♦ Established
as Cement
Manufacturers
Sarawak♦ Listed on
KLSE♦ Acquired
♦ RHB Bhd
♦ Disposal of CMS
Roads and
Pavement to UBG
Bhd.
♦ Acquired 20% stake
in KKB Engineering
Bhd
♦ Re-acquired
CMS Roads
and
Pavement
♦ MPA signed
both PPA &
EPC
agreements
♦ Launched
East
Malaysia’s
First
Integrated
Cement
Plant
♦ Strategic
investments
began to
drive the
next wave
of growth
20182017201620152014201120102008200720022001198919781974
II.C ║Corporate Milestones
11

12
III. Business Overview
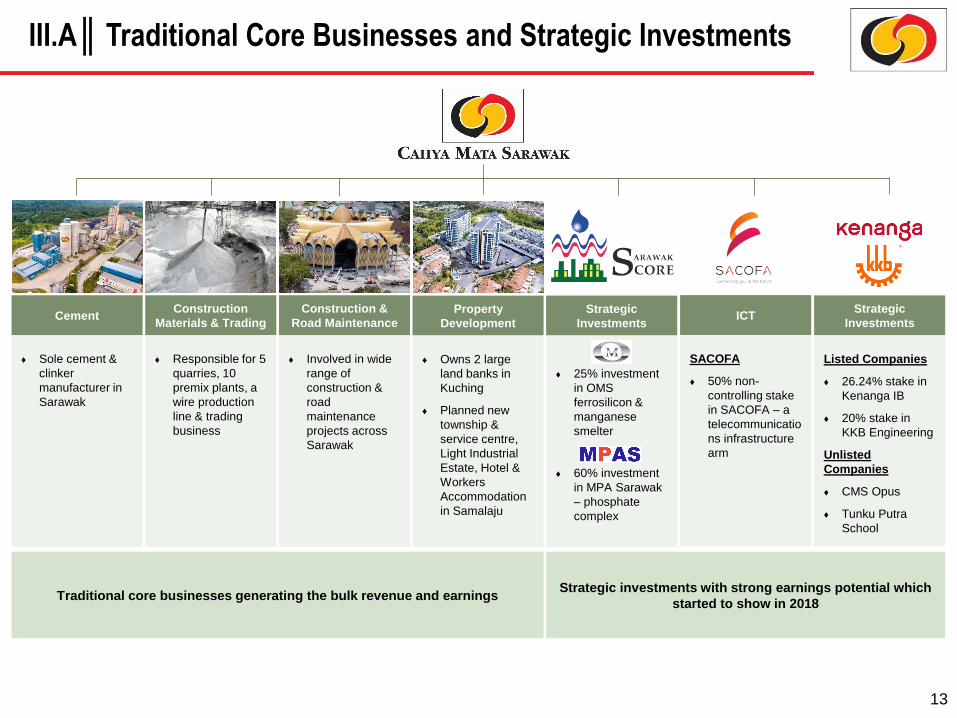
Strategic
Investments
♦ 25% investment
in OMS
ferrosilicon &
manganese
smelter
♦ 60% investment
in MPA Sarawak
– phosphate
complex
Traditional core businesses generating the bulk revenue and earnings Strategic investments with strong earnings potential which
started to show in 2018
III.A ║Traditional Core Businesses and Strategic Investments
Cement
♦ Sole cement &
clinker
manufacturer in
Sarawak
Property
Development
♦ Owns 2 large
land banks in
Kuching
♦ Planned new
township &
service centre,
Light Industrial
Estate, Hotel &
Workers
Accommodation
in Samalaju
Construction
Materials & Trading
♦ Responsible for 5
quarries, 10
premix plants, a
wire production
line & trading
business
Construction &
Road Maintenance
♦ Involved in wide
range of
construction &
road
maintenance
projects across
Sarawak
ICT
SACOFA
♦ 50% non-
controlling stake
in SACOFA – a
telecommunicatio
ns infrastructure
arm
Strategic
Investments
Listed Companies
♦ 26.24% stake in
Kenanga IB
♦ 20% stake in
KKB Engineering
Unlisted
Companies
♦ CMS Opus
♦ Tunku Putra
School
13
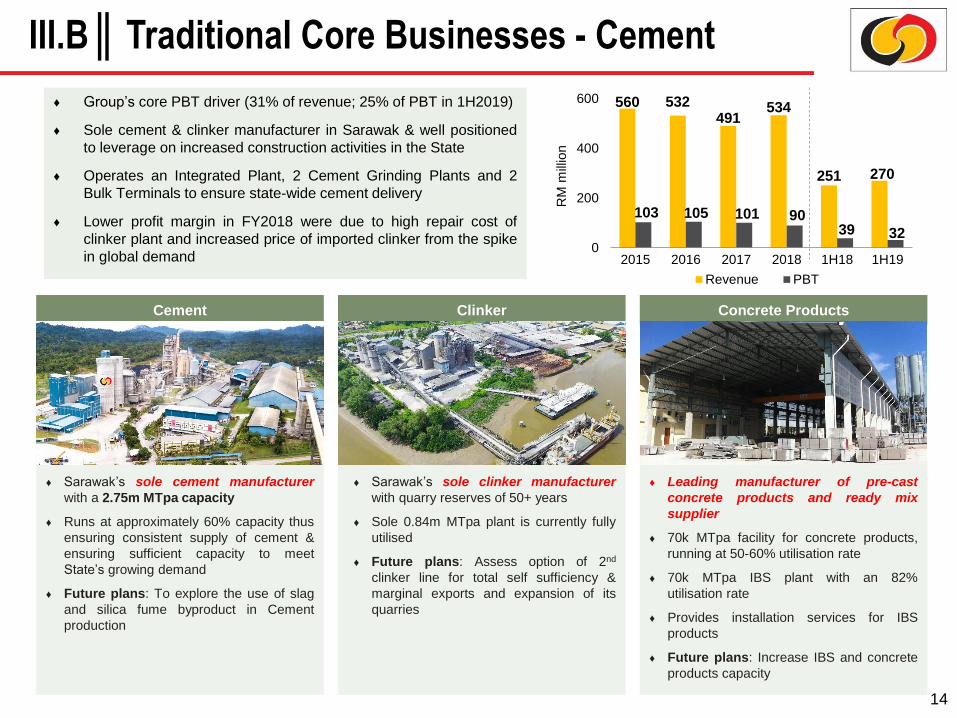
Cement
♦ Sarawak’s sole cement manufacturer
with a 2.75m MTpa capacity
♦ Runs at approximately 60% capacity thus
ensuring consistent supply of cement &
ensuring sufficient capacity to meet
State’s growing demand
♦ Future plans: To explore the use of slag
and silica fume byproduct in Cement
production
Clinker
♦ Sarawak’s sole clinker manufacturer
with quarry reserves of 50+ years
♦ Sole 0.84m MTpa plant is currently fully
utilised
♦ Future plans: Assess option of 2nd
clinker line for total self sufficiency &
marginal exports and expansion of its
quarries
Concrete Products
♦ Leading manufacturer of pre-cast
concrete products and ready mix
supplier
♦ 70k MTpa facility for concrete products,
running at 50-60% utilisation rate
♦ 70k MTpa IBS plant with an 82%
utilisation rate
♦ Provides installation services for IBS
products
♦ Future plans: Increase IBS and concrete
products capacity
♦ Group’s core PBT driver (31% of revenue; 25% of PBT in 1H2019)
♦ Sole cement & clinker manufacturer in Sarawak & well positioned
to leverage on increased construction activities in the State
♦ Operates an Integrated Plant, 2 Cement Grinding Plants and 2
Bulk Terminals to ensure state-wide cement delivery
♦ Lower profit margin in FY2018 were due to high repair cost of
clinker plant and increased price of imported clinker from the spike
in global demand
III.B ║Traditional Core Businesses - Cement
560 532491
534
251 270
103 105 101 9039 32
0
200
400
600
2015 2016 2017 2018 1H18 1H19
Revenue PBT
RM
mill
ion
14
Pulled wiresTypical plant
15
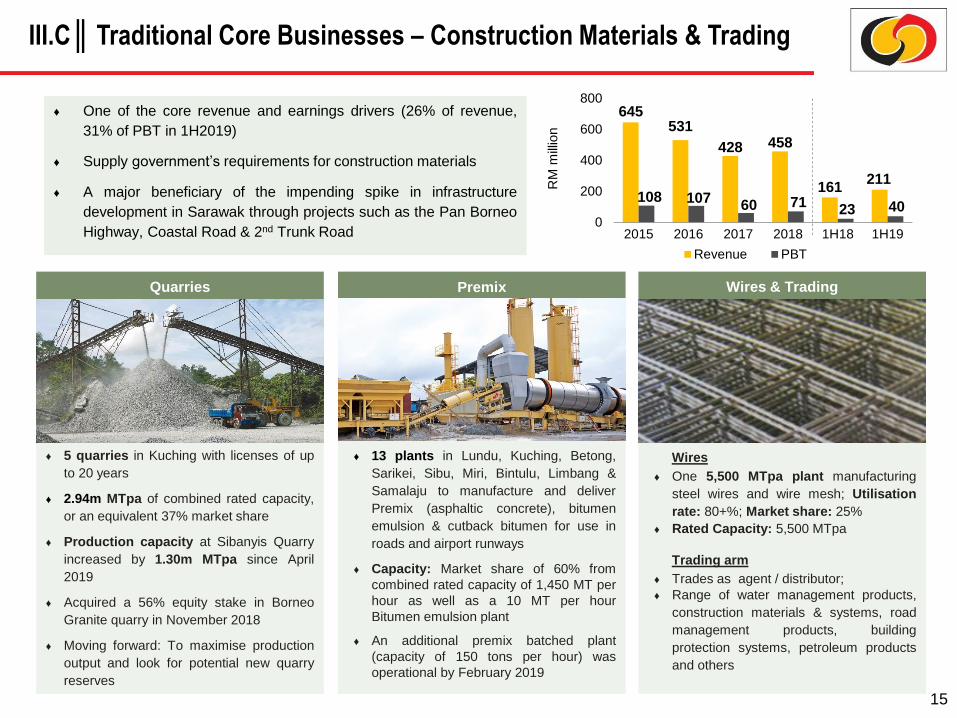
Quarries
♦ 5 quarries in Kuching with licenses of up
to 20 years
♦ 2.94m MTpa of combined rated capacity,
or an equivalent 37% market share
♦ Production capacity at Sibanyis Quarry
increased by 1.30m MTpa since April
2019
♦ Acquired a 56% equity stake in Borneo
Granite quarry in November 2018
♦ Moving forward: To maximise production
output and look for potential new quarry
reserves
Premix
♦ 13 plants in Lundu, Kuching, Betong,
Sarikei, Sibu, Miri, Bintulu, Limbang &
Samalaju to manufacture and deliver
Premix (asphaltic concrete), bitumen
emulsion & cutback bitumen for use in
roads and airport runways
♦ Capacity: Market share of 60% from
combined rated capacity of 1,450 MT per
hour as well as a 10 MT per hour
Bitumen emulsion plant
♦ An additional premix batched plant
(capacity of 150 tons per hour) was
operational by February 2019
Wires & Trading
Wires
♦ One 5,500 MTpa plant manufacturing
steel wires and wire mesh; Utilisation
rate: 80+%; Market share: 25%
♦ Rated Capacity: 5,500 MTpa
Trading arm
♦ Trades as agent / distributor;
♦ Range of water management products,
construction materials & systems, road
management products, building
protection systems, petroleum products
and others
♦ One of the core revenue and earnings drivers (26% of revenue,
31% of PBT in 1H2019)
♦ Supply government’s requirements for construction materials
♦ A major beneficiary of the impending spike in infrastructure
development in Sarawak through projects such as the Pan Borneo
Highway, Coastal Road & 2nd Trunk Road
III.C ║Traditional Core Businesses – Construction Materials & Trading
645531
428 458
161211
108 10760 71
23 400
200
400
600
800
2015 2016 2017 2018 1H18 1H19
Revenue PBT
RM
mill
ion
15
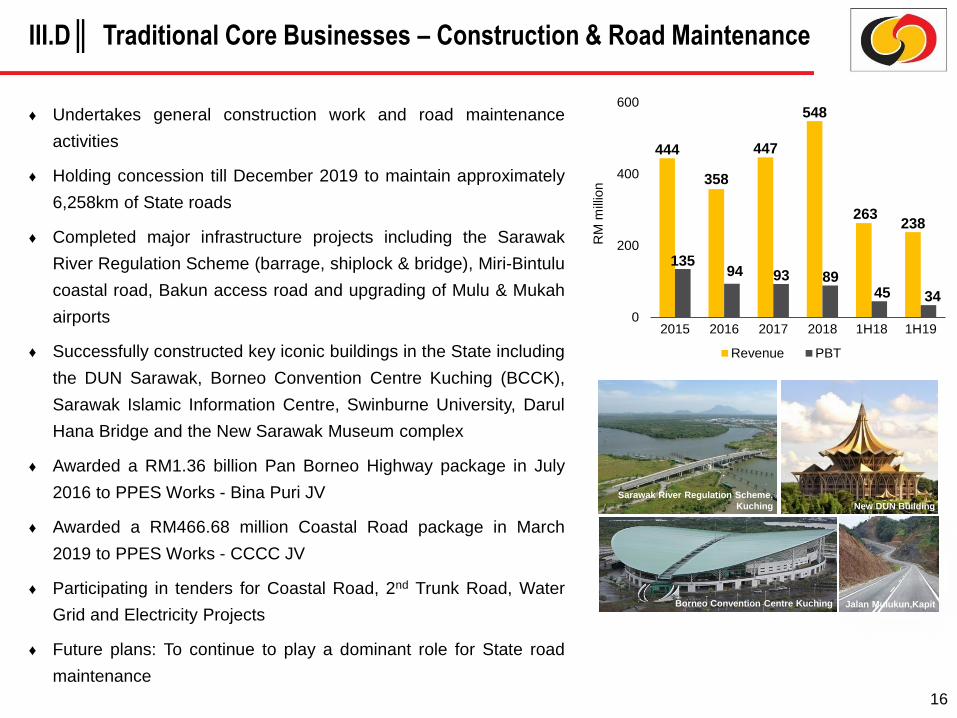
♦ Undertakes general construction work and road maintenance
activities
♦ Holding concession till December 2019 to maintain approximately
6,258km of State roads
♦ Completed major infrastructure projects including the Sarawak
River Regulation Scheme (barrage, shiplock & bridge), Miri-Bintulu
coastal road, Bakun access road and upgrading of Mulu & Mukah
airports
♦ Successfully constructed key iconic buildings in the State including
the DUN Sarawak, Borneo Convention Centre Kuching (BCCK),
Sarawak Islamic Information Centre, Swinburne University, Darul
Hana Bridge and the New Sarawak Museum complex
♦ Awarded a RM1.36 billion Pan Borneo Highway package in July
2016 to PPES Works - Bina Puri JV
♦ Awarded a RM466.68 million Coastal Road package in March
2019 to PPES Works - CCCC JV
♦ Participating in tenders for Coastal Road, 2nd Trunk Road, Water
Grid and Electricity Projects
♦ Future plans: To continue to play a dominant role for State road
maintenance
Borneo Convention Centre Kuching
Sarawak River Regulation Scheme,
Kuching New DUN Building
Jalan Mulukun,Kapit
III.D ║ Traditional Core Businesses – Construction & Road Maintenance
16
444
358
447
548
263238
13594 93 89
45 34
0
200
400
600
2015 2016 2017 2018 1H18 1H19
Revenue PBT
RM
mill
ion
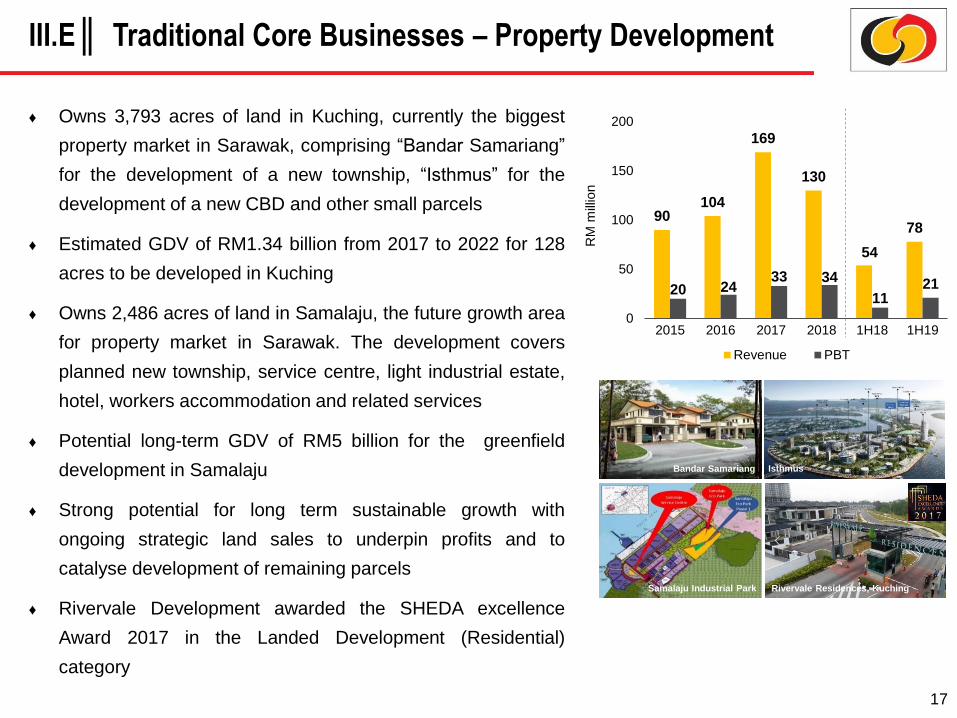
♦ Owns 3,793 acres of land in Kuching, currently the biggest
property market in Sarawak, comprising “Bandar Samariang”
for the development of a new township, “Isthmus” for the
development of a new CBD and other small parcels
♦ Estimated GDV of RM1.34 billion from 2017 to 2022 for 128
acres to be developed in Kuching
♦ Owns 2,486 acres of land in Samalaju, the future growth area
for property market in Sarawak. The development covers
planned new township, service centre, light industrial estate,
hotel, workers accommodation and related services
♦ Potential long-term GDV of RM5 billion for the greenfield
development in Samalaju
♦ Strong potential for long term sustainable growth with
ongoing strategic land sales to underpin profits and to
catalyse development of remaining parcels
♦ Rivervale Development awarded the SHEDA excellence
Award 2017 in the Landed Development (Residential)
category
Rivervale Residences, Kuching Samalaju Industrial Park
IsthmusBandar Samariang
III.E ║ Traditional Core Businesses – Property Development
17
90104
169
130
54
78
20 2433 34
1121
0
50
100
150
200
2015 2016 2017 2018 1H18 1H19
Revenue PBT
RM
mill
ion

Plant’s Strategic
Flexibility
❑ Flexibility in converting furnaces between
silicon & manganese
❑ Able to convert to various grades of
manganese alloys
❑ Option of silicon metal production
Land Size ❑ 500 acres land adjacent to the Samalaju
Industrial Port
Status ❑ All 16 furnaces are operational
❑ OM Sarawak was amongst the biggest
financial contributor to the Group in
FY2018
Shareholders ❑ CMS (25%)
❑ OM Holdings Ltd (75%), ASX listed & one
of the world’s largest manganese ore
producers
Plant Capacity ❑ Ferrosilicon Alloys:
170,000 - 210,000 MTpa;
❑ Manganese Alloys (silicomanganese &
high carbon ferromanganese): 250,000
– 300,000 MTpa
III.F ║ Strategic Investments in SCORE – OM Materials (Sarawak)
18
OM MATERIALS (SARAWAK)
174482
1,632
2,379
1,191986
-32 -257 -18254 194
21
-290
210
710
1210
1710
2210
2015 2016 2017 2018 1H18 1H19
Revenue PBT
RM
mill
ion

III.F ║ Strategic Investments in SCORE – OM Materials (Sarawak)
19
10-year tax holiday and no import
and/or export duties drives the
competitive advantage further
3rd largest plant of its kind in the
world & is part of a well established
vertically integrated business of OM
Holdings Ltd
OM Sarawak is in the 1st quartile
of the global production cost
curve - assuring its long-term growth
potentials
Steel production to grow at CAGR of
4.54% up to 2025 (which will feed through
to FA demand), with projected production
levels are likely to be remain below demand
Led by strong experienced
technical teams who understand
how to optimise competencies &
resources
Binding Off-take arrangements
signed with JFE Shoji and Hanwa
exceed 40% off-take of the project’s
Phase 1 production
Chinese Government’s
unprecedented policy against
polluting industries augurs well for
OM Sarawak’s future growth
20 year 300MW Power Purchase Agreement
already signed underpinning smelter’s
competitive cost position. Additional power
blocks of 50MW and 100 MW secured
Logistically well located with
the Samalaju port providing
convenient access to growing
Asian markets
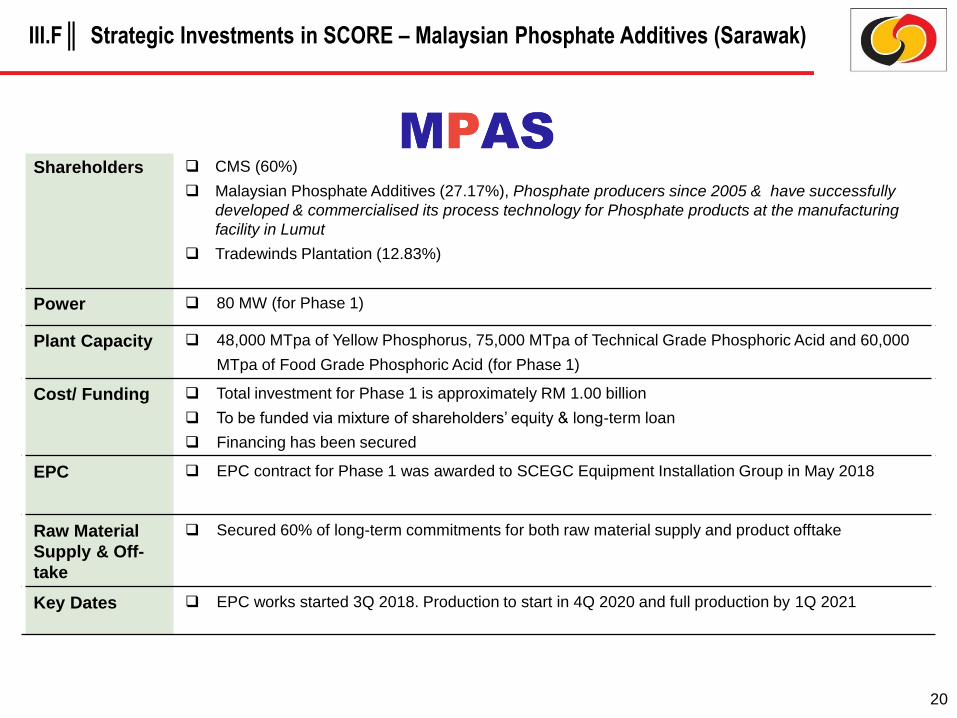
Shareholders ❑ CMS (60%)
❑ Malaysian Phosphate Additives (27.17%), Phosphate producers since 2005 & have successfully
developed & commercialised its process technology for Phosphate products at the manufacturing
facility in Lumut
❑ Tradewinds Plantation (12.83%)
Power ❑ 80 MW (for Phase 1)
Plant Capacity ❑ 48,000 MTpa of Yellow Phosphorus, 75,000 MTpa of Technical Grade Phosphoric Acid and 60,000
MTpa of Food Grade Phosphoric Acid (for Phase 1)
Cost/ Funding ❑ Total investment for Phase 1 is approximately RM 1.00 billion
❑ To be funded via mixture of shareholders’ equity & long-term loan
❑ Financing has been secured
EPC ❑ EPC contract for Phase 1 was awarded to SCEGC Equipment Installation Group in May 2018
Raw Material
Supply & Off-
take
❑ Secured 60% of long-term commitments for both raw material supply and product offtake
Key Dates ❑ EPC works started 3Q 2018. Production to start in 4Q 2020 and full production by 1Q 2021
III.F ║ Strategic Investments in SCORE – Malaysian Phosphate Additives (Sarawak)
20
21
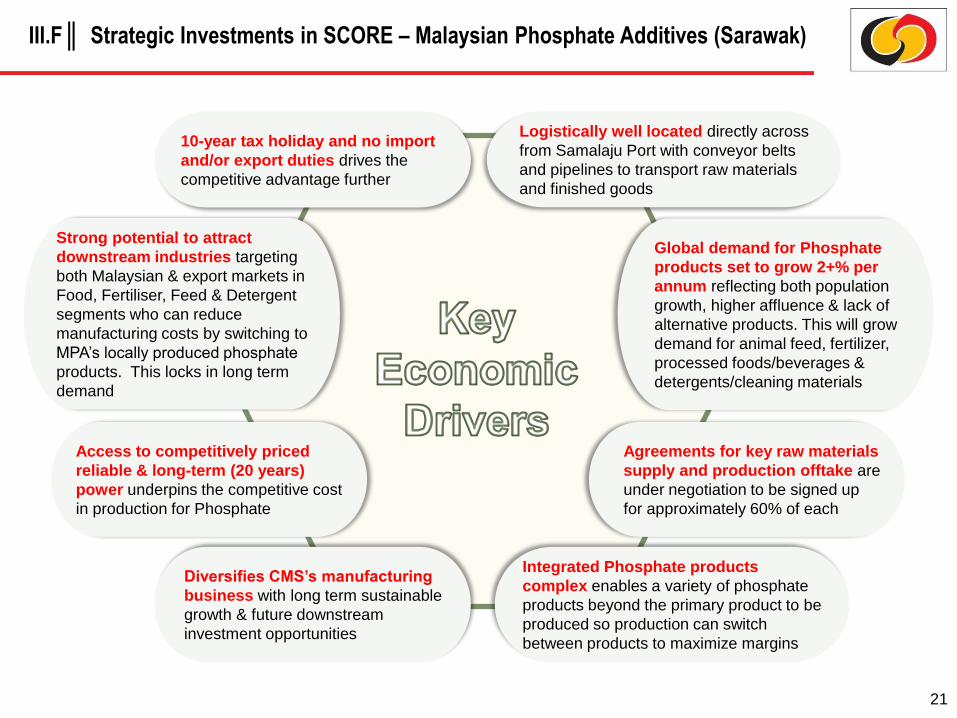
Strong potential to attract
downstream industries targeting
both Malaysian & export markets in
Food, Fertiliser, Feed & Detergent
segments who can reduce
manufacturing costs by switching to
MPA’s locally produced phosphate
products. This locks in long term
demand
10-year tax holiday and no import
and/or export duties drives the
competitive advantage further
Access to competitively priced
reliable & long-term (20 years)
power underpins the competitive cost
in production for Phosphate
Diversifies CMS’s manufacturing
business with long term sustainable
growth & future downstream
investment opportunities
Logistically well located directly across
from Samalaju Port with conveyor belts
and pipelines to transport raw materials
and finished goods
Global demand for Phosphate
products set to grow 2+% per
annum reflecting both population
growth, higher affluence & lack of
alternative products. This will grow
demand for animal feed, fertilizer,
processed foods/beverages &
detergents/cleaning materials
Agreements for key raw materials
supply and production offtake are
under negotiation to be signed up
for approximately 60% of each
Integrated Phosphate products
complex enables a variety of phosphate
products beyond the primary product to be
produced so production can switch
between products to maximize margins
III.F ║ Strategic Investments in SCORE – Malaysian Phosphate Additives (Sarawak)
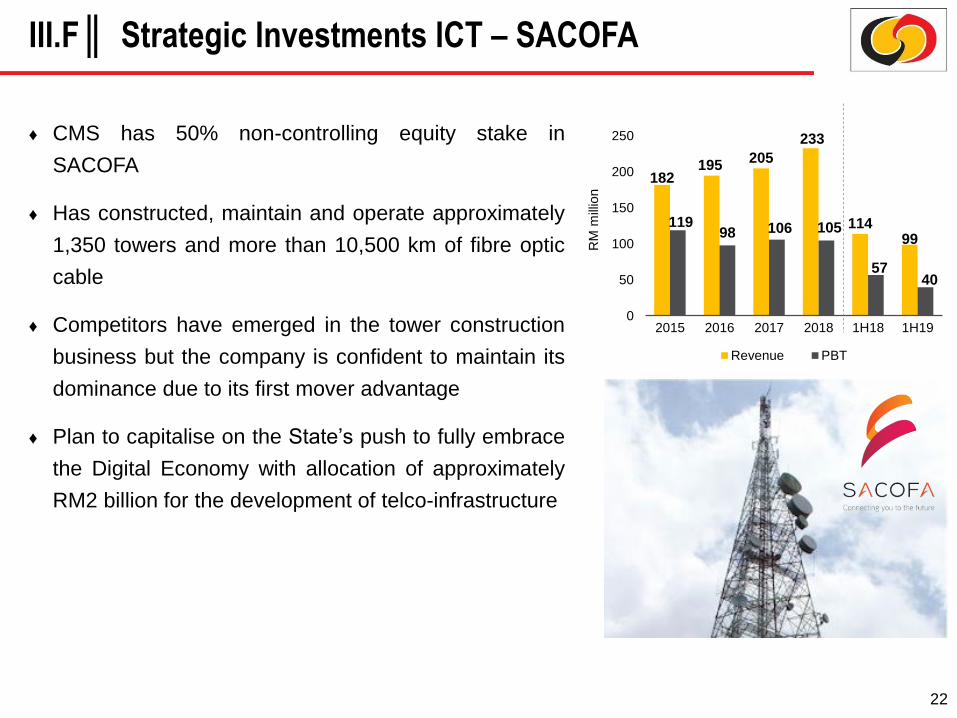
♦ CMS has 50% non-controlling equity stake in
SACOFA
♦ Has constructed, maintain and operate approximately
1,350 towers and more than 10,500 km of fibre optic
cable
♦ Competitors have emerged in the tower construction
business but the company is confident to maintain its
dominance due to its first mover advantage
♦ Plan to capitalise on the State’s push to fully embrace
the Digital Economy with allocation of approximately
RM2 billion for the development of telco-infrastructure
III.F ║ Strategic Investments ICT – SACOFA
22
182195
205
233
11499
11998 106 105
5740
0
50
100
150
200
250
2015 2016 2017 2018 1H18 1H19
Revenue PBT
RM
mill
ion
III.F ║ Strategic Investments – Listed Companies
23
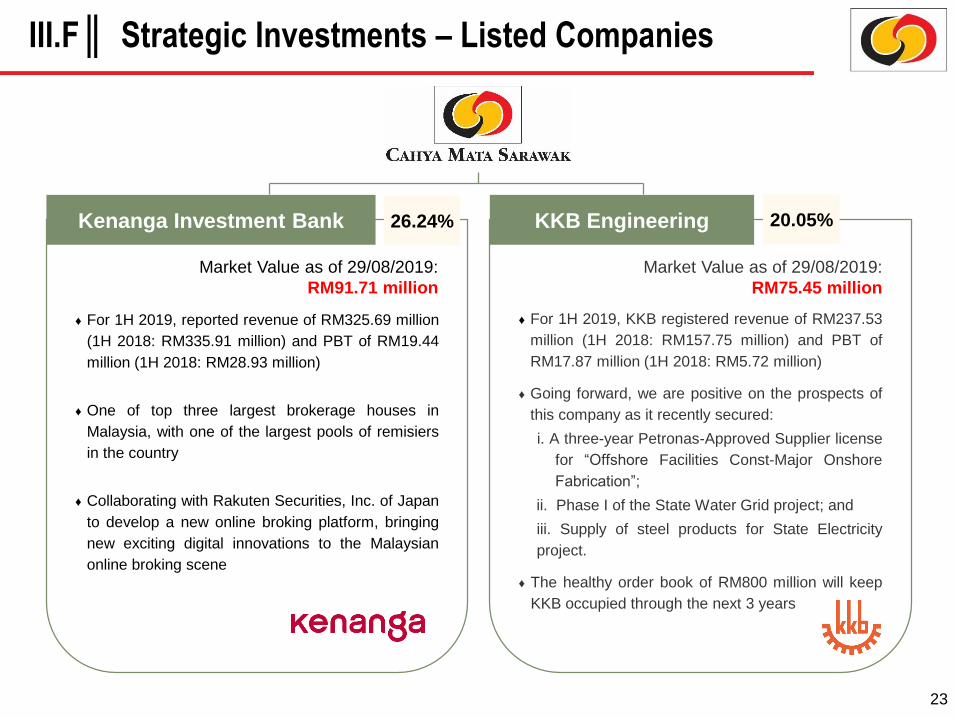
Kenanga Investment Bank
♦ For 1H 2019, reported revenue of RM325.69 million
(1H 2018: RM335.91 million) and PBT of RM19.44
million (1H 2018: RM28.93 million)
♦ One of top three largest brokerage houses in
Malaysia, with one of the largest pools of remisiers
in the country
♦ Collaborating with Rakuten Securities, Inc. of Japan
to develop a new online broking platform, bringing
new exciting digital innovations to the Malaysian
online broking scene
Market Value as of 29/08/2019:
RM91.71 million
26.24%
Market Value as of 29/08/2019:
RM75.45 million
KKB Engineering
♦ For 1H 2019, KKB registered revenue of RM237.53
million (1H 2018: RM157.75 million) and PBT of
RM17.87 million (1H 2018: RM5.72 million)
♦ Going forward, we are positive on the prospects of
this company as it recently secured:
i. A three-year Petronas-Approved Supplier license
for “Offshore Facilities Const-Major Onshore
Fabrication”;
ii. Phase I of the State Water Grid project; and
iii. Supply of steel products for State Electricity
project.
♦ The healthy order book of RM800 million will keep
KKB occupied through the next 3 years
20.05%
24
IV. Financial Highlights
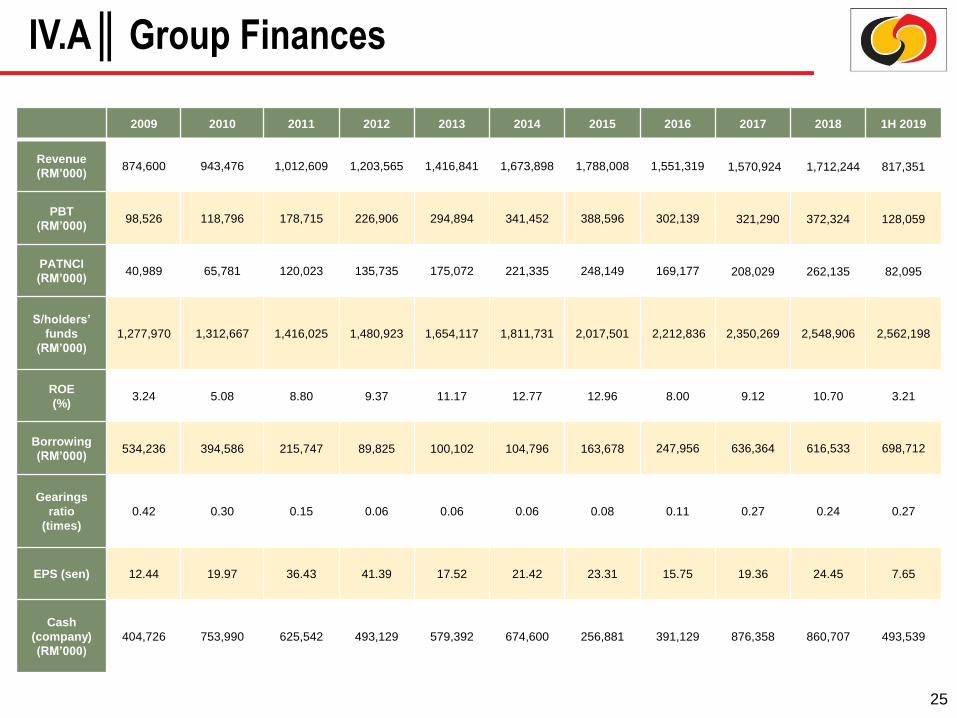
2009 2010 2011 2012 2013 2014 2015 2016 2017 2018 1H 2019
Revenue
(RM’000)874,600 943,476 1,012,609 1,203,565 1,416,841 1,673,898 1,788,008 1,551,319 1,570,924 1,712,244 817,351
PBT
(RM’000)98,526 118,796 178,715 226,906 294,894 341,452 388,596 302,139 321,290 372,324 128,059
PATNCI
(RM’000)40,989 65,781 120,023 135,735 175,072 221,335 248,149 169,177 208,029 262,135 82,095
S/holders’
funds
(RM’000)
1,277,970 1,312,667 1,416,025 1,480,923 1,654,117 1,811,731 2,017,501 2,212,836 2,350,269 2,548,906 2,562,198
ROE
(%)3.24 5.08 8.80 9.37 11.17 12.77 12.96 8.00 9.12 10.70 3.21
Borrowing
(RM’000)534,236 394,586 215,747 89,825 100,102 104,796 163,678 247,956 636,364 616,533 698,712
Gearings
ratio
(times)
0.42 0.30 0.15 0.06 0.06 0.06 0.08 0.11 0.27 0.24 0.27
EPS (sen) 12.44 19.97 36.43 41.39 17.52 21.42 23.31 15.75 19.36 24.45 7.65
Cash
(company)
(RM’000)
404,726 753,990 625,542 493,129 579,392 674,600 256,881 391,129 876,358 860,707 493,539
IV.A ║Group Finances
25

REVENUE
EPS & ROE
PBT & PBT MARGIN
BALANCE SHEET
* Restated due to the adoption of MFRS 15
1,7881,551 1,571 1,712
750 817
0
200
400
600
800
1,000
1,200
1,400
1,600
1,800
2,000
2015 2016 2017 2018 1H18 1H19
RM
mill
ion
23.31
15.7519.36
24.45
12.167.65
12.96%
8.00%9.12%
10.70%
5.50%
3.21%
0%
2%
4%
6%
8%
10%
12%
14%
0
5
10
15
20
25
30
2015 2016 2017 2018 1H18 1H19
EPS ROE
RM
sen
389
302321
372
176128
18.90%
19.47%
20.45%21.74%23.45%
15.67%
0%
5%
10%
15%
20%
25%
0
50
100
150
200
250
300
350
400
450
2015 2016 2017 2018 1H18 1H19PBT PBT Margin
RM
mill
ion
IV.B ║Group Key Financials 2015 – 1H 2019
RM
mill
ion
2,018
2,2132,350
2,5492,562
325457
978 921
494
164248
636 617699
0.08
0.11
0.27
0.240.27
0
0.05
0.1
0.15
0.2
0.25
0.3
0
500
1,000
1,500
2,000
2,500
3,000
2015 2016 2017 2018 1H19
S/holders' funds Cash Borrowings Gearings
26
* Restated due to the adoption of MFRS 15
560 532 497 534
251 270
645
531
428458
161211
444
358
447
548
263238
90
104 169
131
5478
0
200
400
600
800
1000
1200
1400
1600
1800
2015 2016 2017* 2018 1H18 1H19
Revenue by segment (RM’m)
PropertyDevelopment
Construction &RoadMaintenance
ConstructionMaterials &Trading
Cement 31% 34% 32% 32% 35% 34%
36%34%
28% 27% 22% 26%
25% 23%
29% 33% 36% 30%
5% 7% 11% 8% 7% 10%
2015 2016 2017* 2018 1H18 1H19
Revenue by segment (%)
IV.C ║Revenue Breakdown 2015 – 1H 2019
27
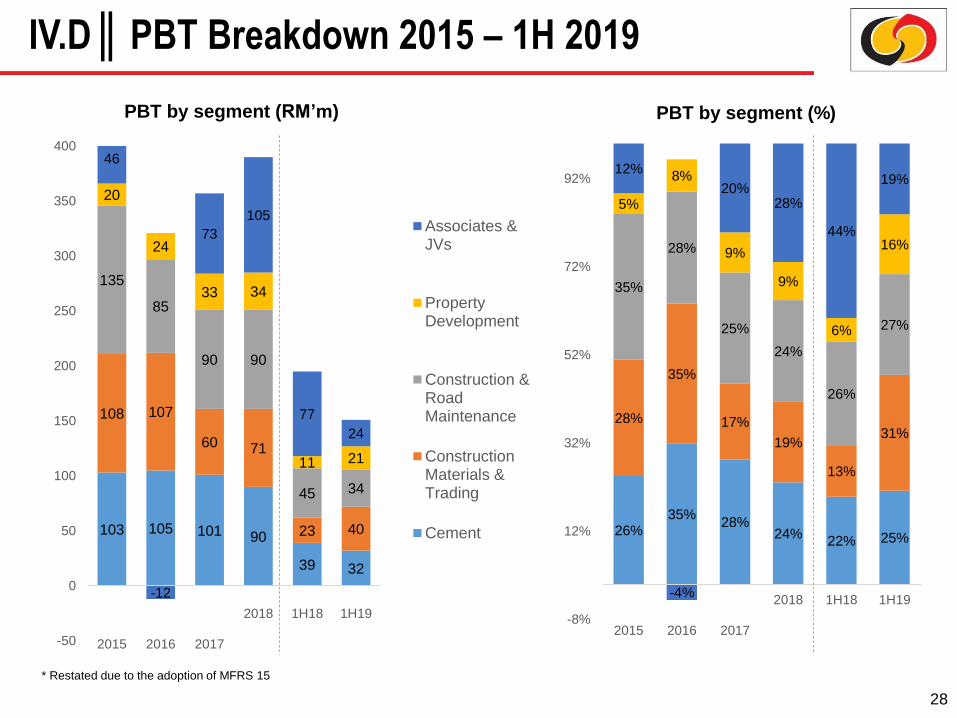
103 105 101 90
39 32
108 107
60 71
23 40
135
85
90 90
45 34
20
24
33 34
11 21
46
-12
73
105
77
24
-50
0
50
100
150
200
250
300
350
400
2015 2016 2017
2018 1H18 1H19
PBT by segment (RM’m)
Associates &JVs
PropertyDevelopment
Construction &RoadMaintenance
ConstructionMaterials &Trading
Cement 26%35%
28%24%
22% 25%
28%
35%
17%
19%
13%
31%
35%
28%
25%
24%
26%
27%
5%
8%
9%
9%
6%
16%
12%
-4%
20%28%
44%
19%
-8%
12%
32%
52%
72%
92%
2015 2016 2017
2018 1H18 1H19
PBT by segment (%)
* Restated due to the adoption of MFRS 15
IV.D ║PBT Breakdown 2015 – 1H 2019
28
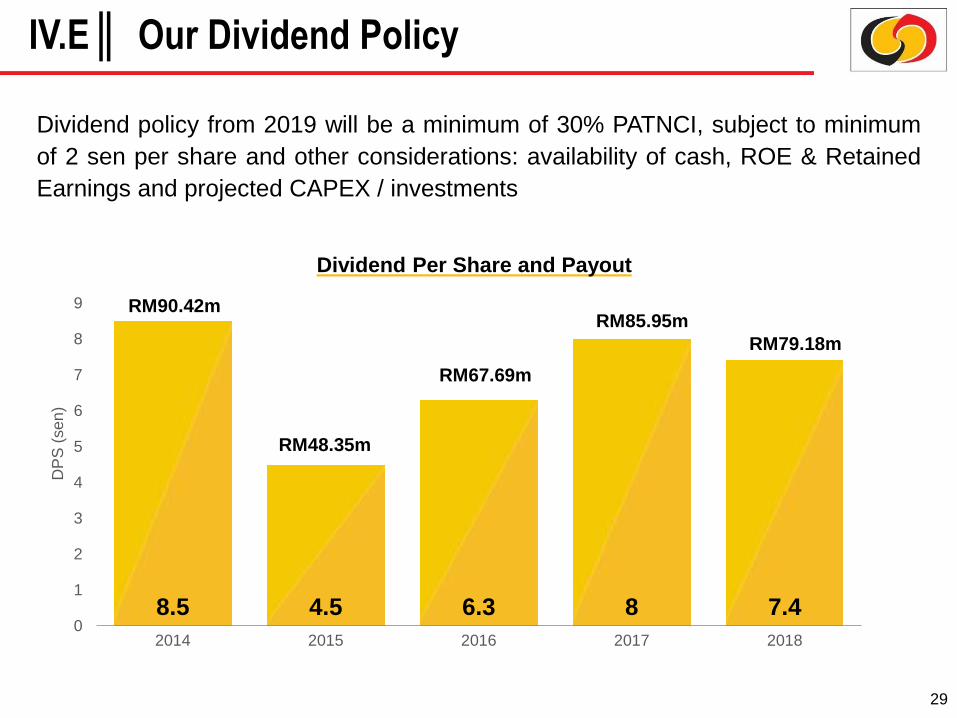
8.5 4.5 6.3 8 7.40
1
2
3
4
5
6
7
8
9
2014 2015 2016 2017 2018
DP
S (
se
n)
Dividend Per Share and Payout
RM67.69m
RM85.95m
RM79.18m
RM48.35m
RM90.42m
Dividend policy from 2019 will be a minimum of 30% PATNCI, subject to minimum
of 2 sen per share and other considerations: availability of cash, ROE & Retained
Earnings and projected CAPEX / investments
IV.E ║ Our Dividend Policy
29
V. Sustainability & Governance Achievements
30

V. ║Sustainability & Governance Achievements
31
♦ CMS is the only
Sarawak company to
be made a constituent
of the FTSE4Good
index and one out of
71 companies in
Malaysia
♦ Won the “CSR
Leadership Gold
Award” at the Global
CSR Awards in April
2019
Sustainability
♦ CMS is the only Sarawak company to qualify as
member of Bursa Malaysia’s Green Lane Policy due
to our good track record of public discloser
♦ CMS received Bronze and Silver Awards for its 2017’s
Annual Report and Sustainability Report respectively
from the Australasian Reporting Agency (ARA)
Governance
♦ CMS was ranked
as one of top 4
employers in
Sarawak by
JobStreet.com
Work Place
♦ We are taking a lead in this
area:
• 2016: 45,534 man-hours
• 2017: 48,428 man-hours
• 2018: 50,421 man-hours
Employee Volunteerism

VI. Group Outlook
32
1. Three-Pronged Strategy
1.1 Reposition and fortify all traditional core businesses
1.2 Fully implement and grow the strategic businesses
1.3 Reposition and strengthen the CMS brand
2. Key Foundation Stones for the Strategy
2.1 Integrity, Grit, Respect and Accountability
2.2 A visionary, unified and engaging leadership
2.3 Introduce transformational efficiencies into all businesses focusing on
innovation, quality, cost and delivery through the employment of digital
technology
2.4 Embed sustainability as a culture in CMS emphasizing care for the
customers, environment, employees and the community
3. 5-Year Target
3.1 Double the Group’s PATNCI to RM500 million;
3.2 Be the most admired public-listed company in Sarawak
VI.A ║The CMS Growth Strategy
33
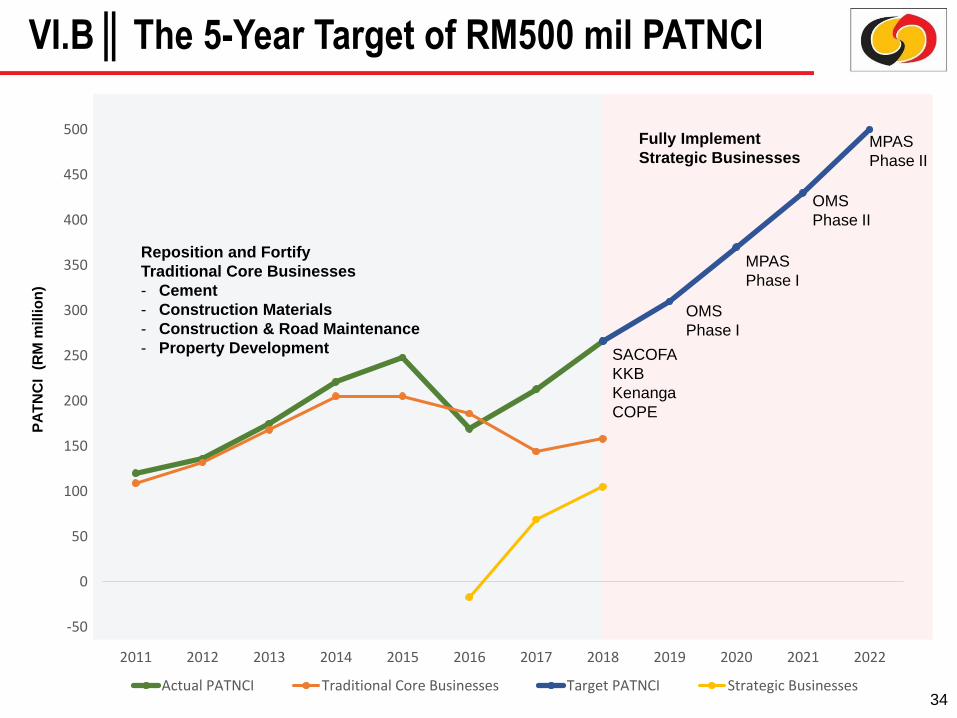
PA
TN
CI
(R
M m
illio
n)
-50
0
50
100
150
200
250
300
350
400
450
500
2011 2012 2013 2014 2015 2016 2017 2018 2019 2020 2021 2022
Actual PATNCI Traditional Core Businesses Target PATNCI Strategic Businesses
MPAS
Phase II
OMS
Phase II
MPAS
Phase I
OMS
Phase I
SACOFA
KKB
Kenanga
COPE
Reposition and Fortify
Traditional Core Businesses
- Cement
- Construction Materials
- Construction & Road Maintenance
- Property Development
Fully Implement
Strategic Businesses
34
VI.B ║The 5-Year Target of RM500 mil PATNCI


![KEMAJUAN KERJAYA · IR.MOHD HIZAM BIN HARUN Infrastructure Design Engineering [Road, Traffic And Transportation Engineering (Pavement)] Tahap 4 Arkitek AR. YONG RAZIDAH RASHID Sustainable](https://img.pdfslide.net/doc/110x75/5ec24c655f18c146a459eda6/kemajuan-kerjaya-irmohd-hizam-bin-harun-infrastructure-design-engineering-road.jpg)