Embed Size (px)
Citation preview
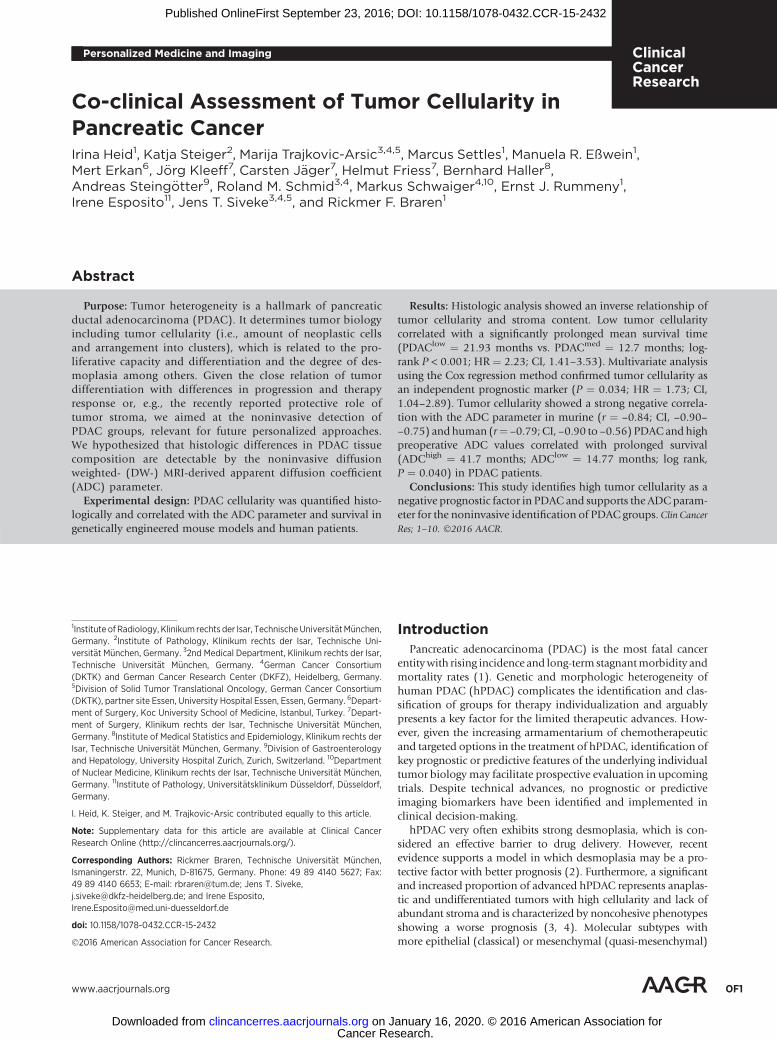
Personalized Medicine and Imaging
Co-clinical Assessment of Tumor Cellularity inPancreatic CancerIrina Heid1, Katja Steiger2, Marija Trajkovic-Arsic3,4,5, Marcus Settles1, Manuela R. Eßwein1,Mert Erkan6, J€org Kleeff7, Carsten J€ager7, Helmut Friess7, Bernhard Haller8,Andreas Steing€otter9, Roland M. Schmid3,4, Markus Schwaiger4,10, Ernst J. Rummeny1,Irene Esposito11, Jens T. Siveke3,4,5, and Rickmer F. Braren1
Abstract
Purpose: Tumor heterogeneity is a hallmark of pancreaticductal adenocarcinoma (PDAC). It determines tumor biologyincluding tumor cellularity (i.e., amount of neoplastic cellsand arrangement into clusters), which is related to the pro-liferative capacity and differentiation and the degree of des-moplasia among others. Given the close relation of tumordifferentiation with differences in progression and therapyresponse or, e.g., the recently reported protective role oftumor stroma, we aimed at the noninvasive detection ofPDAC groups, relevant for future personalized approaches.We hypothesized that histologic differences in PDAC tissuecomposition are detectable by the noninvasive diffusionweighted- (DW-) MRI-derived apparent diffusion coefficient(ADC) parameter.
Experimental design: PDAC cellularity was quantified histo-logically and correlated with the ADC parameter and survival ingenetically engineered mouse models and human patients.
Results: Histologic analysis showed an inverse relationship oftumor cellularity and stroma content. Low tumor cellularitycorrelated with a significantly prolonged mean survival time(PDAClow ¼ 21.93 months vs. PDACmed ¼ 12.7 months; log-rank P < 0.001; HR ¼ 2.23; CI, 1.41–3.53). Multivariate analysisusing the Cox regression method confirmed tumor cellularity asan independent prognostic marker (P ¼ 0.034; HR ¼ 1.73; CI,1.04–2.89). Tumor cellularity showed a strong negative correla-tion with the ADC parameter in murine (r ¼ –0.84; CI, –0.90––0.75) andhuman (r¼ –0.79; CI, –0.90 to –0.56) PDACand highpreoperative ADC values correlated with prolonged survival(ADChigh ¼ 41.7 months; ADClow ¼ 14.77 months; log rank,P ¼ 0.040) in PDAC patients.
Conclusions: This study identifies high tumor cellularity as anegative prognostic factor in PDAC and supports the ADCparam-eter for the noninvasive identification of PDAC groups. Clin CancerRes; 1–10. �2016 AACR.
IntroductionPancreatic adenocarcinoma (PDAC) is the most fatal cancer
entitywith rising incidence and long-term stagnantmorbidity andmortality rates (1). Genetic and morphologic heterogeneity ofhuman PDAC (hPDAC) complicates the identification and clas-sification of groups for therapy individualization and arguablypresents a key factor for the limited therapeutic advances. How-ever, given the increasing armamentarium of chemotherapeuticand targeted options in the treatment of hPDAC, identification ofkey prognostic or predictive features of the underlying individualtumor biology may facilitate prospective evaluation in upcomingtrials. Despite technical advances, no prognostic or predictiveimaging biomarkers have been identified and implemented inclinical decision-making.
hPDAC very often exhibits strong desmoplasia, which is con-sidered an effective barrier to drug delivery. However, recentevidence supports a model in which desmoplasia may be a pro-tective factor with better prognosis (2). Furthermore, a significantand increased proportion of advanced hPDAC represents anaplas-tic and undifferentiated tumors with high cellularity and lack ofabundant stroma and is characterized by noncohesive phenotypesshowing a worse prognosis (3, 4). Molecular subtypes withmore epithelial (classical) or mesenchymal (quasi-mesenchymal)
1Institute ofRadiology, Klinikum rechts der Isar, TechnischeUniversit€atM€unchen,Germany. 2Institute of Pathology, Klinikum rechts der Isar, Technische Uni-versit€at M€unchen, Germany. 32nd Medical Department, Klinikum rechts der Isar,Technische Universit€at M€unchen, Germany. 4German Cancer Consortium(DKTK) and German Cancer Research Center (DKFZ), Heidelberg, Germany.5Division of Solid Tumor Translational Oncology, German Cancer Consortium(DKTK), partner site Essen, University Hospital Essen, Essen, Germany. 6Depart-ment of Surgery, Koc University School of Medicine, Istanbul, Turkey. 7Depart-ment of Surgery, Klinikum rechts der Isar, Technische Universit€at M€unchen,Germany. 8Institute of Medical Statistics and Epidemiology, Klinikum rechts derIsar, Technische Universit€at M€unchen, Germany. 9Division of Gastroenterologyand Hepatology, University Hospital Zurich, Zurich, Switzerland. 10Departmentof Nuclear Medicine, Klinikum rechts der Isar, Technische Universit€at M€unchen,Germany. 11Institute of Pathology, Universit€atsklinikum D€usseldorf, D€usseldorf,Germany.
I. Heid, K. Steiger, and M. Trajkovic-Arsic contributed equally to this article.
Note: Supplementary data for this article are available at Clinical CancerResearch Online (http://clincancerres.aacrjournals.org/).
Corresponding Authors: Rickmer Braren, Technische Universit€at M€unchen,Ismaningerstr. 22, Munich, D-81675, Germany. Phone: 49 89 4140 5627; Fax:49 89 4140 6653; E-mail: [email protected]; Jens T. Siveke,[email protected]; and Irene Esposito,[email protected]
doi: 10.1158/1078-0432.CCR-15-2432
�2016 American Association for Cancer Research.
ClinicalCancerResearch
www.aacrjournals.org OF1
Cancer Research. on January 16, 2020. © 2016 American Association forclincancerres.aacrjournals.org Downloaded from
Published OnlineFirst September 23, 2016; DOI: 10.1158/1078-0432.CCR-15-2432
features and different response to treatment have been proposed(5). The therapeutic relevance of these subtypes, which are amongother features reflected by tumor cellularity, has recently beendescribed in cell culture–based models (6).
Diffusion weighted-magnetic resonance imaging (DW-MRI)measures random motion of water molecules, expressed as anapparent diffusion coefficient (ADC), theweighted average of thiscoefficient within a given voxel (7). Intracellular diffusion ishighly restricted due to structural barriers and this provides thebasis for the detection of high cellularity voxel, for example, inoncologic imaging (8). Translation of this highly successful imag-ing technique to applications outside the brain has been partlyhampered by technical challenges. However, consensus existswith regard to DW-MRI potential in particular in oncologicapplications (9).
The aim of this study was to assess tumor cellularity defined asthe amount of tumor cells in the specimen and their arrangementinto clusters and stroma content in PDAC, hypothesizing thatdifferences in tumor composition may translate into differencesin patient survival. Further, we wanted to test the DW-MRI–derived ADC parameter as a surgery independent noninvasivebiomarker, well-suited for the detection of structural differencesin tissue composition.
Materials and MethodsThis work has been performed and is reported in accordance
with the reporting recommendations for tumor marker prognos-tic studies (REMARK; ref. 10).
Mouse strainsAll experiments were performed according to the guidelines
of the local Animal Use and Care Committee and are reportedfollowing the ARRIVE guidelines. Analyzed lesions werederived from previously described GEMM Ptf1awt/cre(C);Kraswt/LSL-KrasG12D(K)TP53(P)fl/wt, CKPR172H/wt, CKPfl/fl, CKEla-
TGFa(T) (11–15). CKTPfl/wt and CKTPR172H/wt strains were bredfrom the above strains (Supplementary Fig. SF1A and SF1B).
MRI and data analysis in miceBefore all MRI experiments, mice were anesthetized by contin-
uous gaseous infusion of 1.8% to 2% isoflurane (Abbott GmbH)for at least 10 minutes using a veterinary anesthesia System(Vetland Medical Sales and Services). During imaging, the dosewas kept at 2% isoflurane, animal temperature was maintainedand continuously monitored and eyes were protected with an eyeointment.
Mice were imaged in prone position using a 47-mm micros-copy surface coil inside the clinical 1.5 T MRI System (Achieva1.5T, Philips Medical Systems). For tumor detection, an axialmulti-slice T2-weighted (T2w) TSE sequence (resolution 0.3 �0.3 � 0.7 mm3, minimum 25 slices, TE ¼ 90 milliseconds, TR >3 seconds) was applied on the mouse abdomen during freebreathing. Following, an axial multislice diffusion-weightedMRI (DW-MRI) sequence covering the tumors was performed(resolution 0.7 � 0.7 � 1.5 mm3, EPI factor ¼ 45, TR/TE ¼3,000/60 milliseconds, b0–2 values ¼ 20, 200, 600 s/mm2,averages ¼ 10).
MRIdata analysiswasperformedusingOsirix Imaging Softwareand in-house softwarewritten in IDL (ITT). ROI size ranged from2to 30mm2 and no correlation was noted between size of ROI andPDAC group (r ¼ 0.21; CI, 0.006–0.4). Histologically confirmedareas of necrosis were excluded from all imaging analyses. Imag-ing and corresponding histology ROIs were correlated slice basedfor every tumor region. All ROIs were manually defined based onhistologically defined tumor borders and quality of imaging data.In animals with several slices of the same tumor subtype, the slicewith the lowest potential for partial volume (i.e., central slice) wastaken. Up to three tumors per animal (i.e., head, neck and/or tailregion) were included. A total number of 68 animals and 100lesions were included into the study. All numbers are given asnumber of lesions used in particular study.
PatientsWritten informed consent was obtained from all patients. The
Institutional Review Board (IRB) approved prospective data col-lection and review of the patient charts for this project. Analysiswas conducted on a pseudonymized data set.
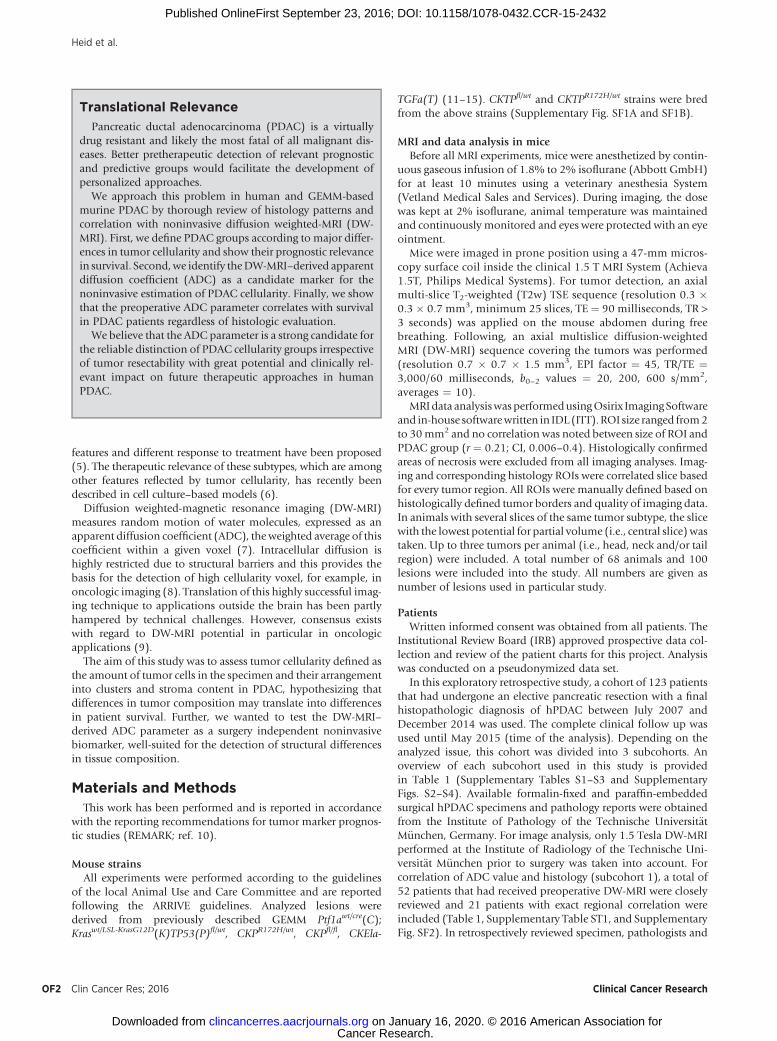
In this exploratory retrospective study, a cohort of 123 patientsthat had undergone an elective pancreatic resection with a finalhistopathologic diagnosis of hPDAC between July 2007 andDecember 2014 was used. The complete clinical follow up wasused until May 2015 (time of the analysis). Depending on theanalyzed issue, this cohort was divided into 3 subcohorts. Anoverview of each subcohort used in this study is providedin Table 1 (Supplementary Tables S1–S3 and SupplementaryFigs. S2–S4). Available formalin-fixed and paraffin-embeddedsurgical hPDAC specimens and pathology reports were obtainedfrom the Institute of Pathology of the Technische Universit€atM€unchen, Germany. For image analysis, only 1.5 Tesla DW-MRIperformed at the Institute of Radiology of the Technische Uni-versit€at M€unchen prior to surgery was taken into account. Forcorrelation of ADC value and histology (subcohort 1), a total of52 patients that had received preoperative DW-MRI were closelyreviewed and 21 patients with exact regional correlation wereincluded (Table 1, Supplementary Table ST1, and SupplementaryFig. SF2). In retrospectively reviewed specimen, pathologists and
Translational Relevance
Pancreatic ductal adenocarcinoma (PDAC) is a virtuallydrug resistant and likely the most fatal of all malignant dis-eases. Better pretherapeutic detection of relevant prognosticand predictive groups would facilitate the development ofpersonalized approaches.
We approach this problem in human and GEMM-basedmurine PDAC by thorough review of histology patterns andcorrelation with noninvasive diffusion weighted-MRI (DW-MRI). First, we define PDAC groups according to major differ-ences in tumor cellularity and show their prognostic relevancein survival. Second,we identify theDW-MRI–derived apparentdiffusion coefficient (ADC) as a candidate marker for thenoninvasive estimation of PDAC cellularity. Finally, we showthat the preoperative ADC parameter correlates with survivalin PDAC patients regardless of histologic evaluation.
We believe that the ADC parameter is a strong candidate forthe reliable distinction of PDAC cellularity groups irrespectiveof tumor resectability with great potential and clinically rel-evant impact on future therapeutic approaches in humanPDAC.
Heid et al.
Clin Cancer Res; 2016 Clinical Cancer ResearchOF2
Cancer Research. on January 16, 2020. © 2016 American Association forclincancerres.aacrjournals.org Downloaded from
Published OnlineFirst September 23, 2016; DOI: 10.1158/1078-0432.CCR-15-2432
radiologists together reviewed the pathologic reports and iden-tified the anatomical landmarks. Only cases in which a properco-registration of the pathologic area and ADC map was pos-sible were included in the analysis of subcohort 1. For survivalanalysis based on histologic findings (subcohort 2), a total of123 patients were reviewed and 96 patients were included(Table 1, Supplementary Table ST2, and Supplementary Fig.SF3). Median follow-up for patients of subcohort 2 was 17.73months (2.5–82.03 months). The respective PDAC group(hPDAClow, hPDACmed, hPDAChigh) was estimated from allavailable archived histologic slides (at least 3 different localiza-tions per tumor). For survival analysis based on lowest meanADC value (subcohort 3), a total of 52 patients that hadreceived preoperative DW-MRI was reviewed and 44 patientswith high-quality ADC maps throughout the entire tumor wereincluded (Table 1, Supplementary Table ST3, and Supplemen-tary Fig. SF4). Median follow-up for patients of subcohort 3 was28.43 months (2.63–82.13 months).
MRI and imaging data analysis in humansMRI was performed on a 1.5-T system (Magnetom Avanto,
Siemens Medical Solutions) with two six-channel body-phasedarray coils anterior and two spine clusters (three channels each)posterior. In addition to thediffusion-weighted sequences, at least acoronal T2-weighted half-Fourier single-shot turbo spin-echo(HASTE) sequence and an axial T2-weighted turbo spin-echosequence were acquired. Diffusion-weighted images were acquiredusing a single-shot echo-planar imaging sequence. To acquireimages with a high contrast-to-noise ratio for optimal conspicuityof pancreas tumors while keeping the influence of "pseudo-diffusion" by means of perfusion effects low, the minimumgradient factor (b value) was set at 50 s/mm2. Thus, the gradientfactors (b values) were 50, 300, and 600 s/mm2. The technicalparameters were as follows: echo time, 69milliseconds; echo trainlength, 58; echo spacing, 0.69 milliseconds; receiver bandwidth,1,736 Hz/pixel; spectral fat saturation; field of view, 263 � 350
mm;matrix, 144� 192; section thickness, 5mm.For shorteningofthe echo train length, integrated parallel imaging techniques(iPAT) by means of generalized auto-calibrating partially par-allel acquisitions (GRAPPA) with a twofold acceleration factorwere used. For respiratory triggering, prospective acquisitioncorrection (PACE) was implemented. Data were acquired dur-ing the end-expiratory phase. Both experienced radiologist (RB)and pathologists (IE and KS) correlated tumor specimen his-topathology and ADC map for lesion analysis (subcohort1; Table 1, Supplementary Table S1, and Supplementary Fig.SF2). Corresponding spherical ROIs with a minimal diameterof greater equal 10 mmwere placed in tumor of interest. For theADC-based survival analysis (subcohort 3; Table 1, Supple-mentary Table ST3, and Supplementary Fig. SF4), two experi-enced radiologists (RB, IH) consensually placed the ROIs with aminimal diameter of greater equal 10 mm into the region of thelowest ADC of the entire tumor blinded to histopathologicfindings and clinical outcome. The regional ADC values wererecorded as a mean value with standard deviation.
Histologic data analysisUpon euthanization, mPDAC were removed from the abdom-
inal cavity with adjacent organ structures (liver, spleen, gut,kidneys) to prevent change in orientation and facilitate exactcorrelation of imaging plane and histology based on additionalanatomical landmarks. After formalin fixation and paraffinembedding and hematoxylin and eosin (H&E) staining, axialhistologic slices through mouse abdomen with 400 mm distancewere correlated with DW-MRI. Stromal content and amount oftumor cells and the percentage of open spaces (ducts, cysts,vessels) were determined using H&E- and Movat's pentachrome(modified according to Verhoeff, Morphisto GmbH) stainedslides by two experienced pathologist (IE and KS) blinded forimaging findings andmouse genotype. The tumors were reviewedat least three times and the results were reproducible in all threereplicates.
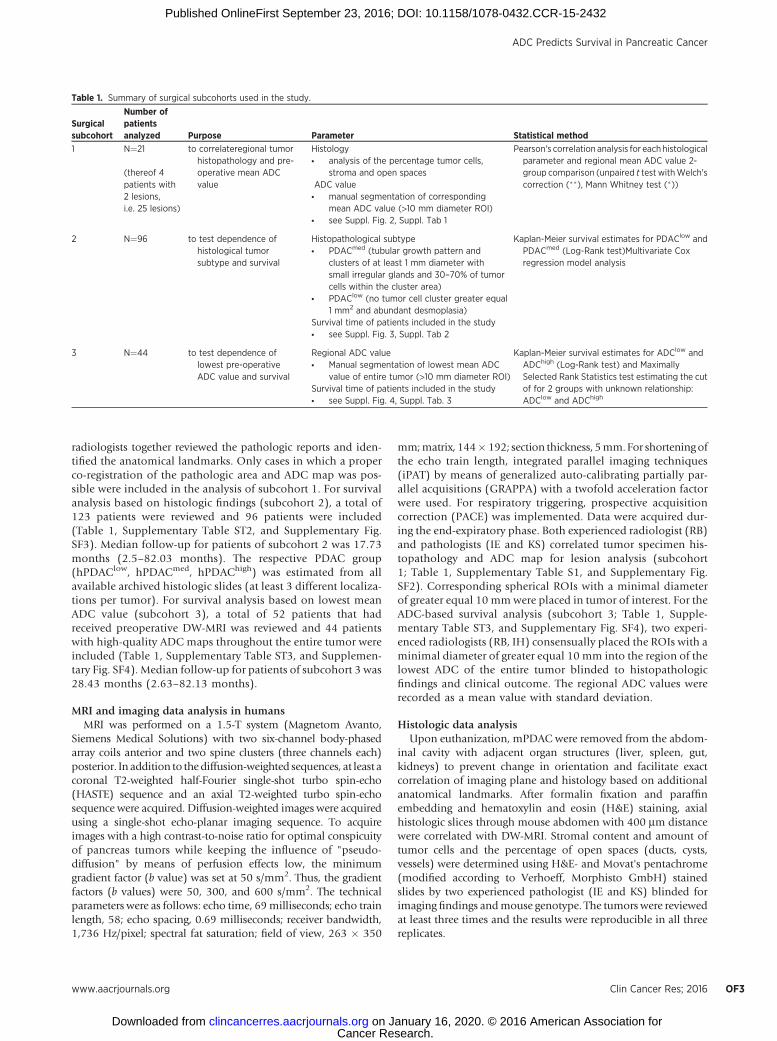
Table 1. Summary of surgical subcohorts used in the study.
Surgicalsubcohort
Number ofpatientsanalyzed Purpose Parameter Statistical method
1 N¼21
(thereof 4patients with2 lesions,i.e. 25 lesions)
to correlateregional tumorhistopathology and pre-operative mean ADCvalue
Histology* analysis of the percentage tumor cells,
stroma and open spacesADC value
* manual segmentation of correspondingmean ADC value (>10 mm diameter ROI)
* see Suppl. Fig. 2, Suppl. Tab 1
Pearson's correlation analysis for each histologicalparameter and regional mean ADC value 2-group comparison (unpaired t test withWelch'scorrection (��), Mann Whitney test (�))
2 N¼96 to test dependence ofhistological tumorsubtype and survival
Histopathological subtype* PDACmed (tubular growth pattern and
clusters of at least 1 mm diameter withsmall irregular glands and 30–70% of tumorcells within the cluster area)
* PDAClow (no tumor cell cluster greater equal1 mm2 and abundant desmoplasia)
Survival time of patients included in the study* see Suppl. Fig. 3, Suppl. Tab 2
Kaplan-Meier survival estimates for PDAClow andPDACmed (Log-Rank test)Multivariate Coxregression model analysis
3 N¼44 to test dependence oflowest pre-operativeADC value and survival
Regional ADC value* Manual segmentation of lowest mean ADC
value of entire tumor (>10 mm diameter ROI)Survival time of patients included in the study* see Suppl. Fig. 4, Suppl. Tab. 3
Kaplan-Meier survival estimates for ADClow andADChigh (Log-Rank test) and MaximallySelected Rank Statistics test estimating the cutof for 2 groups with unknown relationship:ADClow and ADChigh
ADC Predicts Survival in Pancreatic Cancer
www.aacrjournals.org Clin Cancer Res; 2016 OF3
Cancer Research. on January 16, 2020. © 2016 American Association forclincancerres.aacrjournals.org Downloaded from
Published OnlineFirst September 23, 2016; DOI: 10.1158/1078-0432.CCR-15-2432

Grading of mPDAC and hPDAC was performed according toWHO classification of tumors of the pancreas considering actualconsensus reports of pathology of GEMM (16, 17). Tumors thatrevealed a heterogeneous phenotype with partially well andpoorly differentiated morphology were always classified to theworse grade corresponding to clinical standards.
Definition of histopathologic groupsTumor cellularity has beendefined as the amount of tumor cells
in the specimen and their arrangement into clusters. Based on thePDAC groups identified after co-registration of histology withDW-MRI in subcohort 1, a definition of hPDAC classificationbased on the occurrence of tumor cell clusters greater equal 1mm2
Figure 1.
Histologic heterogeneity of human PDAC correlates with survival prognosis. A, Representative large-scale overview and higher magnification micrographsof hPDAC reveal regional differences in tumor cellularity and stromal content, that is, hPDAClow and hPDACmed. H&E staining, scale baroverview 1 cm, scalebarmagnification 200mm.B,Classification of humanhistology according to tumor cellularity. Exemplary highmagnificationphotomicrographs ofH&EandMovat stainedhuman hPDAClow, hPDACmed, and hPDAChigh. Scale bar 100 mm. C and D, Kaplan–Meier survival analysis of hPDAClow (n ¼ 61, 20.93 months) and hPDACmed
(n¼ 35, 12.7 months) as well as G2 (n¼ 47, 23.13 months) and G3 (n¼ 49, 13.2 months) hPDAC patients (subcohort 2). E, Kaplan–Meier survival analysis taking bothgrading and tumor into account (hPDAClow/G2, n¼ 32, 34.4 months; hPDAClow/G3þ4, n ¼ 29, 14.6 months; hPDACmed/G2, n ¼ 15, 16.2 months; hPDACmed/G3þ4,n ¼ 20, 11.6 months). All groups were compared using log-rank test.
Heid et al.
Clin Cancer Res; 2016 Clinical Cancer ResearchOF4
Cancer Research. on January 16, 2020. © 2016 American Association forclincancerres.aacrjournals.org Downloaded from
Published OnlineFirst September 23, 2016; DOI: 10.1158/1078-0432.CCR-15-2432

Figure 2.
The ADC parameter predicts histologic heterogeneity of murine PDAC with high sensitivity and specificity. A, mPDAC faithfully recapitulates heterogeneityof hPDAC. Exemplary high magnification photomicrographs of H&E and Movat stained murine lesions of mPDAClow, mPDACmed, and mPDAChigh tumor.Scale bar 100 mm. B–D, Slice-based correlation of imaging and histology. T2w image, ADC map, and corresponding whole pancreas (yellow line) as well as highmagnification (box, scale bar¼ 50 mm) micrographs representing heterogeneity in mPDAC. Each region of mPDAClow (fine dotted line), mPDACmed (rough dottedline), andmPDAChigh (solid line) is well correlated and clearly distinguishable on ADCmap. Corresponding histogram analyses of different regions are shown below.
ADC Predicts Survival in Pancreatic Cancer
www.aacrjournals.org Clin Cancer Res; 2016 OF5
Cancer Research. on January 16, 2020. © 2016 American Association forclincancerres.aacrjournals.org Downloaded from
Published OnlineFirst September 23, 2016; DOI: 10.1158/1078-0432.CCR-15-2432
was developed and subsequently also applied to subcohort 2.hPDAC were classified as high-level cellular (hPDAChigh), in caseof predominantly solid growth pattern with >70% tumor cells(reflecting PDAC variants such as adenosquamous or medullarycarcinoma) and only very small amounts of accompanying stro-mawithin the cluster region (Supplementary Fig. SF5A).Medium-level cellular tumors (hPDACmed) showed a classical tubulargrowth pattern but exhibited clusters of small irregular glands(30–70%of tumor cells within the cluster area).Morphologically,these clusters consisted of neoplastic cells with solid, cribriform,or gyriform growth patterns or with single pleomorphictumor cells (Supplementary Fig. SF5B). PDAC were classified aslow-level cellular (hPDAClow) if no tumor cell cluster greaterequal 1 mm2 was found in any of the localizations investigated(Supplementary Fig. SF5C). Classification of hPDAC was per-formedby two experienced pathologists (IE, KS). The tumorswerereviewed blinded at least three times and the results were repro-ducible in all three replicates.
As for mPDAC, we applied the same classification. Cellularitycut offs differed due to the higher amount of invasive cancer cellsobserved in the murine specimens in correlation with DW-MRI:1% to 40% for mPDAClow, 40% to 85% for mPDACmed and 85%to 100% for mPDAChigh.
Statistical analysisNo formal sample size calculation was performed prior to the
study. Based on the actual sample size, a true correlation ofmurine histology parameter and ADC value (r ¼ 0.3) and a truehazard ratio between the human survival groups was detectedwith a power of 80% and 90%, respectively. Data are illustrated indot plots stratified for groups. Most statistical analyses were donein GraphPad Prism version 6.0e. For all statistical tests, a level ofsignificance of 5% was used. ANOVA (��) was performed forgroup comparisons of normally distributed quantities, if datawere observed to be skewed, the Kruskal–Wallis (�) test wasconducted. For pairwise group comparisons, Holm–Sidak's (��)orDunn's post hoc test (�)was applied, respectively. For two groups
comparison, either unpaired t test with Welch's correction (��) orMann–Whitney test (�) was used. P values were always used fromtwo-sided calculation. The strength of association between quan-titative measures was assessed by Pearson's correlation coefficient(all data sets revealed normal distribution) and a corresponding95% confidence interval is presented.
Survival analysis was performed using the Kaplan–Meiermeth-od; differences were evaluated with the log-rank test. In addition,Cox regression was performed to estimate hazard ratios with 95%confidence intervals (SSPS version 23). For human samples,analysis overall survival (OS) was defined as time from resection(subcohort 2) or as time frompreoperative imaging (subcohort 3)until death after discharge or until last follow-up collected tillMay2015. In addition, for subcohort 2, amultivariable Cox regressionmodel was fit to the data including the covariates PDAC (med vs.low), age, sex, T-status (T), lymph node infiltration (N), grading(G), resection margin (R) and CTX to assess whether PDAC isassociated with overall survival after adjustment for these pre-dictors. To determine a cut-off value for lowest ADC value (sub-cohort 3) to best discriminate high-risk from low-risk patientswith regard to overall survival, the value providing the highest log-rank statistic was used. A P value for association between thelowest ADC value and overall survival was derived by a permu-tation tests, as proposed previously (18), using the statisticalsoftware R (19) and its package coin (20). A multivariableregression model could not be fitted to the subcohort 3 data dueto the small number of observed events (21). Therefore, thepermutation test assessing the association between overall sur-vival and lowest ADCwas also performed stratified by each of therelevant categorical variables (T, N, G, R, CTX).
ResultsTumor cellularity reciprocally correlates with stroma contentand is a prognostic factor of survival in human PDAC
High inter- and intratumoral genetic and molecular heteroge-neity have been identified as potential obstacles to successful
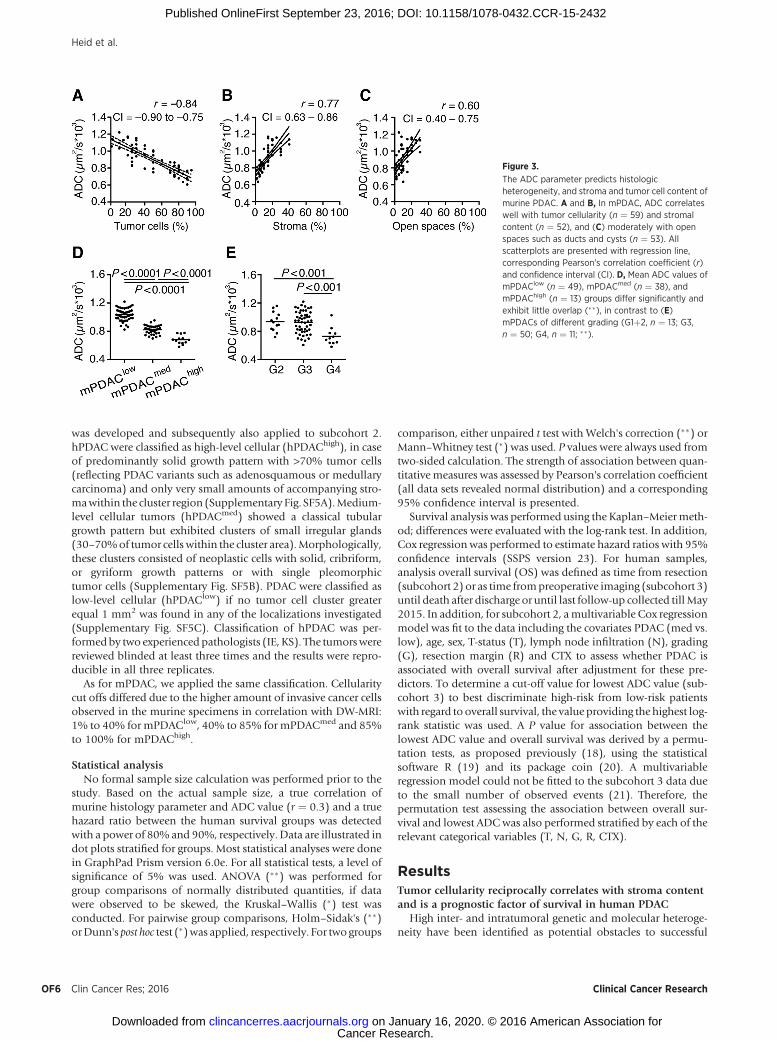
Figure 3.
The ADC parameter predicts histologicheterogeneity, and stroma and tumor cell content ofmurine PDAC. A and B, In mPDAC, ADC correlateswell with tumor cellularity (n ¼ 59) and stromalcontent (n ¼ 52), and (C) moderately with openspaces such as ducts and cysts (n ¼ 53). Allscatterplots are presented with regression line,corresponding Pearson's correlation coefficient (r)and confidence interval (CI). D, Mean ADC values ofmPDAClow (n ¼ 49), mPDACmed (n ¼ 38), andmPDAChigh (n ¼ 13) groups differ significantly andexhibit little overlap (��), in contrast to (E)mPDACs of different grading (G1þ2, n ¼ 13; G3,n ¼ 50; G4, n ¼ 11; ��).
Heid et al.
Clin Cancer Res; 2016 Clinical Cancer ResearchOF6
Cancer Research. on January 16, 2020. © 2016 American Association forclincancerres.aacrjournals.org Downloaded from
Published OnlineFirst September 23, 2016; DOI: 10.1158/1078-0432.CCR-15-2432
treatment of human PDAC (hPDAC; refs. 22, 23). Besides ratherhomogenous alterations in KRAS, TP53, CDKN2A and SMAD4,other genetic alterations are highly heterogeneous and go alongwithmetabolic andmorphologic heterogeneity, which likely addsto the ongoing low therapeutic benefits in humanPDAC (hPDAC;refs. 5, 23–25). This heterogeneity is also reflected by intratumoraldifferences in tumor architecture, that is, the amount of tumorcell, their arrangement into clusters and stroma (Fig. 1A). Weanalyzed regional tumor cellularity and stromal content in acohort of hPDAC specimen from patients that underwent anelective pancreatic resection at the Technical University ofMunich(Table 1, Supplementary Table ST1, and Supplementary Fig. SF2)and found an inverse relationship of the two tissue components(r¼�0.93; CI,�0.97 to�0.86). We next analyzed and classifiedhPDAC specimen (Table 1, Supplementary Table ST2, and Sup-plementary Fig. SF3) according to differentiation grade, neoplas-
tic cellularity, and stromal content (16, 17). Based on tumorcellularity we identified three groups: (i) low overall tumorcellularity, gland formation, and abundant desmoplastic stroma(hPDAClow), (ii) occurrence of cancer cell clusters with interme-diate cellularity or parts of solid growth pattern (hPDACmed), and(iii) high cellularity and low stroma content (hPDAChigh) asshown by H&E and Movat staining (Fig. 1B and SupplementaryFig. SF5). To test the prognostic value of this proposed tumorstratification, we performed a survival analysis of hPDACmed
versus hPDAClow and found a significantly worse survival ofhPDACmed patients (12.7 months vs. 20.93 months; P ¼0.001; HR ¼ 2.23; CI, 1.41–3.54; Fig. 1C). We excluded hPDA-Chigh patients from the survival analysis because of the lowfrequency of this group in our retrospective surgical cohort. Ina multivariable regression model adjusting for age, sex, pT, pN,grading, R, and CTX a significantly higher risk was estimated for
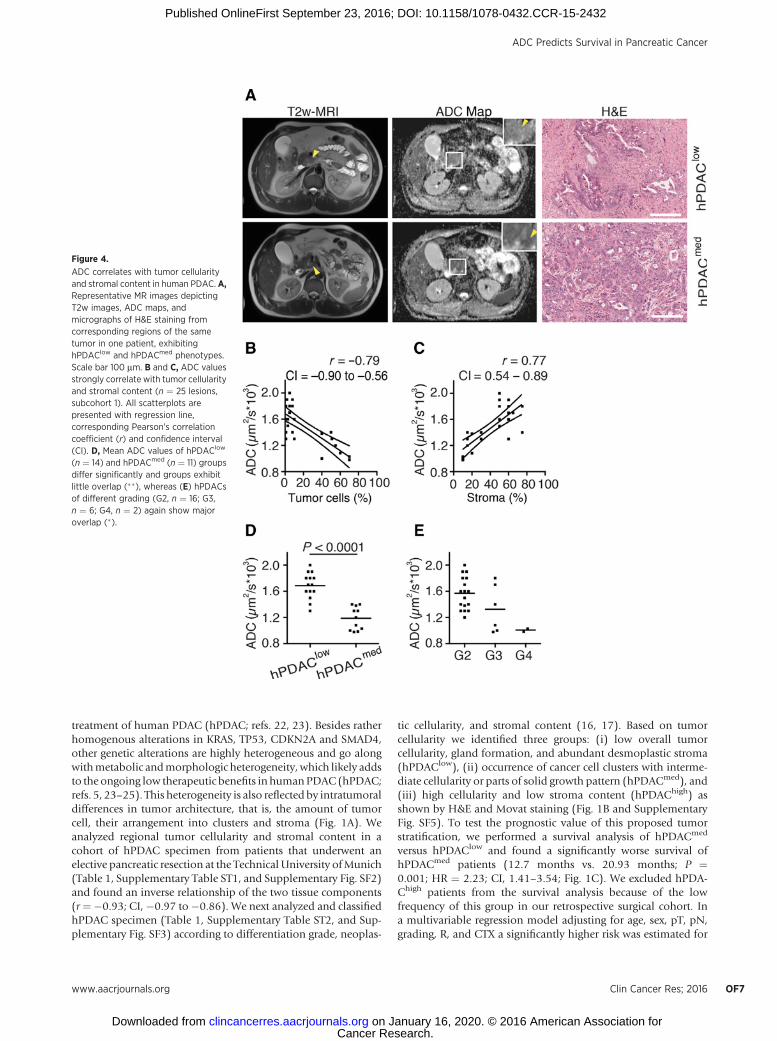
Figure 4.
ADC correlates with tumor cellularityand stromal content in human PDAC. A,Representative MR images depictingT2w images, ADC maps, andmicrographs of H&E staining fromcorresponding regions of the sametumor in one patient, exhibitinghPDAClow and hPDACmed phenotypes.Scale bar 100 mm. B and C, ADC valuesstrongly correlate with tumor cellularityand stromal content (n ¼ 25 lesions,subcohort 1). All scatterplots arepresented with regression line,corresponding Pearson's correlationcoefficient (r) and confidence interval(CI). D, Mean ADC values of hPDAClow
(n ¼ 14) and hPDACmed (n ¼ 11) groupsdiffer significantly and groups exhibitlittle overlap (��), whereas (E) hPDACsof different grading (G2, n ¼ 16; G3,n ¼ 6; G4, n ¼ 2) again show majoroverlap (�).
ADC Predicts Survival in Pancreatic Cancer
www.aacrjournals.org Clin Cancer Res; 2016 OF7
Cancer Research. on January 16, 2020. © 2016 American Association forclincancerres.aacrjournals.org Downloaded from
Published OnlineFirst September 23, 2016; DOI: 10.1158/1078-0432.CCR-15-2432
hPDACmed patients compared to hPDAClow patients (P ¼ 0.034;HR ¼ 1.73; CI, 1.04–2.89; Supplementary Table ST4). Asexpected, higher grading also resulted in worse median survivaltime (G3 ¼ 13.2 vs. G2 ¼ 23.13 months; P < 0.0001; HR ¼ 2.80;CI, 1.76–4.45; Fig. 1D). Interestingly, classification based ontumor cellularity and grading identified a subgroup of G2 tumorsof intermediate cellularity (hPDACmed/G2) with significantlyworse prognosis (16.17 months; P ¼ 0.001 compared tohPDACmed/G3 34.4 months; HR ¼ 4.85; CI, 1.64–7.19; Fig.1E, black line). Based on these findings, tumor cellularity is apotential prognostic factor of survival in hPDAC.
DW-MRI reliably detects tumor cellularity in murine PDACIn contrast to histologic grading, tumor cellularity and stro-
ma content present structural tissue parameters, potentiallyquantifiable by noninvasive imaging using DW-MRI (8). Toverify the DW-MRI–derived ADC parameter as a potentialimaging biomarker of tumor cellularity in murine PDAC(mPDAC), we next employed different KrasG12D-based genet-ically engineered mouse models (GEMM) of endogenousmPDAC to mirror the morphologic inter- and intratumoralheterogeneity of hPDAC. Tumors derived from six differentgenotypes were classified histologically according to the iden-tified hPDAC groups (Fig. 2A and Supplementary Fig. SF1A).Here, we also found an inverse relationship of tumor cellularityand stroma (r ¼ –0.61; CI, –0.72 to –0.47). We next establisheda platform for the slice-based regional correlation of histologiesand ADC maps with respective ADC histograms as exemplarilyshown for the different mPDAC (Fig. 2B–D). To further validatethe regional ADC value as a marker of tumor cellularity, weperformed a semiquantitative correlation. Here, the ADCparameter showed a strong negative correlation with tumor
cellularity (r ¼ �0.84; CI ¼ �0.90 to �0.75; Fig. 3A), a strongpositive correlation with tumor stroma (r ¼ 0.77; CI, 0.63–0.86; Fig. 3B) and a moderate positive correlation with cysticand ductal spaces (r ¼ 0.60; CI ¼ –0.40 to 0.75; Fig. 3C). Asexpected, we found major variability between individualmPDAC regions in agreement with high tissue heterogeneity.However, an excellent distinction and little overlap was evidentfor ADC values of mPDAClow (1.03 � 0.09), mPDACmed
(0.82 � 0.06), and mPDAChigh (0.68 � 0.06; Fig. 3D). Incontrast to tumor grading (Fig. 3E), which could not be clearlydistinguished by ADC (G2 ¼ 0.,94 � 0.14, G3 ¼ 0.93 � 0.16,G4 ¼ 0.73 � 0.13). Because of genotype-related differences intumor onset, no survival analyses were performed for mice(Supplementary Fig. SF1B).
The ADC value is a noninvasivemarker of tumor cellularity andcorrelates with survival in human PDAC
Encouragedby these results,we retrospectivelymatched region-al ADC values and histopathology (subcohort 1) that alsoreceived DW-MRI prior to tumor resection (Fig. 4A, Table 1,Supplementary Table ST1, and Supplementary Fig. ST2). In agree-ment with the results obtained formPDAC, a negative correlationof the ADC parameter with tumor cellularity (r¼ –0.79; CI, –0.90to –0.56; Fig. 4B) and a positive correlation with tumor stroma(r ¼ 0.77; CI, 0.54–0.89; Fig. 4C) was observed. No apparentcorrelation was evident for open spaces (r ¼ 0.21; CI, –0.19 to0.55). Nevertheless, hPDAClow and hPDACmed could be clearlydistinguished (1.69 � 0.19 vs. 1.19 � 0.18; Fig. 4D) with littleoverlap between them. As in mice, ADC values of tumors withdifferent histopathologic gradings revealed major overlap (G2 ¼1.57 � 0.29, G3 ¼ 1.33 � 0.36, G4 ¼ 1.02 � 0.03; Fig. 4E),precluding noninvasive differentiation.
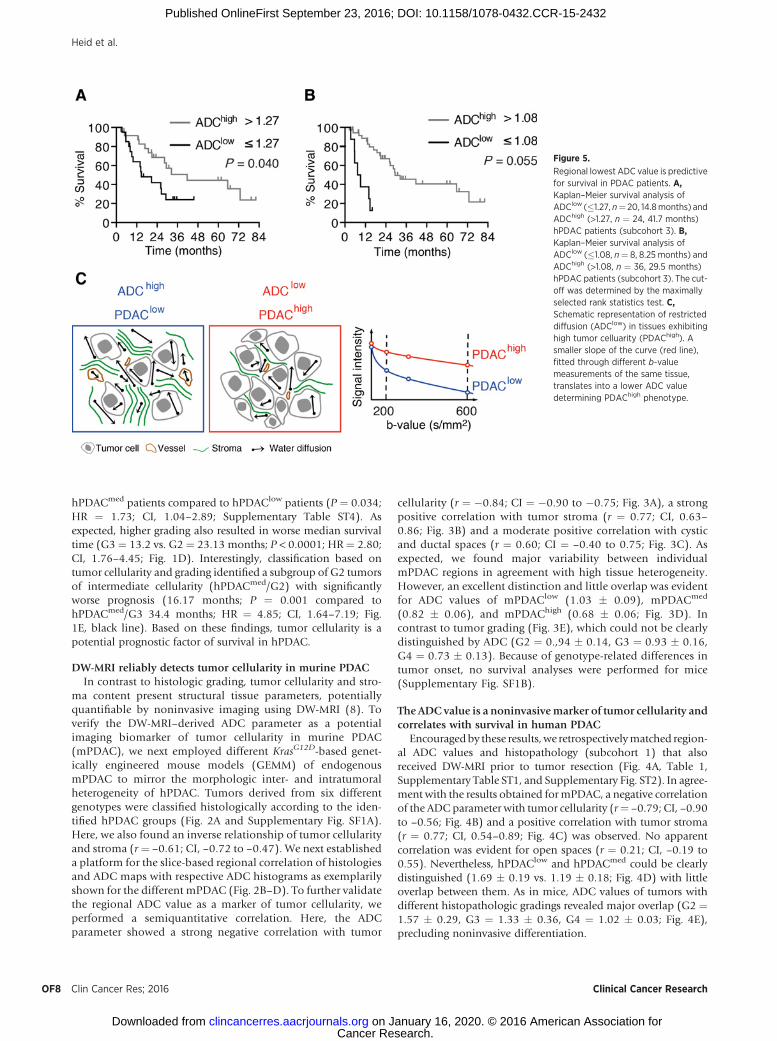
Figure 5.
Regional lowest ADC value is predictivefor survival in PDAC patients. A,Kaplan–Meier survival analysis ofADClow (�1.27, n¼ 20, 14.8months) andADChigh (>1.27, n ¼ 24, 41.7 months)hPDAC patients (subcohort 3). B,Kaplan–Meier survival analysis ofADClow (�1.08, n¼ 8, 8.25 months) andADChigh (>1.08, n ¼ 36, 29.5 months)hPDAC patients (subcohort 3). The cut-off was determined by the maximallyselected rank statistics test. C,Schematic representation of restricteddiffusion (ADClow) in tissues exhibitinghigh tumor celluarity (PDAChigh). Asmaller slope of the curve (red line),fitted through different b-valuemeasurements of the same tissue,translates into a lower ADC valuedetermining PDAChigh phenotype.
Heid et al.
Clin Cancer Res; 2016 Clinical Cancer ResearchOF8
Cancer Research. on January 16, 2020. © 2016 American Association forclincancerres.aacrjournals.org Downloaded from
Published OnlineFirst September 23, 2016; DOI: 10.1158/1078-0432.CCR-15-2432
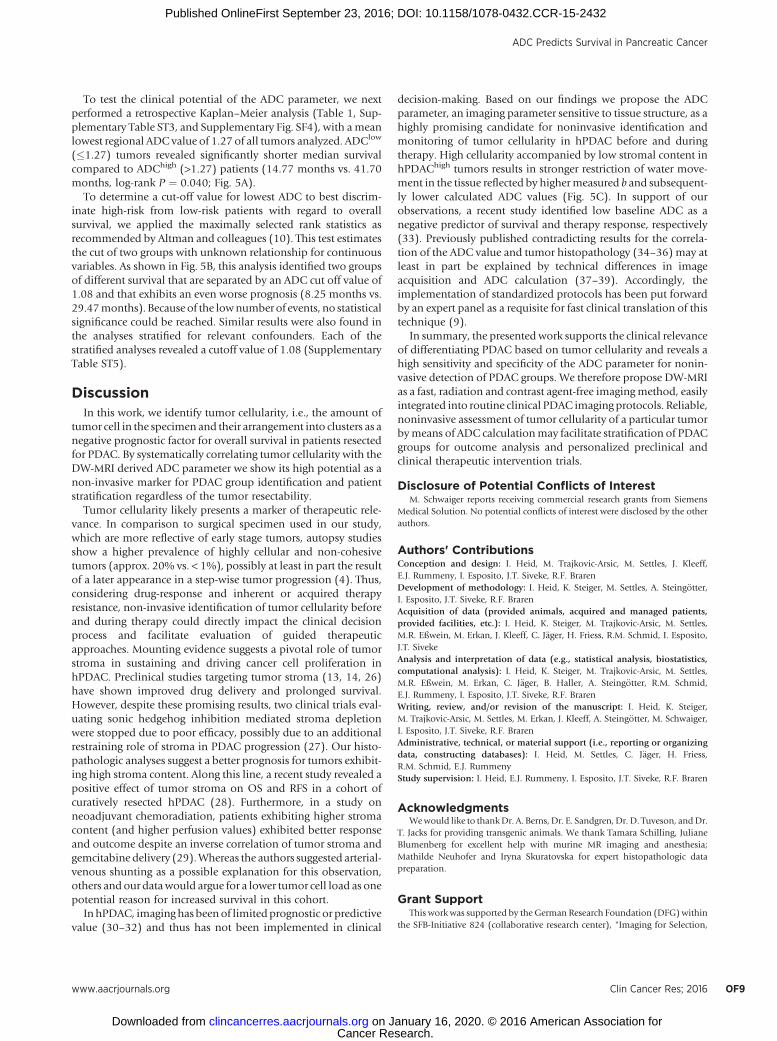
To test the clinical potential of the ADC parameter, we nextperformed a retrospective Kaplan–Meier analysis (Table 1, Sup-plementary Table ST3, and Supplementary Fig. SF4), with ameanlowest regional ADC value of 1.27 of all tumors analyzed. ADClow
(�1.27) tumors revealed significantly shorter median survivalcompared to ADChigh (>1.27) patients (14.77 months vs. 41.70months, log-rank P ¼ 0.040; Fig. 5A).
To determine a cut-off value for lowest ADC to best discrim-inate high-risk from low-risk patients with regard to overallsurvival, we applied the maximally selected rank statistics asrecommended by Altman and colleagues (10). This test estimatesthe cut of two groups with unknown relationship for continuousvariables. As shown in Fig. 5B, this analysis identified two groupsof different survival that are separated by an ADC cut off value of1.08 and that exhibits an even worse prognosis (8.25 months vs.29.47months). Because of the lownumber of events, no statisticalsignificance could be reached. Similar results were also found inthe analyses stratified for relevant confounders. Each of thestratified analyses revealed a cutoff value of 1.08 (SupplementaryTable ST5).
DiscussionIn this work, we identify tumor cellularity, i.e., the amount of
tumor cell in the specimen and their arrangement into clusters as anegative prognostic factor for overall survival in patients resectedfor PDAC. By systematically correlating tumor cellularity with theDW-MRI derived ADC parameter we show its high potential as anon-invasive marker for PDAC group identification and patientstratification regardless of the tumor resectability.
Tumor cellularity likely presents a marker of therapeutic rele-vance. In comparison to surgical specimen used in our study,which are more reflective of early stage tumors, autopsy studiesshow a higher prevalence of highly cellular and non-cohesivetumors (approx. 20% vs. < 1%), possibly at least in part the resultof a later appearance in a step-wise tumor progression (4). Thus,considering drug-response and inherent or acquired therapyresistance, non-invasive identification of tumor cellularity beforeand during therapy could directly impact the clinical decisionprocess and facilitate evaluation of guided therapeuticapproaches. Mounting evidence suggests a pivotal role of tumorstroma in sustaining and driving cancer cell proliferation inhPDAC. Preclinical studies targeting tumor stroma (13, 14, 26)have shown improved drug delivery and prolonged survival.However, despite these promising results, two clinical trials eval-uating sonic hedgehog inhibition mediated stroma depletionwere stopped due to poor efficacy, possibly due to an additionalrestraining role of stroma in PDAC progression (27). Our histo-pathologic analyses suggest a better prognosis for tumors exhibit-ing high stroma content. Along this line, a recent study revealed apositive effect of tumor stroma on OS and RFS in a cohort ofcuratively resected hPDAC (28). Furthermore, in a study onneoadjuvant chemoradiation, patients exhibiting higher stromacontent (and higher perfusion values) exhibited better responseand outcome despite an inverse correlation of tumor stroma andgemcitabine delivery (29).Whereas the authors suggested arterial-venous shunting as a possible explanation for this observation,others andour datawould argue for a lower tumor cell load as onepotential reason for increased survival in this cohort.
In hPDAC, imaging has been of limited prognostic or predictivevalue (30–32) and thus has not been implemented in clinical
decision-making. Based on our findings we propose the ADCparameter, an imaging parameter sensitive to tissue structure, as ahighly promising candidate for noninvasive identification andmonitoring of tumor cellularity in hPDAC before and duringtherapy. High cellularity accompanied by low stromal content inhPDAChigh tumors results in stronger restriction of water move-ment in the tissue reflected by highermeasured b and subsequent-ly lower calculated ADC values (Fig. 5C). In support of ourobservations, a recent study identified low baseline ADC as anegative predictor of survival and therapy response, respectively(33). Previously published contradicting results for the correla-tion of the ADC value and tumor histopathology (34–36) may atleast in part be explained by technical differences in imageacquisition and ADC calculation (37–39). Accordingly, theimplementation of standardized protocols has been put forwardby an expert panel as a requisite for fast clinical translation of thistechnique (9).
In summary, the presented work supports the clinical relevanceof differentiating PDAC based on tumor cellularity and reveals ahigh sensitivity and specificity of the ADC parameter for nonin-vasive detection of PDAC groups. We therefore propose DW-MRIas a fast, radiation and contrast agent-free imagingmethod, easilyintegrated into routine clinical PDAC imaging protocols. Reliable,noninvasive assessment of tumor cellularity of a particular tumorbymeans of ADC calculationmay facilitate stratification of PDACgroups for outcome analysis and personalized preclinical andclinical therapeutic intervention trials.
Disclosure of Potential Conflicts of InterestM. Schwaiger reports receiving commercial research grants from Siemens
Medical Solution. No potential conflicts of interest were disclosed by the otherauthors.
Authors' ContributionsConception and design: I. Heid, M. Trajkovic-Arsic, M. Settles, J. Kleeff,E.J. Rummeny, I. Esposito, J.T. Siveke, R.F. BrarenDevelopment of methodology: I. Heid, K. Steiger, M. Settles, A. Steing€otter,I. Esposito, J.T. Siveke, R.F. BrarenAcquisition of data (provided animals, acquired and managed patients,provided facilities, etc.): I. Heid, K. Steiger, M. Trajkovic-Arsic, M. Settles,M.R. Eßwein, M. Erkan, J. Kleeff, C. J€ager, H. Friess, R.M. Schmid, I. Esposito,J.T. SivekeAnalysis and interpretation of data (e.g., statistical analysis, biostatistics,computational analysis): I. Heid, K. Steiger, M. Trajkovic-Arsic, M. Settles,M.R. Eßwein, M. Erkan, C. J€ager, B. Haller, A. Steing€otter, R.M. Schmid,E.J. Rummeny, I. Esposito, J.T. Siveke, R.F. BrarenWriting, review, and/or revision of the manuscript: I. Heid, K. Steiger,M. Trajkovic-Arsic, M. Settles, M. Erkan, J. Kleeff, A. Steing€otter, M. Schwaiger,I. Esposito, J.T. Siveke, R.F. BrarenAdministrative, technical, or material support (i.e., reporting or organizingdata, constructing databases): I. Heid, M. Settles, C. J€ager, H. Friess,R.M. Schmid, E.J. RummenyStudy supervision: I. Heid, E.J. Rummeny, I. Esposito, J.T. Siveke, R.F. Braren
AcknowledgmentsWewould like to thankDr. A. Berns, Dr. E. Sandgren, Dr. D. Tuveson, andDr.
T. Jacks for providing transgenic animals. We thank Tamara Schilling, JulianeBlumenberg for excellent help with murine MR imaging and anesthesia;Mathilde Neuhofer and Iryna Skuratovska for expert histopathologic datapreparation.
Grant SupportThis work was supported by the German Research Foundation (DFG) within
the SFB-Initiative 824 (collaborative research center), "Imaging for Selection,
www.aacrjournals.org Clin Cancer Res; 2016 OF9
ADC Predicts Survival in Pancreatic Cancer
Cancer Research. on January 16, 2020. © 2016 American Association forclincancerres.aacrjournals.org Downloaded from
Published OnlineFirst September 23, 2016; DOI: 10.1158/1078-0432.CCR-15-2432
Monitoring and Individualization of Cancer Therapies" (SFB824, project C4,C6, and Z2), the European Community's Seventh Framework Program (FP7/CAM-PaC) under grant agreement no. 602783, and by the German CancerConsortium (DKTK; to M. Schwaiger, R.M. Schmid, and J.T. Siveke).
The costs of publication of this article were defrayed in part by thepayment of page charges. This article must therefore be hereby marked
advertisement in accordance with 18 U.S.C. Section 1734 solely to indicatethis fact.
ReceivedOctober 7, 2015; revised August 14, 2016; accepted August 29, 2016;published OnlineFirst September 23, 2016.
References1. Raimondi S, Maisonneuve P, Lowenfels AB. Epidemiology of pancreatic
cancer: an overview. Nat Rev Gastroenterol Hepatol 2009;6:699–708.2. Ozdemir BC, Pentcheva-Hoang T, Carstens JL, Zheng X, Wu CC, Simpson
TR, et al. Depletion of carcinoma-associated fibroblasts and fibrosisinduces immunosuppression and accelerates pancreas cancer with reducedsurvival. Cancer Cell 2014;25:719–34.
3. Polyak K, Weinberg RA. Transitions between epithelial and mesenchymalstates: acquisition of malignant and stem cell traits. Nat Rev Cancer2009;9:265–73.
4. Winter JM, Ting AH, Vilardell F, Gallmeier E, Baylin SB, Hruban RH, et al.Absence of E-cadherin expression distinguishes noncohesive from cohesivepancreatic cancer. Clin Cancer Res 2008;14:412–8.
5. Collisson EA, Sadanandam A, Olson P, Gibb WJ, Truitt M, Gu S, et al.Subtypes of pancreatic ductal adenocarcinoma and their differingresponses to therapy. Nat Med 2011;17:500–3.
6. Mirzoeva OK, Collisson EA, Schaefer PM, Hann B, Hom YK, Ko AH, et al.Subtype-specific MEK-PI3 kinase feedback as a therapeutic target in pan-creatic adenocarcinoma. Mol Cancer Ther 2013;12:2213–25.
7. Bammer R.Basic principles of diffusion-weighted imaging. Eur J Radiol2003;45:169–84.
8. KohDM,CollinsDJ.Diffusion-weightedMRI in the body: applications andchallenges in oncology. AJR Am J Roentgenol 2007;188:1622–35.
9. Taouli B, Beer AJ, Chenevert T, Collins D, Lehman C, Matos C, et al.Diffusion-weighted imaging outside the brain: consensus statement froman ISMRM-sponsored workshop. J Magn Reson Imaging 2016;44:521–40.
10. Altman DG, McShane LM, Sauerbrei W, Taube SE. Reporting recommen-dations for tumor marker prognostic studies (REMARK): explanation andelaboration. PLoS Med 2012;9:e1001216.
11. Ardito CM, Gruner BM, Takeuchi KK, Lubeseder-Martellato C, TeichmannN, Mazur PK, et al. EGF receptor is required for KRAS-induced pancreatictumorigenesis. Cancer Cell 2012;22:304–17.
12. Hingorani SR, Wang L, Multani AS, Combs C, Deramaudt TB, Hruban RH,et al. Trp53R172H and KrasG12D cooperate to promote chromosomalinstability and widely metastatic pancreatic ductal adenocarcinoma inmice. Cancer Cell 2005;7:469–83.
13. Olive KP, Jacobetz MA, Davidson CJ, Gopinathan A, McIntyre D,Honess D, et al. Inhibition of Hedgehog signaling enhances deliveryof chemotherapy in a mouse model of pancreatic cancer. Science2009;324:1457–61.
14. Provenzano PP, Cuevas C, Chang AE, Goel VK, Von Hoff DD, HingoraniSR. Enzymatic targeting of the stroma ablates physical barriers totreatment of pancreatic ductal adenocarcinoma. Cancer Cell 2012;21:418–29.
15. Siveke JT, Einwachter H, Sipos B, Lubeseder-Martellato C, Kloppel G,Schmid RM. Concomitant pancreatic activation of Kras(G12D) and Tgfaresults in cystic papillary neoplasms reminiscent of human IPMN. CancerCell 2007;12:266–79.
16. Bosman FT CF, Hruban RH, Theise ND. WHO classification of tumours ofthe digestive system. Lyon, France. TheWorldHealthOrganization. 4th ed.;2010.
17. Hruban RH, Adsay NV, Albores-Saavedra J, Anver MR, Biankin AV, BoivinGP, et al. Pathology of genetically engineered mouse models of pancreaticexocrine cancer: consensus report and recommendations. Cancer Res2006;66:95–106.
18. Hothorn T, Zeileis A. Generalized maximally selected statistics. Biometrics2008;64:1263–9.
19. Team RC. R: A language and environment for statistical computing. RFoundation for Statistical Computing, Vienna, Austria; 2014.
20. Hothorn T HK, van de Wiel MA, Zeileis A. Implementing a class ofpermutation tests: the coin package. J Stat Soft 2008;281–23.
21. Harrell FE.Regression modeling strategies: with applications to linearmodels, logistic regression, and survival analysis. New York: SpringerScience & Business Media; 2013;1–11.
22. Waddell N, Pajic M, Patch AM, Chang DK, Kassahn KS, Bailey P, et al.Whole genomes redefine the mutational landscape of pancreatic cancer.Nature 2015;518:495–501.
23. Witkiewicz AK, McMillan EA, Balaji U, Baek G, Lin WC, Mansour J, et al.Whole-exome sequencing of pancreatic cancer defines genetic diversity andtherapeutic targets. Nat Commun 2015;6:6744.
24. Bailey P, Chang DK, Nones K, Johns AL, Patch AM, Gingras MC, et al.Genomic analyses identifymolecular subtypes of pancreatic cancer. Nature2016;531:47–52.
25. Daemen A, Peterson D, Sahu N, McCord R, Du X, Liu B, et al. Metaboliteprofiling stratifies pancreatic ductal adenocarcinomas into subtypes withdistinct sensitivities to metabolic inhibitors. Proc Natl Acad Sci U S A2015;112:E4410–7.
26. Jacobetz MA, Chan DS, Neesse A, Bapiro TE, Cook N, Frese KK, et al.Hyaluronan impairs vascular function and drug delivery in amousemodelof pancreatic cancer. Gut 2013;62:112–20.
27. Lee JJ, Perera RM,WangH,WuDC, Liu XS,Han S, et al. Stromal response toHedgehog signaling restrains pancreatic cancer progression. ProcNatl AcadSci U S A 2014;111:E3091–100.
28. Torphy RJ, Volmar KE, Naim R, Cader SR, Johansen JS, Hollingsworth MA,et al. Quantification of tumor stroma as a biomarker in pancreatic ade-nocarcinoma. J Clin Oncol 2015;33 (suppl; abstr 4021).
29. Koay EJ, Truty MJ, Cristini V, Thomas RM, Chen R, Chatterjee D, et al.Transport properties of pancreatic cancer describe gemcitabine deliveryand response. J Clin Invest 2014;124:1525–36.
30. D'Onofrio M, Gallotti A, Mantovani W, Crosara S, Manfrin E, Falconi M,et al. Perfusion CT can predict tumoral grading of pancreatic adenocarci-noma. Eur J Radiol 2013;82:227–33.
31. Epelbaum R, Frenkel A, Haddad R, Sikorski N, Strauss LG, Israel O, et al.Tumor aggressiveness and patient outcome in cancer of the pancreasassessed by dynamic 18F-FDG PET/CT. J Nucl Med 2013;54:12–8.
32. Rosenkrantz AB, Matza BW, Sabach A, Hajdu CH, Hindman N. Pancreaticcancer: lack of association between apparent diffusion coefficient valuesand adverse pathological features. Clin Radiol 2013;68:e191–7.
33. Kurosawa J, Tawada K, Mikata R, Ishihara T, Tsuyuguchi T, Saito M, et al.Prognostic relevance of apparent diffusion coefficient obtained by diffu-sion-weighted MRI in pancreatic cancer. J Magn Reson Imaging2015;42:1532–7.
34. Klauss M, Gaida MM, Lemke A, Grunberg K, Simon D, Wente MN, et al.Fibrosis and pancreatic lesions: counterintuitive behavior of the diffusionimaging-derived structural diffusion coefficient d. Invest Radiol 2013;48:129–33.
35. Muraoka N, Uematsu H, Kimura H, Imamura Y, Fujiwara Y, Murakami M,et al. Apparent diffusion coefficient in pancreatic cancer: characterizationandhistopathological correlations. JMagnReson Imaging 2008;27:1302–8.
36. Wang Y, Chen ZE, Yaghmai V, Nikolaidis P, McCarthy RJ, Merrick L, et al.Diffusion-weighted MR imaging in pancreatic endocrine tumors correlatedwith histopathologic characteristics. J Magn Reson Imaging 2011;33:1071–9.
37. Hansmann J, Hernando D, Reeder SB. Fat confounds the observed appar-ent diffusion coefficient in patientswithhepatic steatosis.MagnResonMed2013;69:545–52.
38. Le Bihan D, Breton E, Lallemand D, Aubin ML, Vignaud J, Laval-Jeantet M.Separation of diffusion and perfusion in intravoxel incoherentmotionMRimaging. Radiology 1988;168:497–505.
39. Reeder SB, Cruite I, HamiltonG, Sirlin CB.Quantitative assessment of liverfat with magnetic resonance imaging and spectroscopy. J Magn ResonImaging 2011;34:729–49.
Clin Cancer Res; 2016 Clinical Cancer ResearchOF10
Heid et al.
Cancer Research. on January 16, 2020. © 2016 American Association forclincancerres.aacrjournals.org Downloaded from
Published OnlineFirst September 23, 2016; DOI: 10.1158/1078-0432.CCR-15-2432
Published OnlineFirst September 23, 2016.Clin Cancer Res Irina Heid, Katja Steiger, Marija Trajkovic-Arsic, et al. CancerCo-clinical Assessment of Tumor Cellularity in Pancreatic
Updated version
10.1158/1078-0432.CCR-15-2432doi:
Access the most recent version of this article at:
Material
Supplementary
http://clincancerres.aacrjournals.org/content/suppl/2016/09/23/1078-0432.CCR-15-2432.DC1Access the most recent supplemental material at:
E-mail alerts related to this article or journal.Sign up to receive free email-alerts
Subscriptions
Reprints and
To order reprints of this article or to subscribe to the journal, contact the AACR Publications
Permissions
Rightslink site. (CCC)Click on "Request Permissions" which will take you to the Copyright Clearance Center's
.http://clincancerres.aacrjournals.org/content/early/2017/01/18/1078-0432.CCR-15-2432To request permission to re-use all or part of this article, use this link
Cancer Research. on January 16, 2020. © 2016 American Association forclincancerres.aacrjournals.org Downloaded from
Published OnlineFirst September 23, 2016; DOI: 10.1158/1078-0432.CCR-15-2432