Embed Size (px)
Citation preview
CO-CREATING KNOWLEDGE, UNDERSTANDING, AND ACTION FOR
EFFECTIVE NATURAL RESOURCE CONSERVATION
A Dissertation
by
LAURA SUZANNE WEBER
Submitted to the Office of Graduate Studies of Texas A&M University
in partial fulfillment of the requirements for the degree of
DOCTOR OF PHILOSOPHY
May 2012
Major Subject: Wildlife and Fisheries Sciences

Co-Creating Knowledge, Understanding, and Action for Effective Natural
Resource Conservation
Copyright 2012 Laura Suzanne Weber
CO-CREATING KNOWLEDGE, UNDERSTANDING, AND ACTION FOR
EFFECTIVE NATURAL RESOURCE CONSERVATION
A Dissertation
by
LAURA SUZANNE WEBER
Submitted to the Office of Graduate Studies of Texas A&M University
in partial fulfillment of the requirements for the degree of
DOCTOR OF PHILOSOPHY
Approved by:
Co-Chairs of Committee, Thomas E. Lacher, Jr. R. Douglas Slack Committee Members, Urs P. Kreuter Amanda Stronza Head of Department, John Carey
May 2012
Major Subject: Wildlife and Fisheries Sciences
iii
ABSTRACT
Co-creating Knowledge, Understanding, and Action for Effective Natural
Resource Conservation. (May 2012)
Laura Suzanne Weber, B.A., The American University; M.A., University of
Arizona
Co-Chairs of Advisory Committee: Dr. Thomas E. Lacher, Jr. Dr. R. Douglas Slack
Previous research shows that socio-cultural factors play an important role
in determining the outcomes of natural resource conservation. Conservationists
have discovered that when such factors are not properly incorporated from the
earliest planning stages, projects are often less successful than hoped and at
times outright failures. Thus, several core values that vary among cultures were
studied to examine their relationships to natural resources and conservation.
This study investigated the relationships between natural resources and
conservation and the 3 value orientations individualism, collectivism, and locus
of control and socio-demographics in the North Rupununi, Guyana. Quantitative
and qualitative data were collected in 5 villages (Annai Central, Apoteri, Rewa,
Aranaputa, and Wowetta) via participant observation and mostly structured
interviews of 167 local residents. Field research took place from January to
November 2008, and interviews occurred from July to October of the same year.
iv
Analysis indicates the following results for this sample. Neither the
individualism measurement used in this study not the locus of control scale
showed many statistically significant associations, but some interesting patterns
and trends appear in the case of locus of control. In contrast, the collectivism
scale showed associations to several of the natural resource items.
The main conclusions from the study are that to promote more successful
conservation, professionals need to focus on several factors that promote more
effective communication and negotiation. Developing equity among participants;
empowering people through their own knowledge, influence, and options;
establishing respect by and for all parties; co-creating a common mental model
among the parties; and fostering the competence and confidence of all parties to
actively participate in the negotiations are key to success.
This can be especially tricky in cases in which the various parties come
from different socio-cultural backgrounds, such as in the case of Western
scientists working with remote indigenous peoples. Coming to a shared mental
model and feelings of true equity among the parties is even harder then because
the disparate backgrounds make common understanding difficult at best.
However, it is that much more necessary when common backgrounds are
absent. In such cases, a well-trained, culturally sensitive, and neutral facilitator
can be the most useful tool to help co-create the right circumstances for
authoring solutions which foster natural resource conservation that can succeed.
v
DEDICATION
Dedicated to my father, Frederick John Weber, who was an amazing and
inspiring person. I wish he were here to read this.
vi
ACKNOWLEDGEMENTS
So many people helped me make this research and, consequently, this
degree happen. I hardly know where to start with all of my thanks.
My committee co-chairs, Tom Lacher and Doug Slack, who have believed
in me from the beginning, have given me the support I needed to see this
through. I am so grateful for their guidance, financial support, expertise, and
time throughout the years. My other committee members, Urs Kreuter and
Amanda Stronza, also contributed their expertise, experience, and time to guide
my years of study and research. I thank them all most sincerely.
Perhaps most importantly, I want to thank the people in the North
Rupununi, Guyana, for their participation in my project, in addition to their
assistance, patience, and friendship to me for the many months I spent with
them. None of this would have been possible without them and all their help.
The staff of the Iwokrama International Centre for Rainforest
Conservation and Development, Conservation International Guyana, the
Guyana Ministry of Amerindian Affairs, and the Guyana Environmental
Protection Agency gave me assistance in so many ways. These people met me
at the airport, picked up boxes for me in Georgetown, carted my boxes to the
North Rupununi in their vehicles, provided transportation for me when possible,
helped me make various travel arrangements, let me use their offices, and more.
vii
So many friends and colleagues helped make this possible in various
ways. For support academically and otherwise, I thank Valerie Balester, Rob
Powell, Todd Swannack, Humberto Perrotto, Fernanda Pegas, Sandra Bryant,
and Josué Martínez. So many people encouraged me during the writing
process itself. Masha Sukovic, Cem Yüksel, Lisa Tauferner, Xiaoli Bai, Melissa
Barilli, Ian Murray, Alfredo Pérez, Holly Lawder, Aaran Mattson, and Brenda Fry,
among others. I give sincerest thanks to David Rossbach for helping me at
home suring the field research stage. To my salsa dancing buddies, and most
especially our rueda de casino instructor Jorge Dorribo Camba, thank you for
saving my sanity.
The people in the Department of Wildlife and Fisheries Sciences at Texas
A&M were always there to help me, too. The faculty and staff, in particular Vicki
Buckbee and Shirley Konecny, were so kind and generous with their time and
assistance over the years. I‘d like to give a special thanks to Bill Grant, who
stepped in to help out in by substituting at my defense.
Finally, most importantly, I want to recognize the amazing love and
encouragement with which my family has supported me throughout the entire
process. From before I actually began the program, they were helping me. My
mother, Betty Weber; my sister, Ellen Weber; and Emma Weber have been
absolutely key to my success. Without them, the process would have been so
much more difficult. The rest of my (large) family has also supported me every
day, and I am so grateful for them and their love.
viii
TABLE OF CONTENTS
Page
ABSTRACT ................................................................................................. iii
DEDICATION............................................................................................... v
ACKNOWLEDGEMENTS ............................................................................ vi
TABLE OF CONTENTS ............................................................................... viii
LIST OF FIGURES ...................................................................................... x
LIST OF TABLES ........................................................................................ xii
LIST OF BOXES .......................................................................................... xiv
CHAPTER
I INTRODUCTION ..................................................................... 1 Introduction ......................................................................... 1 The Study Site .................................................................... 7 Study Methodology ............................................................. 32
II INDIVIDUALISM AND COLLECTIVISM IN NATURAL RESOURCE CONSERVATION ............................................... 43
Introduction ......................................................................... 43 Methods .............................................................................. 49
Results ............................................................................... 63 Conclusions ........................................................................ 78
III LANGUAGE, PERCEIVED KNOWLEDGE AND LOCUS OF CONTROL IN NATURAL RESOURCE CONSERVATION ...... 88 Introduction ......................................................................... 88
Central Concepts ................................................................ 95 Study Site: North Rupununi, Guyana ................................. 105 Methods ............................................................................. 111 Results ................................................................................ 127
ix
CHAPTER Page Conclusions ....................................................................... 135
IV A TOOLKIT FOR EFFECTIVE NATURAL RESOURCE CONSERVATION THROUGH MEANINGFUL COLLABORATION .................................................................. 148
Introduction ........................................................................ 148 Synthesis Becomes a Toolkit: Purpose of this Chapter ..... 152 Clarifying the Terms: Definitions of Participation Cooperation, & Collaboration .............................................. 155 Concepts & Techniques....................................................... 156 Conclusion ......................................................................... 175
V SUMMARY .............................................................................. 178 Conclusions ....................................................................... 179 Future Research ................................................................ 182
LITERATURE CITED .................................................................................. 184
APPENDIX A-1 ........................................................................................... 210
APPENDIX A-2 ........................................................................................... 219
APPENDIX A-3 ........................................................................................... 220
VITA ........................................................................................................... 222
x
LIST OF FIGURES
Page
Figure 1.1. Map of Guyana ......................................................................... 8 Figure 1.2. Map of the North Rupununi ....................................................... 9 Figure 1.3. The North Rupununi Savanna in the rainy season, September 2008 ........................................................................ 10 Figure 1.4. A bridge on the International Highway between Wowetta and Annai Central ...................................................... 11 Figure 1.5. The Apoteri community water tanks and faucet ........................ 13
Figure 1.6. Apoteri‘s nursery school ........................................................... 14
Figure 1.7. A field of cassava with other fruits and vegetables growing among the cassava plants ........................................... 16 Figure 1.8. Map of the study villages .......................................................... 20
Figure 1.9. Annai village from the air .......................................................... 21
Figure 1.10. Apoteri‘s village commons ...................................................... 23
Figure 1.11. Processing peanuts in Aranaputa ........................................... 24
Figure 1.12. The Rewa nursery and primary school students making their favorite animal faces .......................................... 25 Figure 1.13. The Wowetta Community Centre ............................................ 27 Figure 1.14. The Rupununi River ............................................................... 28 Figure 1.15. Annai village office and tourist center ..................................... 29 Figure 1.16. Cotton-spinning contest at the 2008 Amerindian Heritage celebration in Annai ................................................. 30 Figure 2.1. Frequencies of participants‘ scores on the individualism interval scale with an interpolation line ...................................... 64
xi
Page
Figure 2.2. Frequencies of participants‘ scores on the collectivism interval scale with an interpolation line ...................................... 65 Figure 2.3. Individualism interval scale v. the collectivism interval scale .... 66 Figure 3.1. Original diagram from Kaplan & Kaplan depicting the relationships between the components of the Reasonable Person Model ....................................................... 102 Figure 3.2. Revised depiction of the Reasonable Person Model and the interconnectedness of the components .............................. 143 Figure 4.1. Process planning guide ............................................................. 176
xii
LIST OF TABLES
Page
Table 2.1. Items included in individualism and collectivism scales ............. 58
Table 2.2. Interval definitions for collectivism and individualism interval scales ............................................................................ 60
Table 2.3. Guidelines for interpreting results of measures of association ................................................................................ 63
Table 2.4. Test statistics from individualism scale v. socio-demographic items ........................................................... 67
Table 2.5. Test statistics from crosstabulations between individualism scale and natural resource items ............................................... 68
Table 2.6. Test statistics from crosstabulations between collectivism scale and socio-demographic items .......................................... 69
Table 2.7. Test statistics from crosstabs between collectivism scale and natural resource items ............................................... 70
Table 2.8. Selected crosstab results from community decision-making item with individualism and collectivism scales ......................... 72
Table 2.9. Comparison of associations between selected natural resource items and the variable ‗years in school‘ and the collectivism scale .......................................................... 76
Table 3.1. Items included in the locus of control scale ................................ 125
Table 3.2. Locus of control interval scale .................................................... 126
Table 3.3. Test statistics from crosstabulations between socio-demographic variables (independent) and locus of control intervals (dependent variable) .................................... 128
Table 3.4. Test statistics from crosstabulations between locus of control intervals and natural resource items .......................................... 129
xiii
Page
Table 3.5. Crosstab results of locus of control v. participants‘ perceptions of their knowledge of natural resources comparing observed v. expected frequencies ............................................. 130
Table 3.6. Perceived knowledge of natural resources by community type comparing observed v. expected numbers ................................ 132
Table 4.1. Alphabetical list of activities and techniques described with conceptual areas of primary usefulness marked ....................... 174
xiv
LIST OF BOXES
Page
Box 4.1. The Facilitator ............................................................................... 158
Box 4.2. The Setting ................................................................................... 158 Box 4.3. Individual Interviews ..................................................................... 166
Box 4.4. Reasoned Veto: Control & Equity ................................................. 172
Box 4.5. Meals: Equity & Choice ................................................................. 173
1
CHAPTER I
INTRODUCTION
Introduction
Experience and research have shown that attention to social variations
and overall context is vital to designing and implementing effective natural
resource conservation programs (Beltrán 2000; Wyckoff-Baird 2000; Kamath &
Oza 2002; Goldman 2003; Kamanda et al. 2003; Pathak & Kothari 2003; Hunter
& Brehm 2004). Many scholars have more specifically explored the relationship
between cultural values and conservation (Western & Wright 1994; Gray et al.
1997; Stevens 1997; Hulme & Murphree 2001; Kamath & Oza 2002; Nepal
2002; Kamanda et al. 2003; Pathak & Kothari 2003; Colchester 2004; West et al.
2006) and between cultural practices and conservation (Posey 1998). Clearly,
conservationists are paying increasing attention to local cultures, situations, and
values in the process of conserving and managing natural resources.
Conservation of the Earth‘s natural resources is critical to the future, and
effective long-term conservation must make use of all possible tools. By
exploring and considering a group‘s perceptions, values, and beliefs,
conservationists can create programs that incorporate these from the beginning.
Doing so will help conservation efforts develop in conjunction with the perceived
realities, values, knowledge, and consequently support of local communities.
____________ This dissertation follows the style of Conservation Biology.
2
To a large extent, past analyses of how cultural values interact with
natural resource conservation and management are a posteriori case study
assessments of what went wrong when culture was not taken into account from
the beginning (e.g., Wyckoff-Baird 2000, Barnes et al. 2011). In contrast, this
research set out to systematically determine linkages between core cultural
values and perceptions and natural resource conservation beliefs and actions.
Problem Statement
Previous research regarding environmental behavior has suggested that
the cultural constructs individualism, collectivism, and locus of control might be
associated with attitudes, choices, and actions relating to the environment (e.g.,
Hines et al. 1987; McCarty & Shrum 1994; McCarty & Shrum 2001; Nordlund &
Garvill 2002). Other scholarship has indicated that these 3 constructs are basic
to all cultures (e.g., Rotter 1966; Hofstede 1980; Lefcourt 1991; Triandis 1993;
Triandis 1995), and that the various values they take in different cultures
generate different behaviors in people (Triandis 1995).
Very little research addresses these 3 constructs in indigenous
communities and cultures (e.g., Eisenstadt 2006; Barnes et al. 2011). Yet if they
are basic to culture and show associations with environmental behaviors, they
might be crucial for natural resource conservation efforts: The Global 200
ecoregions overlap with indigenous territories to an enormous degree (Oviedo et
al. 2000). This overlap demonstrates the key role that indigenous and traditional
3
peoples around the world have in natural resource conservation. Therefore,
researching key cultural values and perceptions in relation to natural resources
and conservation in such communities and societies has immense potential in
improving the success of conservation efforts around the world.
In light of this, the primary focus of this study was to examine if and how
(1) people‘s value orientations regarding individualism and collectivism and (2)
their perceptions of knowledge and locus of control are associated with their
opinions and behaviors regarding natural resources and conservation in an
indigenous setting, the North Rupununi, Guyana. The major hypotheses posed
were the following:
1. People who report a higher level of individualism will be less likely to
report engaging in conservation behaviors than those with a lower level.
2. People who report a higher level of collectivism will be more likely to
report engaging in conservation behaviors than those with a lower level
3. People with a more internal locus of control will be more likely to report
engaging in conservation behaviors (activities) than those who have a
more external locus of control.
Definitions
A ‗value‘ is defined as ―something (as a principle or quality) intrinsically
valuable or desirable‖ (Webster‘s 1987:1303). The term ‗value orientation‘ refers
4
to the value a group constructs for a specific principle or quality to aid itself in
successful adaptation and survival (McCarty & Shrum 2001).
Each community, as well as each individual, constructs a set or system of
values that relates to making decisions and taking action. The focus in this
research is community, or group, value orientations as measured by a
composite index of individual members‘ values. Sometimes the relationship
between the two is direct and visible; whereas, in other cases the links are less
obvious. Every community, however defined, has an approximate location or
general range on the various continua of collectivism, individualism and locus of
control, although these are not fixed and can vary significantly between
individual group members and over time.
The value construct ‗individualism‘ can be broadly defined as tending to
give precedence to personal, individual goals with a stronger focus on the self
and emotional independence (Hofstede 1980; Gelfand et al. 1996). In contrast,
‗collectivism‘ weights the group‘s goals as more important than those of the
individual (Gelfand et al. 1996; McCarty & Shrum 2001); sharing, group harmony
and responsibilities to the group are also emphasized (Hofstede 1980).
Collectivism and individualism are often used as the extremes on a single
value continuum (Gelfand et al. 1996). However, further research indicates that
individualism and collectivism are separate values entirely, with authoritarianism
comprising one extreme of the individualism continuum (Gelfand et al. 1996). In
5
this study, I consider individualism and collectivism independent value
constructs with high and low as the extreme orientations of each continuum.
Locus of control refers to the beliefs people have about their personal
ability to influence their lives and the world (Rotter 1966). Those who feel that
they have significant personal power to shape the world around them are called
‗internals.‘ The ‗externals‘ perceive themselves as having little to no influence
on what happens in their world; rather, what affects the world is outside of them
and thus out of their control (Lefcourt 1991; McCarty & Shrum 2001).
‗Conservation‘ is another term which requires definition for this study,
because so many interpretations of the term exist. According to the dictionary,
the verb ‗conserve‘ means ―to keep in a safe or sound state…; especially : to
avoid wasteful or destructive use of‖ (Merriam-Webster OnLine 2007).
‗Conservation‘ is defined as the ―a careful preservation and protection of
something; especially : planned management of a natural resource to prevent
exploitation, destruction, or neglect‖ (Merriam-Webster OnLine 2007).
Interestingly, the dictionary specifically includes reference to natural resources in
the primary definitions of conservation. Likely because of such a broad and
inclusive dictionary definition, many conservation organizations operationalize
the term through objectives, indicators, and desired outcomes rather than
specifically defining the term.
For the purposes of this study, conservation is defined according to the
principles developed by the North Rupununi District Development Board
6
(NRDDB) in Guyana to guide natural resource management in their lands. As a
group, the member communities defined natural resource management as
―conserving and maintaining the naturally functioning ecological system that
provides support for the long-term vitality of the communities‖ (NRDDB 2005:7).
Research Significance
A better understanding of the linkages between these various
characteristics of culture and behavior can increase conservationists‘ ability to
work with local residents to design, plan, and implement more appropriate
projects. The potential for achieving conservation success increases because
the cultural understanding enables co-creation of conservation projects, which
encourages collaboration and compliance.
Overall, information from this study can help increase the effectiveness of
natural resource management and conservation to the benefit of local residents,
communities and regions (West et al. 2006). The information can help preserve
critical resources such as stakeholder goodwill and financial capital in addition to
the natural resources themselves. Further potential benefits include
conservation of ecosystem services, such as air and water purification,
mitigation of floods, maintaining food supplies, and biodiversity as well as
improving and increasing sustainable livelihood options.
7
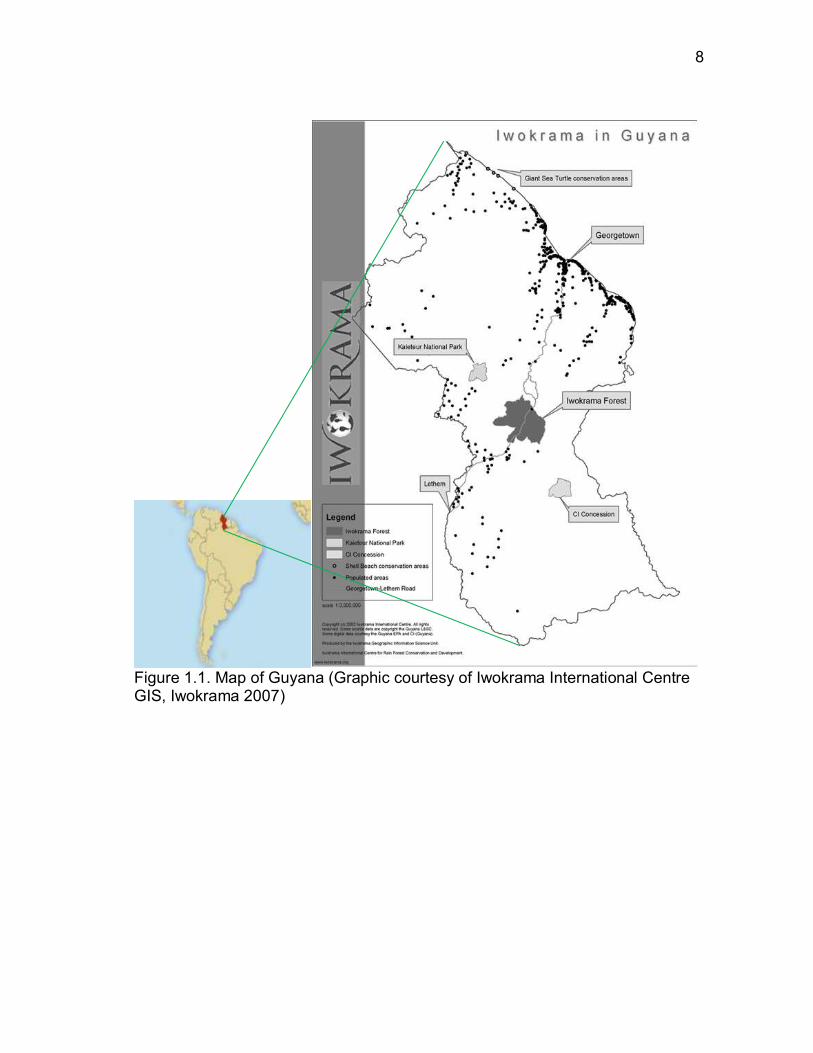
The Study Site
The District
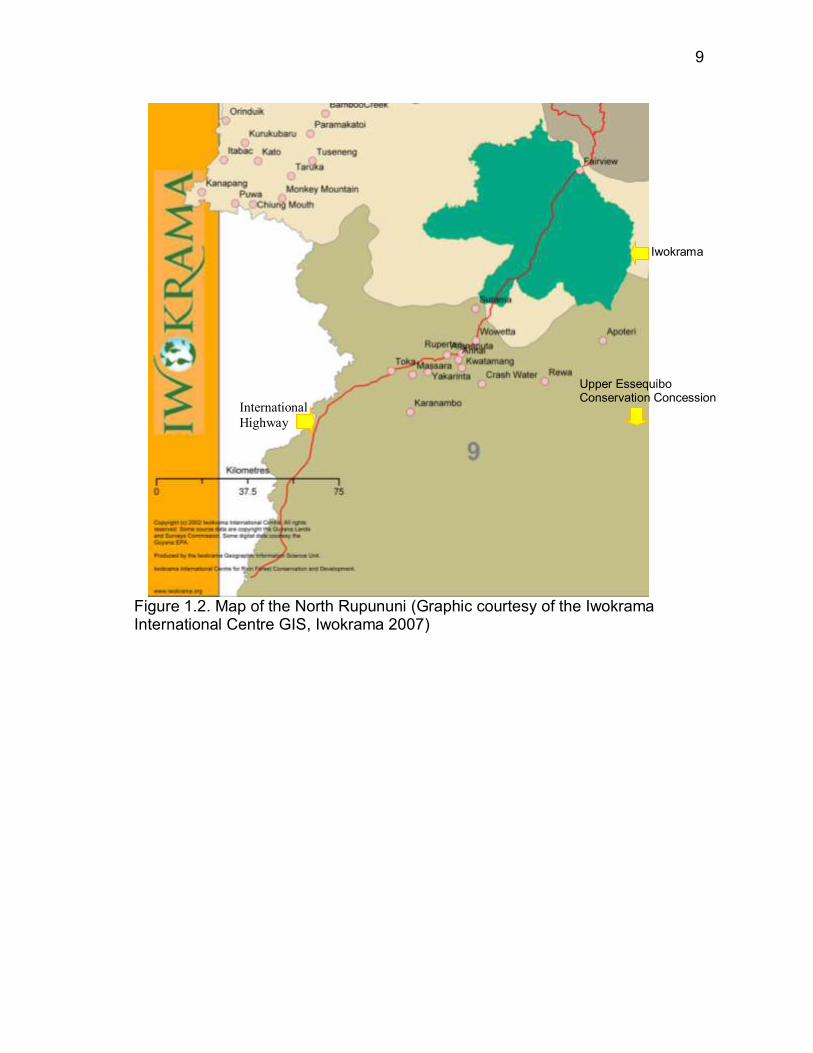
The study was conducted in the interior of Guyana (Fig. 1.1) in 2008 in an
area called the North Rupununi (Fig. 1.2). Located in the center of the country, it
is just south of the forest reserve named the Iwokrama International Centre for
Rain Forest Conservation and Development (Iwokrama, more information
below). It is a seasonally flooded savanna (Fig. 1.3) with some rain forest.
Sixteen villages are located in the region, one within Iwokrama‘s boundaries.
Fifteen of the 16 have obtained title to their land from the Guyanese
government. The remaining community, Aranaputa, chose not to be titled
because the residents preferred the land rules and regulations under the
national government to those that come with land title as an Amerindian
community (Virgil Harding, personal communication)1.
1 Affiliations of people cited as personal communication informants are listed in Appendix A-2.
8
Figure 1.1. Map of Guyana (Graphic courtesy of Iwokrama International Centre GIS, Iwokrama 2007)
9
Figure 1.2. Map of the North Rupununi (Graphic courtesy of the Iwokrama International Centre GIS, Iwokrama 2007)
Iwokrama
Upper Essequibo Conservation Concession
International
Highway
10
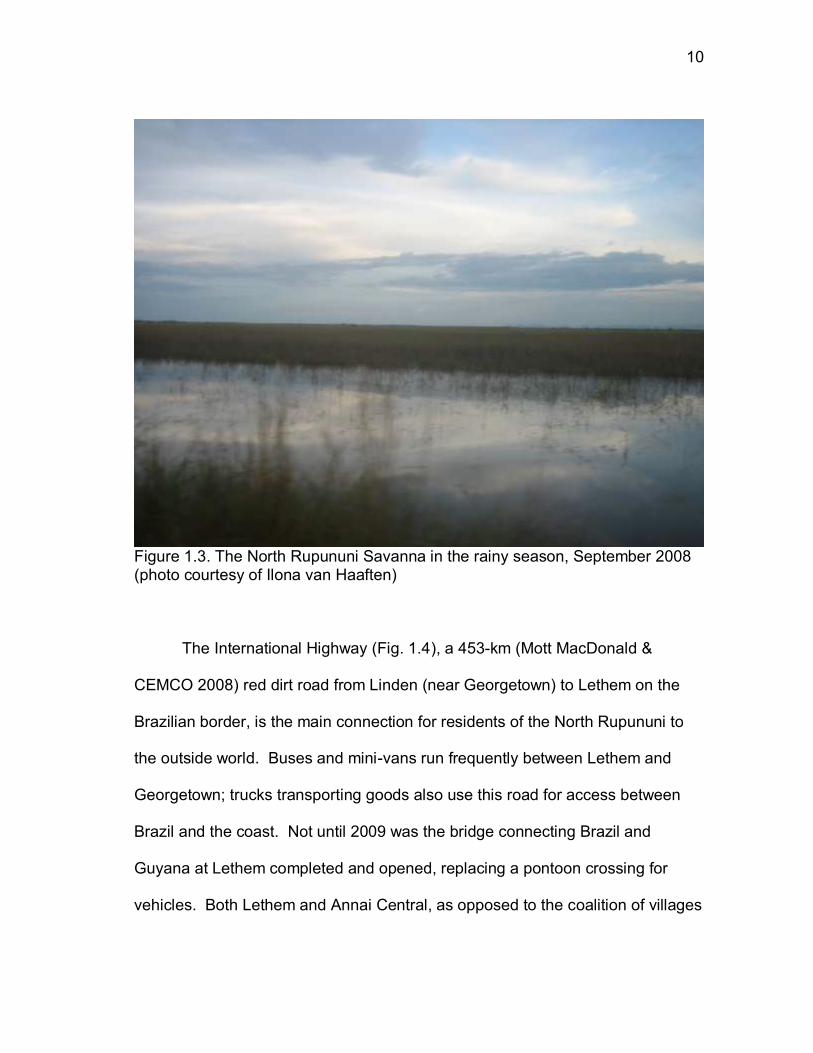
Figure 1.3. The North Rupununi Savanna in the rainy season, September 2008 (photo courtesy of Ilona van Haaften)
The International Highway (Fig. 1.4), a 453-km (Mott MacDonald &
CEMCO 2008) red dirt road from Linden (near Georgetown) to Lethem on the
Brazilian border, is the main connection for residents of the North Rupununi to
the outside world. Buses and mini-vans run frequently between Lethem and
Georgetown; trucks transporting goods also use this road for access between
Brazil and the coast. Not until 2009 was the bridge connecting Brazil and
Guyana at Lethem completed and opened, replacing a pontoon crossing for
vehicles. Both Lethem and Annai Central, as opposed to the coalition of villages
11
known as Annai District, have airstrips with regularly scheduled service; Apoteri
also has an airstrip but it is rarely used. In 2008 air tickets from Georgetown to
the region cost approximately twice as much as bus tickets.
Figure 1.4. A bridge on the International Highway between Wowetta and Annai Central (photo courtesy of Ilona van Haaften)
The residents are mainly of Amerindian heritage. Makushi is by far the
largest Amerindian group in the region with Wapishana second. Other
Amerindian groups are also represented, as are people from the majority ethnic
groups in the country, namely people of African descent and those of Indian
12
descent (not to be confused with Amerindians, the Guyanese term for
indigenous peoples). Many people are of mixed heritage. According to the
2002 census, Amerindians make up 9.1% of the total population while Afro-
Guyanese comprise 30.2%, Indo-Guyanese 43.5%, and ―mixed‖ 16.7% (CIA
2011).
English is the official language and likely the single language used by the
largest number of people in the country; schools and government business are
conducted in English. Several other languages are common, such as Caribbean
Hindustani, Urdu, and Amerindian languages (CIA 2011). The most commonly
used language in the North Rupununi is English; many residents also speak
Makushi and/or other Amerindian languages, and some speak Portuguese.
Some people in the North Rupununi have limited English proficiency, and a
small minority has virtually no English skills.
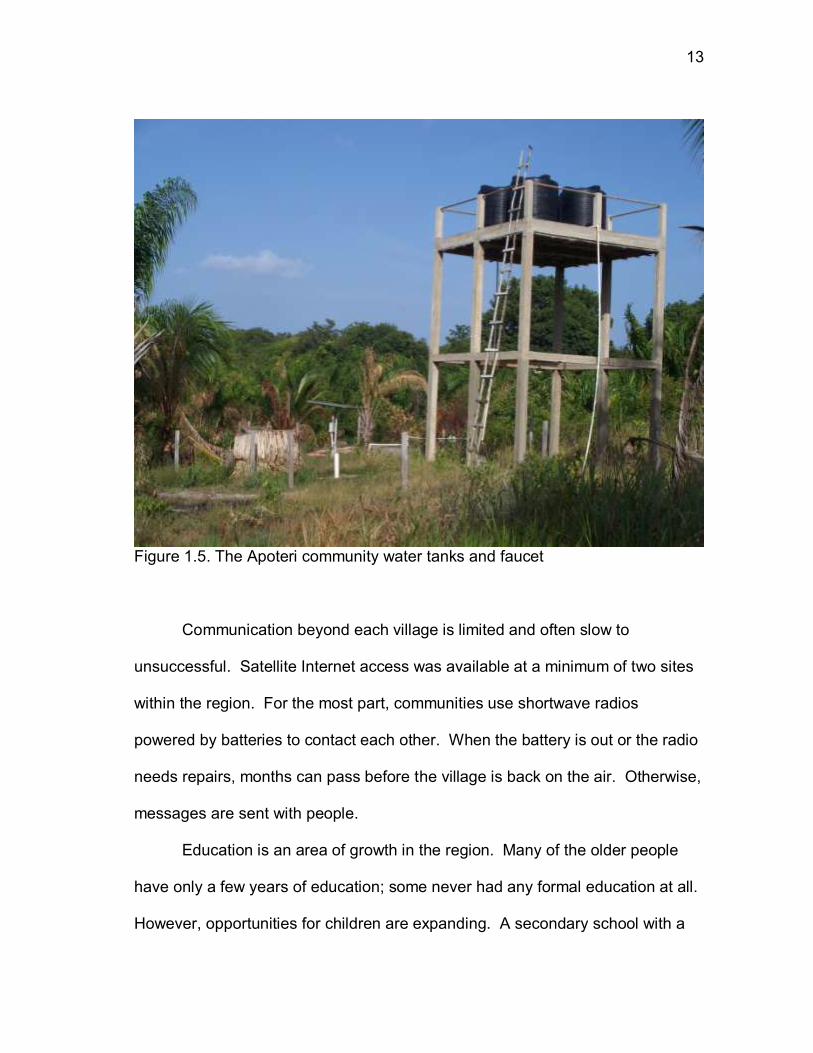
At the time of the study few residents had access to running water or
electricity. Some villages had gas pumps on community wells, which they used
to pump water into elevated tanks (Fig. 1.5); once in the tanks, gravity allowed
people to fill containers with water at faucets. A small amount of electricity was
available from gas generators or solar panels attached to batteries; generally
only wealthier residents, community organizations which had received grant
funding, or agencies and external organizations, e.g., Conservation International
(CI) and the Guyana Elections Commission, had access to such facilities.
13
Figure 1.5. The Apoteri community water tanks and faucet
Communication beyond each village is limited and often slow to
unsuccessful. Satellite Internet access was available at a minimum of two sites
within the region. For the most part, communities use shortwave radios
powered by batteries to contact each other. When the battery is out or the radio
needs repairs, months can pass before the village is back on the air. Otherwise,
messages are sent with people.
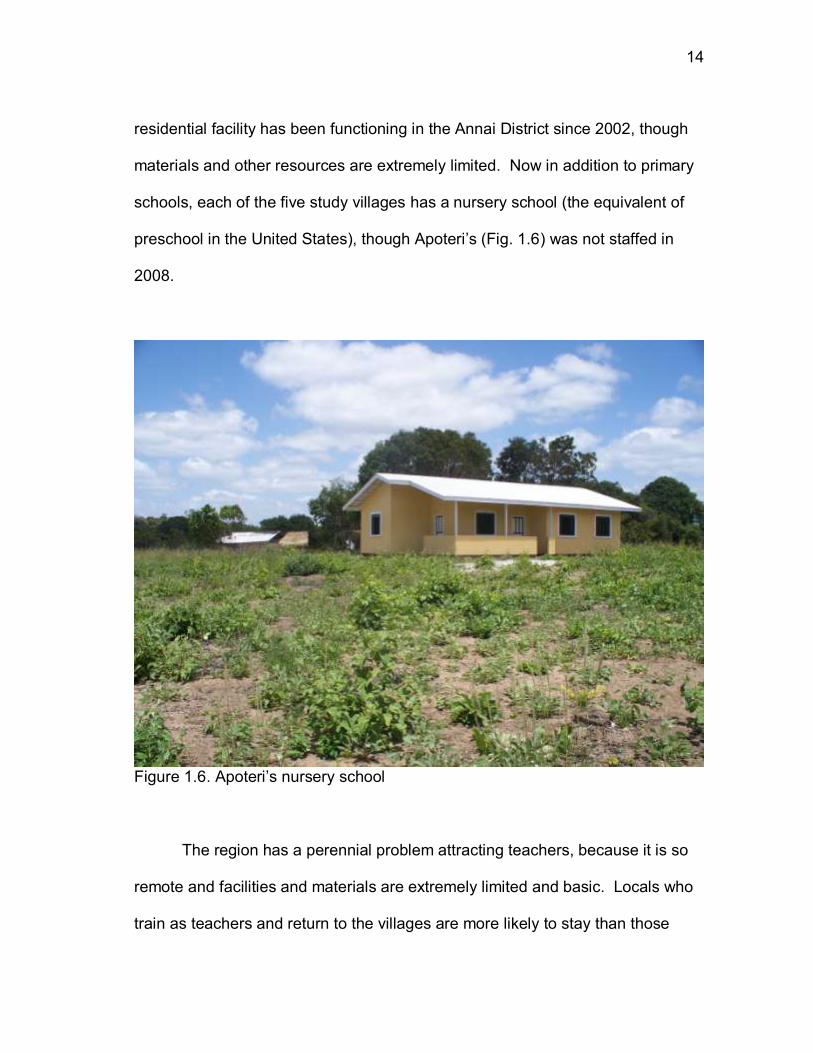
Education is an area of growth in the region. Many of the older people
have only a few years of education; some never had any formal education at all.
However, opportunities for children are expanding. A secondary school with a
14
residential facility has been functioning in the Annai District since 2002, though
materials and other resources are extremely limited. Now in addition to primary
schools, each of the five study villages has a nursery school (the equivalent of
preschool in the United States), though Apoteri‘s (Fig. 1.6) was not staffed in
2008.
Figure 1.6. Apoteri‘s nursery school
The region has a perennial problem attracting teachers, because it is so
remote and facilities and materials are extremely limited and basic. Locals who
train as teachers and return to the villages are more likely to stay than those
15
from other regions, so villages that get qualified teachers from the region are
more likely to have teachers and for those teachers to stay. Additionally,
students now have better chances of attending residential secondary schools in
more urban settings, such as in Georgetown or Lethem.
A student attending secondary school is generally fairly expensive for
families, costing approximately US$50 per child per term for basic supplies such
as pens, pencils, paper, school bag, shoes, uniform and so on (Vanda Radzik,
personal communication). Families tend to be large and having six or more
children is not uncommon. Cash incomes are low in the region; for example,
fully qualified primary school teachers earn approximately US$200 per month, a
large cash income in the region (Judith Moses, personal communication).
Sending a child to a residential school is a much greater expense than a local
school and requires more than many families are able to do.
Except for school teachers, a malaria worker, a health worker and a few
other positions, full-time wage labor is not common in the villages. A few people
have full-time positions with nongovernmental organizations in the regions.
Some people work part time, 2 weeks or a few days each month. Others have
seasonal employment. A number of people leave the area for employment,
often going to Brazil or other places in the Caribbean to work as domestics or
heading to the mining operations around Guyana. Often these people are only
gone temporarily, months at a time or maybe a year or 2.
16
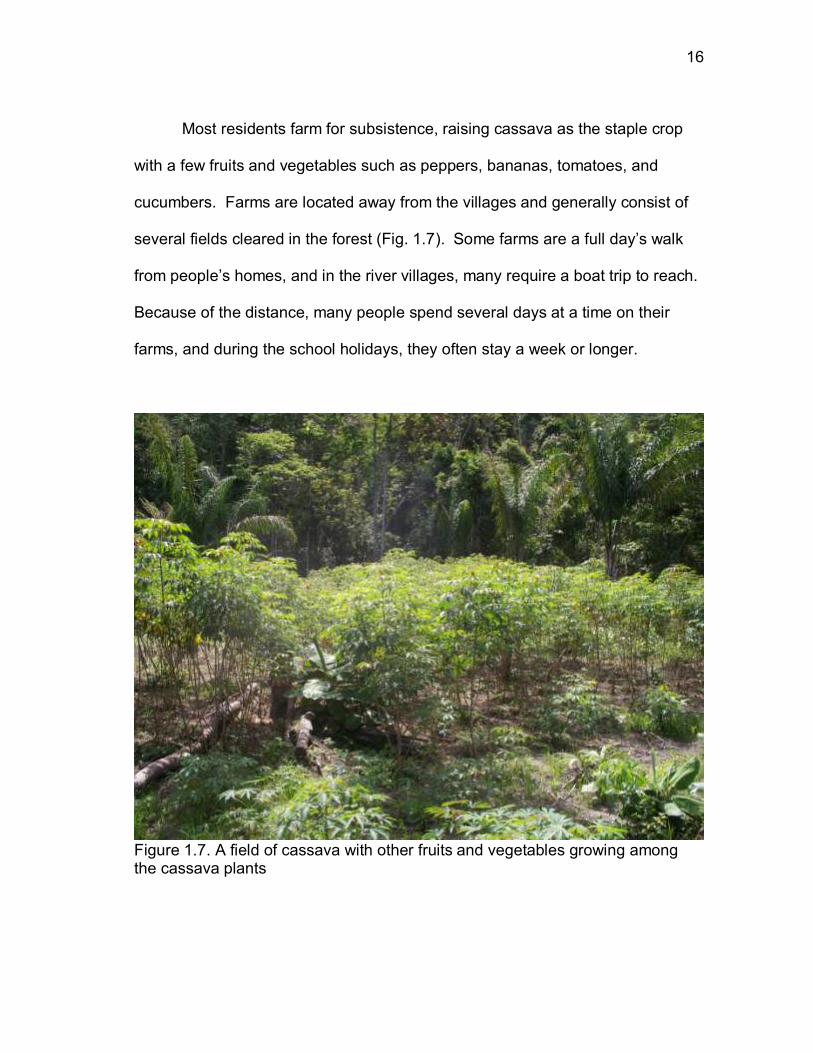
Most residents farm for subsistence, raising cassava as the staple crop
with a few fruits and vegetables such as peppers, bananas, tomatoes, and
cucumbers. Farms are located away from the villages and generally consist of
several fields cleared in the forest (Fig. 1.7). Some farms are a full day‘s walk
from people‘s homes, and in the river villages, many require a boat trip to reach.
Because of the distance, many people spend several days at a time on their
farms, and during the school holidays, they often stay a week or longer.
Figure 1.7. A field of cassava with other fruits and vegetables growing among the cassava plants
17
Nongovernmental Organizations
Numerous nongovernmental organizations are active in the area but the 3
principal ones are Iwokrama International Centre for Rainforest Conservation
and Development (Iwokrama), Conservation International Guyana (CI) and the
North Rupununi District Development Board (NRDDB). The presence of the
external organizations, in particular Iwokrama, led to the creation of the third, so
I will present them in this order.
Iwokrama began as a promise from Guyana‘s president to the
international community in 1993, but not until 1996 was it created by law.
Although created by a national law, Iwokrama is actually a nongovernmental
organization. It is a forest reserve in the center of the country that is half
sustainable use and half preserve. It is located on lands that were traditional
hunting, fishing, and gathering grounds for the Makushi residents of the North
Rupununi as well as a few other indigenous communities to its northwest.
Iwokrama was created without any consultation or input by local residents, and
this did not set well with them. The government saw that this was a problem and
initiated programs to consult and otherwise work with residents of the North
Rupununi.
Conservation International Guyana came into the North Rupununi a little
later and apparently learned from Iwokrama‘s experiences. When CI began
negotiations to set up the Upper Essequibo Conservation Concession, it began
by working with the North Rupununi communities as well as the government. It
18
wanted to make sure the residents would benefit from the concession and that
they would therefore support and respect it. The river communities in particular
are involved with the concession in a number of ways. Apoteri, the village
closest to the concession, hosts the ranger station. Rangers and seasonal
workers come largely from Apoteri and Rewa, though CI has a visible presence
in Crash Water as well. These 3 communities benefit directly from CI‘s
concession arrangements because a key part of that is a fund used to assist
these villages with projects. The villages decide what they want and create a
proposal including a budget, and CI works with them to help them realize their
goal. The assistance often goes beyond funding as CI helps with logistics and
planning as well, when requested. Thus, these villages have concrete benefits
connected to the concession that go beyond a few select people having
employment.
The NRDDB came largely as a result of dealing with Iwokrama and
government representatives. It was founded in 1998 to inform and coordinate
member villages in response to outside pressures. One of its primary
responsibilities is negotiating with outsiders of all kinds. The NRDDB helps
people and groups get loans, negotiates to make sure residents‘ rights are
respected, helps member communities collect information to make an informed
choice, and much more. Though it began mostly in response to demands of
outsiders regarding natural resources and conservation, today it works with
tourism, small businesses, women‘s groups, and much more.
19
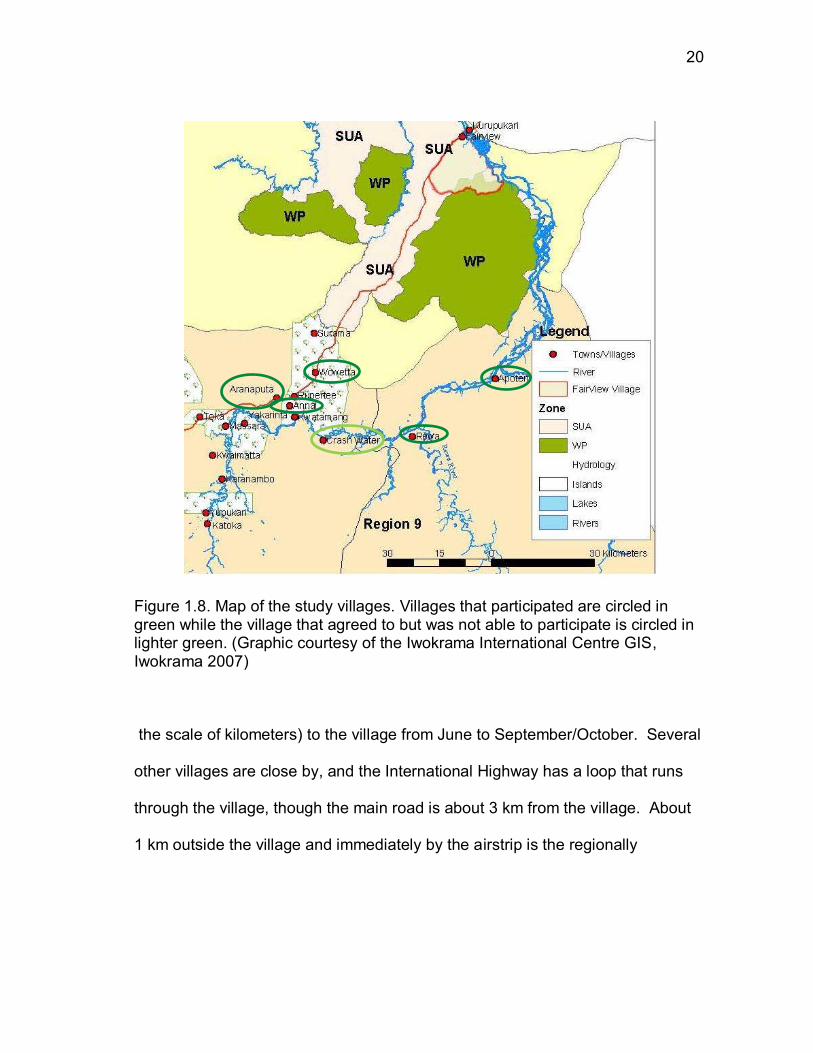
The Study Villages
Six communities agreed to participate in the study (Fig. 1.8): Annai
Central (hereafter Annai), Apoteri, Aranaputa, Crash Water, Rewa, and
Wowetta. Three of the villages are located along the International Highway.
Primary access to the non-road villages is via the Rupununi River. Thus, I refer
to Annai, Aranaputa and Wowetta collectively as the ―road villages;‖ while
Apoteri, Crash Water, and Rewa are the ―river villages.‖ Due to technical issues,
Crash Water did not participate in the study as planned.
Each community had between 200 and 600 residents on the official
community rosters at the time of the study. Annai had almost 600 residents
during the period of data collection (second half of 2008); in 2005 the population
was estimated at 470. It is situated on a hill in the open savanna with a few
stands of trees in and around the village (Fig. 1.9). In contrast to most villages
in the area, the homes are quite close together. The surrounding land is largely
flooded during the rainy season to the extent that river access is much closer (on
20
Figure 1.8. Map of the study villages. Villages that participated are circled in green while the village that agreed to but was not able to participate is circled in lighter green. (Graphic courtesy of the Iwokrama International Centre GIS, Iwokrama 2007)
the scale of kilometers) to the village from June to September/October. Several
other villages are close by, and the International Highway has a loop that runs
through the village, though the main road is about 3 km from the village. About
1 km outside the village and immediately by the airstrip is the regionally
21
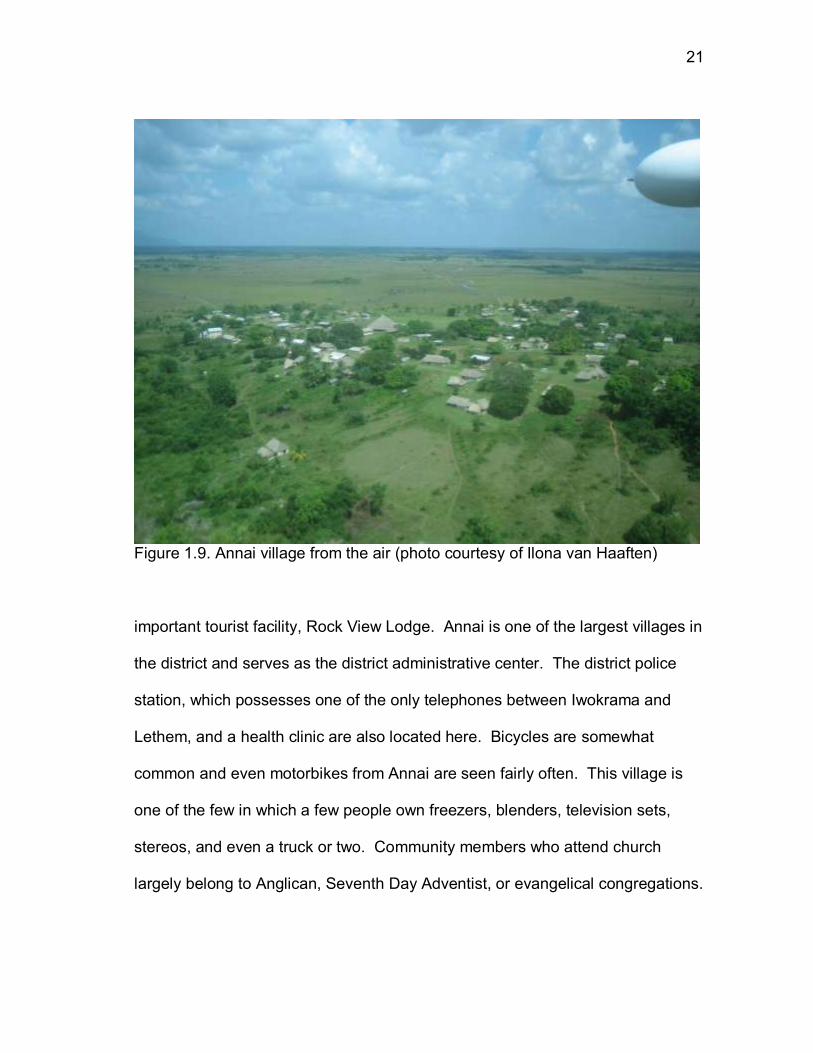
Figure 1.9. Annai village from the air (photo courtesy of Ilona van Haaften)
important tourist facility, Rock View Lodge. Annai is one of the largest villages in
the district and serves as the district administrative center. The district police
station, which possesses one of the only telephones between Iwokrama and
Lethem, and a health clinic are also located here. Bicycles are somewhat
common and even motorbikes from Annai are seen fairly often. This village is
one of the few in which a few people own freezers, blenders, television sets,
stereos, and even a truck or two. Community members who attend church
largely belong to Anglican, Seventh Day Adventist, or evangelical congregations.
22
Apoteri (Fig. 1.10) is a riverine community at the confluence of the
Rupununi and Essequibo rivers, which had over 300 residents at the time of the
study. As is common with the river communities, it lies in several forest
clearings on the high bank of the 2 rivers. The community is actually comprised
of two sections separated by 2 – 3 km. Though it has an airstrip, practically
speaking, this community is accessible only via river. In 2008, a road between
Apoteri and Rewa had been in negotiations and planning for several years but
only minor progress had been made in choosing a route and clearing. A major
issue is finding a route for the road that would make it useable year-round.
Additionally, at Rewa, users would still have to cross the Rewa River, making it
inconvenient at best for motorized travel. Some residents were Makushi, but
Wapishana were clearly in the majority. Many were of mixed ethnicity. The
Anglican church services were conducted partly in English and partly in
Wapishana. Christian Brethren, an evangelical denomination, was the other
primary religious congregation. Conservation International has a ranger station
here, as this is the closest village to the Upper Essequibo Conservation
Concession, some 80 km upriver on the Essequibo.
23
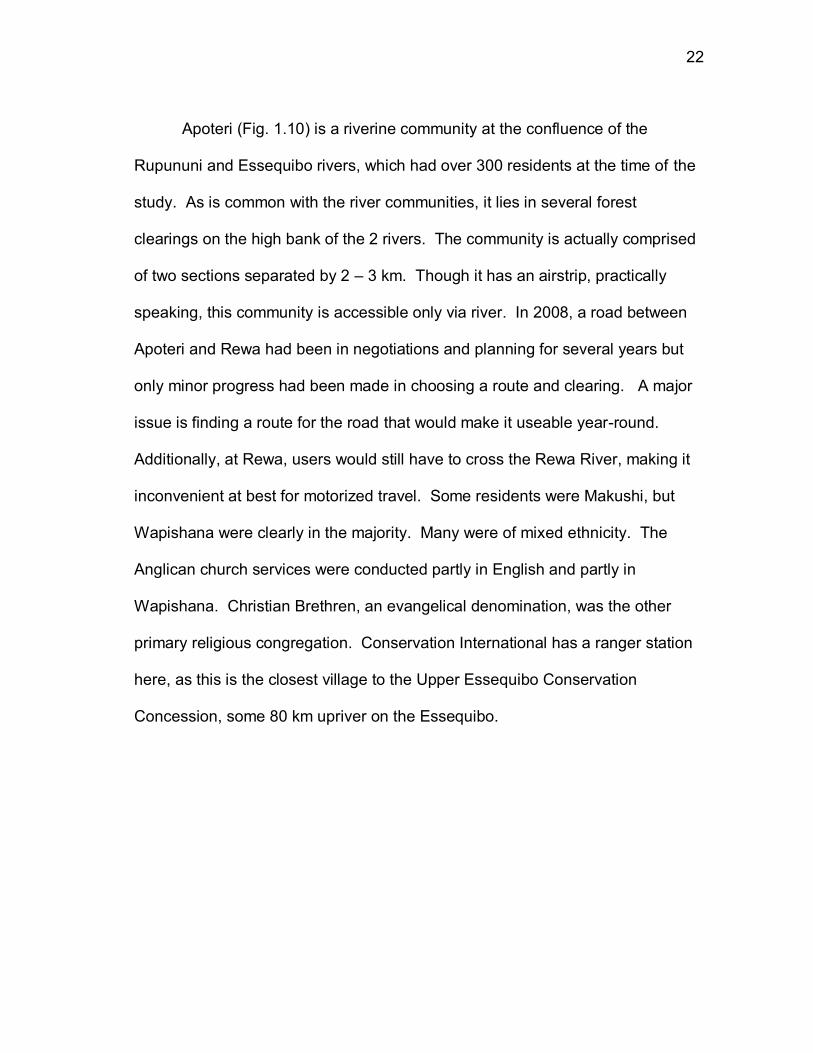
Figure 1.10. Apoteri‘s village commons. The meeting shelter is in the foreground, and the community health center and village administrative office are in the background.
The second of the larger villages, Aranaputa, had around 500 residents at
the time of the study. Although mostly Amerindians, many with mixed
backgrounds, the village also has a significant proportion of residents from the
coastal regions. The village lies in a small savanna valley with forested
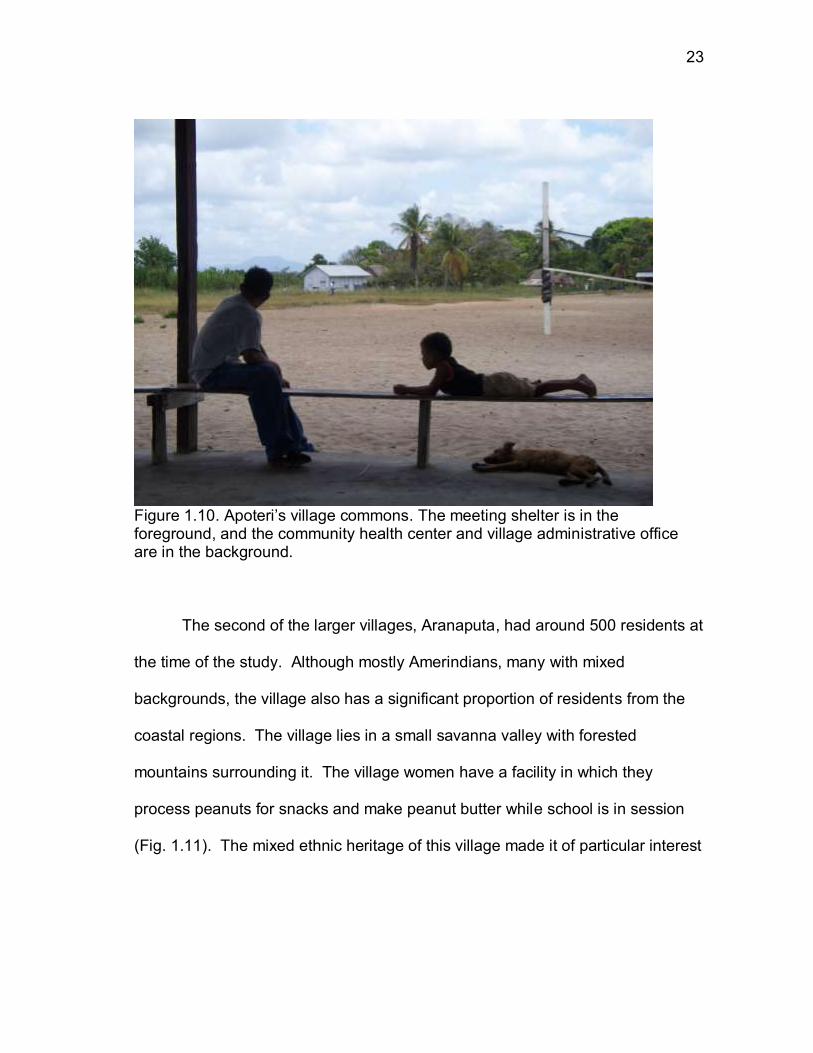
mountains surrounding it. The village women have a facility in which they
process peanuts for snacks and make peanut butter while school is in session
(Fig. 1.11). The mixed ethnic heritage of this village made it of particular interest
24
Figure 1.11. Processing peanuts in Aranputa (photo courtesy of Ilona van Haaften)
as these people tend to have more connections outside the North Rupununi and
seem to have more actual contact in terms of travel and visitors. By choice, this
community does not have title to its land and is the only member of the NRDDB
which did not have title as of 2008. According to Virgil Harding (personal
communication), the community prefers the land laws that apply to non-
Amerindian lands.
Rewa sits on the Rupununi River at the mouth of the Rewa River. A very
primitive road across the Rupununi permits some overland access, mostly via
motorbike or bicycle and then only in the dry season, but the Rupununi River is
25
the primary means of access to the village. As with the other river villages, the
homes are built on the high banks of the rivers in clearings among the forest
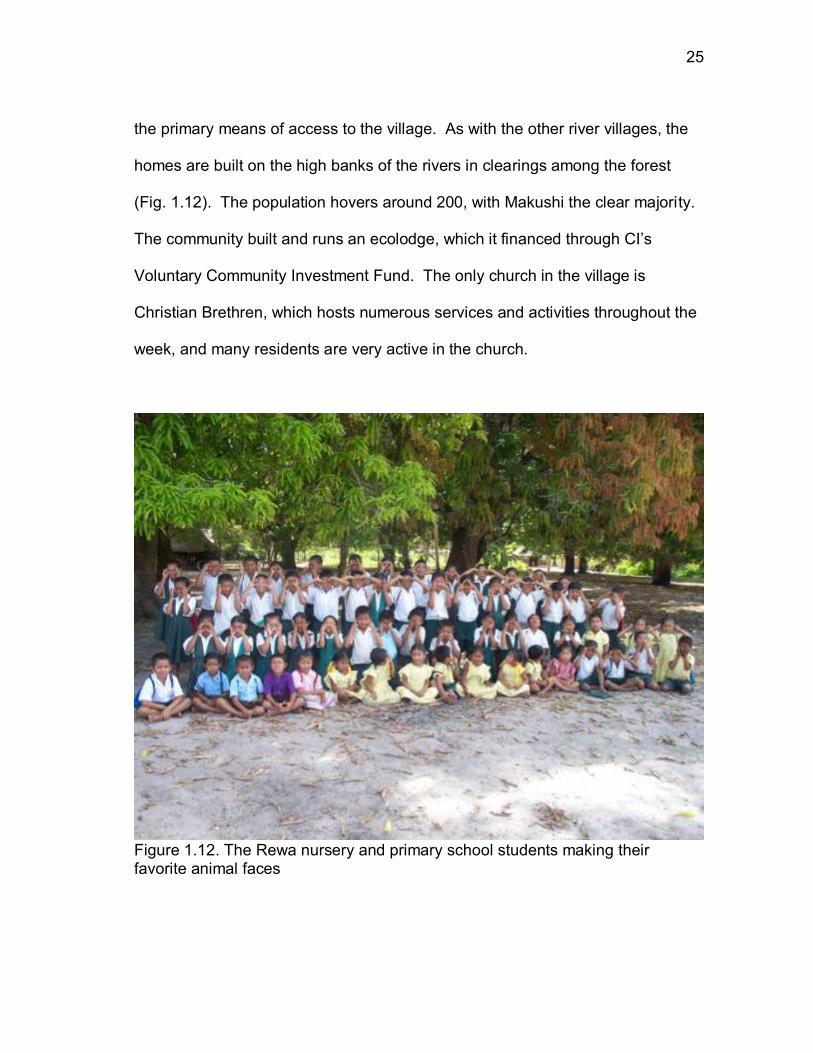
(Fig. 1.12). The population hovers around 200, with Makushi the clear majority.
The community built and runs an ecolodge, which it financed through CI‘s
Voluntary Community Investment Fund. The only church in the village is
Christian Brethren, which hosts numerous services and activities throughout the
week, and many residents are very active in the church.
Figure 1.12. The Rewa nursery and primary school students making their favorite animal faces
26
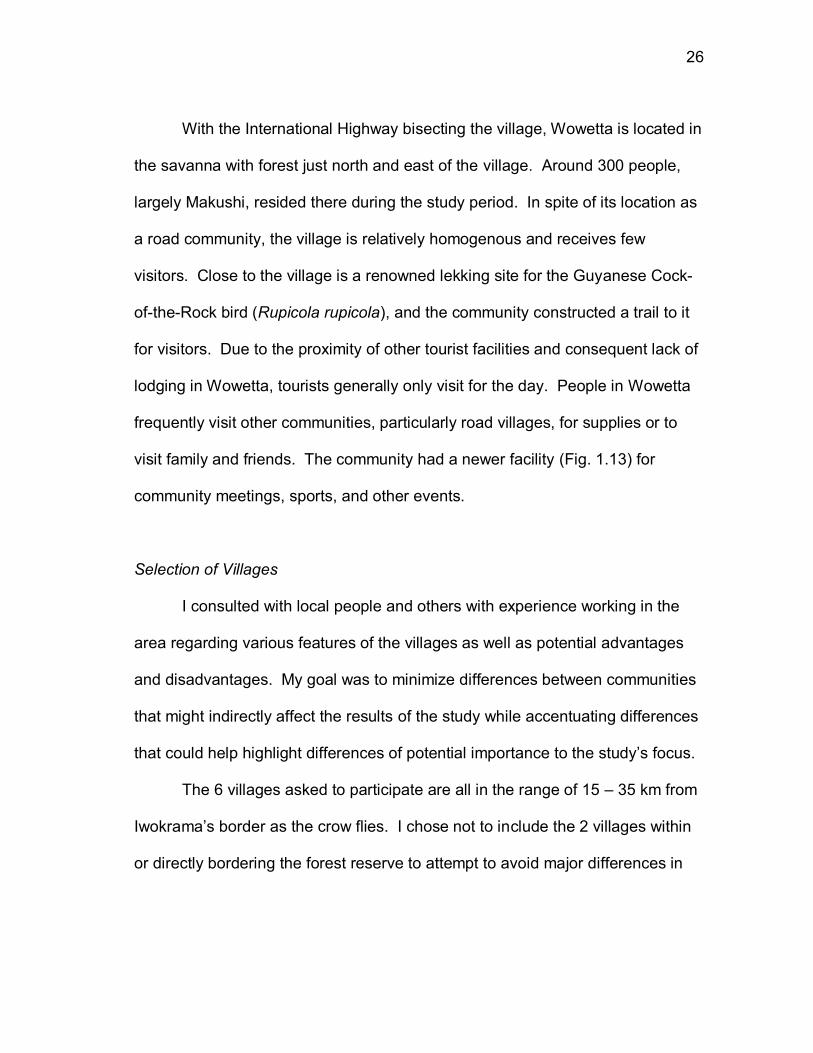
With the International Highway bisecting the village, Wowetta is located in
the savanna with forest just north and east of the village. Around 300 people,
largely Makushi, resided there during the study period. In spite of its location as
a road community, the village is relatively homogenous and receives few
visitors. Close to the village is a renowned lekking site for the Guyanese Cock-
of-the-Rock bird (Rupicola rupicola), and the community constructed a trail to it
for visitors. Due to the proximity of other tourist facilities and consequent lack of
lodging in Wowetta, tourists generally only visit for the day. People in Wowetta
frequently visit other communities, particularly road villages, for supplies or to
visit family and friends. The community had a newer facility (Fig. 1.13) for
community meetings, sports, and other events.
Selection of Villages
I consulted with local people and others with experience working in the
area regarding various features of the villages as well as potential advantages
and disadvantages. My goal was to minimize differences between communities
that might indirectly affect the results of the study while accentuating differences
that could help highlight differences of potential importance to the study‘s focus.
The 6 villages asked to participate are all in the range of 15 – 35 km from
Iwokrama‘s border as the crow flies. I chose not to include the 2 villages within
or directly bordering the forest reserve to attempt to avoid major differences in
27
the communities that might affect people‘s interview responses such as direct
proximity to Iwokrama, the staff, the visitors, the resources, and so on. I also
Figure 1.13. The Wowetta Community Centre (photo courtesy of Thomas E. Lacher, Jr.)
decided not to include villages further away from Iwokrama, because though
they have ties to the forest reserve, they are much more distant and the
possibility is greater that the Iwokrama lands and their place in people‘s lives
could be significantly different.
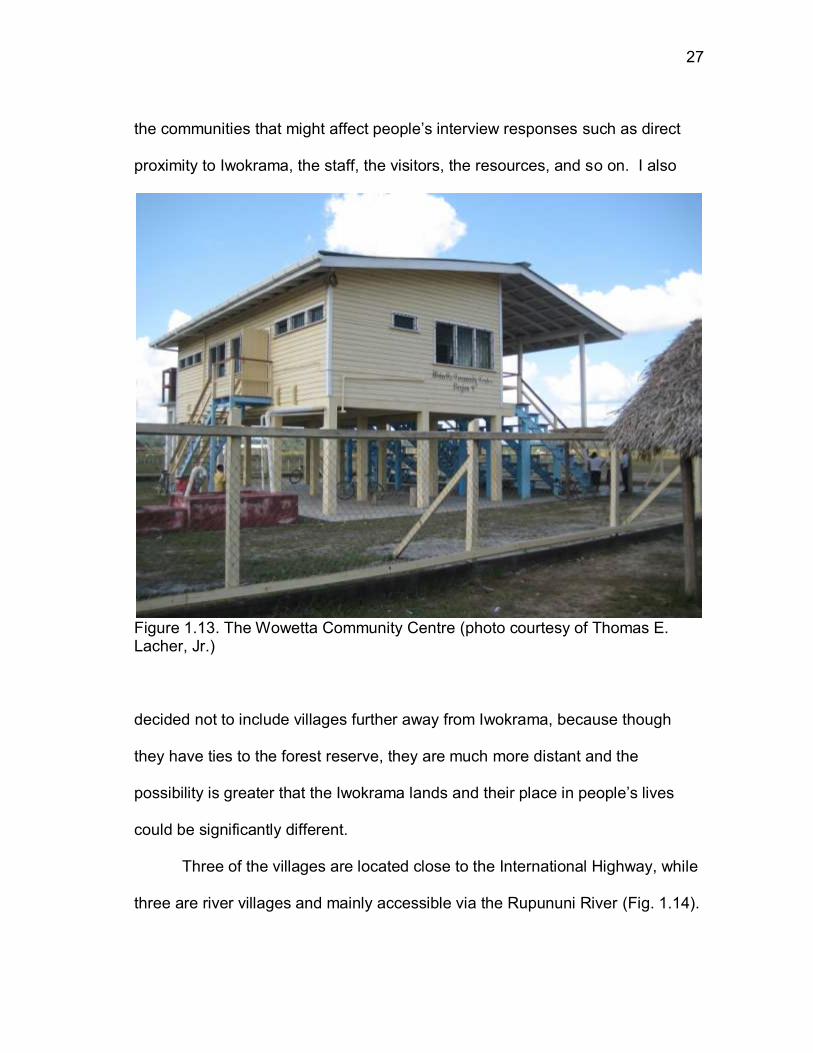
Three of the villages are located close to the International Highway, while
three are river villages and mainly accessible via the Rupununi River (Fig. 1.14).
28
This distinction between locations was one of interest in selecting the
communities as it could influence the communities in a number of ways, some
more obvious than others.
Figure 1.14. The Rupununi River. A group is returning to Crash Water from the Kwatamang river landing (photo courtesy of Ilona van Haaften)
Levels of heterogeneity and homogeneity of residents also played a role
in village selection. Homogeneity was gauged by the ethnic composition of the
community as well as the amount of contact from outside the region, e.g.,
visitors. The two larger road communities, Aranaputa and Annai, were chosen
29
as more heterogeneous, while Wowetta, Rewa, and Crash Water were distinctly
more homogenous. Apoteri is a mixed community, with a large Wapishana
group as well as a large Makushi group, but its relative inaccessibility makes it
more homogenous. Aranaputa is of more mixed ethnicity and has a larger
number of non-Amerindians than the other 15 member communities of the
NRDDB. Both Annai and Aranaputa are near Rock View Lodge, which provides
more contact with tourists as they visit the sites and villages. Annai conducts
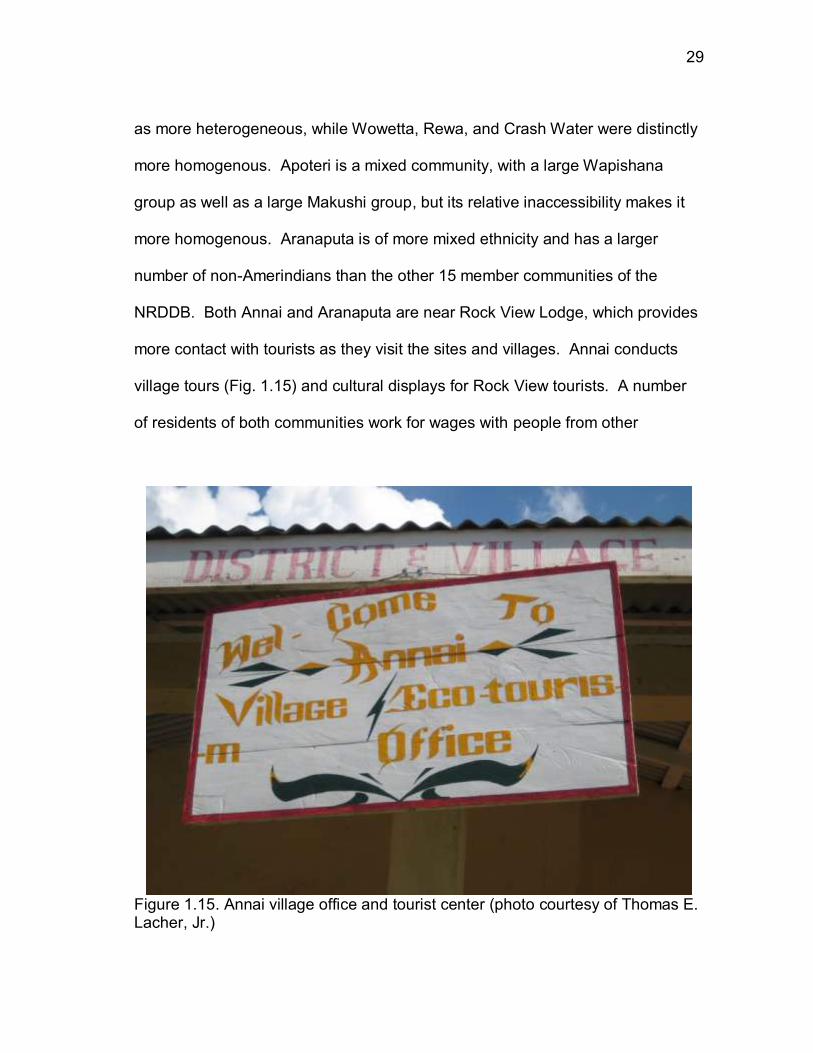
village tours (Fig. 1.15) and cultural displays for Rock View tourists. A number
of residents of both communities work for wages with people from other
Figure 1.15. Annai village office and tourist center (photo courtesy of Thomas E. Lacher, Jr.)
30
communities or from outside the region, e.g., at Bina Hill Institute or Rock View
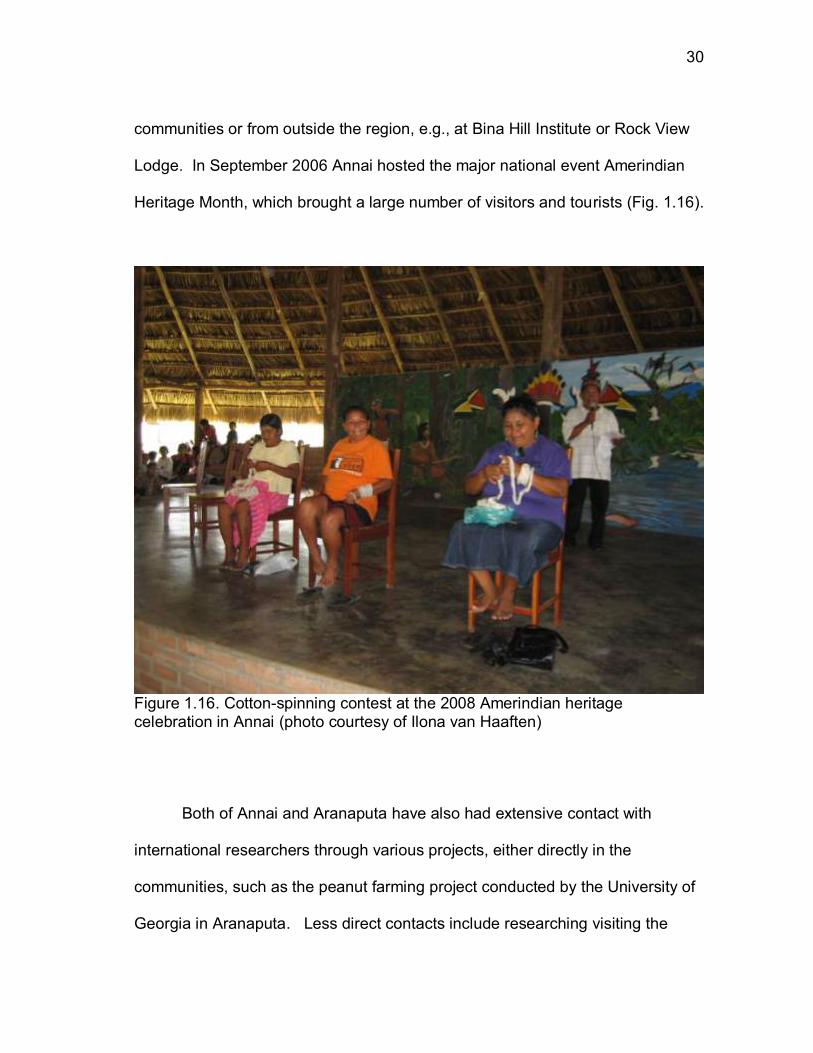
Lodge. In September 2006 Annai hosted the major national event Amerindian
Heritage Month, which brought a large number of visitors and tourists (Fig. 1.16).
Figure 1.16. Cotton-spinning contest at the 2008 Amerindian heritage celebration in Annai (photo courtesy of Ilona van Haaften)
Both of Annai and Aranaputa have also had extensive contact with
international researchers through various projects, either directly in the
communities, such as the peanut farming project conducted by the University of
Georgia in Aranaputa. Less direct contacts include researching visiting the
31
communities to look around and get supplies. All of the communities have had
some contact with researchers, but these 2 have had more than the others.
Members of the NRDDB consider Apoteri, Crash Water, and Wowetta
more homogeneous communities as well as more traditional and less connected
to outsiders and the outside world. They do not have as much contact with
tourists or researchers; their populations are not as ethnically heterogeneous.
Apoteri and Crash Water are riverine communities further away from the road
and the tourist accommodations and services. The NRDDB touts Wowetta,
among other communities, as poised to take advantage of its proximity to the
Georgetown-Lethem Road, but so far very little action has been taken in that
direction, possibly because the number of tourists and other visitors has not
been sufficient to support such a move. The residents in all the communities are
quite mobile, moving between villages and traveling for jobs, and so have more
contact with outsiders than might be assumed based on the transportation and
geography alone.
The residents of Rewa are also fairly homogenous, but the village is
distinct in that it has an ecolodge, which brings some international tourists to the
community. However, due to the newness of the ecolodge and the very limited
information available about it, only very few people had actually been to Rewa
as tourists at that point.
Thus, these 6 communities had both similarities and differences that
made them useful for comparative purposes in this study. Unfortunately, I was
32
unable to conduct interviews in Crash Water in large part due to issues
translating the interview protocol, which will be further elaborated below.
Study Methodology
The Interview Protocol
The data collection instrument was designed to address three major
areas: socio-demographic information; social perceptions and value orientations
(locus of control, individualism and collectivism); and natural resource issues.
The value orientation items were adapted from a number of instruments already
used and tested in various situations (Rotter 1966; Ali 1987; Dorfman & Howell
1988; Eraz & Earley 1989; Lefcourt 1991; Earley 1993; Oyserman 1993;
Bierbrauer et al. 1994; Singelis 1994; Chew 1996; Yoo 1996; Jung & Kellaris
2001; Spector et al. 2004; Yi 2004). Items were selected in an effort to meet two
goals: 1) to get responses on various dimensions for each value orientation and
2) to cross check individual responses by asking essentially the same question
in different forms.
The initial draft instrument was developed in October and November of
2007. A group of university student volunteers was the first pilot group. The
students responded to the questions, in particular the value and perception
items, and were asked to mark any places they found unclear, confusing or
otherwise needing revision. As they returned the surveys, I asked for any
additional comments they might have and students gave additional suggestions,
33
which I recorded. Though this pilot run might not seem justified, the major goal
was to iron out some problems with wording and clarity of expression. By asking
people in my general cultural group to comment, I was able to revise the draft so
that it was a better expression of my intentions. Only from this place could I
attempt to create a culturally relevant instrument for the North Rupununi.
Revisions were made and the second version was piloted on another
group of students as well as several faculty members. Following the second
round of revisions, an application was submitted to the Texas A&M Institutional
Review Board for approval, which was granted in November 2007 (Protocol No.
2007-0738).
Prior to the actual data collection, I spent time in each village introducing
myself to as many people as possible. Permission had been obtained from the
villages and the NRDDB in advance, so they were somewhat informed and
expecting me. When I arrived, I first visited each village to formally introduce
myself to the toshao and the rest of the village council. I attended community
meetings and church services in addition to visiting the primary schools and
making as many home visits as possible to introduce myself and my project to
residents. At the same time, I was learning to better understand the local variety
of English while revising and piloting the interview protocol and making other
necessary arrangements such as transportation and housing.
In group meetings and household visits, I gave out an ―Information Sheet‖
(see Appendix A-3) so that they also had a project description in writing to look
34
at later, if they chose. The Information Sheet was largely based on the
requirements of the Texas A&M University Institutional Review Board, and much
of the information was unhelpful for residents of the region. Nevertheless,
anyone who requested a copy was given one as were all community residents
that I formally introduced my project to, either at a community meeting or during
a home visit.
I introduced myself as a university student there to conduct a research
project for my degree. The project dealt with people‘s values and natural
resources and conservation. I would be asking people to volunteer to answer
some questions for me related to this so that I could try to better understand the
connections between their values and natural resource conservation. Anything
and everything they told me when answering those questions would be
completely confidential; the residents liked to say that it would be like with the
doctor. No one besides myself would have access to the data and be able to
see the answers and names. Of course, I would report what they told me but
always in a way that the specific person could not be identified, unless the
person specifically gave me permission to say who said something. At the end
of my time in the North Rupununi, I would make a presentation for each
community with a summary of the information. It would be preliminary and
therefore very incomplete and basic at that point, but hopefully, the communities
would find the information interesting and useful.
35
In group and individual meetings, I invited people to ask questions. Many
of the questions asked were personal rather than related to the project. Most
commonly, people wanted to know how old I was and how many children I had.
They also wanted to know if I were married and how long I had been in school.
They asked to see photos of my home, my dog, my family, and even of the food
in the United States, so I began to take photos with me on home visits. Some
people even asked me for the photos as gifts. Whenever possible, I obliged.
While doing introductions, I began to learn more about the language and
culture. The people speak a Guyanese dialect of English with each other, and
the rules, words, usages, and pronunciation are often different from US English
and other, more widely used forms of English. I revised the instrument once
again to incorporate more culturally relevant language and content. This
version, the third, I piloted with only a couple of people not in participating
villages as an initial test with local residents. The pilot went well; the testers
made useful suggestions and discovered some trouble spots.
After more revisions, a final pilot test was made with 10 residents of
Rupertee, a community in Annai District not participating in the actual study.
Minor details were ironed out after that, and the final version of the interview
protocol was approved by the Texas A&M Institutional Review Board in June
2008.
The instrument was initially arranged according to Dillman‘s (2000)
finding that participants want to get straight to the issues they are told the
36
research is about, thus the original order was natural resource items first, then
value and perception items, and lastly socio-demographics. However, I found
that this did not work in the North Rupununi.
The participants were not used to discussing many of these topics,
particularly not issues of natural resources, so beginning with the natural
resource section was seriously problematic. By beginning with the natural
resource items—even the simplest ones—participants felt unable to answer the
questions at all. My perception from discussing this with participants and other
residents of the district is that the problem was largely related to a tendency not
to discuss such topics actively. For example, a local teacher told me that it was
uncommon for families to discuss what students were doing in school. At home
family conversations revolved around work that needed to be done such as farm
work, house work, and food preparation.
Thus, I reversed the order of sections to reflect participants‘ level of
comfort with the questions and to collect the best data possible: (1) socio-
demographic information, (2) perception and value orientation items, and (3)
natural resource items. Following the re-ordering of the sections, participants
were much more comfortable and better able to respond. They could answer
the socio-demographic items with minimal difficulty. The value items required
them to think hard about what they do and what is important to them, but they
were clearly about personal beliefs and actions, and the responses were fixed.
The natural resource items were about their knowledge, perceptions and
37
opinions; and by the time we reached these items, most participants were
comfortable enough in the interview to respond. For many these issues and
topics are not ones they often talk about so their responses were often slow in
coming as they required ample time to frame their thoughts and opinions in
words.
Originally, the instrument was designed to be used either in written format
or as an interview. However, in practice so few people were truly comfortable
and capable of answering in writing that I immediately switched to all interviews.
The initial plan was that those who wanted to and felt comfortable could respond
in writing, increasing my capacity to collect data. This plan was created in
consultation with village leaders and researchers who had worked in the area;
they thought a reasonable number of residents would be able to answer the
questions in writing to make the arrangement worth attempting. I arranged to
have village meetings at which people could complete part or all of the
instrument while I was available to introduce it and answer questions. For those
unable to attend but who wanted to complete it in writing, I would visit homes
and drop off questionnaires. For everyone who preferred, I would do a face-to-
face interview to complete the questionnaire. This plan proved unproductive,
which I discovered at the first community meeting to fill out the questionnaires,
and from that point, all data were collected via personal interviews.
Though most people understood and spoke English, some did not and
some were simply uncomfortable using English or they felt inadequate using it.
38
This was particularly true in Crash Water. Therefore, a Makushi translation of
the questionnaire was contracted in May using the final revised draft sent to the
Texas A&M Institutional Review Board for approval (and subsequently
approved). Although attempts have been made and are still in progress to
create more written materials in Makushi and to increase literacy in the
language, Makushi is almost exclusively a spoken language at this point.
Finding people to do the written translations into Makushi and then a reverse
translation back into English was difficult; additionally, the translators could not
be from the communities in which data were to be collected.
The initial translation into Makushi took three months. When the reverse
translation was conducted, the problems were clearly substantial. A new
translation had to be commissioned. By the time the second Makushi version
was complete, I was unable to get a reverse translation completed in time to
conduct any interviews in Makushi.
Another issue with conducting interviews in Makushi was that I then
needed a guide who could not only speak Makushi but who could read and write
it. So few people were able to do so, and those who could were often employed
full time, e.g., some teachers and district administrators. Those who were able
to read and write Makushi sufficiently to do the work were frequently unable to
take the time to conduct the interviews with me. Thus, even if the translation
had been completed in time to conduct interviews in Makushi, doing so might not
have been possible anyway.
39
Because of the language issues with the interview protocol, I eventually
had to decide not to conduct interviews in Crash Water. Instead, I attempted to
collect a few more in each of the other villages.
Data Collection
Data were collected via face-to-face interviews using a mostly structured
interview protocol (Bernard 2000). Participants ages 8 and older were recruited
in five villages; in practice, nearly all participants were born in 1996 or before.
Only 5 were younger, and the oldest person interviewed turned 71 in 2008. Age
8 was selected as the lower bound for participation because participants of this
age would have been in school for a couple of years and might have different
knowledge, experiences, and even values than other age groups. Age was a
key socio-demographic factor that I wanted to test for variations of values as well
as the natural resource items.
One hundred seventy-three interviews were initiated; 167 were completed
and useable for the analyses. Of these 167 participants whose interviews were
included in the analyses, 91 (54.5%) were female and 76 (45.5%) were male.
Field work began in January 2008; data collection took place from February to
October 2008; and the formal interviews were conducted between June and
October of the same year.
Permits and approvals were obtained from the appropriate Guyanese
agencies and organizations in or prior to January 2008. The research protocol
40
was approved by the Texas A&M University Institutional Review Board (Protocol
No. 2007-0738, amended 9 June 2008). Guyanese authorities, specifically the
Ministry of Amerindian Affairs and the Environmental Protection Agency, also
approved the project and granted permits to conduct the research. Before the
Guyanese national agencies would consider my applications for research, the
NRDDB had to grant me permission to conduct my project. The villages were
asked to approve the project and invited to participate in April 2007 and
subsequently did so.
The sample was a stratified convenience sample (Bernard 2000). I
recorded both the gender and birth decade (1970s, 1990s, etc.) of each
participant by village. In this way, I attempted to ensure that within each village I
got responses from a sample relatively balanced by age cohort and gender.
Doing so helped me make sure that I was not interviewing only the people who
were the most available. In one village I discovered that only a couple of men
born in the 1970s still resided there primarily. I would not have realized the
extent to which this age cohort of men left the village for work opportunities had I
not been seeking to balance my stratified sample.
The majority of the interviews were conducted at people‘s homes,
because that was where they were during the day. Some interviews were
conducted at the Bina Hill Institute or at public buildings such as the community
health office or the schools, if that was more convenient for the participant.
41
The Researcher in the Communities: Perceptions
Interviews are particularly susceptible to the interpersonal influences of
the people involved, here the researcher and the participant. The participants‘
perceptions of me were therefore an important part of the data collection
process. Likely perceptions of me include wealthy since I was a university
student and ―still‖ a student and an outsider, highlighted by the vast difference
between my appearance and theirs.
Both Iwokrama and Conservation International cooperated with me on
logistics such as transportation and mail, so they may have seen me as
connected to them. However, such logistics are a problem for everyone in the
region, so residents coordinate rides and such with them and others, including
private persons, businesses, and agencies such as the Ministry of Amerindian
Affairs or the Guyana Elections Commission. One thing that might have
influenced that perception more is that when I first visited the river villages, I was
with a group from CI and the head of that group introduced me to the toshaos. I
did get some additional support from Iwokrama and CI, such as with my
immigration paperwork and printing costs, but those would not have been visible
to the residents. In fact, while my project was vetted by both organizations and
they agreed to assist me, I was not officially affiliated with either of them.
Nevertheless, the perception that I was connected to them in some official way
might have persisted.
42
Residents enjoyed ―gaffing‖ (chatting and teasing) with me and would
seek me out to talk. They brought me some gifts of fruit and other food such as
fish, a mildly big deal because giving food was not common in the region. I was
invited to some birthday parties and other events. After I made school visits, the
children would stop me on the road to say hello and make the favorite animal
face for me, which I always returned. One perception that was certainly there,
though I do not know how pervasive it was, was that what I did—the interviews,
etc.—was not work. One of the workers at the Bina Hill Institute told me that
point blank, though he was not part of the study population. All of these issues
and perceptions plus others most certainly influenced the interactions I had with
residents and study participants, coloring the responses to the interviews and
the data I collected.
Most interviews lasted one to two hours. Occasionally an interview lasted
much longer than usual, and generally in those cases, the participant seemed to
have limited to almost no comprehension of the concepts the interview was
addressing. Consequently, several interviews were aborted in progress while
another interview was completed but not included in the analyses due to
suspected lack of comprehension. One participant appeared overtly intent on
impressing the interviewer with his sophisticated responses, which brought the
veracity of the responses into serious question as compared to those of the
other participants. Thus, this participant‘s interview was disregarded in the
analyses. In the analyses, 167 of the 173 interviews were used.
43
CHAPTER II
INDIVIDUALISM AND COLLECTIVISM IN NATURAL RESOURCE
CONSERVATION
Introduction
Natural resources are the key to life on Earth. They provide ecosystem
services such as oxygen, flood mitigation, crop pollination, and shelter, and
human livelihoods are often directly connected to them through harvest and
other uses (MEA 2005). Yet due to humanity‘s collective overuse of natural
resources and overproduction of wastes such as carbon dioxide (WWF 2010),
natural resources in many, if not most, areas of the world are in varying degrees
of degradation and threat. Poorer countries are showing even higher rates of
biodiversity loss than wealthier ones, and lacking clean water, sufficient nutrition,
fuel, and other important resources seriously impacts their chances of escaping
poverty (Sachs et al. 2009; WWF 2010). The hardships created by the poverty
and lack of resources can make these poverty stricken people feel like they have
no choice but to use anything available in order to survive.
Biological knowledge is not enough to conserve the planet‘s natural
resources (Nicholson et al. 2009). Conservation often asks people to change
their use of resources in some way in order to protect the resources, and such
changes can interfere with people‘s existing livelihoods and lifestyles. Thus, in
order to be successful, conservation usually requires the cooperation of
44
communities and individuals (e.g., Wyckhoff-Baird 2000; Schmidt-Soltau 2004;
Herrold-Menzies 2006). To create effective natural resource conservation, a
combination of biological and social sciences are necessary (MEA 2005;
Nicholson et al. 2009).
Nicholson et al. (2009:1140) elaborate on 4 areas in which they deem
―further research is urgently required:‖ agendas, processes, metrics, and
uncertainty. They define processes as ―the interactions between socio-
economic and ecological systems, between multiple ecosystem services, and
among the ecological processes that underpin ecosystem service provision‖
(Nicholson et al. 2009:1140). The Millennium Ecosystem Assessment (MEA)
calls culture an ―indirect driver‖ (2005:64) of ecosystem change, stating that
―culture conditions individuals‘ perceptions of the world, [and] influences what
they consider important …. Cultural factors, for example, can influence
consumption behavior (what and how much people consume) and values related
to environmental stewardship, and they may be particularly important drivers of
environmental change‖ (2005:65). WWF‘s Living Planet Report (2010)
discusses social aspects of use and sustainability, emphasizing that practices
must be socially sustainable, as well as economically and ecologically, in order
to be successful.
Psychological research shows that different societies and cultures have
different core values and perceptions (Hofstede 1980; Triandis 1995; Smith
2004). These variations seem to extend to their relationships with natural
45
resources. Not only can different groups have different purposes in their use of
the resources, but they can also have different attitudes towards them and
perceptions of them and value the resources differently. These differences can
include how to use resources, what degree of use is acceptable, and
where/which resources are used (MEA 2005). Conservation researchers and
field practitioners have established that taking social and cultural variation into
account is essential in order to realize the most successful and effective
conservation program possible for a particular context (Beltrán 2000; Kamath &
Oza 2002; Goldman 2003; Kamanda et al. 2003; Pathak & Kothari 2003; Hunter
& Brehm 2004; MEA 2005). Therefore, learning as much as possible about the
relationships between core values and issues related to natural resources and
conservation is pivotal to improving conservation success.
Problem Statement
Researchers have investigated the connections between conservation on
one hand and some cultural values and/or practices on the other (Western &
Wright 1994; Gray et al. 1997; Stevens 1997; Posey 1998; Hulme & Murphree
2001; Kamath & Oza 2002; Nepal 2002; Kamanda et al. 2003; Pathak & Kothari
2003; Colchester 2004; West et al. 2006), because of the role these
relationships appear to play in conservation. Despite the recognition of the
importance of socio-cultural differences in conservation, only a modest amount
46
of research has been conducted to assess core values and perceptions in
connection with natural resource conservation in indigenous contexts.
A better understanding of associations between core values and
perceptions in individuals or in a society and their attitudes and actions could be
useful in all stages of conservation projects and programs (e.g., Wyckoff-Baird
2000; Goldman 2003; Pathak & Kothari 2003; Hunter & Brehm 2004; MEA
2005). In fact, such understanding carries the potential to improve conservation
effectiveness markedly by increasing public cooperation.
This study aimed to investigate the relationship between individuals‘
levels of individualism and collectivism and their perceptions of, attitudes toward,
and behaviors relating to natural resources and conservation. The primary
question is how measures of individualism and collectivism might be related to
knowledge of and views on natural resources and thereby influence
conservation actions. Conservation professionals could then apply this
improved understanding to make natural resource conservation more successful
in the long run.
Literature Discussion of Individualism & Collectivism
Individualism and collectivism are aspects of every society and culture.
Even at extremely low levels, the ―value‖ placed on them is important for the
individual, society, and culture. Researchers have defined high ‗individualism‘
as placing importance on one‘s personal goals and desires as well as on
47
emotional independence (Hofstede 1980; Gelfand et al. 1996). ‗Collectivism‘
stresses the goals of the group, however the group is defined (Gelfand et al.
1996; McCarty & Shrum 2001); one‘s responsibilities to the group; and sharing
and harmony within the group (Hofstede 1980).
Superficially, individualism and collectivism appear to be opposites, and
in some cases researchers define and treat them as such (e.g., Triandis 1995,
Celinska 2007). Research exists indicating that the two are not opposite ends of
a single continuum. Rather, evidence suggests they are separate continua
entirely, especially at the individual level as opposed to the level of cultures.
Both can be present in high levels, or in low levels, simultaneously (e.g., Gelfand
et al. 1996; Freeman 1997; Triandis & Gelfand 1998; Kobayashi et al. 2010). In
fact, some scholars suggest that authoritarianism anchors the other end of the
individualism continuum (Gelfand et al. 1996) rather than collectivism.
The Study
The research focused on the relationships between participants‘ value
orientations toward individualism and collectivism and their self-reported
attitudes, opinions, knowledge, and behavior relating to natural resources and
conservation within their communities and the district. In this study,
individualism and collectivism are treated as separate continua.
The hypotheses that I attempted to test were the following:
48
1. People who report a higher level of individualism will be less likely to
report engaging in conservation behaviors than those with a lower level.
2. People who report a higher level of collectivism will be more likely to
report engaging in conservation behaviors than those with a lower level.
Research Significance
Some researchers have studied relationships between cultural and social
values and attitudes and behaviors relating to natural resources and
conservation. Some scholars have conducted studies of general socio-cultural
values as they relate to natural resources and attendant behaviors (e.g., Schultz
& Zelezny 1998; Nordlund & Garvill 2002; Schultz et al. 2005). Much more work
has been done to uncover hypothesized relationships between environmental
attitudes and beliefs and environmental behaviors (e.g., Dunlap & Van Liere
1978; Vining & Ebreo 1992; Stern et al. 1995; Jurin & Fortner 2002; Johnson et
al. 2004; Fujii 2006; Chung & Leung 2007; Chen et al. 2011). Reasonably
extensive research regarding socio-demographic factors, perceptions, beliefs,
and the specific behavior recycling has been conducted (e.g., Vining & Ebreo
1990; Granzin & Olsen 1991; McCarty & Shrum 1994; Shrum et al. 1994; Berger
1997; Scott 1999; Johnson et al. 2004; Mannetti et al. 2004; Oom do Valle et al.
2005; Fraj & Martinez 2006; Kurz et al. 2007; Vicente & Reis 2007). Others
have looked at materialism and environmental beliefs and behaviors (e.g.,
Clump et al. 2002; Kilbourne & Pickett 2008). Scholars have also explored
49
individualism and collectivism as they relate to recycling practices (e.g., McCarty
& Shrum 1994; McCarty & Shrum 2001).
Though indigenous communities around the world have been studied in
depth, core values and perceptions in relation to natural resources and
conservation have less often been the focus. Thus, this study makes a
significant contribution to existing research by increasing the understanding of
relationships between individualism, collectivism, socio-demographics, and
natural resource issues in the context of indigenous people. The indigenous
context is of particular importance because many of the world‘s relatively intact
resources are located in more remote areas populated by indigenous groups.
Thus, better understanding how to engage indigenous communities more
actively in natural resource conservation is an essential component of long-term
conservation success. This study helps fill that gap in understanding and can be
applied when designing and implementing natural resource conservation.
Methods
In order to test the hypotheses posed above, I conducted a study in the
North Rupununi, Guyana, in five communities ranging 15 to 35 km in distance
from a relatively recently created forest reserve called Iwokrama International
Centre for Rainforest Conservation and Development (Iwokrama).
50
Instrument and Data Collection
Data were collected using two primary methods: formal, mostly structured
interviews with some open-ended items and informal conversation and
observation (Bernard 2000). The formal interviews were administered
individually and in a single session. Over 170 interviews were initiated, and for
the data analysis, 167 were used. I discontinued or discarded the others due to
a variety of reasons, such as doubts that the participant clearly understood the
concepts and the explicit feeling that the interviewee was trying to impress me in
some way.
Residents in 5 of the 16 communities in the North Rupununi were
interviewed. The 5 participating villages were Annai Central (37 interviews),
Apoteri (34), Aranaputa (33), Rewa (33), and Wowetta (30). Crash Water village
also agreed to participate, but due to technical issues, I was unable to conduct
interviews there.
All of the villages within the North Rupununi District have had significant
contact with Iwokrama, other non-governmental organizations, government
agencies, and research projects regarding natural resources, although the
specific constellations and situations differed some. The 5 participating
communities presented a useful collection of features that made them optimal
for this study. First, the distance between village lands and Iwokrama was close
enough that they had more regularly used Iwokrama lands for various natural
resource purposes such as hunting, fishing, and felling large trees for canoes.
51
At the time of data collection, all communities but Aranaputa had title to their
lands, and in the case of Aranaputa, the village had chosen not to apply for title
because it preferred the laws applicable to non-Amerindian settlements (Virgil
Harding, personal communication). The communities also had clear divisions in
accessibility and transportation: Apoteri and Rewa are located directly on the
Rupununi River and had little to no road access at all, while Annai Central
(Annai), Aranaputa, and Wowetta lie near the major road in the region, the
International Highway, which runs from the capital, Georgetown, to the Brazilian
border at Lethem. Annai also had regular air service from Georgetown, and
although Apoteri has an airstrip, planes were infrequent. Consequently, at times
I refer to the ‗river villages,‘ Apoteri and Rewa, and the ‗road villages,‘ Annai,
Aranaputa, and Wowetta. Lastly, the villages had varying levels of
heterogeneity and by extension seemingly different levels of access to variety in
experiences and perspectives. Aranaputa and Annai appeared more
heterogeneous; Wowetta, Rewa, and Apoteri more homogeneous.
Interviews generally lasted 1.5 to 2 hours, and residents aged 8 and older
were invited to participate. Many people were shy, but few refused to
participate, except for the youngest: Only two 8-year-olds and one 9-year-old
agreed to participate. At the other end of the age spectrum, not many residents
were over the age of 60, so only 5 people between ages 60-65 participated and
only 1 participant was over 65 (age 71 when interviewed).
52
All villagers were invited to participate, but of course, practical
considerations did not permit me to actually contact each and every one for an
interview, nor would I have been able to interview each one had each agreed to
participate. Thus, in an attempt to get a reasonably broad sample, I kept track of
the gender and decade of birth of participants in each village and tried to
balance the sample according to those criteria. I chose gender and age (decade
of birth) as the basic demographic factors for stratification, because I
hypothesized that those variables might make a difference in experience and
opportunity resulting in significant information. Thus, the sample was a stratified
convenience sample (Bernard 2000).
The interview protocol was developed based on previously used and
validated instruments for measuring the value orientations individualism (Ali
1987; Dorfman & Howell 1988; Earley 1993; Oyserman 1993; Bierbrauer et al.
1994; Singelis 1994; Chew 1996; Yoo 1996; Jung & Kellaris 2001; Yi 2004) and
collectivism (Eraz & Earley 1989; Oyserman 1993; Singelis 1994; Jung &
Kellaris 2001; Yi 2004). The instrument also collected data regarding socio-
demographics and natural resource and conservation knowledge, activities, and
opinions as well as locus of control (see Appendix A-1 for full interview protocol).
Two rounds of pilot testing and modifications to the instrument were
conducted prior to arrival at the study site, after which the interview protocol was
submitted to the Texas A&M Institutional Review Board for approval. Initial
approval was granted in November 2007. After arriving in the North Rupununi,
53
another round of pilot testing was conducted with some volunteers residing in
Rupertee, a community in the North Rupununi not participating in the study.
Following that, the final amendments were made to the protocol and submitted
for final approval. The amended protocol was approved in June 2008.
Interviews began that month and lasted through October of the same year.
When I first arrived in the district, I visited each participating village to
introduce myself. I spoke to the village toshao to introduce myself. The village
leaders had already agreed to allow me to interview people in their villages, but I
had only met a few village leaders, and in most cases, we had only briefly
discussed my study. So, we talked in more depth, I gave the village leaders the
project information sheet (see Appendix A-3), and each village held a meeting
for me to introduce myself initially to the community. At the meetings, I told
attendees that I was a university student from the United States there to do a
project for my degree. The project involved learning from them about their
values and natural resources, so I wanted to interview as many residents as
possible to find out their opinions, ideas, and more. I stressed that I was asking
them to do me a favor by participating and answering my questions and that
participating was completely voluntary. Though I would report many of their
answers, the individuals would not be identifiable but would remain confidential,
unless the interviewees gave me specific permission to use identifiers such as
names. I finished up by informing them that I would give a presentation to the
village after I collected the data to share the preliminary results and information
54
before I left. I invited people to ask me questions, either at the meeting or any
time. I also visited the primary schools to introduce myself and my project to the
younger potential participants.
Following the introductory meetings, I conducted visits to homes to
introduce myself and my project on a more individual basis. I gave people a
copy of the Information Sheet and discussed the project with them. One on one,
I also answered a number of personal questions, such as how many children I
had and how old I was. Many people asked to see pictures of my home and
family, so I printed some and took them with me. Some people even asked to
keep a photo or 2. Others asked me to take photos of them, and anyone I took
photos of, for my own purposes or at their request, got copies of those photos.
I conducted all interviews personally, striving to make them as uniform as
possible. English is the language used by the government and in schools as
well as by many people in everyday life. In the North Rupununi, many people
also use Makushi or other indigenous languages. Some people speak
Portuguese, but it is only rarely used as the primary home language. In this
sample, participants reported English as the most common language spoken at
home, though some reported they used multiple languages equally at home and
some primarily used other languages at home.
I contracted a Makushi translation of the protocol in hopes of reaching
more people, particularly older residents; however, technical issues prevented
the translation from being completed. One major obstacle was that Makushi is
55
essentially an oral language. Some residents are working with outsiders to
create a consistent written language and to teach people to read and write
Makushi, but at this point literacy in Makushi is limited and the writing system is
inconsistent. Thus, finding a translator was problematic; getting the work done
took months; the reverse translation immediately revealed massive problems;
and a new translator had to be located to start the process over. Moreover,
finding someone literate to train to administer the interview was a problem
because those people often had full-time wage labor and were not available
during the day. Interviews had to be conducted during daylight hours because
of light and transportation issues.
Very few people in the 5 communities in which I conducted interviews
seemed insufficiently fluent in English to understand and respond to the
interview reasonably. According to my village guides, no one refused to
participate due to language limitations. I did discretely end a few interviews
early due to limited understanding of the participants, but those problems were
more with concepts than vocabulary. The people with whom such issues came
up speak English and attended 4-6 years of school but were simply unfamiliar
with some concepts fundamental to the interview, such as ―change‖ and
―opinion.‖ Greenfield (1997) discusses such issues in people with less formal
schooling. Formal schooling often deals in abstractions because the physical
items are not present or the topics are not physical at all, thus people with more
formal schooling have more experience with such concepts, thinking, and
56
questions as compared to those with less formal education (Greenfield 1997). I
would extend this to say that length of formal schooling is not a sufficient
condition in areas such as this; the quality of education also matters and that
varies greatly over time and place.
My presence as outsider, researcher, and interviewer was a source of
bias in the data, and when reviewing the data and conclusions, this must be
taken into account. Participants reacted with my presence and my various
identities vis-a-vis themselves and answered accordingly in some way. One
participant appeared so eager to show himself in a favorable light to me that I
was unable to include the data from his interview due to the probability of bias
and inaccurate responses. Participants also expressed their ease in talking with
me, which increased my confidence in the data to a degree. For example, at the
end of the session, an older man whom I had not met before requesting an
interview told me that I was so easy to talk to; he was surprised he had felt so
comfortable answering all of my questions though he had never met me before.
Data Analysis
For analysis of the data, the responses were entered into a database
created in Microsoft Office Access 2007 and some were subsequently
57
transformed. To start with, all the individualism items and collectivism items,
respectively, were grouped with each other (Table 2.1). Then the verbal
responses to the items had to be scored numerically while preserving the
ordinality of the data. All items in both groups were scored such that the higher
number indicated a higher level of the respective value. So, a 1 indicates a
relatively low level of the value and a 4 represents a relatively high level.
Once each item was assigned a score, an index for each group of items
was obtained for each participant by calculating the arithmetic mean for those
items. One participant did not answer 1 item in the collectivism group, which I
compensated for by calculating the index for that individual with the number of
items answered (16) instead of the number of items possible (17). All other
participants responded to all items included in both the individualism and
collectivism indices.
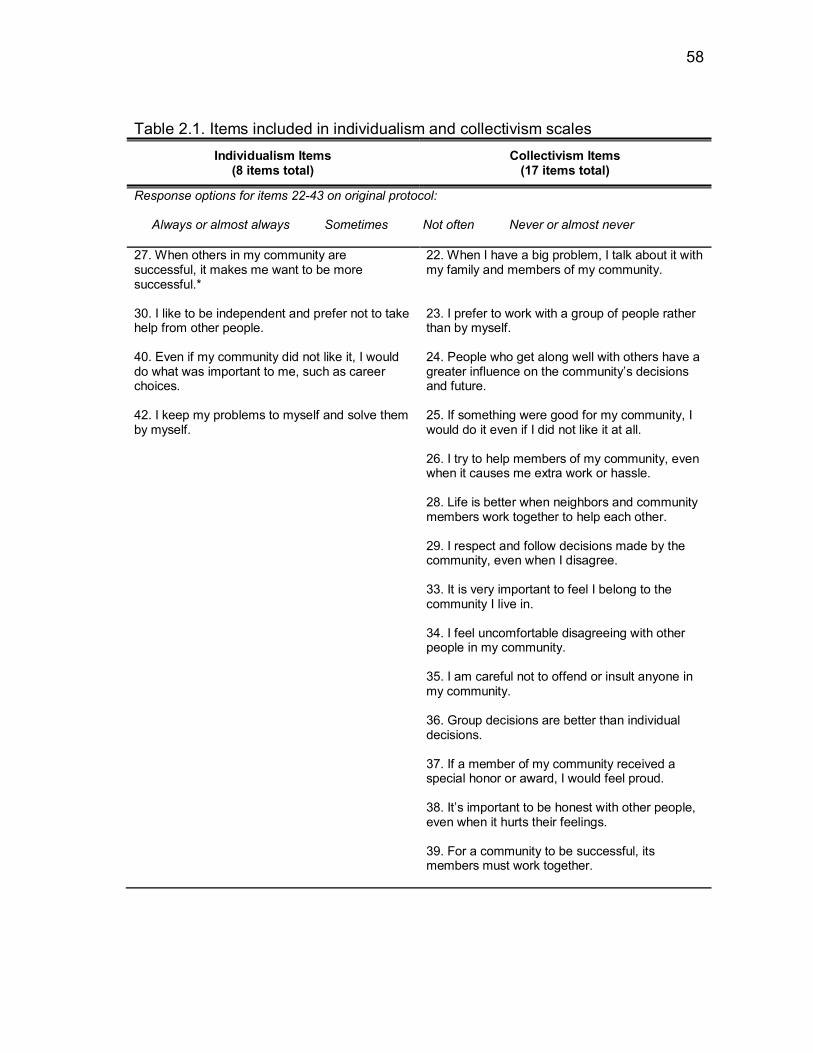
58
Table 2.1. Items included in individualism and collectivism scales
Individualism Items (8 items total)
Collectivism Items (17 items total)
Response options for items 22-43 on original protocol: Always or almost always Sometimes Not often Never or almost never
27. When others in my community are successful, it makes me want to be more successful.*
22. When I have a big problem, I talk about it with my family and members of my community.
30. I like to be independent and prefer not to take help from other people.
23. I prefer to work with a group of people rather than by myself.
40. Even if my community did not like it, I would do what was important to me, such as career choices.
24. People who get along well with others have a greater influence on the community‘s decisions and future.
42. I keep my problems to myself and solve them by myself.
25. If something were good for my community, I would do it even if I did not like it at all.
26. I try to help members of my community, even when it causes me extra work or hassle.
28. Life is better when neighbors and community members work together to help each other.
29. I respect and follow decisions made by the community, even when I disagree.
33. It is very important to feel I belong to the community I live in.
34. I feel uncomfortable disagreeing with other people in my community.
35. I am careful not to offend or insult anyone in my community.
36. Group decisions are better than individual decisions.
37. If a member of my community received a special honor or award, I would feel proud.
38. It‘s important to be honest with other people, even when it hurts their feelings.
39. For a community to be successful, its members must work together.
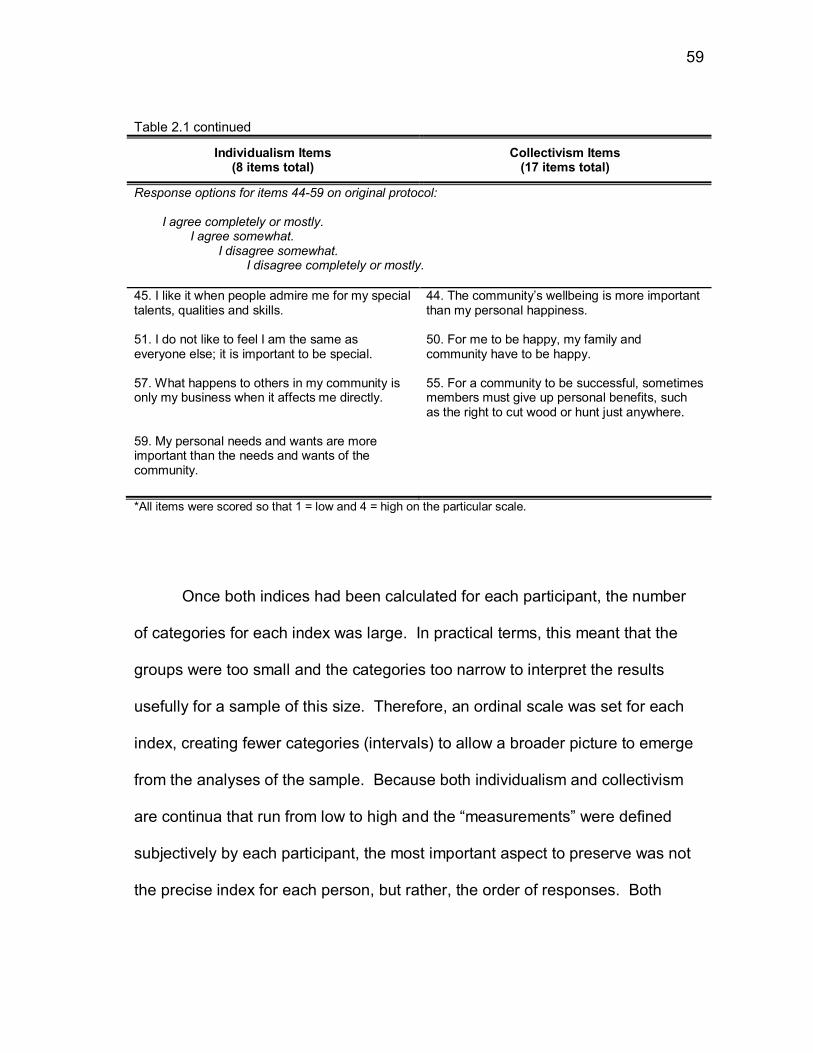
59
Table 2.1 continued
Individualism Items (8 items total)
Collectivism Items (17 items total)
Response options for items 44-59 on original protocol: I agree completely or mostly. I agree somewhat. I disagree somewhat. I disagree completely or mostly.
45. I like it when people admire me for my special talents, qualities and skills.
44. The community‘s wellbeing is more important than my personal happiness.
51. I do not like to feel I am the same as everyone else; it is important to be special.
50. For me to be happy, my family and community have to be happy.
57. What happens to others in my community is only my business when it affects me directly.
55. For a community to be successful, sometimes members must give up personal benefits, such as the right to cut wood or hunt just anywhere.
59. My personal needs and wants are more important than the needs and wants of the community.
*All items were scored so that 1 = low and 4 = high on the particular scale.
Once both indices had been calculated for each participant, the number
of categories for each index was large. In practical terms, this meant that the
groups were too small and the categories too narrow to interpret the results
usefully for a sample of this size. Therefore, an ordinal scale was set for each
index, creating fewer categories (intervals) to allow a broader picture to emerge
from the analyses of the sample. Because both individualism and collectivism
are continua that run from low to high and the ―measurements‖ were defined
subjectively by each participant, the most important aspect to preserve was not
the precise index for each person, but rather, the order of responses. Both
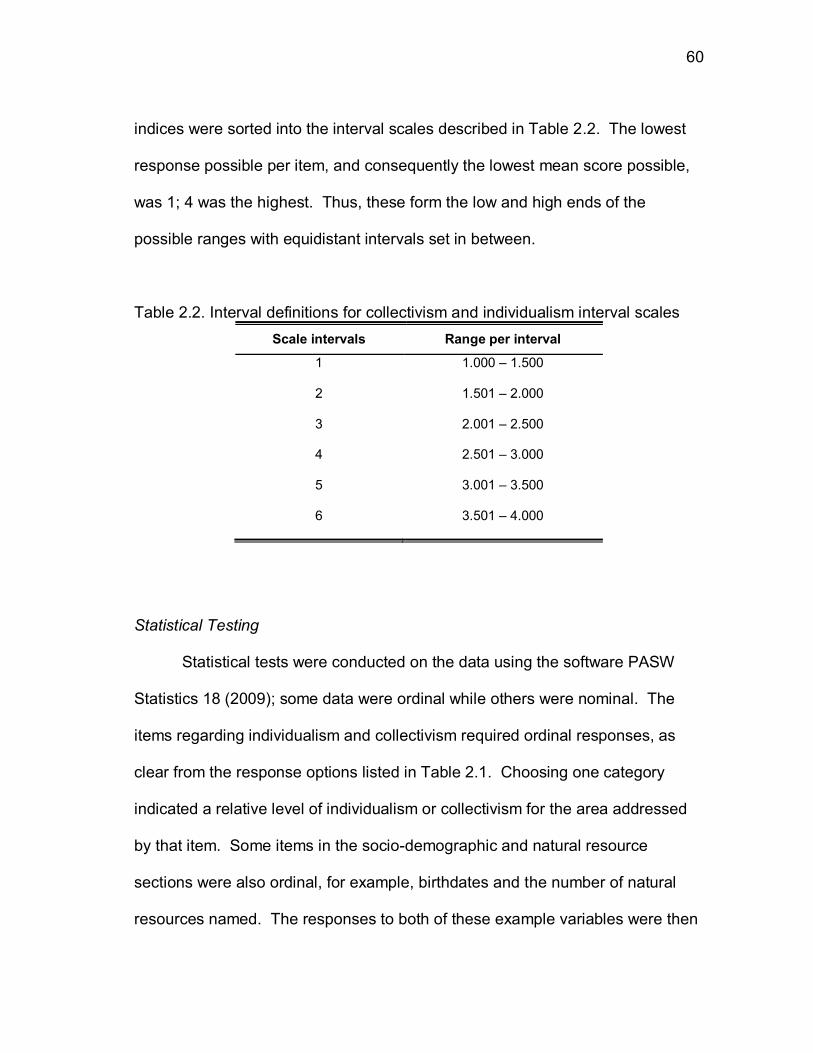
60
indices were sorted into the interval scales described in Table 2.2. The lowest
response possible per item, and consequently the lowest mean score possible,
was 1; 4 was the highest. Thus, these form the low and high ends of the
possible ranges with equidistant intervals set in between.
Table 2.2. Interval definitions for collectivism and individualism interval scales
Scale intervals Range per interval
1 1.000 – 1.500
2 1.501 – 2.000
3 2.001 – 2.500
4 2.501 – 3.000
5 3.001 – 3.500
6 3.501 – 4.000
Statistical Testing
Statistical tests were conducted on the data using the software PASW
Statistics 18 (2009); some data were ordinal while others were nominal. The
items regarding individualism and collectivism required ordinal responses, as
clear from the response options listed in Table 2.1. Choosing one category
indicated a relative level of individualism or collectivism for the area addressed
by that item. Some items in the socio-demographic and natural resource
sections were also ordinal, for example, birthdates and the number of natural
resources named. The responses to both of these example variables were then
61
grouped into ordinal categories to reduce the number of possible responses. By
doing this, the analyses produced more useful results than if each of over 60
years were potentially a separate category for age. Thus, for these data, the
order of the categories is of key importance as it indicates some measure of
relative magnitude and/or ordinality, albeit subjective in some cases.
The remaining data were nominal, and so the order was not of interest.
For these variables, e.g., marital status or opinion on natural resource
conservation, the responses could be grouped into categories by content. For
instance, participants‘ opinions on natural resource conservation could be
categorized by themes they focused on in their response or overall tendency
such as ―positive,‖ ―negative,‖ or ―mixed.‖
The data were analyzed using ―Crosstabs,‖ found in PASW (2009) in the
tab ―Analyze‖ under ―Descriptive Statistics.‖ The results of the crosstabulations
were tested for statistically significant patterns using appropriate tests. The tests
used to analyze the statistical significance of any associations between the
variables in the crosstabs were either for ordinal variables or for nominal v.
interval (ordinal intervals) variables. When both variables being analyzed were
ordinal, gamma and Somers‘ d were calculated. Gamma is a symmetrical test of
whether and how much two ordinal variables change together in a predictable
way. In contrast, Somers‘ d analyzes the variables asymmetrically, with one as
the independent (predictor) variable and the other as the dependent (predicted)
variable. In doing this, it attempts to further delineate the relationship between
62
the two variables, though of course, Somers‘ d cannot demonstrate causation.
Both gamma and Somers‘ d range from -1 to 1. Zero shows no relationship; as
the values approach |1|, they indicate increasing strength of relationship. The
sign (+ or -) shows the direction of the relationship (Somers 1962; Costner 1965;
PASW 2009).
For situations in which one variable is nominal and the other interval
(ordinal), eta was calculated as the measure of association. It calculates the
measure of association with the nominal variable as the independent variable
and the interval variable as the dependent variable. Eta ranges from 0 to 1; the
closer the result is to 1, the stronger the relationship between the 2 variables is
(PASW 2009).
In one situation, both variables were nominal, which means that Somers‘
d, gamma, and eta are inappropriate measures. Generally for such data, log-
likelihood or Pearson‘s chi-square is appropriate. However, because the
crosstabulation has so many categories, expected values were often low, and 16
of 24 of the expected values in the crosstabulation were below 5. Thus, neither
a log-likelihood test nor Pearson‘s chi-square test or tests relying on it are
appropriate to measure associations between the variables (Frankfort-Nachmias
& Leon-Guerrero 2006).
Instead, under ―Crosstabs‖ lambda was calculated. Lambda is an
asymmetrical measure of the reduction in error that occurs when one nominal
variable (independent) is used to predict another (dependent) nominal variable,
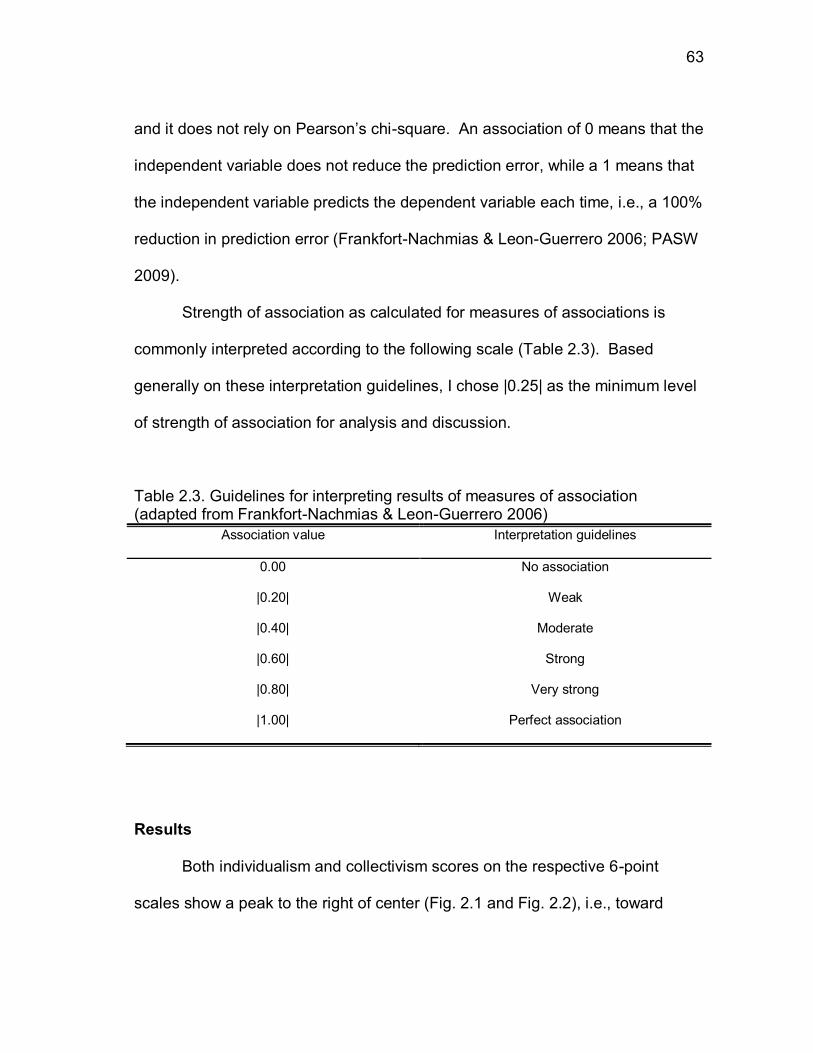
63
and it does not rely on Pearson‘s chi-square. An association of 0 means that the
independent variable does not reduce the prediction error, while a 1 means that
the independent variable predicts the dependent variable each time, i.e., a 100%
reduction in prediction error (Frankfort-Nachmias & Leon-Guerrero 2006; PASW
2009).
Strength of association as calculated for measures of associations is
commonly interpreted according to the following scale (Table 2.3). Based
generally on these interpretation guidelines, I chose |0.25| as the minimum level
of strength of association for analysis and discussion.
Table 2.3. Guidelines for interpreting results of measures of association (adapted from Frankfort-Nachmias & Leon-Guerrero 2006)
Association value Interpretation guidelines
0.00 No association
|0.20| Weak
|0.40| Moderate
|0.60| Strong
|0.80| Very strong
|1.00| Perfect association
Results
Both individualism and collectivism scores on the respective 6-point
scales show a peak to the right of center (Fig. 2.1 and Fig. 2.2), i.e., toward
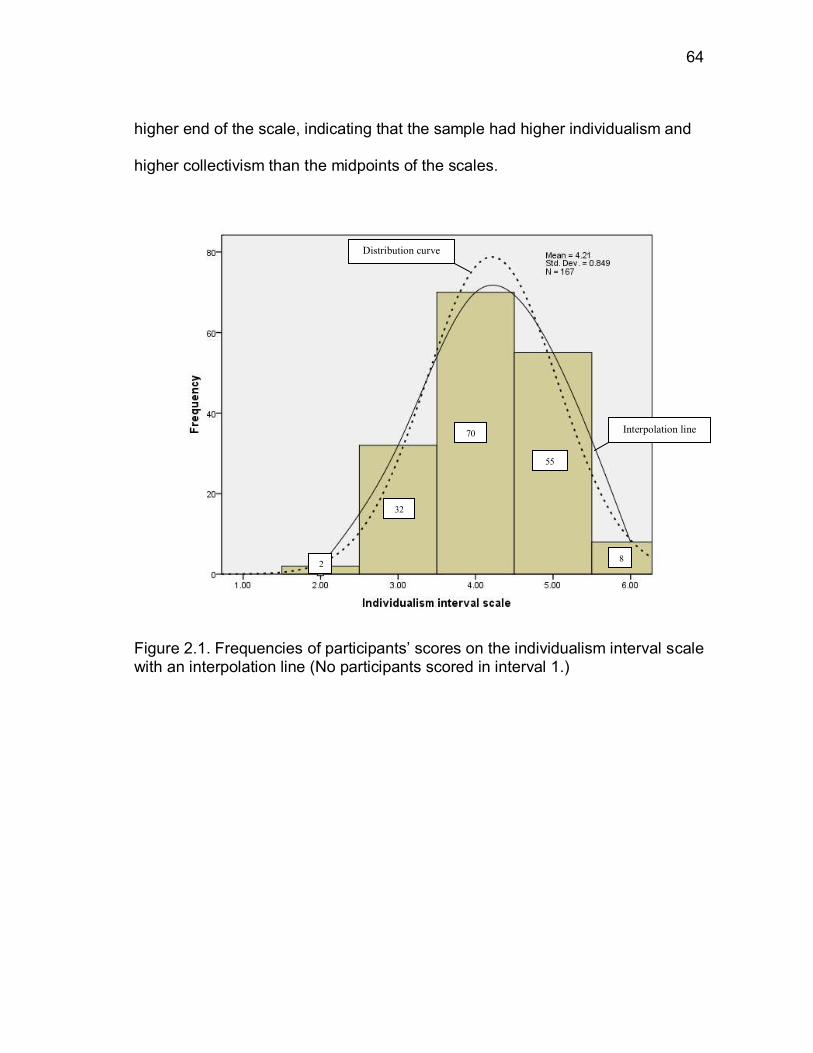
64
higher end of the scale, indicating that the sample had higher individualism and
higher collectivism than the midpoints of the scales.
Figure 2.1. Frequencies of participants‘ scores on the individualism interval scale with an interpolation line (No participants scored in interval 1.)
Interpolation line
Distribution curve
2
32
70
2
55
8
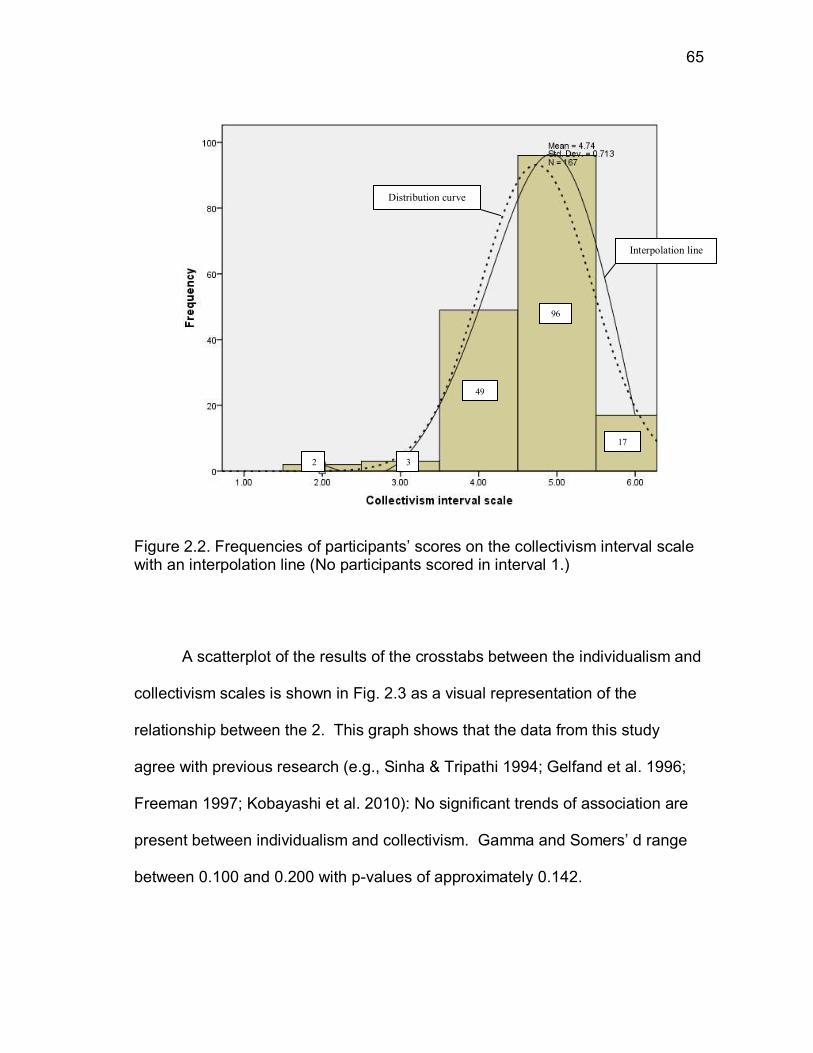
65
Figure 2.2. Frequencies of participants‘ scores on the collectivism interval scale with an interpolation line (No participants scored in interval 1.)
A scatterplot of the results of the crosstabs between the individualism and
collectivism scales is shown in Fig. 2.3 as a visual representation of the
relationship between the 2. This graph shows that the data from this study
agree with previous research (e.g., Sinha & Tripathi 1994; Gelfand et al. 1996;
Freeman 1997; Kobayashi et al. 2010): No significant trends of association are
present between individualism and collectivism. Gamma and Somers‘ d range
between 0.100 and 0.200 with p-values of approximately 0.142.
Distribution curve
Interpolation line
2 3
96
49
17
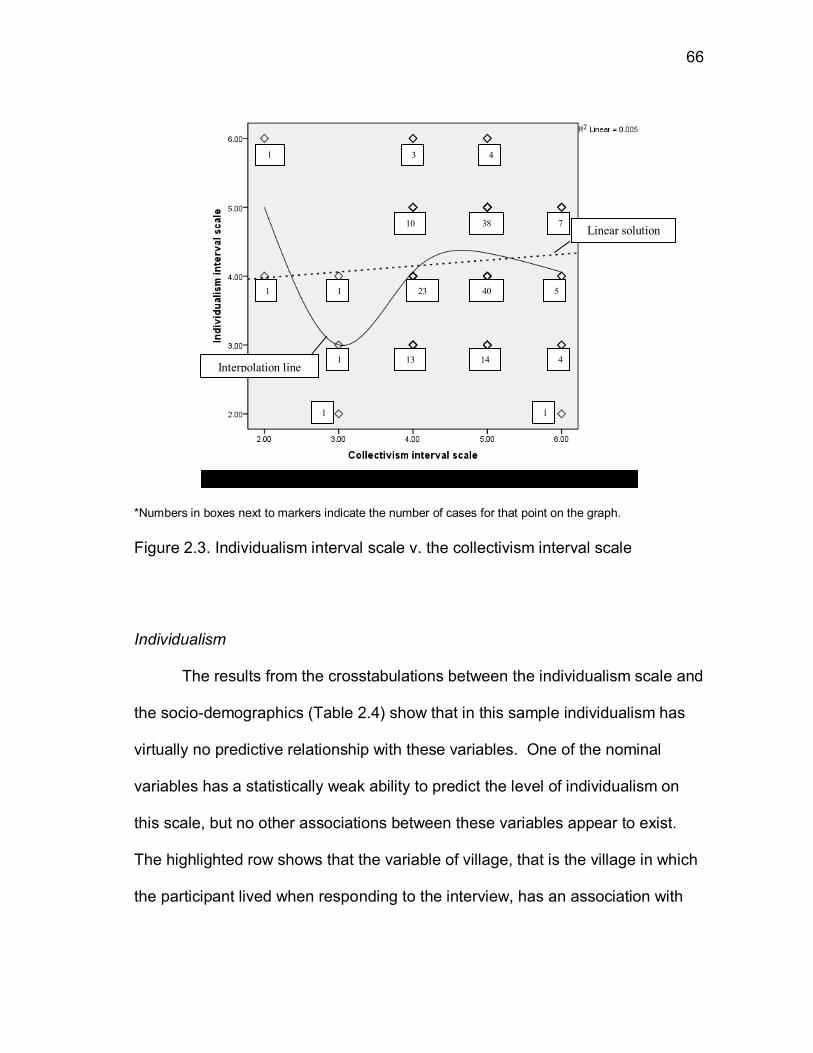
66
*Numbers in boxes next to markers indicate the number of cases for that point on the graph.
Figure 2.3. Individualism interval scale v. the collectivism interval scale
Individualism
The results from the crosstabulations between the individualism scale and
the socio-demographics (Table 2.4) show that in this sample individualism has
virtually no predictive relationship with these variables. One of the nominal
variables has a statistically weak ability to predict the level of individualism on
this scale, but no other associations between these variables appear to exist.
The highlighted row shows that the variable of village, that is the village in which
the participant lived when responding to the interview, has an association with
Interpolation line
Linear solution
1
*
1
1
1 1
1
3 4
10 38 7
14 4 13
23 40 5
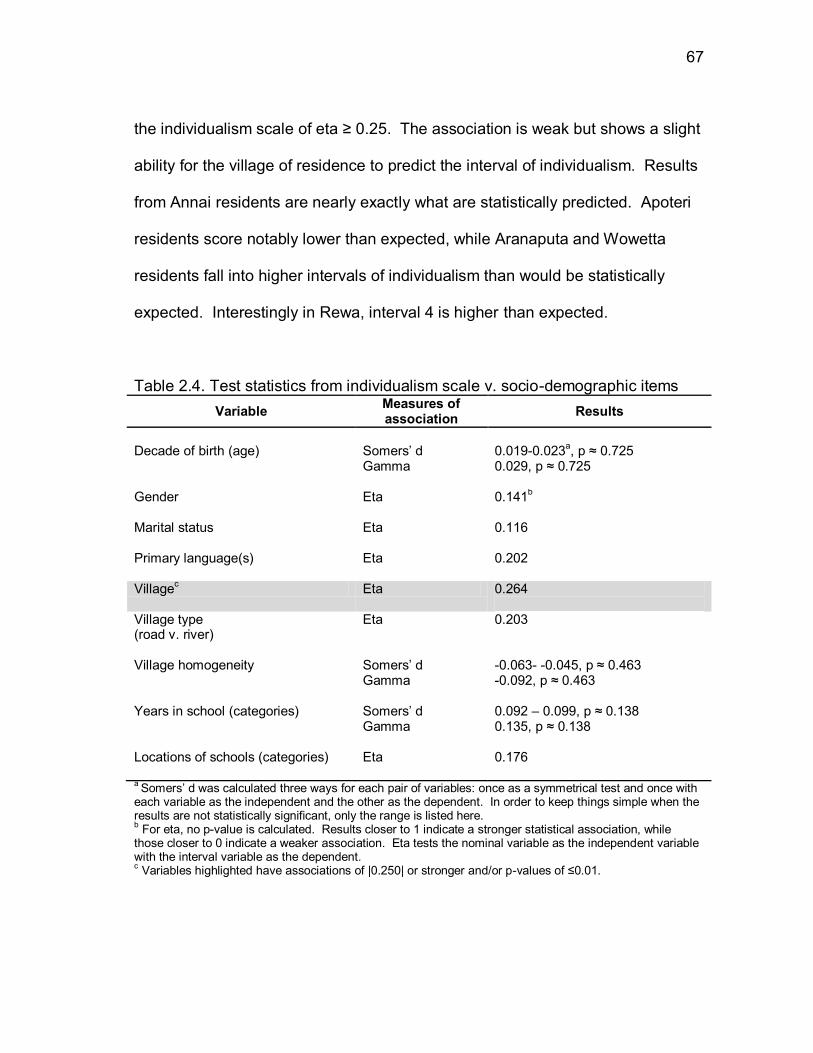
67
the individualism scale of eta ≥ 0.25. The association is weak but shows a slight
ability for the village of residence to predict the interval of individualism. Results
from Annai residents are nearly exactly what are statistically predicted. Apoteri
residents score notably lower than expected, while Aranaputa and Wowetta
residents fall into higher intervals of individualism than would be statistically
expected. Interestingly in Rewa, interval 4 is higher than expected.
Table 2.4. Test statistics from individualism scale v. socio-demographic items
Variable Measures of association
Results
Decade of birth (age) Somers‘ d
Gamma 0.019-0.023
a, p ≈ 0.725
0.029, p ≈ 0.725
Gender Eta 0.141b
Marital status Eta 0.116
Primary language(s) Eta 0.202
Village
c Eta 0.264
Village type (road v. river)
Eta 0.203
Village homogeneity Somers‘ d Gamma
-0.063- -0.045, p ≈ 0.463 -0.092, p ≈ 0.463
Years in school (categories) Somers‘ d Gamma
0.092 – 0.099, p ≈ 0.138 0.135, p ≈ 0.138
Locations of schools (categories) Eta 0.176
a Somers‘ d was calculated three ways for each pair of variables: once as a symmetrical test and once with
each variable as the independent and the other as the dependent. In order to keep things simple when the results are not statistically significant, only the range is listed here. b For eta, no p-value is calculated. Results closer to 1 indicate a stronger statistical association, while
those closer to 0 indicate a weaker association. Eta tests the nominal variable as the independent variable with the interval variable as the dependent. c Variables highlighted have associations of |0.250| or stronger and/or p-values of ≤0.01.
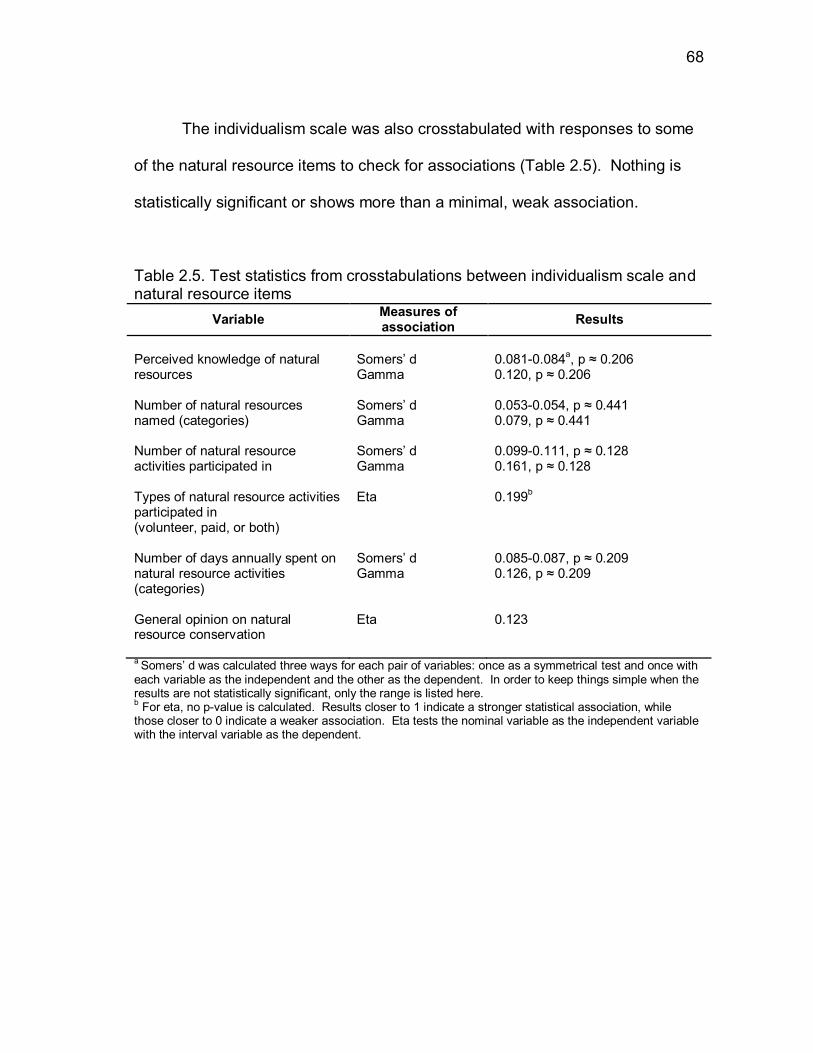
68
The individualism scale was also crosstabulated with responses to some
of the natural resource items to check for associations (Table 2.5). Nothing is
statistically significant or shows more than a minimal, weak association.
Table 2.5. Test statistics from crosstabulations between individualism scale and natural resource items
Variable Measures of association
Results
Perceived knowledge of natural resources
Somers‘ d Gamma
0.081-0.084a, p ≈ 0.206
0.120, p ≈ 0.206
Number of natural resources named (categories)
Somers‘ d Gamma
0.053-0.054, p ≈ 0.441 0.079, p ≈ 0.441
Number of natural resource activities participated in
Somers‘ d Gamma
0.099-0.111, p ≈ 0.128 0.161, p ≈ 0.128
Types of natural resource activities participated in (volunteer, paid, or both)
Eta 0.199b
Number of days annually spent on natural resource activities (categories)
Somers‘ d Gamma
0.085-0.087, p ≈ 0.209 0.126, p ≈ 0.209
General opinion on natural resource conservation
Eta 0.123
a Somers‘ d was calculated three ways for each pair of variables: once as a symmetrical test and once with
each variable as the independent and the other as the dependent. In order to keep things simple when the results are not statistically significant, only the range is listed here. b For eta, no p-value is calculated. Results closer to 1 indicate a stronger statistical association, while
those closer to 0 indicate a weaker association. Eta tests the nominal variable as the independent variable with the interval variable as the dependent.
69
Collectivism
The collectivism scale shows many more statistically significant
relationships to both the socio-demographic variables (Table 2.6) and the natural
resource data (Table 2.7) than the individualism scale. Highlighted rows show
associations in which the p-values are equal to or less than 0.01 or eta ≥ 0.25.
Table 2.6. Test statistics from crosstabulations between collectivism scale and socio-demographic items
Variable Measures of association
Results
Decade of birth Somers‘ d
Gamma 0.031-0.044
a, p ≈ 0.582
0.053, p ≈ 0.582
Gender Eta 0. 203
b
Marital status Eta 0.211
Primary language(s) Eta 0.036
Village Eta 0.225
Village type (road v. river)
Eta 0.161
Village homogeneity
Somers‘ d Gamma
-0.041 - -0.048, p ≈ 0.552 -0.083, p ≈ 0.552
Years in school (categories)c
Somers‘ d -collectivism as predictor -school as predictor
Gamma
0.335, p ≈ 0.000 0.261, p ≈ 0.000 0.449, p ≈ 0.000
Location of schools attended
Eta 0.411
a Somers‘ d was calculated three ways for each pair of variables: once as a symmetrical test and once with
each variable as the independent and the other as the dependent. In order to keep things simple when the results are not statistically significant, only the range is listed here. b For eta, no p-value is calculated. Results closer to 1 indicate a stronger statistical association, while
those closer to 0 indicate a weaker association. Eta tests the nominal variable as the independent variable with the interval variable as the dependent. c Variables highlighted have associations of |0.250| or stronger and/or p-values of ≤0.01.
70
Table 2.7. Test statistics from crosstabs between collectivism scale and natural resource items
Variable Measures of association
Results
Perceived knowledge of natural resources
a
Somers‘ d -collectivism as predictor -perception as predictor
Gamma
0.243, p ≈ 0.002 0.199, p ≈ 0.002 0.342, p ≈ 0.002
Number of natural resources named (categories)
Somers‘ d -collectivism as predictor -resources named as predictor
Gamma
0.425, p ≈ 0.000 0.351, p ≈ 0.000 0.591, p ≈ 0.000
Number of natural resource activities participated in
Somers‘ d -collectivism as predictor -activities as predictor
Gamma
0.255, p ≈ 0.000 0.243, p ≈ 0.000 0.414, p ≈ 0.000
Types of natural resource activities participated in (volunteer, paid or both)
Eta 0.285b
Number of days annually spent on natural resource activities (categories)
Somers‘ d -collectivism as predictor -days spent as predictor
Gamma
0.246, p ≈ 0.001 0.213, p ≈ 0.001 0.363, p ≈ 0.001
General opinion on natural resource conservation
Eta 0.167
a Variables highlighted have associations of |0.250| or stronger and/or p-values of ≤0.01.
b For eta, no p-value is calculated. Results closer to 1 indicate a stronger statistical association, while those
closer to 0 indicate a weaker association. Eta tests the nominal variable as the independent variable with the interval variable as the dependent.
71
Community Decision Making
A variable of interest that is neither socio-demographic nor specific to
natural resources is participants‘ knowledge of the decision-making process
within their communities. It is relevant to natural resource conservation,
because decisions in small communities such as these are often made in
community meetings by the residents present, and the decisions include those
about natural resource management. If residents do not understand the process
and realize their rights and power in it, they cannot exercise their power by
joining in decision making. So, participants were asked how decisions were
made in their communities to get an idea of their understanding of the process.
Undoubtedly, some people answered ‗I don‘t know‘ or similarly because it was
simpler and/or they were tired of the interview; this item was at the very end.
Even with this assumption, many responses that were incomplete or apparently
incorrect remain according to the process village council members described. In
fact, 65 made no mention of a community vote on such decisions, and 89 said
that the village council made the final decision, even if the village members
voted (overlap of participants was possible in those counts).
The association between the individualism scale and knowledge about
the process was eta = 0.140. Striking is that the participants who stated
decisions were made in some top-down way (e.g., by the elected village head,
the toshao; by a group of leaders such as the village council or the North
Rupununi District Development Board; or by an outside group such as
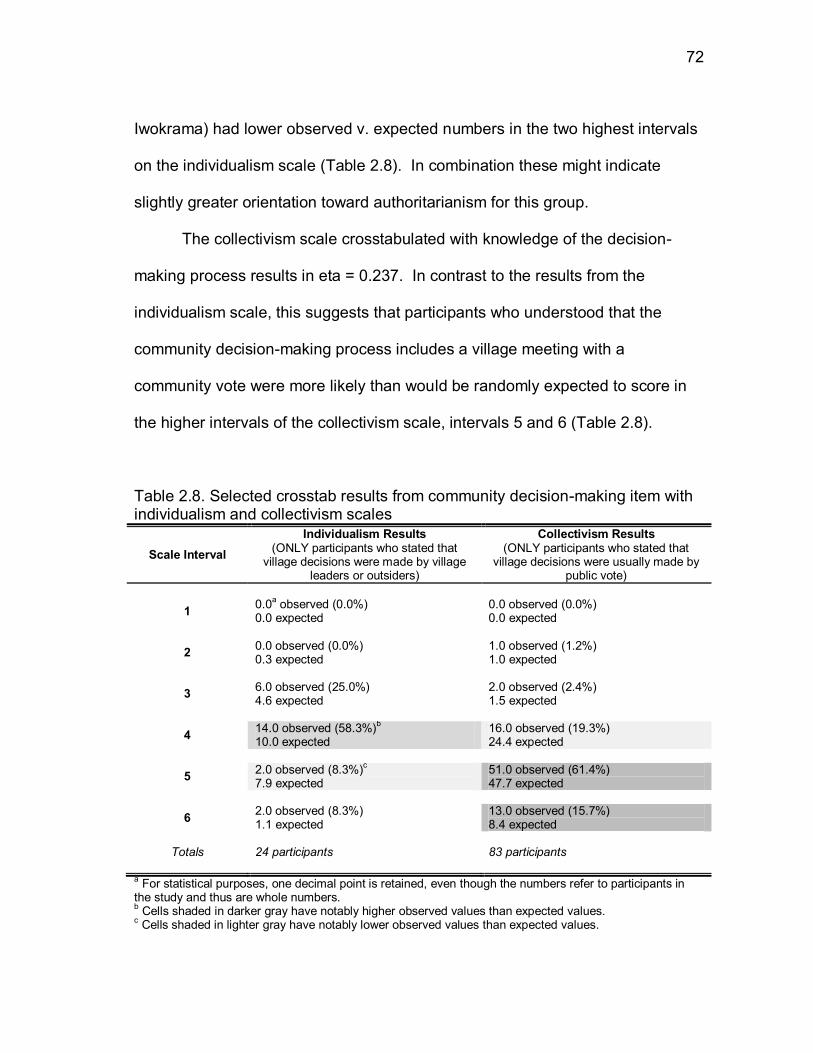
72
Iwokrama) had lower observed v. expected numbers in the two highest intervals
on the individualism scale (Table 2.8). In combination these might indicate
slightly greater orientation toward authoritarianism for this group.
The collectivism scale crosstabulated with knowledge of the decision-
making process results in eta = 0.237. In contrast to the results from the
individualism scale, this suggests that participants who understood that the
community decision-making process includes a village meeting with a
community vote were more likely than would be randomly expected to score in
the higher intervals of the collectivism scale, intervals 5 and 6 (Table 2.8).
Table 2.8. Selected crosstab results from community decision-making item with individualism and collectivism scales
Scale Interval
Individualism Results (ONLY participants who stated that
village decisions were made by village leaders or outsiders)
Collectivism Results (ONLY participants who stated that
village decisions were usually made by public vote)
1 0.0
a observed (0.0%)
0.0 expected 0.0 observed (0.0%) 0.0 expected
2 0.0 observed (0.0%) 0.3 expected
1.0 observed (1.2%) 1.0 expected
3 6.0 observed (25.0%) 4.6 expected
2.0 observed (2.4%) 1.5 expected
4 14.0 observed (58.3%)
b
10.0 expected 16.0 observed (19.3%) 24.4 expected
5 2.0 observed (8.3%)
c
7.9 expected 51.0 observed (61.4%) 47.7 expected
6 2.0 observed (8.3%) 1.1 expected
13.0 observed (15.7%) 8.4 expected
Totals 24 participants 83 participants
a For statistical purposes, one decimal point is retained, even though the numbers refer to participants in
the study and thus are whole numbers. b Cells shaded in darker gray have notably higher observed values than expected values.
c Cells shaded in lighter gray have notably lower observed values than expected values.
73
Socio-demographics v. Natural Resource Items
The results suggest that individualism, as measured by this scale, does
not have a statistically significant relationship with people‘s actions, perceptions,
or opinions regarding natural resources and conservation. In contrast, the
collectivism scale has some weak though statistically significant associations
with both socio-demographics and natural resource issues.
Individualism, as defined here and measured in this study, shows a weak
tendency to correlate with the ‗village‘ in which participants lived in at the time of
the study. In fact, eta indicates that this variable has a limited amount of
predictive power when it comes to the participant‘s level of individualism.
However, the individualism scale does not appear to have a statistically
significant association with any of the natural resource items. Thus, this
suggests that neither the socio-demographic variables nor individualism provide
any insight into relationships with natural resources and conservation or how to
work with values, perceptions, or behaviors to improve conservation.
The collectivism scale used in this study appears to give us more
information; a number of variables show statistically significant associations with
collectivism. Of the socio-demographic variables, ‗locations of schools‘ shows a
moderate ability to predict the interval level of collectivism (eta). Additionally,
Somers‘ d and gamma calculations show weak to moderate statistical evidence
that the longer participants attended school (‗years in school‘), the higher their
levels of collectivism tended to be.
74
The tests between the collectivism scale and the natural resource items
show even more associations. Five natural resource items evidenced an
association with collectivism, and 3 did not. The 3 that did not were opinions
about natural resource conservation; the definitions of conservation participants
chose for the communities; and the definitions of conservation participants
chose as their personal definitions, as measured by eta.
However, the remaining 5 natural resource items analyzed in this chapter
showed an association stronger with collectivism than would be randomly
expected. Four of the 5 relationships were tested using the measures for ordinal
variables v. ordinal variables, i.e., gamma and Somers‘ d. One variable, marked
below, was tested using eta because it is nominal. These natural resource items
are largely related to knowledge and actions; 3 of these variables are explicitly
related to engagement in natural resource conservation. These are the 5
variables:
▪ participants‘ self-assessment of their knowledge of natural resources
relative to others in their community [knowledge];
▪ the number of natural resources they were able to name (grouped into
categories by number) [natural resources named];
▪ the number of natural resource activities they participate in (grouped
into categories by number) [number of activities];
75
▪ the number of days annually they participate in natural resource
conservation activities (grouped into categories by number) [days spent
annually]; and
▪ the types of conservation activities in which they participate (volunteer,
paid, or both; association tested with eta) [type of activity].
Further exploring these associations shows that, in fact, ‗years in school‘
has a statistically significant association with the natural resource items. With 3
natural resource items, ‗years in school‘ has a stronger relationship with the
natural resource item than the collectivism scale has to the natural resource
item. In Table 2.9, the results of tests regarding these associations are shown.
For comparative purposes, the tests showing the associations between the
collectivism scale and the natural resource items are also included.
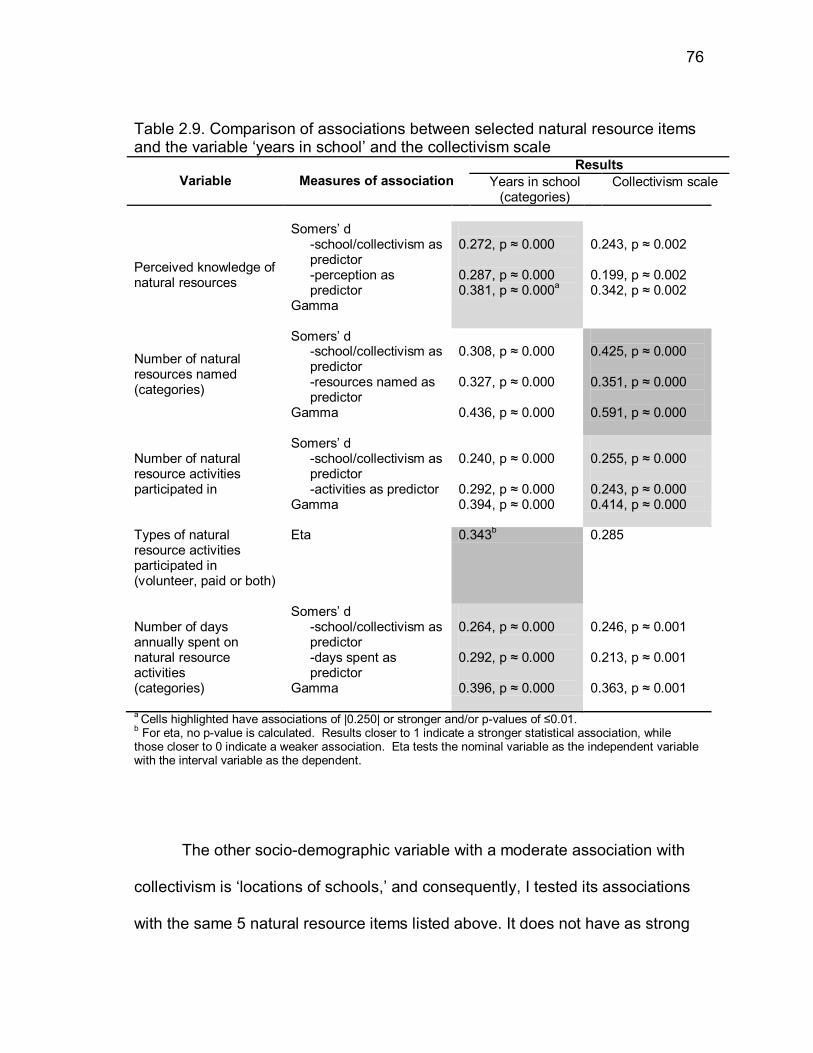
76
Table 2.9. Comparison of associations between selected natural resource items and the variable ‗years in school‘ and the collectivism scale
Variable Measures of association
Results
Years in school (categories)
Collectivism scale
Perceived knowledge of natural resources
Somers‘ d -school/collectivism as predictor -perception as predictor
Gamma
0.272, p ≈ 0.000 0.287, p ≈ 0.000 0.381, p ≈ 0.000
a
0.243, p ≈ 0.002 0.199, p ≈ 0.002 0.342, p ≈ 0.002
Number of natural resources named (categories)
Somers‘ d -school/collectivism as predictor -resources named as predictor
Gamma
0.308, p ≈ 0.000 0.327, p ≈ 0.000 0.436, p ≈ 0.000
0.425, p ≈ 0.000 0.351, p ≈ 0.000 0.591, p ≈ 0.000
Number of natural resource activities participated in
Somers‘ d -school/collectivism as predictor -activities as predictor
Gamma
0.240, p ≈ 0.000 0.292, p ≈ 0.000 0.394, p ≈ 0.000
0.255, p ≈ 0.000 0.243, p ≈ 0.000 0.414, p ≈ 0.000
Types of natural resource activities participated in (volunteer, paid or both)
Eta 0.343b
0.285
Number of days annually spent on natural resource activities (categories)
Somers‘ d -school/collectivism as predictor -days spent as predictor
Gamma
0.264, p ≈ 0.000 0.292, p ≈ 0.000 0.396, p ≈ 0.000
0.246, p ≈ 0.001 0.213, p ≈ 0.001 0.363, p ≈ 0.001
a Cells highlighted have associations of |0.250| or stronger and/or p-values of ≤0.01.
b For eta, no p-value is calculated. Results closer to 1 indicate a stronger statistical association, while
those closer to 0 indicate a weaker association. Eta tests the nominal variable as the independent variable with the interval variable as the dependent.
The other socio-demographic variable with a moderate association with
collectivism is ‗locations of schools,‘ and consequently, I tested its associations
with the same 5 natural resource items listed above. It does not have as strong
77
an association with the natural resource items as it does with collectivism. For
those tests, the associations were so weak that the eta results were all less than
0.200.
In one pair of variables, the ‗locations of schools‘ and the ‗types of
activities,‘ both are nominal, and thus lambda was the test statistic used. In
these data, the associations are not statistically significant: ‗Locations of schools‘
had very low predictive power for ‗types of activities‘ at only lambda = 0.105 (p ≈
0.057), though it was only marginally nonsignificant, and it was the strongest
association in the 3 lambda calculations run on the pair of variables.
The 2 socio-demographic variables ‗years in school‘ and ‗locations of
schools‘ appear to have very different relationships with the collectivism scale
and the natural resource items. As clear from the results obtained, the variable
‗locations of schools‘ does not seem to be related to the natural resource items
strongly, if at all. In contrast, ‗years in school‘ appears to be more closely
associated with some of the natural resource items than with the collectivism
scale.
When the crosstabs of the collectivism scale v. the natural resource items
are analyzed according to category of ‗years in school,‘ only one category shows
any results of statistical significance. In category 3 of ‗years in school,‘ defined
as 8 to 10 years of school and including the largest number of participants for a
single category in this variable (61), the results are statistically significant at the
level of p ≤ 0.01 for 2 natural resource items: ‗knowledge‘ (p ≈ 0.010; p-values
78
for the other categories were over 0.500) and ‗natural resources named,‘ (p ≈
0.000; p-values for the other categories were over 0.150).
Some of the ‗years in school‘ categories, as well as the ‗locations of
schools‘ categories, had only a few participants in them, which would affect a
test‘s ability to say anything of statistical significance. For example, a trend
cannot be easily recognized in a group of 3, or even 10, with 5 possible
collectivism interval levels (2 – 6) and 3 possible ‗types of activities‘ in which
they participate, i.e., 15 possible combinations. Therefore, in some cases trends
are difficult to identify based on the characteristics of the sample, including its
size.
Conclusions
In this study, individualism does not seem to have a relationship with the
natural resource items analyzed, whereas the data suggest that collectivism has
an association with at least some of them. The collectivism scale showed a
statistically significant weak to moderate ability to improve the prediction of both
the ‗natural resources named‘ as well as the ‗number of activities‘ people in the
study participated in.
The true nature of the relationships between the variables is unclear, but
one possibility is that a person‘s level of collectivism is related to her
participation in community activities. As a result of more overall participation,
she is more likely to participate in natural resource activities, as well as in others.
79
In doing so, she learns more about natural resources, enabling her to name
more of them when asked. When crosstabs were run for ‗natural resources
named‘ v. the ‗number of activities‘ participated in, gamma (symmetrical) was
0.436 and the Somers‘ d for ‗number of activities‘ predicting the ‗natural
resources named‘ was 0.308 as compared to 0.267 for the ‗natural resources
named‘ predicting the ‗number of activities‘ (p ≈ 0.000 for all). The association
between the ‗natural resources named‘ and collectivism demonstrated greater
predictive capability in both directions than did the relationships between either
the ‗natural resources named‘ and the ‗number of activities‘ or the ‗number of
activities‘ and collectivism, with the last being the weakest of the 3 relationships.
All were significant at the p ≈ 0.000 level, suggesting that the associations are
unlikely to occur if no relationship is present.
The varying strengths of the relationships suggest that the relationship
among the 3 variables is more complicated than collectivism increasing
participation which increases knowledge. Perhaps feedback between the
variables exists or other variables are also affecting the outcomes.
Relationships among attitudes, perceptions, values, and practical issues
such as convenience and time available are often very complex and compound.
In various situations, different values, etc., take priority (Triandis 1995), so the
complexity of the relationships should not come as a particular surprise.
‗Years in school‘ and the ‗natural resources named,‘ a proxy variable for
measureable knowledge as opposed to perceived knowledge, also have a
80
positive and statistically significant association. However, the association
between collectivism and ‗natural resources named‘ was higher in this sample.
The variable ‗years in school‘ showed an association with the collectivism
scale and directly with multiple natural resource items. The associations
between ‗years in school‘ and the natural resource items were higher than
between the collectivism scale and the same natural resource items for the
following variables: participants‘ perceived knowledge about natural resources
[knowledge]; the types of natural resource activities they participated in [types of
activities]; and the number of days they spent participating in natural resource
activities [days spent annually]. Perhaps having gone to school longer, they felt
more comfortable with the concept, more knowledgeable about natural
resources, and/or more comfortable answering the interview questions due to
their experiences in school.
The fewer ‗years in school,‘ the less likely the study participant was to
participate in natural resource activities. In contrast, the people who participated
in paid natural resource activities, either alone or in combination with volunteer
activities, had a significantly higher likelihood of falling in category 4 or 5 of the
years in school (the 2 highest categories). In addition, a similar though less
marked trend presents itself in the crosstabs between ‗years in school‘ and the
‗days spent annually‘ on natural resource activities. A connection between
‗years in school‘ and getting a paid position related to natural resources might
exist, raising the amount of time those people spend working with natural
81
resources while potentially raising their awareness of natural resource issues
and their likelihood to volunteer in addition to their paid activities.
This study provides some insight into relationships between core socio-
cultural values, socio-demographics, and natural resources in some primarily
indigenous communities in the North Rupununi, Guyana. In terms of the 2
hypotheses on which the study was based, outcomes are mixed. Levels of
individualism showed virtually no relationship to items exploring people‘s ideas,
opinion, knowledge, and behaviors relating to natural resources and
conservation. Statistical tests of the same natural resource items with
collectivism mostly measured associations of weak to moderate levels that were
too strong to assume they are the product of chance.
For conservation professionals, the main messages from this study are
that (1) high levels of individualism do not have to be detrimental for natural
resource conservation, and (2) collectivism seems to have a positive association
with natural resource knowledge and participation. In this sample, levels of both
individualism and collectivism were noticeably higher than the midpoints of both
scales, yet individualism showed very little influence on people‘s actions,
opinions, and beliefs regarding natural resources and conservation.
The associations shown between the natural resource items and
collectivism suggest that collectivism can be a useful tool in natural resource
conservation. If conservationists can nurture collectivism in socially, culturally,
and contextually appropriate ways, this might improve engagement in
82
conservation, regardless of initial levels of collectivism and participation in
natural resource conservation activities. While the relationships are not
statistically strong, they are significant, and even small improvements have the
potential to strengthen conservation outcomes.
Researchers have found evidence that both habit and past behavior can
play a central role in future behaviors. Behaviors that have become habit are
automated, so people perform them without conscious thought (Ouellette &
Wood 1998). In recycling, researchers have found evidence that people who
often recycle tend to recycle even when doing so is not easy or convenient,
whether they consider themselves in the habit of recycling or not (Knussen et al.
2004). Perhaps more importantly, past behavior—separate from perceived
habit—seems to correlate with intentions for future behavior. So, a person who
habitually does an activity is likely to continue doing it, under stable conditions,
as is a person who has regularly performed a behavior that is not considered a
habit (Knussen & Yule 2008). Weber (unpublished data) collected data
indicating that if someone neutral to recycling is required or expected to recycle
frequently, doing so can help create an internal feeling that recycling is good or
necessary and can lead that person to feel compelled to recycle and guilty if she
does not.
Triandis (2000a) states that one can temporarily increase an individual‘s
collectivism simply by asking the person to reflect on family members and
friends and consider what values, beliefs, likes, etc., the person shares with
83
them. Perhaps such a simple technique could be employed to encourage
people‘s immediate feelings of collectivism to promote participation in natural
resource activities. Then when people‘s collectivism is elevated, conservation
activities that are enjoyable and require minimal investment of time and other
resources can be available. Once people are involved, the cycle might sustain
itself with some assistance. This is certainly an avenue worth exploration.
Limitations of Study
As with any study, this one has its limitations. First and foremost, the
participants answered the questions directly to the researcher, which increases
the chances of ‗socially desirable responding‘ (Paulhus 1991). If participants
have a tendency to want to please the researcher with their responses, issues
such as the following could come up: Participants could assume the researcher
wants to hear positive responses for their opinions regarding natural resource
conservation, and for self-reported participation in conservation activities, the
data might be somewhat inflated. On the other hand, some cultures tend to
prefer to answer either toward one extreme or the other, or they hover around
the middle, regardless of their true feelings (Smith 2004). Correcting for
response issues can be problematic because knowing what the participants see
as socially acceptable for each question and what they believe the researcher
wants to hear is extremely difficult. Statistical methods are available to do this
(see Smith 2004). In this sample, however, no consistent bias was evident;
84
responses for many, if not most, items varied across the spectrum of choices.
Participants did not appear to systematically prefer certain choices or shy away
from others.
The construction of the indices and scales for individualism and
collectivism are key to the results. If different items were included in the indices
that would almost certainly influence the outcome. If the intervals on the scales
were defined differently, that would definitely influence the results: Larger
intervals could have larger groups per interval, whereas smaller intervals would
necessarily have at least some groups that are smaller. Additionally, the
conversion of continuous data to an ordinal interval variable results in the loss of
information to facilitate analysis. Associations or strengths of associations could
be influenced by such changes.
A related issue is defining ‗individualism‘ and ‗collectivism.‘ As discussed
earlier, some researchers treat individualism and collectivism as opposite ends
of a single continuum (e.g., Triandis 1995; Celinska 2007). Some research
indicates that they are entirely separate continua (e.g., Gelfand et al. 1996;
Freeman 1997; Kobayashi et al. 2010). This distinction is crucial because if the
researcher defines the two as opposite ends of one continuum, then the items
and index will be constructed such that they are measured as the opposites they
are defined to be. One end would be equated with high individualism and the
other end with high collectivism, and indeed, they would be mutually exclusive
per definition, leading to very different results than those here.
85
Several practical and logistical limitations also existed. The limitation of
not being able to conduct any interviews in Makushi, the primary indigenous
language in the area, needs to be reiterated. According to my guides, no one
refused to be interviewed on grounds of insufficient English skills; however, I
was unable to interview anyone who did not speak English reasonably well. The
lack of electricity meant that all interviews had to be conducted during daylight
hours. Transportation was another major limitation. Because 2 of the villages
required boat transportation, if I missed a person or group of people in those
villages, I was not always able to make a second attempt. These communities
are quite small, ranging from approximately 200 to 600 residents, and any or all
of the issues discussed here could markedly skew the data. Though the sample
was stratified by age groups and gender, bias(es) is almost certainly present in
the sample and the data.
Further Research
The potential for further research is extensive. The priority is conducting
parallel studies in different locations. Such data would yield useful information
for cross-cultural comparisons, allowing analysis of the patterns of association
among locations and groups. Further investigation of the causes of differences
and similarities would also be possible. The results of additional studies would
supplement this research, potentially leading to a more accurate and useful
theory. With additional data and analyses, the possibility of accounting for more
86
of the variation and variables and drawing more conclusions about the
relationships between individualism and collectivism and natural resource issues
improves.
With samples from other groups, procedures such as factor analysis
could be conducted to determine more accurately which individualism and
collectivism items are most valuable in differentiating socio-cultural groups as
useful in the context of natural resources and conservation. Additional research
could also yield information about relationships with opinions and attitudes about
natural resources and conservation, which in this study were found to have no
association.
Relationships among variables such as moderation and mediation (see
Baron & Kenny 1986 for a discussion of the two terms) could be explored more
with more data and a larger total sample. Understanding indirect linkages such
as these can be the key to understanding relationships between social and
psychological variables and behavior (Baron & Kenny 1986).
In natural resource conservation, people‘s behaviors are of paramount
importance. Some evidence suggests that beliefs, values, and attitudes are
connected to behavior, but that often numerous factors influence a person‘s
action in a particular situation (Triandis 1995). People‘s actions are how they
treat and use natural resources, and consequently, they determine the state of
those resources. By better understanding what influences a person‘s behavior
87
over the long term as well as in various circumstances, conservationists can
work better with people and communities for improved conservation results.
This study is a step toward better understanding relationships among
values, beliefs, attitudes, and behavior in the context of conservation and
specifically in remote areas with largely indigenous populations. The knowledge
generated from this research has the potential to increase conservation success
significantly.
88
CHAPTER III
LANGUAGE, PERCEIVED KNOWLEDGE AND LOCUS OF CONTROL IN
NATURAL RESOURCE CONSERVATION
Introduction
In 2008 the Canadian company Groundstar Resources went to Guyana to
negotiate for natural gas and oil exploration and drilling rights in the North
Rupununi. Representatives of the company visited the region repeatedly,
discussing information and offers with the community representatives in the
North Rupununi District Development Board. Subsequently, the toshaos
(elected village heads) returned to their villages to share and discuss the options
with residents.
I attended one such village meeting. The community wanted jobs as well
as other tangible benefits, such as reliable road access to the rest of the region,
in addition to river access. The villagers present were extremely hopeful that the
explorations close to their village would prove successful, so that they would
have extended financial and other material benefits.
The risk that the expected benefits might not come to fruition or the
chance of outright negative consequences was not raised by anyone, including
the toshao. No one voiced the possibility that villagers might not have the
necessary skills for many of the jobs or that the problem with a road to the
village had always been maintenance during the rainy season. Additionally,
89
because they were convinced they would get most of the jobs created, the idea
that workers would be brought into the area—and be likely to influence their
community in ways that an evangelical Christian community such as theirs,
Christian Brethren, might not like—did not enter their discussion.
The exploration site was just a couple of kilometers from their village,
near a place that villagers sometimes use for hunting and not far from many of
their farms. Many issues were not addressed: the massive equipment that
would be carted down the river and then through their forest; the waste and
potential pollution the project and workers would generate; the potential for
geological damage when drilling; the trees, particularly enormous old-growth
trees, that would necessarily be felled or damaged; the wildlife that would
abandon the area; the resources the workers would use such as game, fish,
plants, and saplings.
This meeting highlighted several issues within the communities of the
North Rupununi and likely in other indigenous communities. Residents are often
intensely focused on jobs, money, and other material gains, quite possibly to the
detriment of other parts of life. This is largely a consequence of limited local
opportunities for improving their lives. People want to make better lives for
themselves and their families. The health and sustainability of natural resources
often take a backseat to perceived material improvements, even when the
resources have a direct and clear connection to people‘s survival, as in this
case. This community has a vested interest not only in preserving natural
90
resources for consumptive uses such as building canoes and houses but also
for non-consumptive purposes such as wildlife viewing: The village has an
ecotourism lodge.
This village meeting illustrates what conservationists are often referring to
when they say that natural resource conservation and community development
are incompatible. They maintain that increased participation by locals can lead
to decisions that conflict with conservation goals (McClosky 1999; Oates 1999).
They argue that, at a minimum, the development goals weaken support of
conservation goals (Wilshusen et al. 2002) because when residents‘ priorities
are so focused on material gains, they will not be willing to conserve instead of
consume resources. Consequently, residents belonging to indigenous and
traditional peoples are often perceived as less worthy than Western-trained
conservationists because their priorities and worldviews differ from
conservationists‘. Situations like the meeting described above are used as
evidence to promote ―exclusionary conservation‖ (Dowie 2009:12).
Conservationists have argued that when natural resource conservation is
combined with development, neither species nor their habitats are protected
(e.g., Brandon et al. 1998; Terborgh 1999).
Other conservationists maintain that residents must be included in every
stage of conservation planning (West & Brockington 2006). Precisely because
the residents are so essential to the success of conservation and because the
conservation is often so essential to the residents‘ survival, they must be
91
included from the very earliest stage. This ensures that their views and needs
shape the process and project so they are invested in the project and can
actively collaborate toward its success.
In fact, this debate in natural resource conservation surrounding how or
even whether to include local residents in conservation planning and decision
making has clearly created a rift in the world of professional conservation. The
issue is so fundamental that conservation anthropologist Mac Chapin decided to
open a public debate on the subject by publishing an extensive essay in the
professional conservation publication, World Watch (Chapin 2004). His purpose
was clear in the title, ―A Challenge to Conservationists.‖
Seven years later this debate is still active in the conservation community.
In fact, the March 2011 issue of Biological Conservation focuses on what it
terms ―The New Conservation Debate: Beyond Parks vs. People,‖ which the
issue‘s editors describe as ―a wider disagreement about the proper value and
ethical foundations of biological conservation in the age of sustainability, as well
as the wisdom and consequences of making complex trade-offs among rivalrous
conservation goals in practice‖ (Minteer & Miller 2011:945).
Natural resources are very high stakes for everyone for reasons ranging
from basic subsistence and survival to spiritual matters and medical advances
(MEA 2005). One of the hardest aspects of conservation is determining how to
go about it when people are using the resources in question.
92
Starting in the late 1800‘s, the primary conservation model was strictly
protected areas that were off limits to human use. However, since the 1970‘s
natural resource conservationists have been looking for ways to productively
include local residents, especially indigenous and traditional peoples, in
conservation in order to improve conservation effectiveness. The biology of
conservation is very complex and many unknowns remain. Similarly, the needs,
psychology, and circumstances of people are also exceedingly complicated. To
try to factor both of these multifaceted components into conservation in
meaningful ways is a daunting task. However, conservation that does not
account for human issues has not been especially successful (e.g., Wyckoff-
Baird 2000; Alphandery & Fortier 2001; Bergen & Carr 2003).
Problem Statement
Indigenous peoples inhabit or at least use much of the world‘s areas
assessed as conservation priorities (Ovieda et al. 2000; Chapin 2004) and are
more directly dependent on ecosystem services for their livelihoods, so they are
more likely to be harmed by degradation of ecosystems (MEA 2005).
Consequently, both conservation and development issues often come together
in these locations, and conflict can result.
The overarching question is how to resolve such conflicts to promote
higher wellbeing for all. In order for conservation to be truly successful, people‘s
needs and goals must be addressed appropriately and in collaboration with
93
them, meaning ―a mutually beneficial relationship between two or more parties
who work toward common goals by sharing responsibility, authority, and
accountability for achieving results‖ (WWF 2010:3.2). In order to facilitate
collaboration in natural resources, understanding what factors support
collaboration is vital.
A multitude of factors come together to determine how people decide how
to act and their subsequent behaviors, and numerous frameworks have been
developed to explain decisions and behaviors, e.g., the theory of reasoned
action (Fishbein 1980) and the theory of planned behavior (Ajzen 1991). So
many needs, values, beliefs, perceptions, goals, etc., bring pressure to bear on
us and our actions. This is true in resource management as well as other in
aspects of our lives. Situational priorities can also change the relative
importance of these factors at any given moment (Triandis 1995).
Research suggests that people need to feel some control and that having
choices they perceive as positive supports this need (Ryan & Deci 2006; Leotti
et al. 2010). The present study investigates how internal and external locus of
control are related to natural resource issues. The primary hypothesis of this
chapter is that people with a more internal locus of control will be more likely to
report engaging in conservation behaviors (activities) than those who have a
more external locus of control.
This chapter examines the relationships between locus of control and
other factors such as knowledge, participation, and socio-demographics in the
94
context of natural resources and conservation. By better understanding how
fundamental perceptions of the world and one‘s power in it relate to natural
resource conservation, the design and implementation of conservation can
foster collaboration, improving conservation success.
Research Significance
Research concerning socio-cultural issues in indigenous communities as
they relate to natural resources and conservation has most often been a
posteriori assessments of why a project failed to perform as planned (e.g.,
Barnes et al. 2011).
In contrast, this chapter presents a study designed to focus on the
relationships between perception of locus of control and natural resource and
conservation issues within a mostly indigenous population in the North Rupununi
of Guyana. Thus, it adds a new dimension to the scholarship to date. It also
serves to stimulate conservation professionals and others to examine the values
and perceptions of the people with whom they work at a more fundamental level
in order to get a deeper understanding of how their values and perceptions
relate to their choices and behaviors regarding natural resources. This study is
only a step in developing a more complete understanding of these very complex
relationships in indigenous contexts.
So many attempts to conserve natural resources are made in indigenous
contexts. The differences between circumstances—cultural, physical, linguistic,
95
economic, and otherwise—are overwhelming. Understanding one situation
does not necessarily lead to greater understanding of another, which
complicates an already complex state of affairs. The complexity and specificity
of conservation in general coupled with indigenous contexts emphasize the need
to better understand the underlying connections and processes people have in
common in order to foster pro-conservation behaviors. Do trends and patterns
cross cultural groups? To work toward this goal, as many data as possible need
to be collected, particularly in indigenous communities since little fitting this
description is available so far. By doing so, a body of data and information that
have the potential to engender greater conservation success in tandem with
communities‘ goals and socio-cultural characteristics is created.
Central Concepts
Locus of Control & Choice
One key factor in people‘s decisions and actions is locus of control, i.e.,
whether we believe control of something is internal to us or external to us (Rotter
1966). When we perceive that we have control and can change or at least
influence an outcome, our actions might well be different than when believe our
behaviors have no effect on the outcome. In our lives, we have a general locus
of control as well as specific dimensions that relate to different areas of our lives.
For example, a person might have a more internal locus of control and feel
powerful in household affairs but feel that in religious matters or in job-related
96
situations the locus of control is external (Wang et al. 2010). By extension,
people also have a locus of control relating to the natural world and resources.
Locus of control leads to perceived choice. In fact, research indicates
that humans have a need to feel they are in control of their surroundings (Ryan
& Deci 2006). This perception of control seems to promote a feeling of self-
efficacy, which in turn fosters overall wellbeing (Leotti et al. 2010). Interestingly,
scholarship shows that merely having a choice, any choice, gives people a
sense of greater control (Leotti et al. 2010) as well as an increased sense of
confidence and success (Henry & Sniezek 1993; Tafarodi et al. 1999) and
seems to lead to better success in most undertakings (Cordova & Lepper 1996).
People do not have to exercise control nor even necessarily actually have
control; they can benefit simply from the perception thereof (Thompson 1981).
Work with young children shows that this sort of preference for personal
autonomy is biologically present across cultures (Helwig 2006) and from very
early ages, if not birth (Kochanska & Aksan 2004). Variations of perceived
control and desire for control seem to be modified according to individual
experiences (Mineka & Henderson 1985), and Leotti et al. (2010) suggest that
positive and negative reinforcements also encourage actions in keeping with
societal values. However, the power to make choices in situations where it is
appropriate for a given society or culture appears to cultivate a healthy sense of
self-efficacy across cultures (Henry & Sniezek 1993; Tafarodi et al. 1999). The
existence of choice coupled with exercising control helps fulfill a basic
97
psychological need that some researchers argue could be essential to human
survival and success (Leotti et al. 2010). Additionally, when stressors are
present, the perception that people can control them reduces reactions such as
learned helplessness and the release of stress hormones (Bandura et al. 1985;
Maier et al. 1985; Mineka & Henderson 1985).
Conversely, restriction or removal of choice is detrimental to humans as
well as other animals. Numerous negative responses have been observed
when people perceive situations as externally controlled, particularly if they had
more personal control previously (Sullivan & Lewis 2003; Crombez et al. 2008;
Leotti et al. 2010). Findings such as these make the negative outcomes of
perceived external locus of control with limited choice clear: If people perceive
an external locus of control or a lack of choices in a situation, they are likely to
respond with stress, including increased fear and more negative perceptions of
the response trigger (Leotti et al. 2010).
In natural resource conservation, sometimes all the options appear
unattractive: a poor choice and an even worse one. At times this is simply a
result of presentation, but sometimes the choices seem truly bad. In either case,
the negative perception signals a lack of control to the people involved. The
perceived lack of control induces stress and negative reactions. If the response
trigger is a conservation project or conservation professionals, then the
consequences may be seriously detrimental for conservation. People may
choose not to collaborate or even cooperate on any level.
98
Knowledge
‗Knowledge‘ is often a major factor in our choices, and it is a slippery and
subjective concept, largely because what we ‗know‘ involves interpreting various
data and input as well as gauging the sources of these. As new information
becomes available or a new perspective occurs to us, our interpretations and
consequently our ‗knowledge‘ can change. On the basis of what we each
perceive as convincing evidence, the ‗truth‘ can be different for different people.
Some research shows that the accuracy of information as ‗knowledge‘
makes little difference, rather how knowledgeable one thinks one is or the
person‘s belief in the information is in fact much more important to people‘s
decisions (e.g., Ajzen 2009). If we believe what we ‗know‘ is true even when it is
incorrect, we are unlikely to realize the problem with our interpretation of
information or our perceptions of it. This shows the central role perceived
knowledge plays in our decisions. Of course, much ‗knowledge‘ is more about
how we view the world and interpret relationships rather than factual information
that can be verified, which complicates things even more.
Sometimes our ‗knowledge‘ is based on misunderstood information. In
such a case, what we perceive to ‗know‘ and be ‗true‘ may not be rooted in data
or evidence of any kind. For example, if a doctor encourages patients to
conduct self-exams, patients who believe that they will be able to tell if
abnormalities are cancerous might be more likely to perform the exam regularly.
Though the information underlying the action is incorrect, the perceived
99
knowledge encourages action (Ajzen 2009). This shows how ‗perceived
knowledge‘ can be more important than ‗accurate knowledge‘ in encouraging a
behavior; in this case the behavior is desirable.
In natural resources, perceived knowledge can also play a critical role.
Some research shows that accurate knowledge is a better predictor of the
intention to take action as represented by the intention to vote on referenda on
global warming and climate change issues (Bord et al. 2000). But the key in this
study seems to be that in order to take effective action to keep human-induced
climate change in check, knowledge of the actual causes must be known.
Otherwise, people are unable to make choices that support their goals (Bord et
al. 2000). Of course, if the information and perceived knowledge people have
do not lead to useful action, then even having abundant access and feeling
comfortable and competent with it will not support the natural environment or
conservation.
In contrast, in societies such as the North Rupununi, in which people farm
much of their own food, personally collect the materials to build their homes and
boats, haul water to their homes, and so on, the raw natural resources have a
much more overt and concrete connection to their survival. Individuals tend to
have fairly extensive personal knowledge of nature and resources, even if they
are less conscious of this. Such a visible relationship is missing in many
industrialized and service-based societies. Consequently, the relationship
people experience with natural resources is likely to be quite different than in the
100
more removed relationship in which many people do not consider the source or
processing of the resources they use, e.g., when food comes from the grocery
store and water comes out of a pipe in their kitchens, much less what raw
materials go into items and services such as transportation.
Language and terminology comprise a key component of perceived
knowledge. In making home visits to introduce myself and my project, I
explained that the project was about natural resources and culture, people‘s
values. One older woman said that she did not know anything about natural
resources, implying that she was not a good person to interview because she
had nothing to contribute. I explained that even if she did not know anything
about natural resources, that information would help me better understand the
community. After this conversation, I added an item to the interview protocol
asking people how much they felt they knew about natural resources compared
to others in their community. More interestingly, when I returned to interview this
woman, she in fact responded that she knew ―nothing‖ about natural resources.
Before proceeding, I provided a quick explanation of the term ‗natural resources‘
and gave a few examples such as palm trees that provide fruit and thatch for
homes. She was clearly surprised to hear these were natural resources, and
she exclaimed that in that case she did know what they were. She then
answered many of the remaining natural resource items with thoughtful,
reasonably well-informed answers.
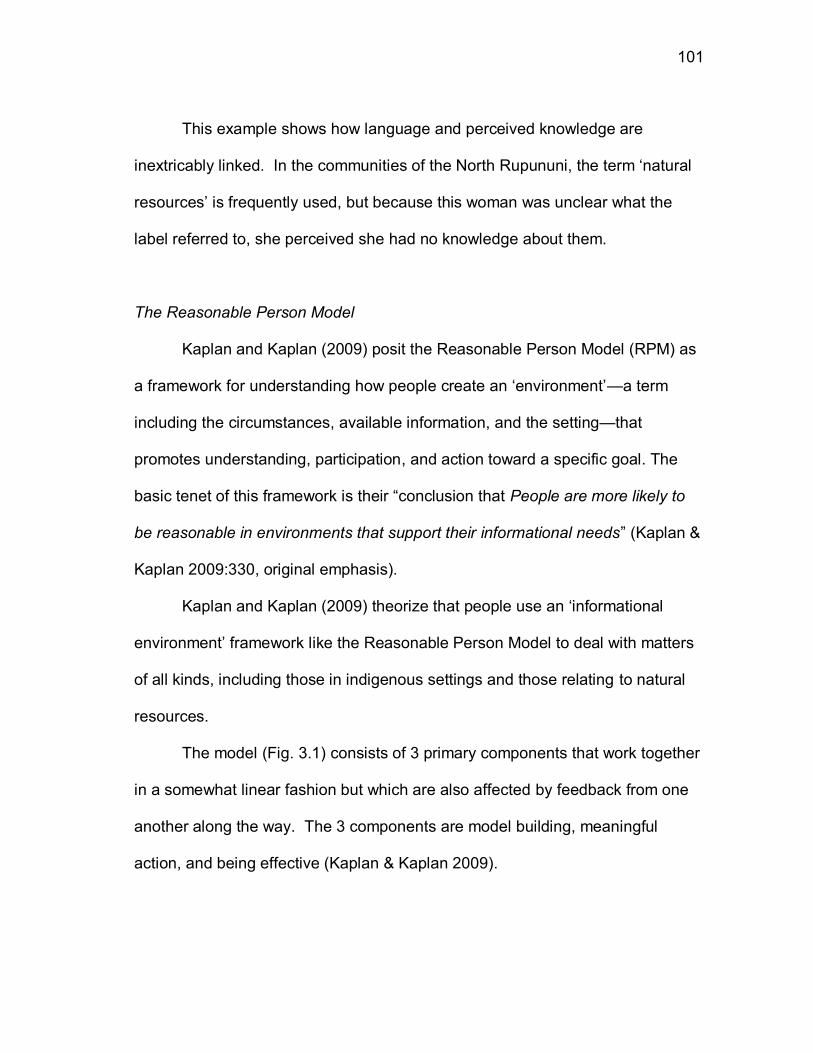
101
This example shows how language and perceived knowledge are
inextricably linked. In the communities of the North Rupununi, the term ‗natural
resources‘ is frequently used, but because this woman was unclear what the
label referred to, she perceived she had no knowledge about them.
The Reasonable Person Model
Kaplan and Kaplan (2009) posit the Reasonable Person Model (RPM) as
a framework for understanding how people create an ‗environment‘—a term
including the circumstances, available information, and the setting—that
promotes understanding, participation, and action toward a specific goal. The
basic tenet of this framework is their ―conclusion that People are more likely to
be reasonable in environments that support their informational needs‖ (Kaplan &
Kaplan 2009:330, original emphasis).
Kaplan and Kaplan (2009) theorize that people use an ‗informational
environment‘ framework like the Reasonable Person Model to deal with matters
of all kinds, including those in indigenous settings and those relating to natural
resources.
The model (Fig. 3.1) consists of 3 primary components that work together
in a somewhat linear fashion but which are also affected by feedback from one
another along the way. The 3 components are model building, meaningful
action, and being effective (Kaplan & Kaplan 2009).
102
Figure 3.1 Original diagram from Kaplan & Kaplan (2009:330) depicting the relationships between the components of the Reasonable Person Model (reprinted with permission)
Model building focuses on the mental frameworks people use to organize
and understand information with which they are presented. Kaplan and Kaplan
(2009) explain that for information, topics, and situations, people create a
cognitive map that helps organize the data in a way that allows for exploration of
new things while promoting further understanding. This map also helps
minimize confusion and file the data such that they can be retrieved with relative
ease (Kaplan & Kaplan 2009).
Meaningful action revolves around people‘s need to feel we are making a
difference: People need to actively cooperate with others toward a common
goal. The core of this component is participation. Participation can be active,
but it also encompasses people‘s need to feel they have a voice and are being
heard as well as respected. If any aspect of this need to participate is impeded,
the consequences can be negative, including frustration, demoralization, and in
extreme cases even violence (Kaplan & Kaplan 2009).
Model
Building
Being
Effective
Meaningful
Action
103
Being effective concentrates on achieving ‗clear-headedness‘ (Kaplan &
Kaplan 2009). This involves boosting a person‘s self-confidence and sense of
competence, which in turn improves one‘s ability to understand information and
take the next step to transform the information into effective action. Two
important facets of being able to do this are having the practical skills to do so
and, equally important, being able to grasp the bigger picture. The ‗bigger
picture‘ is key to mentally exploring the possible results of different choices. In
the end, the more competent a person feels, the more confident she or he feels
about being able to effectively meet the challenges a situation presents (Kaplan
& Kaplan 2009).
As people react to each component and change, feedback from one
component influences the others. Here are a few examples. Our intense
aversion to being confused leads us to build mental models to minimize
confusion. These models help reduce confusion by satisfying our need to
explore possibilities by predicting potential outcomes and consequences of our
decisions and actions. Mental models allow us to develop a bigger picture—
even more than one for the same situation—and intellectually experiment with
what might happen if we choose X versus Y or Z. We can compare the
possible, even probable, results from various decisions to see which scenario
we prefer, and then decide and act accordingly.
The Reasonable Person Model can play a key role in managing and more
importantly conserving natural resources more effectively. It affords a means to
104
create a situation in which participants perceive a more internal locus of control
in managing natural resources. People‘s power stems from the ability to
influence outcomes via knowledge that supports making informed, competent
decisions and the control to choose from viable options. Perceived knowledge
and an internal locus of control are critical to promoting the positive situational
and informational environment that encourages successful conservation
planning and implementation. Without them, participants are less likely to stay
involved or feel effective (Robson et al. 2010).
Undoubtedly, locus of control, perceived choice, and perceived
knowledge can have an immense effect on outcomes in natural resource
conservation. By increasing all three, people develop the tools to build more
useful mental models, to work toward effective solutions with others, and to
cooperate with others in meaningful action (Kaplan & Kaplan 2009) in situations
relating to natural resource issues. In order for conservation to succeed, natural
resource professionals must create a situation in which all participants feel
comfortable, informed, clear, respected, listened to, confident, competent, and
empowered in natural resource matters. The Reasonable Person Model
provides a framework to connect the parties, their perspectives and perceptions,
and the information available in such a way that can create cooperation and
consequent action toward common goals. This combination helps people
improve their skills, and they are more likely to feel satisfied because their
105
psychological resources are being respectfully employed, which fulfills basic
human psychological needs (Kaplan & Kaplan 2009).
By using the Reasonable Person Model as a framework for building
understanding of the situation and one another, conservationists, indigenous
residents, and other stakeholders can minimize the perceived divergence
between conservation and development goals. This framework together with
special attention to certain aspects of human psychology can advance
collaboration toward solutions that bridge the conflict dividing the conservation
community.
Study Site: North Rupununi, Guyana
Data were collected in 5 villages in the North Rupununi area of Guyana.
The North Rupununi is located in the center south of the country and includes 16
villages. The villages vary in population from about 200 to 600 residents, and
access to and from them differs: Some have airstrips, some are primarily
accessible by boat, and others are relatively easy to get to by road. A few can
be reached by more than one route. The major roadway through the area is the
International Highway, which runs from Georgetown to the Brazilian border at
Lethem. The International Highway is virtually the only road from the coast
south into the interior of the country and is dirt from around Linden all the way to
Brazil, a distance of several hundred kilometers (see Fig. 1.1 for map).
106
Most people in the North Rupununi provide for their food needs with
produce from their small family farms, whether or not they work for wages. Of
167 people interviewed, 152 have farms, and of those, 145 said their farms were
their most important source of food.
The availability of local wage work is extremely limited; therefore, most
families have very limited cash. Even those who do work for wages do not earn
large incomes. For example, fully trained primary school teachers in the North
Rupununi earned the equivalent of approximately US$200 per month in 2008
(Judith Moses, personal communication). Because of the economic situation in
the area, a significant number of residents leave the region for long periods or
even on a more permanent basis to work, mostly in more urban areas of Guyana
and Brazil or in mining camps around the country. In Apoteri, one of the river
villages, I was unable to find any men born in the 1970‘s to interview. After
asking almost everyone I met there and even checking the village‘s quarterly
resident roster, I could find only one: He was temporarily back from a job in the
mines.
People are relatively mobile, and moving from one village to another or
even to a place outside the region is fairly common. Thus, many people have
lived in multiple villages and attended school in more than one location. A good
number have also lived in villages or larger communities outside the North
Rupununi.
107
The vast majority of the residents are multilingual to some degree. Most,
though not all, are at least reasonably proficient in English, and most have some
skills in an indigenous language, Makushi being the most common of those.
Wapishana is also fairly common, particularly in Apoteri. Some people also
speak Portuguese. In casual exchanges in public settings, such as at shops,
English appeared to be more common than Makushi or other languages.
Environmental NGOs
As the natural world in the North Rupununi is relatively intact with a low
human population and small communities, a number of outside organizations,
agencies, and research projects have targeted it. Their purposes vary from
maintaining the biological diversity to understanding hunting practices and
animal ranges to increasing populations of dwindling species such as the
arapaima (Arapaima gigas).
Two nongovernmental organizations (NGOs) have worked extensively in
the communities for a number of years due to conservation projects they have in
the area: Iwokrama International Centre for Rainforest Conservation and
Development (Iwokrama) and Conservation International Guyana (CI).
In 1993 the president of Guyana conceived Iwokrama. In 1996 the
national government finally passed the act creating the non-governmental
Iwokrama International Centre for Rainforest Conservation and Development, a
371,000 ha forest reserve split into almost equal parts wilderness preserve and
108
sustainable utilization area (Iwokrama 2011a, 2011b). Iwokrama forest is in the
northern part of the North Rupununi, virtually the geographic center of the
country; and one of the North Rupununi communities, Fairview, is located within
its boundaries.
Iwokrama originated as a protected area from the top down. This action
upset many residents in the North Rupununi, particularly those closest to the
reserve, e.g., in Surama. They responded volubly to the government, and the 2
principal consequences were that Iwokrama made a significant attempt to work
with communities and residents actively and the communities of the North
Rupununi created their own organization, the North Rupununi District
Development Board, to represent themselves (discussed in detail below).
Conservation International Guyana‘s (CI) role in the region is similar
though it is not connected to the government. Conservation International has
several conservation programs in southern Guyana, and in 2002 finalized
negotiations with the national government for a ‗conservation concession‘ on the
Upper Essequibo River. It is a tract of primary rain forest not inhabited or
regularly used by anyone for which CI pays the national government concession
fees, comparable to those a company would pay for being allowed to log the
tract, in exchange for being allowed to conserve the area. The concession is
located about 80 km south of the nearest settlement, Apoteri, and is almost
81,000 ha in size.
109
Conservation International Guyana plays a greater role in the villages
along the Rupununi River that those along the International Highway, because
the river villages have greater potential for access and use of the concession
area. Some residents of these villages, especially Apoteri, take periodic
extended trips up the Essequibo for hunting and fishing. Thus, CI wanted to
make these villages and villagers part of the project through planning and
consultation as well as having a vested interest in the success of the venture
through concrete benefits. The Voluntary Community Investment Fund was
created as a way to provide benefits for these villages, and communities submit
project proposals to CI to apply for funds to enrich their villages as they see
most beneficial.
Both organizations have worked with communities in a variety of ways to
educate residents on Western scientific terms and understandings of the natural
world. The information appears to have stuck with some people but not with
everyone. Both organizations provide perceived benefits to the locals such as
employment opportunities, training courses, and expert infrastructure assistance
when requested and feasible.
The North Rupununi District Development Board
In response to the establishment of Iwokrama and a number of
subsequent issues that came up relating to natural resources, conservation, and
community development, leaders from 12 of the North Rupununi communities
110
came together and formed the non-profit, non-governmental organization the
North Rupununi District Development Board (NRDDB) in 1996 (Ousman et al.
2006). The original purpose of the organization was multifaceted and set out in
the organization‘s constitution. It included encouraging communities to
participate in development plans beyond their villages, establishing guidelines
for negotiating with external groups, and facilitating discussions between
Iwokrama and the member communities (Ousman et al. 2006). Later 4 more
communities joined (Michael Williams, personal communication).
The elected village heads, called toshaos in Guyanese Amerindian
communities, represent their communities in the NRDDB along with one other
elected member from each community, a youth leader, an elder, and at least
one woman in addition, if none of the other community representatives are
women. The toshao for Annai District, a group of 5 communities that share title
to land and includes Annai Central, Kwatamang, Rupertee, Surama, and
Wowetta, represents the district in addition to the representatives from the
individual villages (Ousman et al. 2006). In addition to an elected chairman, the
NRDDB also has an executive director, who works as its coordinator and often
representative. Both the executive director and the general administrative
assistant are paid employees. Previously meetings were held every 2 months
(Ousman et al. 2006), but the NRDDB now holds quarterly meetings of the full
membership with other meetings called as necessary to discuss issues of
111
special importance as they arise (Virgil Harding, personal communication;
Patrick Chesney, personal communication).
This organization is a type of gateway to the North Rupununi
communities, as it serves as a liaison between the individual communities and
the outside world. In fact, at times it serves a semi-governmental function, even
representing the district to the national government as well as in international
fora (Ousman et al. 2006). For instance, in the process of obtaining the required
permits to conduct this study in the North Rupununi, I was required to have
written permission from the village toshaos and the NRDDB before the Guyana
Environmental Protection Agency and the Guyana Ministry of Amerindian Affairs
would issue my permits.
Methods
Data Collection
Data were collected from February to October 2008 through direct
observation, informal interactions, and face-to-face interviews. Five villages
participated in the study: Annai Central, Apoteri, Aranaputa, Rewa, and Wowetta
(see maps in Figs. 1.2 & 1.8). Of these 5, Annai Central, Aranaputa, and
Wowetta are located along the International Highway and thus I refer to them as
the ‗road communities.‘ The remaining villages, Apoteri and Rewa, are primarily
accessible via the Rupununi River and are consequently referred to as the ‗river
villages.‘
112
Most of the interview protocol was fully structured with some sections that
were slightly less so and thus closer to semi-structured (Bernard 2000). The
interview protocol included three primary sections: natural resources, values and
beliefs, and socio-demographics (full protocol in Appendix A-1). The interview
was intended to be administered according to Dillman‘s (2000) Tailored Design
Method, which requires beginning with the section of items most obviously
relevant to the purpose of the project as presented to the participants. In this
case, I told participants that I wanted to better understand the natural resource
management and how this was connected to people‘s values and what was
important to them. Thus, originally, the natural resource items came first
followed by the items about values and beliefs, and the socio-demographic items
were last. However, once I began interviewing people, I became immediately
aware that this order would not work in a society not used to considering, much
less discussing, topics such as these. I reversed the order and found that this
was much more effective: Participants had the chance to get used to the
interview while answering the straightforward questions about when they were
born, what languages they speak, and their family‘s largest source of cash
income. Then the interview moved on to fixed-response items about their values
and perceptions, finishing up with the open-ended items, which for many
participants were more difficult to respond to.
The interview protocol was developed based largely on other instruments
with similar or parallel purposes but shaped to fit the situation of the North
113
Rupununi. The natural resource and socio-demographic items were constructed
with the intent of getting information useful and relevant to the area. The value
and belief items specifically addressed individualism, collectivism and locus of
control and were designed to be relevant to issues and situations relevant to
their lives (Lefcourt 1991). These items were based on theory and instruments
previously developed for these constructs (Rotter 1966; Ali 1987; Dorfman &
Howell 1988; Eraz & Earley 1989; Lefcourt 1991; Earley 1993; Oyserman 1993;
Bierbrauer et al. 1994; Singelis 1994; Chew 1996; Yoo 1996; Jung & Kellaris
2001; Spector et al. 2004; Yi 2004) and modified to fit the language, education,
and general experience of the residents. Once the protocol was drafted, it was
reviewed by and piloted with others, some of whom were experts in related fields
while others were not. Mainly the focus was cultural appropriateness, language
clarity, possible ambiguities, and other issues that could obstruct understanding
and validity. A semi-final draft of the protocol was then piloted on several
residents from Rupertee, a community in the North Rupununi not participating in
the actual study. After the pilot interviews, the protocol was modified and
resubmitted to the Texas A&M University Institutional Review Board for final
approval, granted in June 2008.
People aged 8 years and older were in the participant pool, but only 3
participants were under 10 years of age while 2 more turned 10 during the year
data were collected. The sample was a stratified convenience sample (Bernard
2000) in which age cohort, defined as decade of birth, and gender were the key
114
independent variables, largely due to a desire to see if generational differences
exist and explore how gender might correlate with values, beliefs, levels of
knowledge or other factors. Another reason for such stratification is to ensure
that segments of the general population are not skipped simply because they
are harder to access due to travel, work, or other issues. Otherwise, the sample
was largely a convenience sample taken from available people who balanced
out the age and gender groups.
Several pragmatic issues affected sampling and hence the data collected.
One was the scarcity of electricity, and another was transportation. Due to the
lack of electricity, all interviews had to be conducted during daylight hours, which
might have created a sampling bias. However, even people who had wage work
usually had time during the day to talk to me, and in the event of people
traveling, I attempted to make arrangements to return as much as possible.
Transportation options were limited, and in most cases I rode a bicycle. Road
conditions and light required that I leave in time to arrive home before dark.
Additionally, boat transport was necessary to travel to Apoteri and Rewa, so I
had much more limited access to people in those villages.
Nearly every person I asked to interview agreed to do so; most of those
who did not were children too shy to talk to me. One person made an
appointment for an interview and then scheduled something else for that time
and so refused the interview when I arrived. Another person agreed to
interview, but we were never able to find a time that worked.
115
Most interviews lasted 1.5 to 2 hours, though one lasted a full 4 hours and
some were as short as 1 hour. They were conducted at people‘s homes and as
much away from others as was possible. In the end, of 173 interviews initiated,
167 were used for the analyses. In Annai Central, I conducted 37 useable
interviews; in Apoteri 34; in Aranaputa and Rewa 33 each; and in Wowetta 30.
A few interviews were quietly abandoned as the extent of the lack of
understanding on the part of the participants became clear. For example, one
woman asked many basic vocabulary questions, such as what the word
―change‖ meant. By the time I rephrased, simplified, and detoured around the
original language in so many ways, the instrument to which she was responding
was no longer the one to which everyone else responded. When this became
evident, I simply slipped into chatting with her and then thanked her for her
participation. One interview was not used in the analysis because the
participant seemed so intent on impressing the researcher that the accuracy of
the responses was highly questionable.
In studies of this type, considerable interaction goes on between the
researcher and the participants. Some of the interactions are relatively formal
such as my introductions to the villages. I presented myself as a university
student conducting a project for my degree, a project about natural resources
and socio-cultural issues. Thus, I was asking them to help me by letting me live
with them and interview them. I acknowledged that although I had little to offer
in return, I would share the knowledge I got from them. They were the source,
116
and therefore, whatever information came from the project belonged to them,
too. I also hoped that it would be useful to them in some way.
In addition to the formal relationship based on the project, I lived in the
region and stayed in some of the villages. I interacted with residents casually on
the road, at shops, and at community events; I was personally acquainted with
many of them and friends with some.
Residents may have perceived some more official connection between
myself and Conservation International Guyana (CI). A few days after my arrival,
CI was taking a boat trip to Apoteri with stops in the other 2 river villages. The
staff offered to take me with them and introduce me to the village leaders. Later,
I was sometimes able to coordinate my river travel with CI. However, because
transportation is so very expensive and so difficult to arrange, people hitch rides
on official business trips with CI, Iwokrama, the Ministry of Amerindian Affairs,
and the like regularly, so this might have been seen as commonplace.
I spent most of 5 months in the region visiting villages, meetings, schools,
and homes to introduce myself and my project and get to know people. In all the
villages I had a local guide at least some of the time. In some villages the guide
accompanied me more during the introductory phase than during the interviews;
sometimes the guide would go ahead of me to arrange meetings and interviews.
All of the guides were women. Perceptions of me certainly influenced the
interactions I had with people, whether simply chatting or during the formal
interview, as occurs in any interpersonal interaction. Perceived wealth and
117
privilege (my ability to attend university and to travel to the North Rupununi for a
year) and my status as an outsider—emphasized by my appearance—shaped
reactions to me as well as interactions with me.
Statistical Methods
I created a database in Microsoft Office Access 2007 for the interview
responses, and those from the 167 interviews analyzed were entered. PASW
Statistics 18 (2009) was used to statistically analyze the data using Crosstabs
run from Descriptive Statistics. When the data from both variables being tested
were ordinal, Somers‘ d and gamma were the measures of association
employed. At times, the variables being tested for associations were not both
ordinal and thus required a different test. For situations in which one variable
was nominal and the other interval (ordinal), eta was the test statistic calculated.
Somers‘ d specifies one variable as the predictor (independent) variable
and the other as the predicted (dependent) variable, testing to see if one
variable predicts the other rather than a general correlation. Gamma, on the
other hand, simply tests to see if the two variables co-vary according to a
pattern; it is a symmetric measure of association.
For both tests, a significant positive association is a sign of the variables
increasing concordantly and to a greater degree than that which would be
expected randomly. In the case of Somers‘ d, the measure specifies which
variable appears better able to predict the increase; in other words, it is an
118
asymmetric test. A significant negative association indicates that as one
variable increases, the other decreases according to a statistically significant
pattern and degree. Both Somers‘ d and gamma associations range from 0,
indicating no association, to a maximum of |1|, which represents perfect
association either positively, +1, or negatively, -1 (Somers 1962; Costner 1965;
PASW 2009).
Eta tests the degree to which a nominal variable (independent) can
reduce prediction error of an interval variable (dependent); thus, it is
asymmetrical. The value of eta falls between 0 and +1, and the closer it is to 1,
the stronger the association is (PASW 2009). PASW (2009) does not calculate
a p-value for eta.
Generally accepted interpretation of these and similar measures of
association is as follows: 0.2 – weak; 0.4 – moderate; 0.6 – strong; 0.8 – very
strong; 1.0 – perfect (Frankfort-Nachmias & Leon-Guerrero 2006). For the
purpose of this chapter, |0.250| is the minimum association that will be
discussed and p-values of 0.01 or lower.
Socio-demographic Variables
The socio-demographic variables were included primarily based on
previous studies that investigated behaviors relating to natural resources and the
environment. The natural resource variables were largely different but I wanted
to test how previous results compared to those from this study. A major
119
difference, of course, is that this chapter focuses on the relationships of locus of
control and knowledge with natural resources and socio-demographics, so the
relationships tested here are indirect.
Hines et al.‘s (1987) meta-analysis of 128 studies since 1971 examined
education, age, gender, and income variables for their association with
environmentally responsible behavior and found that all were less than |0.200|. I
decided to test education, age, and gender but not income in this study. Gender
and age are reasonably straightforward, and participants were asked their date
of birth, while male or female was recorded for each. Education is vastly
variable in the region, but a formal system is in place and is more or less
accessible to residents of the North Rupununi. Education and age were also of
interrelated importance in that Guyana‘s curriculum has been modified to include
more and more about natural resources, ecosystem services, and related
issues, particularly in recent years, according to the headmaster of the Annai
Primary School. Would these changes manifest themselves in this study in any
way? Additionally, I investigated marital status and village of residence as basic
socio-demographic data to complement those variables listed above.
Participants‘ primary language(s) as a type of cultural indicator was also
analyzed.
Defining and quantifying ―income‖ in the North Rupununi is very complex.
Some people supply virtually all of their food themselves, while others work for
wages and do not have sufficient time to hunt, fish, or farm and process the
120
harvest (e.g., make farine or bread from cassava). Buying food in the region is
quite expensive as it is either imported or highly labor intensive. On the other
hand, people who can meet their own food needs without purchasing much do
not require nearly as much cash income and often only do occasional wage
labor or contract work such as spinning and weaving cotton. Thus, with the
mixed results in previous studies, I left this variable out.
Several socio-demographic factors are included in the analysis that are
regionally specific but might relate to life experiences important to perceptions
such as locus of control. Primary language was tested to see if that appeared to
have a connection with locus of control because of the possible effects of
linguistic relativity on culture and perceptions (Whorf 1940/1956). In such a rural
and remote area with such limited transportation, the possibility arises that
different levels of homogeneity and/or contact with outsiders would coincide with
different levels of locus of control. Location of/access to the village (the main
road or the river); the relative homogeneity of the communities (less and more
homogenous); and the location(s) of the school(s) that participants attended
(e.g., North Rupununi only, urban, foreign) were therefore included in the
analysis.
Operationalizing & Coding Variables
Some factors cannot be easily measured directly and thus the factor is
operationalized in a way that gives researchers a proxy to stand in for direct
121
measurement. Additionally, the interview items with open-ended responses
almost always yielded so many different responses that the sample size (n =
167) was too small when split into so many categories. For that reason, many
variables were re-coded with the categories combined so that fewer categories
existed and larger numbers per category were possible and consequently the
statistical tests had a higher chance of producing meaningful results and
revealing patterns. In exchange, some of the detail is lost through collapsing
categories. This section describes the operationalization of the variables and the
coding used for the analyses.
Education was measured through the proxy variable how many ‗years in
school‘ the participant spent. In the rural Guyanese context, even this is
complicated to measure. I used the following categories for years in school: 1 =
1-4 years of school; 2 = 5-7 years; 3 = 8-10 years; 4 = 11-13 years; and 5 = 14
or more years in school. This is based on the Guyanese school system in which
most children now go to preschool for 1 to 3 years; primary school lasts through
sixth grade; students who complete secondary school usually do it in 12 years—
though 13 or 14 is relatively common and 11 is not unheard of; some of the
participants attended additional schooling such as teaching training, divinity
school or even university (1 participant).
Though the system has set periods of time for certain things, particularly
in rural areas such as the North Rupununi that the Guyanese call the
hinterlands, these are more fluid due to practical considerations. Thus, some
122
villages only recently have preschool available while others have had it for
years; or if a student‘s school year was interrupted or repeated for any reason,
he or she might have counted the same grade level as two years. Additionally,
students at the Youth Training Centre at Bina Hill count years at the Centre as
school, of course, but such alternative schooling does not fit into the traditional
education system of the country, and the only academic requirement for
admission to the Centre is having attended some primary school. Such
situations can create vast differences between what might appear similar when
simply listed as ‗years in school.‘ Within a single category, some participants
have attended some secondary school but not attended preschool, while others
have attended 3 years of preschool but no secondary school (yet). These two
participants could have attended school for the same number of years but have
different very different levels of education. Clearly, years in school is far from
the perfect proxy for education, but it does give a basic, ordinal indication. One
person had no schooling whatsoever, and due to the issues with statistical tests
with small expected values, I excluded that response from the analyses.
The responses for the variable ‗locations of schools‘ was grouped into 5
categories. Category 1 was defined as having attended schools in the North
Rupununi only, while 2 was schools in rural Guyana and included people who
had either attended rural schools outside the North Rupununi only or in addition
to. The third category was for people who had only attended schools in cities or
towns in Guyana, e.g., Georgetown or Lethem. Category 4 was a mix of rural
123
and town/city schools. The final category was for people who had attended
school outside of Guyana at any point in their education.
Age was grouped into categories by decade of birth: people born after the
year 2000, 1990-1999, 1980-1989, 1970-1979, 1960-1969, 1950-1959, 1940-
1949, and before 1940 (only 1 participant).
Homogeneity of villages was determined based on the amount of contact
village residents generally have with regional outsiders within the village, either
as residents or visitors. Less homogenous villages have more residents and
visitors from outside the region, e.g., Aranaputa and Annai. Wowetta, Rewa,
and Apoteri have fewer visitors and not as many residents from outside the
regions, and thus, are more homogenous. These definitions and assessments
are based on information from the village councils and were verified through
observation. The variable was treated as ordinal: 1 was lower homogeneity; 2
was higher.
The number of natural resources participants named varied from 0 to 10.
Zero natural resources named was the lowest category. Next came 1-2
resources named, then 3-4, and finally 5 or more.
Activities relating to natural resource conservation were the focus of
variables relating to ‗activities.‘ These included both volunteer and paid
activities. For example, participating in a local Wildlife Club or doing unpaid
maintenance work on the Aranaputa nature trail (ecotourism) would count as
volunteer participation. On the other hand, being a ranger for Conservation
124
International or Iwokrama or doing visual counts of wildlife along transects for
Project Fauna would count as paid participation because the people receive
wages for their time and effort.
Locus of Control
Locus of control was measured by posing limited-response items with 4
choices that form a continuum ranging from external to internal or vice-versa,
depending on how the item was phrased. Respondents had 2 positive and 2
negative choices with no middle response possible (see Appendix A-1 for
complete interview protocol). This was intentional in order to prevent what is
termed the moderacy response bias, which is when respondents select the
midpoint as often as possible just because it is neutral (Paulhus 1991) as has
been observed in some groups. The 11 items addressing locus of control (Table
3.1) were scored 1 to 4, with 1 being the most external and 4 being the most
internal.
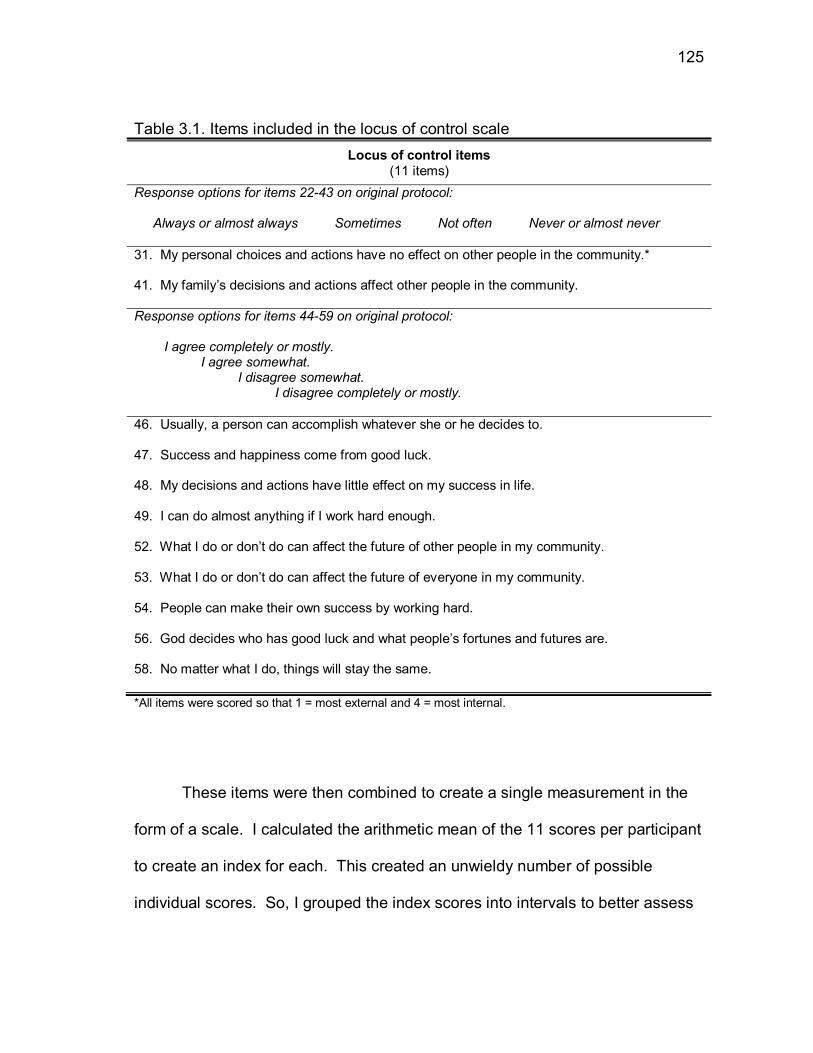
125
Table 3.1. Items included in the locus of control scale
Locus of control items (11 items)
Response options for items 22-43 on original protocol: Always or almost always Sometimes Not often Never or almost never
31. My personal choices and actions have no effect on other people in the community.*
41. My family‘s decisions and actions affect other people in the community.
Response options for items 44-59 on original protocol: I agree completely or mostly. I agree somewhat. I disagree somewhat. I disagree completely or mostly.
46. Usually, a person can accomplish whatever she or he decides to.
47. Success and happiness come from good luck.
48. My decisions and actions have little effect on my success in life.
49. I can do almost anything if I work hard enough.
52. What I do or don‘t do can affect the future of other people in my community.
53. What I do or don‘t do can affect the future of everyone in my community.
54. People can make their own success by working hard.
56. God decides who has good luck and what people‘s fortunes and futures are.
58. No matter what I do, things will stay the same.
*All items were scored so that 1 = most external and 4 = most internal.
These items were then combined to create a single measurement in the
form of a scale. I calculated the arithmetic mean of the 11 scores per participant
to create an index for each. This created an unwieldy number of possible
individual scores. So, I grouped the index scores into intervals to better assess
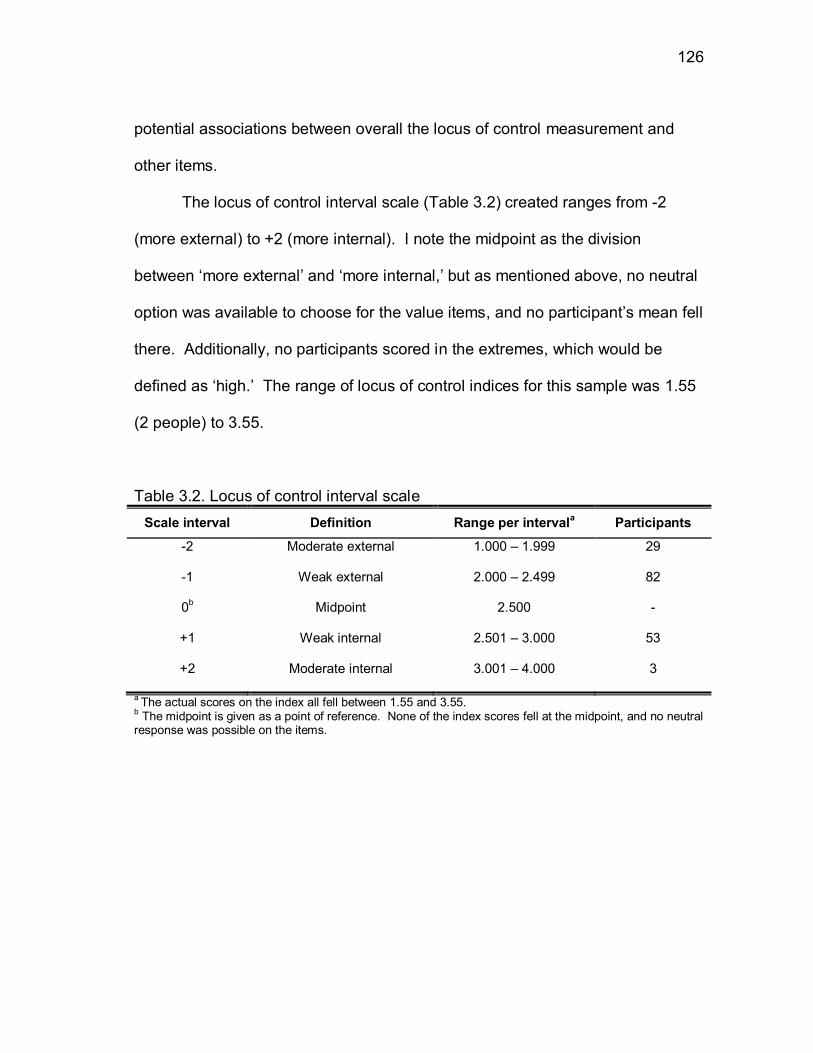
126
potential associations between overall the locus of control measurement and
other items.
The locus of control interval scale (Table 3.2) created ranges from -2
(more external) to +2 (more internal). I note the midpoint as the division
between ‗more external‘ and ‗more internal,‘ but as mentioned above, no neutral
option was available to choose for the value items, and no participant‘s mean fell
there. Additionally, no participants scored in the extremes, which would be
defined as ‗high.‘ The range of locus of control indices for this sample was 1.55
(2 people) to 3.55.
Table 3.2. Locus of control interval scale
Scale interval Definition Range per intervala Participants
-2 Moderate external 1.000 – 1.999 29
-1 Weak external 2.000 – 2.499 82
0b Midpoint 2.500
-
+1 Weak internal 2.501 – 3.000 53
+2 Moderate internal 3.001 – 4.000 3
a The actual scores on the index all fell between 1.55 and 3.55.
b The midpoint is given as a point of reference. None of the index scores fell at the midpoint, and no neutral
response was possible on the items.
127
Results
Locus of Control v. Socio-demographics
With nearly two-thirds of the participants (111 of 167) scoring more
external on locus of control, without question the participants in this study tend
toward an external locus of control, meaning they generally do not feel like they
have much personal control.
Crosstabulations between the locus of control interval scale and socio-
demographic variables were calculated (Table 3.3). Overall, the associations
between locus of control and the socio-demographic variables were weak to
virtually nonexistent. However, 3 socio-demographic variables showed a weak
to moderate ability to predict locus of control. These are the village in which the
participant lived in at the time of the interview, homogeneity of the village, and
the locations of the schools the participant had attended. The measures of
association between locus of control and these 3 variables were all greater than
|0.250|. Associations between village and locations of schools were tested
using eta, but the association with homogeneity (ordinal) was tested with
Somers‘ d and gamma and the results were significant at p ≈ 0.001.
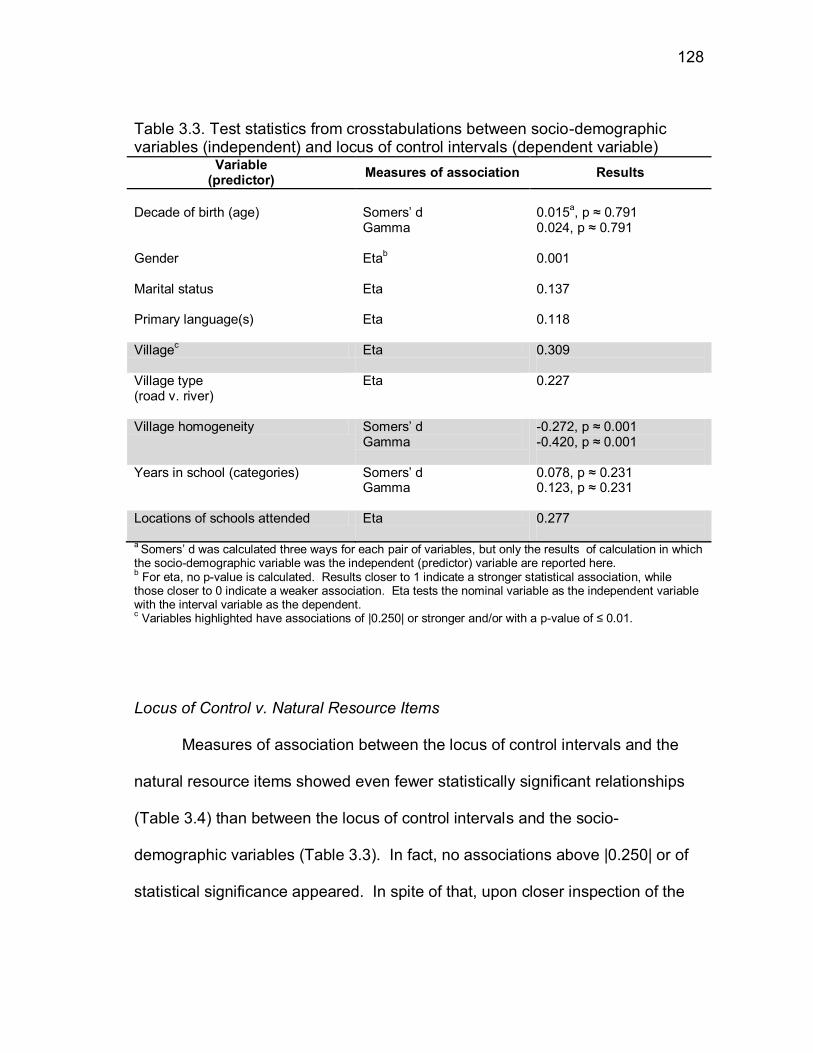
128
Table 3.3. Test statistics from crosstabulations between socio-demographic variables (independent) and locus of control intervals (dependent variable)
Variable (predictor)
Measures of association Results
Decade of birth (age) Somers‘ d
Gamma 0.015
a, p ≈ 0.791
0.024, p ≈ 0.791
Gender Etab
0.001
Marital status Eta 0.137
Primary language(s) Eta 0.118
Villagec
Eta 0.309
Village type (road v. river)
Eta 0.227
Village homogeneity Somers‘ d Gamma
-0.272, p ≈ 0.001 -0.420, p ≈ 0.001
Years in school (categories) Somers‘ d Gamma
0.078, p ≈ 0.231 0.123, p ≈ 0.231
Locations of schools attended Eta 0.277
a Somers‘ d was calculated three ways for each pair of variables, but only the results of calculation in which
the socio-demographic variable was the independent (predictor) variable are reported here. b For eta, no p-value is calculated. Results closer to 1 indicate a stronger statistical association, while
those closer to 0 indicate a weaker association. Eta tests the nominal variable as the independent variable with the interval variable as the dependent. c Variables highlighted have associations of |0.250| or stronger and/or with a p-value of ≤ 0.01.
Locus of Control v. Natural Resource Items
Measures of association between the locus of control intervals and the
natural resource items showed even fewer statistically significant relationships
(Table 3.4) than between the locus of control intervals and the socio-
demographic variables (Table 3.3). In fact, no associations above |0.250| or of
statistical significance appeared. In spite of that, upon closer inspection of the
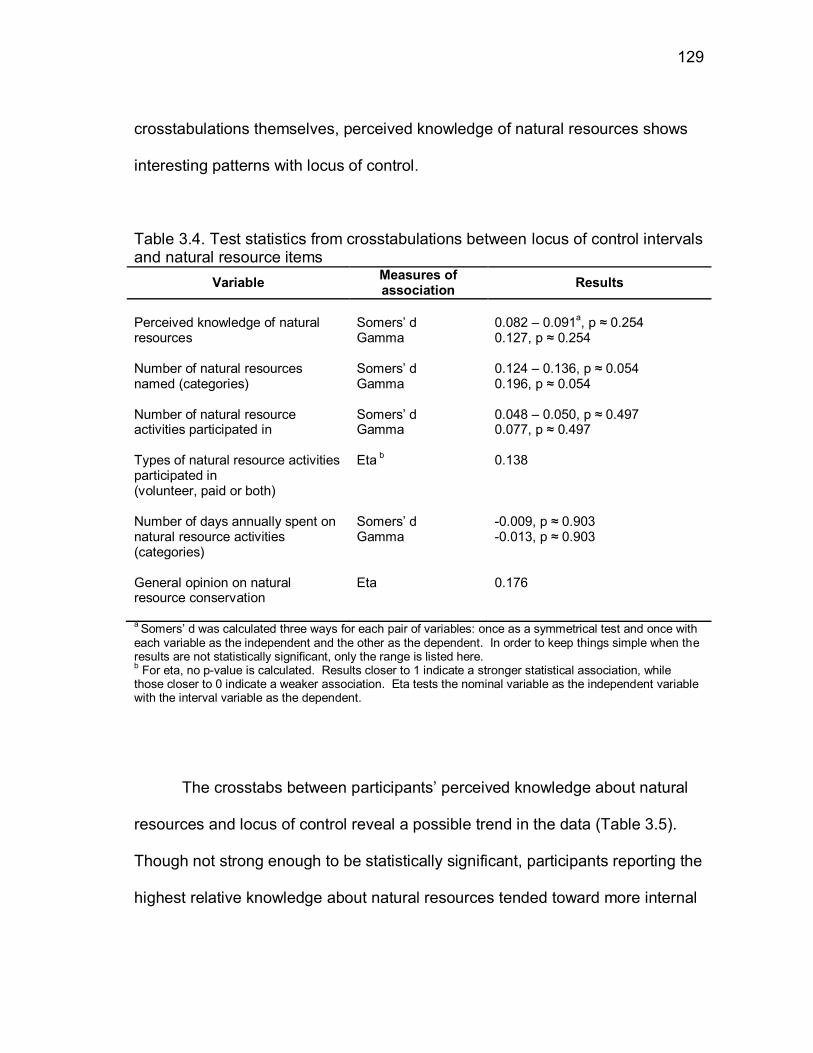
129
crosstabulations themselves, perceived knowledge of natural resources shows
interesting patterns with locus of control.
Table 3.4. Test statistics from crosstabulations between locus of control intervals and natural resource items
Variable Measures of association
Results
Perceived knowledge of natural resources
Somers‘ d Gamma
0.082 – 0.091a, p ≈ 0.254
0.127, p ≈ 0.254
Number of natural resources named (categories)
Somers‘ d Gamma
0.124 – 0.136, p ≈ 0.054 0.196, p ≈ 0.054
Number of natural resource activities participated in
Somers‘ d Gamma
0.048 – 0.050, p ≈ 0.497 0.077, p ≈ 0.497
Types of natural resource activities participated in (volunteer, paid or both)
Eta b 0.138
Number of days annually spent on natural resource activities (categories)
Somers‘ d Gamma
-0.009, p ≈ 0.903 -0.013, p ≈ 0.903
General opinion on natural resource conservation
Eta 0.176
a Somers‘ d was calculated three ways for each pair of variables: once as a symmetrical test and once with
each variable as the independent and the other as the dependent. In order to keep things simple when the results are not statistically significant, only the range is listed here. b For eta, no p-value is calculated. Results closer to 1 indicate a stronger statistical association, while
those closer to 0 indicate a weaker association. Eta tests the nominal variable as the independent variable with the interval variable as the dependent.
The crosstabs between participants‘ perceived knowledge about natural
resources and locus of control reveal a possible trend in the data (Table 3.5).
Though not strong enough to be statistically significant, participants reporting the
highest relative knowledge about natural resources tended toward more internal
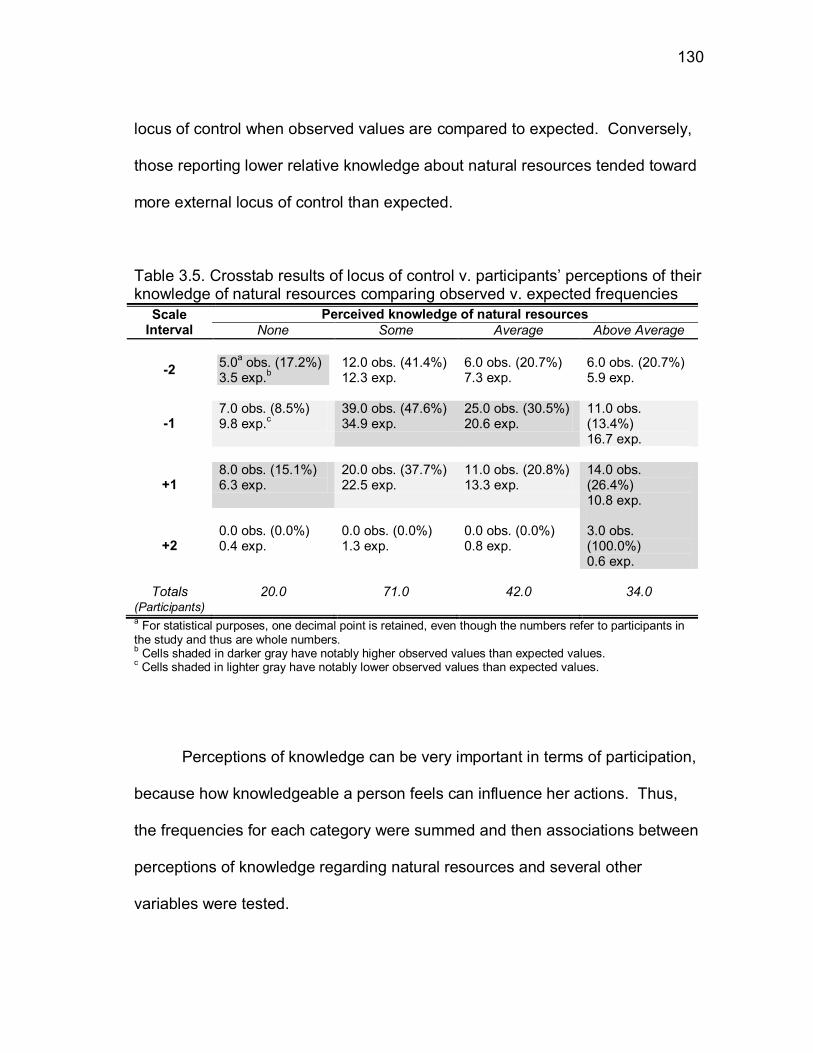
130
locus of control when observed values are compared to expected. Conversely,
those reporting lower relative knowledge about natural resources tended toward
more external locus of control than expected.
Table 3.5. Crosstab results of locus of control v. participants‘ perceptions of their knowledge of natural resources comparing observed v. expected frequencies
Scale Interval
Perceived knowledge of natural resources
None Some Average Above Average
-2 5.0
a obs. (17.2%)
3.5 exp.b
12.0 obs. (41.4%) 12.3 exp.
6.0 obs. (20.7%) 7.3 exp.
6.0 obs. (20.7%) 5.9 exp.
-1 7.0 obs. (8.5%) 9.8 exp.
c 39.0 obs. (47.6%) 34.9 exp.
25.0 obs. (30.5%) 20.6 exp.
11.0 obs. (13.4%) 16.7 exp.
+1 8.0 obs. (15.1%) 6.3 exp.
20.0 obs. (37.7%) 22.5 exp.
11.0 obs. (20.8%) 13.3 exp.
14.0 obs. (26.4%) 10.8 exp.
+2 0.0 obs. (0.0%)
0.4 exp. 0.0 obs. (0.0%)
1.3 exp. 0.0 obs. (0.0%)
0.8 exp. 3.0 obs. (100.0%)
0.6 exp.
Totals 20.0 71.0 42.0 34.0 (Participants) a For statistical purposes, one decimal point is retained, even though the numbers refer to participants in
the study and thus are whole numbers. b Cells shaded in darker gray have notably higher observed values than expected values.
c Cells shaded in lighter gray have notably lower observed values than expected values.
Perceptions of knowledge can be very important in terms of participation,
because how knowledgeable a person feels can influence her actions. Thus,
the frequencies for each category were summed and then associations between
perceptions of knowledge regarding natural resources and several other
variables were tested.
131
When reporting perceived knowledge of natural resources, over 50% of
participants (total) reported themselves as having lower knowledge about natural
resources than most people in their village or none at all (Table 3.6), which could
have considerable effects on participation in community discussions and
decisions. When the results are examined by village type (road or river), eta =
0.169, too low to be of interest. However, again a closer look at the observed v.
expected values for the different village types proved interesting (Table 3.6).
Participants residing in the river villages tended to report lower levels of
knowledge about natural resources than those in road communities: Over 65%
of the participants in river villages felt they had less than average to no
knowledge about natural resources, while 46% of participants in the road
communities perceived their knowledge at those category levels. The situation
is clear, though, that many of the participants feel underinformed or worse,
uninformed, about natural resources.
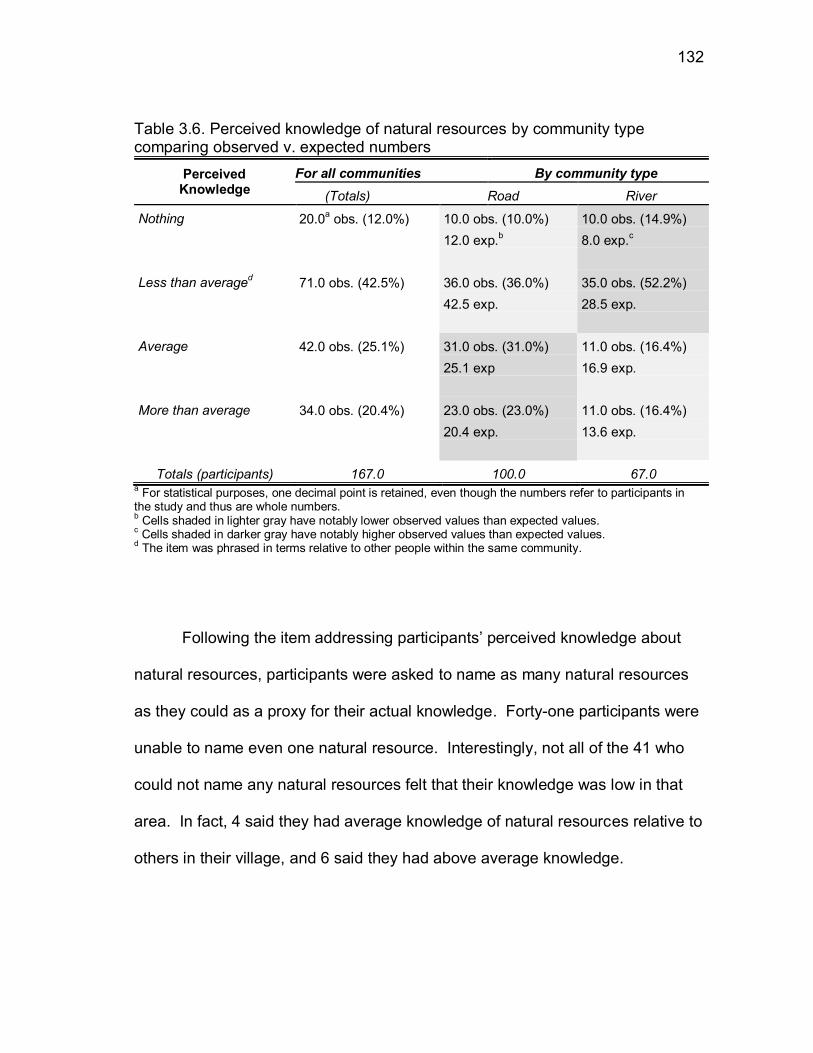
132
Table 3.6. Perceived knowledge of natural resources by community type comparing observed v. expected numbers
Perceived Knowledge
For all communities By community type
(Totals) Road River
Nothing
20.0a obs. (12.0%)
10.0 obs. (10.0%)
12.0 exp.b
10.0 obs. (14.9%)
8.0 exp.c
Less than averaged
71.0 obs. (42.5%) 36.0 obs. (36.0%)
42.5 exp.
35.0 obs. (52.2%)
28.5 exp.
Average
42.0 obs. (25.1%) 31.0 obs. (31.0%)
25.1 exp
11.0 obs. (16.4%)
16.9 exp.
More than average
34.0 obs. (20.4%) 23.0 obs. (23.0%)
20.4 exp.
11.0 obs. (16.4%)
13.6 exp.
Totals (participants) 167.0 100.0 67.0 a For statistical purposes, one decimal point is retained, even though the numbers refer to participants in
the study and thus are whole numbers. b Cells shaded in lighter gray have notably lower observed values than expected values.
c Cells shaded in darker gray have notably higher observed values than expected values.
d The item was phrased in terms relative to other people within the same community.
Following the item addressing participants‘ perceived knowledge about
natural resources, participants were asked to name as many natural resources
as they could as a proxy for their actual knowledge. Forty-one participants were
unable to name even one natural resource. Interestingly, not all of the 41 who
could not name any natural resources felt that their knowledge was low in that
area. In fact, 4 said they had average knowledge of natural resources relative to
others in their village, and 6 said they had above average knowledge.
133
When perceived knowledge of natural resources was tested for an
association with the number of natural resources participants named, Somers‘ d
and gamma both showed statistically significant relationships. Somers‘ d was
virtually the same regardless of which variable was designated as the predictor:
0.375 for perceived knowledge of natural resources as the predictor; 0.371 for
the number of natural resources named; p ≈ 0.000 in both cases. The high
correlation between the two variables without one being clearly able to predict
the other makes gamma a better measure of association for this case. Gamma
was 0.521, p ≈ 0.000. Together the measures clearly demonstrate that while not
everyone‘s self-perception of knowledge was accurate when compared to this
proxy for actual knowledge, the number of natural resources named, the two
show a marked tendency to change together. In other words, as perceived
knowledge increases, the number of natural resources named goes up in a
statistically significant number of cases.
This does not necessarily mean that people do not actually have
knowledge of natural resources. In fact, it is highly unlikely that anyone in the
region would have no knowledge of natural resources. What is possible, and
even likely, is that despite being proficient speakers of English and in
communities that use the term ‗natural resource‘ frequently, the residents have
never gotten a clear picture of what the term represents. This is likely part of the
problem West and Brockington (2006) discuss: Often natural resource
professionals do not take the time to explore local residents‘ conceptions and
134
perceptions of their surroundings. So, people use the term, both those who
understand it and those who do not, but that does not demonstrate knowledge or
lack of knowledge about the resources. The item measures understanding of
the term more than actual knowledge. The understanding of the term itself, or
lack thereof, then contributes to people‘s perceived knowledge.
Community Decision Making
When asked how village decisions were made, 41 participants stated
that they did not know how their village made decisions or did not respond to the
question, also likely to indicate a lack of knowledge. This variable is viewed as
somewhat of an indicator of participants‘ involvement in community decision
making: Those who participate more actively are likely to be more familiar with
the process and have a better understanding of it. Some responded that
organizations such as the youths‘ Wildlife Club or Conservation International
made the decisions. Many answered with partially accurate responses such as
a community meeting and discussion with the final decision being made by the
village council or the toshao alone.
According to village council members from the participating villages,
generally the village council (or equivalent) discusses the problem and then
holds a community meeting to discuss the issue. After the public discussion, the
community then votes to make the final decision. Eighty-nine people said that
the village council makes the final decision, even if the community holds a vote
135
at a public meeting; 24 did not mention a general vote but only a community
meeting. ‗Years in school‘ showed absolutely no correlation with participants‘
knowledge of how decisions are made in the community (p = 0.763).
Unfortunately, no data were collected on people‘s participation in community
government and decision making.
Conclusions
In the North Rupununi, natural resources are part of daily life in a way that
they are not in many places that are more industrialized. Here, if a person
needs a bench, it first means a trip to the forest to cut down a tree from which
the bench can be made. Many, if not most, roofs are made of palm thatch,
which the person must harvest, cut, and then bind to roof beams, usually using
handmade wicker-like string. In this study, 152 of 167 people interviewed in five
of the 16 villages said they had a farm, and of those 152 who had a farm, 145
(over 95%) said that their farm was their most important source of food. This
illustrates how residents‘ connection to the natural world is much more direct—
and much less abstract—than getting food in a grocery store or buying tar
shingles at a megastore for building materials.
A major issue is how much the community leaders, those negotiating with
outsiders and bringing back information to other residents, truly understand and
grasp in discussions with outsider groups. Some have had experiences that
prepare them to communicate effectively with outsiders and community
136
members on topics regarding natural resources, while others are less
experienced and/or sophisticated when it comes to such activities and topics.
Many may understand some parts of the discussion better than others and thus
focus on those that make more sense to them. For example, when someone
brings up the prospect of jobs for community residents, the negotiators might
well focus on that and gloss over rights they might be giving up, what they are
required to contribute from their natural resources, or risks involved in the deal.
The benefits might seem to outweigh the risks or disadvantages simply because
the negotiators understand the issues with jobs and the immediacy of the
problem more than the rest of the discussion.
Community leaders, toshaos as well as others elected to represent the
villages, may or may not fully understand the topic about which they are
negotiating, yet they form a major link between the outsiders and all the
residents of the North Rupununi (Ousman et al. 2006). The people they
represent are less likely to have a clear, accurate picture of the situation, in large
part because of the indirect nature of their information: What they ‗learn‘ and
‗know‘ has been filtered through someone else‘s understanding and perceptions.
Thus, they are even less likely to have a clear understanding and subsequently
keep the agreements made. The effect can be somewhat like playing the
children‘s game called Telephone, during which a sentence is whispered from
one person to the next and when it reaches the last person, the sentence that
137
comes out is compared to the original sentence. All too often the final version
has nothing in common with the original.
With this picture emerging from the data, it becomes evident that in this
context aspects of each component of the Reasonable Person Model are
missing. The absence of these characteristics is either a problem in itself or
leads to a problem, problems which inhibit successful, effective natural resource
conservation. Common mental models have not been created; meaningful
participation is not enabled or occurring; being effective is much less likely.
Confusion about decision making is obviously common among villagers in
these small communities and illustrates that many people are unclear about their
voice in community affairs—in natural resources and otherwise. Multiple times
residents told me that they did not know anything about natural resources and
so they could not participate in meetings because they would not know what to
do nor even what questions to ask. So, not only does their perceived knowledge
(information) about where the control lies tell them they have no say other than
in the election of village council members and the toshao, or of the Community
Development Council and chair in the case of Aranaputa, but many also feel
unqualified to be part of natural resource decisions. Once the village leaders
have been elected, many of the villagers apparently feel either that they have
given their voice to the representatives or that they have participated and done
their duty by electing them and are thus absolved of further responsibilities.
They then perceive the locus of control as outside themselves and/or their
138
personal decision making as complete and their own power and choices as
spent.
Participants‘ perceived lack of knowledge regarding natural resources
combined with their lack of understanding of the decision-making processes
within their villages surely inhibits their participation in community decisions
about natural resources as well as other issues. Per Kaplan and Kaplan‘s
(2009) Reasonable Person Model, many people in the communities do not
appear to share a mental model of how decision making occurs or their options
for meaningful action, which indicates that something in the informational
environment does not facilitate clarity. People seem to be largely unsure of how
to participate: from how to be listened to and respected all the way to taking
action through voting in village meetings. This seeming lack of ‗clear-
headedness‘ about the situation can lead people to feel impotent and insecure
rather than competent and confident, perceptions which negatively affect
people‘s effectiveness. Perceived knowledge about the situation shapes
perceived locus of control and choice, and in this case, they perceive little to no
direct choice or control (influence) in community decisions.
Without clarity about their role and rights in such decisions, community
residents are unlikely to exercise the power of their voices in either the
discussions or the votes. This misunderstanding or lack of clarity can lead to
even less action and lower perceived ‗effectiveness.‘ By missing the
discussions, residents are that much less likely to understand the situations that
139
face the village or be familiar with the dialogs that surround the issues and
situations. They are also likelier to miss votes, as these often take place at the
end of the discussion meetings.
This scenario illustrates how components of the Reasonable Person
Model feed into each other, with problems in one area compounding problems in
another much of the time. These data for perceived and accurate knowledge
about natural resources and participation in community decision making in the
North Rupununi do not bode well for successful natural resource conservation.
Although residents reported an overwhelmingly positive opinion of natural
resource conservation, 146 of 164 useable responses were positive and only 3
responses were outright negative, natural resources and the goals of managing
them for conservation and sustainability are very complicated, both to
understand and to carry out.
Previous research shows that very complex information can reduce levels
of understanding among the public (Robson et al. 2010). Information—facts and
logical arguments—regarding natural resources and their management are
almost invariably very complex. When such topics and information are also
relatively unfamiliar and no similar mental model exists, making sense of this
information is so much more difficult (Kaplan & Kaplan 2009) that the topics
appear even more complex and sometimes virtually incomprehensible.
Comprehensible and clear information increases people‘s perception of being
knowledgeable and by extension makes them more comfortable participating in
140
discussions and decision-making because they feel more competent. As a
result, people also feel they have more real choices and that they have a more
internal locus of control, meaning their choices make a difference in the
community decisions and the outcomes.
Local residents, and indigenous peoples in particular, need to feel
comfortable with the process and information shared so that they also feel
comfortable participating in a variety of ways. If general community members
are not comfortable participating in discussions and decision making about
natural resources within their communities, then the community members
representing them in negotiations outside the community will not have an
accurate picture of community concerns and positions.
The community representatives are not necessarily any more comfortable
with these topics. Specifically in the North Rupununi, the community
representatives for natural resource planning and negotiations are selected from
the village council members. They are respected within the community but they
need not be any more knowledgeable about natural resources nor more familiar
with the stressful situations that are likely to be part and parcel of negotiating
critical things such as natural resource access for their community.
Though the local residents are often very knowledgeable about natural
resources, these situations can make them uncomfortable and even feel
inadequate or ineffective. Being put at the table with others labeled or perceived
to be ‗experts‘ in various areas of natural resources can make them feel less
141
self-confident and/or less competent. As described above, multiple residents
mentioned their discomfort at asking questions about, much less commenting
on, natural resource issues within community processes. A situation in which
education, knowledge, and power are perceived as very unequal among
participants can easily lead those with less formal education or less authority to
feel they are not respected. The same situation can also inflate their levels of
respect for the people with extensive formal education with whom they are
negotiating, leading to lower internal locus of control and real loss of local power
in the decision-making process.
As confusion and frustration increase while perceived respect,
knowledge, confidence, and competence decrease, the probable result is that
local representatives will be unable to properly negotiate for themselves and
their communities because the situational environment is confusing, which
hinders meaningful action and being effective (Kaplan & Kaplan 2009).
Higher levels of individual familiarity with and knowledge of natural
resources can likely help people feel more competent and capable of
representing their communities adequately beyond the local and even regional
conservation communities. It can also help within communities as it has the
potential to encourage participation in village meetings as well as activities
related to natural resources and specifically conservation. Further engagement
and self-perception of greater knowledge can promote dialog about natural
resources, management options, and possible consequences of choices within
142
the communities. In turn, members feel more familiar and more comfortable with
natural resource issues, increasing their feeling of competence to participate
effectively and take meaningful action (Kaplan & Kaplan 2009).
Perceived knowledge of natural resources shows the tendency to
increase as people‘s locus of control becomes more internal. The proxy variable
for education, years in school, showed a statistically significant ability to predict
both people‘s perceived knowledge of natural resources and their ability to name
natural resources. These results indicate that education has the potential to
increase people‘s perception of an internal locus of control in natural resources,
which could both increase and improve participation in decision making.
Conservationists can use the Reasonable Person Model as a framework
to ensure that at all stages of conservation design, planning, and implementation
people‘s psychological needs are nurtured in such a way that promotes
understanding and collaboration.
To start with, participants can work on co-creating a common mental
model to collect and understand the information and perspectives from all sides.
Co-creation does not mean simply ‗educating‘ the people who live where
conservationists would like to conserve natural resources about the
conservationists‘ perspectives. Rather, it refers to a shared, iterative process
whereby the conservationists work to comprehend and identify with the
perspectives, understanding and knowledge of locals and the others involved
while simultaneously sharing theirs. Together, the parties work to build a

143
common mental model to which all contribute as equal partners. Although no
two people will ever have the exact same mental models, the process of learning
and creating together with all contributing parties viewed as respected equals
puts people in a position of openness to learning and expanding what
knowledge they have to include new ideas and perspectives in addition to
information.
All of the components and factors in the Reasonable Person Model have
an extensive iterative relationship with one another (Fig. 3.2). In listening well to
those who are not conservation professionals or scientific experts, the value
others place on their contributions becomes clear and the respect demonstrated
gives people the feeling they are participating and cooperating meaningfully.
Subsequently, people feel much more comfortable, confident and competent,
allowing them to be more effective, and they can relax to understand more
information over time, expanding their mental maps.
Figure 3.2. Revised depiction of the Reasonable Person Model and the interconnectedness of the components
144
Research suggests that when these processes occur, not only can
participants‘ levels of comfort and skill increase, but they can also gain a more
internal locus of control: They begin to perceive evidence that what they say and
do can make a difference and influence outcomes. This does not have to mean
the group will reach consensus, or even that consensus is a good goal for every
situation (Peterson et al. 2005). But when people feel they can make a well-
informed choice according to their priorities and needs, they feel more powerful
and more effective (Leotti et al. 2010).
Active cooperation is an important type of meaningful action in the
Reasonable Person Model, and it directly relates to control and choice.
Meaningful action encompasses responses to the actions as well. When others
listen and respect one‘s voice, one‘s feelings of control can increase and the
power to influence action and make a difference become visible through the
results. The more competent one feels, the more internal one‘s locus of control
is likely to be as one perceives greater ability to effect change.
In fact, research indicates that locus of control and perceived choice are
related at an even deeper level. People with a more internal locus of control
perceive options they see as positive more as true choices than they do
negative options, perhaps because the negative options are not perceived to
have much potential benefit (Harvey et al. 1974). In natural resource
conservation, this means that though conservationists do not want to sugarcoat
the picture, we also need to be very conscious of the possible, even probable,
145
results of painting a doom-and-gloom picture in which none of the options seem
to provide benefit or only one ―option‖ appears to be beneficial while the others
all lead to negative consequences. Many people do not perceive such negative
―choices‖ as real control (Leotti et al. 2010), which could lead to more external
perception of locus of control in conservation. In natural resource conservation,
we often focus on the negative consequences of an action, or of no action. This
negative focus could derail the process of cooperation and empowerment if part
of the goal is to encourage people to act meaningfully and be effective. Taken
together, this research suggests that presenting people with positive, reasonable
choices that are likely to achieve positive results is a more productive way to
activate people‘s engagement and perceived choice toward successful
conservation outcomes.
When all participants have a clear and similar understanding of the
process and outcomes of the negotiations, the stage is set for a productive
program built on a foundation of trust. Working to give everyone equal voice to
express their positions and reasoning and ensuring that neither people nor
opinions are brushed aside adds a much deeper layer of trust through the
process of co-creation. Not everyone is going to get his or her own way in every
decision or detail. But the process of working together in a collegial environment
of equality that focuses on creating common knowledge through everyone‘s
contributions helps all parties feel knowledgeable, part of the decision process,
146
and invested for the future of the resources as well as for the futures of
themselves and their families.
The question becomes how to use all of the resources available—money,
time, manpower, information, understanding, and trust among people—to their
maximum effect and benefit for conservation. In order to do that, sometimes
more time must be spent up front establishing relationships, co-creating
understanding, and encouraging respect and cooperation. In many cases, this
need not be an especially expensive stage, particularly when the cost is
compared to the highly touted rapid assessments (Brosius & Russell 2003).
Brosius and Russell (2003) also point out that in many international-level
conservation organizations, extensive travel, expensive publications, centralized
workshops, international salaries for ‗expert employees,‘ and other such budget
items are considered standard. In many cases, a small portion of the budget for
those items could be diverted to local groundwork with the potential for great
return relative to the investment. Though the process might take longer, the
results of investing in solid, positive relationships with well-informed,
knowledgeable and empowered communities can definitely make up for the time
spent, because the conservation goals can be set reasonably and realistically
within the local context, creating a higher likelihood for success.
The time saved by doing the project right the first time is worth the
investment, in particular as that adds real conservation time to a project. Kaplan
and Kaplan‘s Reasonable Person Model (2009) provides a framework for
147
building common mental models, enabling meaningful action, and empowering
people to be effective. We can make much progress in meeting people‘s
psychological needs for choice and control while also having the chance to
incorporate both scientific information and information relevant to people‘s needs
and perceptions by using the framework to notice and nurture its components.
In doing so, we construct an opportunity to achieve much higher success by co-
creating and sharing ownership of the natural resources and the management
plan.
148
CHAPTER IV
A TOOLKIT FOR EFFECTIVE NATURAL RESOURCE CONSERVATION
THROUGH MEANINGFUL COLLABORATION
Introduction
In natural resource conservation, many organizations and agencies
promote their conservation practices as participatory or inclusive, particularly in
reference to indigenous and traditional peoples. These people have often been
marginalized by existing governments and authority structures (Kothari 2001;
Brechin et al. 2002; Tipa & Welch 2006).
Participation can be a vague term, operationalized in many ways. For
example, the Amazon Conservation Team (2011) employs ‗participatory
ethnographic mapping‘ to generate local participation through sharing traditional
knowledge and local land-use practices as a starting point for conservation work.
Conservation International‘s Web site for its Indigenous and Traditional
People‘s Program focuses on ―strengthen[ing] the collaboration of these groups
and expand[ing] the abilities of local communities to effectively manage their
lands and resources …‖ (2011). Interestingly, the site mentions that the
organization‘s ―support [is] in response to a global indigenous call for
collaborative conservation action‖ (2011).
The Nature Conservancy has yet another approach, separating ―local
stakeholders‖ from ―indigenous and traditional communities‖ in describing its
149
partners on the organization‘s Web site (2011b). All examples of projects ―in
cooperation with‖ local stakeholders are in North America. On that same Web
page, the indigenous and traditional peoples are considered ―integral‖ to
attaining conservation success, and elsewhere the site promises collaboration
(2011a). The focus in all the project descriptions is on the Nature Conservancy
―helping‖ indigenous and traditional peoples achieve their goals.
Many conservation and development professionals promote stakeholder
participation as crucial to developing sustainability in natural resource
conservation and other projects (e.g., Cernea 1991; Suman et al. 1999;
Gonsalves et al. 2005; Spiteri & Nepal 2006; Granek et al. 2008). Numerous
resources attempt this difficult task. One that provides guidance on encouraging
and creating opportunities for participation was published by the United States
Department of Agriculture‘s Natural Resources Conservation Service (NRCS
2004). The document‘s primary purpose is ―to provide conservationists with (1)
an estimated participation rate for the successful implementation of NRCS
conservation programs and projects, and (2) sociological information with which
to develop strategies for accelerating and increasing participation‖ (NRCS
2004:3). Even with such goals, the document recommends bringing local
stakeholders into the process only after site selection has occurred.
The NRCS publication has something in common with many publications
addressing participation in natural resource management and conservation:
They focus often on the publics in wealthy, industrialized settings (e.g., Genskow
150
2009; Hardy & Koontz 2009; Newig & Fritsch 2009). However, in many
instances the natural resources in the least degraded state are in remote areas
that are lacking in socio-economic resources such as educational facilities and
opportunities, infrastructure for basic hygiene such as running water, good
transportation, and so forth. In many instances, the residents are indigenous
people who do not share the dominant culture of the region or country. In fact,
95% of the Global 200 ecoregions have ‗ethnolinguistic groups,‘ largely
indigenous and traditional peoples, using or living in them (Oviedo et al. 2000).
Thus, the major differences between the NRCS‘s target population and the
populations of much of the world‘s focus on natural resource conservation make
this publication and many others of limited use in many situations.
Conservationists often come to communities with a pre-made plan to
protect the resources they deem in trouble. They introduce their plan—created
based on their ‗expert knowledge‘—as the best solution and expect, ideally, the
locals to agree. Local participation is often limited to community meetings or
workshops to discuss the plan and disseminate the information, knowledge, and
logic that support it from the conservationists‘ perspective, what Ntiamoa-Baidu
et al. of the Biodiversity Support Program term ‗passive participation‘ (2000:21).
Participation has the potential to include discussing options and cooperatively
coming to an agreement. But what happens if the locals do not feel their
participation is truly respected or that it has a meaningful effect?
151
Participation is much-touted as key to conservation and development
projects. However, the limited practices that often constitute ‗participation‘ and
our understanding of it bring up the question of how successful it can truly be. In
fact, Cooke and Kothari (2001) organized an entire book focused on
participation – and how participation itself can be a form of tyranny, especially
given the difficulty of achieving distance from one‘s own culture on the part of
the practitioners. People come with culturally-based definitions of ‗participation‘
that often determine what methods and tools they choose. Cooke and Kothari
also point out that the discourse around ‗participation‘ can be used to manipulate
people and disempower them by facilitating ―illegitimate and/or unjust exercise of
power‖ (2001:4). Those with power can use participation to reinforce their
authority by claiming that participants shared in decision making.
Theoretically, the goal of participatory approaches is to include the people
most affected in the process of making decisions key to them, their families, and
their ways of life (Kothari 2001). Participation attempts to return some decision-
making influence to those whose power has been appropriated by various
authorities and institutions (Guijt & Shaw 1998).
Mosse (2001) addresses the issue of what really happens when
institutions, authorities, and experts attempt to include local knowledge in
developing projects through participatory approaches: It creates a discourse that
supports upending power hierarchies by basing project planning on local
residents‘ knowledge and experience rather than on that of experts and
152
authorities. Through an example, he demonstrates how this transformation has
in fact not occurred, but rather, how those in power positions shape local
perceptions and knowledge. In the end, the dominant social and political powers
can use the participatory planning process to manipulate local people‘s
‗knowledge‘ (Mosse 2001).
Synthesis Becomes a Toolkit: Purpose of this Chapter
In light of such problematic ‗participatory approaches,‘ conservation must
find ways to go beyond the limitations of the concept of ‗participation‘ as it
stands in conservation today. Participation, cooperation, and even collaboration
are terms many people apply inexactly in natural resource management
(Plummer & FitzGibbon 2004), creating confusion about intentions, means, and
goals as well as power.
Some publications do address levels of participation and how to craft a
situation that engages people and provides empowering tools specifically for
working with indigenous people (e.g., Ntiamoa-Baidu et al. 2000; ). Often the
problem with these is that one must already know the literature exists and have
a good idea how to find it, including exactly what terms to search for and where,
in order to find useful information. For instance, accessing Slocum et al.‘s book
Power, Process and Participation: Tools for Change (1995) required knowing
part of the title and author in advance to find it and then requesting it via
interlibrary loan; the book had to be borrowed from another country and took 4
153
weeks to arrive. In contrast, a Google search for relevant literature yields an
overwhelming number of results but they are not always useful, in part because
the search terms are often necessarily vague and/or broad.
The most effective way to find many of the publications regarding
collaboration in natural resources is to check directly with the various
organizations and agencies that do related work. The World Wildlife Fund, the
Biodiversity Support Program, and others have some guidelines available, but
many do not have specific techniques and strategies, but are geared more
toward overall steps in collaborating (e.g., WWF 2010). The United Nations
Development Programme (UNDP) has produced some documents that appear
useful (e.g., UN 2010; UNDP 2011). But finding those documents requires
going to the UNDP Web site directly, which on further inspection do not have
many specific techniques applicable at the community level. Furthermore, a
search of the United Nations Environmental Programme publications, where a
natural resource professional is more likely to look, does not generate useful
results. So, a person not already somewhat knowledgeable about the resources
might be unable to find them.
This chapter has multiple goals. First, it defines appropriate and desirable
‗participation‘ in natural resource conservation, and second, it focuses on how to
work with stakeholders to co-create and nurture it. Finally, it is intended to be
practical, easy to read and apply, and readily accessible to anyone. The chapter
attempts to pulls theory, concepts, strategies, and techniques together in a
154
straightforward way that presents concrete ideas that are easy to modify and
apply to a variety of situations. It provides concrete suggestions that indigenous
people, conservation practitioners, or others can use to co-create situational
environments of equality, respect, and competence and consequently true
collaboration. In other words, this is a ‗toolkit‘ of techniques and activities to help
achieve the conditions that enable more effective natural resource conservation
over the long term.
To do this, I synthesize information, experience, and research from
multiple sources to create a brief but concrete collection of activities that can
facilitate co-construction of equality and collaboration, specifically with regard to
natural resource conservation. I compile previous work in natural resource
conservation, psychology, communication, and teaching to create the framework
of components that need to be addressed while describing techniques,
strategies, and activities that we can employ to facilitate conservation success.
I also incorporate knowledge I gained living and working around the
world. I have worked and lived in six countries. In Guyana, I spent most of the
year 2008 living in the interior region of the North Rupununi and conducting
research. I observed people, their interactions with each other and the physical
environment, and their lifestyles. During this time, I interviewed over 170
residents of 5 communities about natural resources, their values and
perceptions, and socio-demographic information. The research revealed that
the issues posed by these concepts and models do, in fact, impact these
155
communities (Weber, Chapters II & III, this volume). I include some vignettes
set in this region and context to illustrate some of the techniques and issues.
In the other countries, much of my time was spent in the education
systems. I have taught in Austria, the Czech Republic, Mexico, and the United
States, and in Austria, Germany, and the United States I have been a student.
The diversity of people and situations in my experiences has given me
considerable insight into and understanding of people, including a great variety
of practices for working well with them, even in stressful or high-stakes
situations, such as those involving natural resource management of any kind.
Clarifying the Terms: Definitions of Participation, Cooperation, &
Collaboration
To start with, defining the terms is necessary. According to Webster‘s
dictionary (1987:858), ‗participation‘ is ―the act of participating,‖ and to
participate is ―to take part‖ or ―to have a part or share in something.‖ In contrast,
‗cooperate‘ means ―to act or work together with another or others: act together‖
or ―to associate with another or others for mutual benefit‖ (Webster 1987:288).
‗Collaborate‘ is similarly defined as ―1 : to work jointly with others or together
esp. in an intellectual endeavor‖ (Webster 1987:259). Clearly, both cooperation
and collaboration go further than participation by demanding working together
toward joint goals and benefits. Participation can be satisfied by nearly any form
156
or level of including people, even simply giving them the opportunity to pose a
question or submit a written comment on a plan.
In some disciplines, collaboration is defined significantly differently than
cooperation. In the context of collaborative learning, Roschelle and Teasley
(1995:70) differentiate cooperation and collaboration by defining cooperation as
a hierarchichal division of tasks completed independently to reach a solution,
whereas collaboration focuses on ―mutual engagement of participants in a
coordinated effort to solve the problem together." The World Wildlife Fund takes
it further: ―a mutually beneficial relationship between two or more parties who
work toward common goals by sharing responsibility, authority, and
accountability for achieving results‖ (WWF 2000:3.2).
In order to create productive negotiating situations that promote mutual
understanding and thus empower multi-party decision making, we must get past
mere participation and even cooperation so we can collaborate toward co-
creation. ―[M]utual engagement‖ of the various parties is key to this, because
without engagement, the parties involved are not participating; they are not
working with each other to create a useful solution everyone can support over
time.
Concepts & Techniques
In this section, I introduce concepts that are key in creating a situational
environment conducive to more effective natural resource conservation (Ajzen
157
2009; Kaplan & Kaplan 2009; Leotti et al. 2010; Weber, Chapter III, this volume).
After briefly describing a concept and the related issues, I give suggestions of
activities and techniques that can be used to create the necessary components
for a very productive environment.
I do not intend this to be an exhaustive compilation of possibilities.
Instead, this focuses on the elements and encourages appropriate creativity to
pull all the groups in a given situation together. Many times in natural resource
negotiations multiple cultures are represented by education, community type
(e.g., urban or rural), age, gender, economics/livelihood, etc., in addition to the
more commonly considered differences of language, ethnic background, and
traditions. The different experiences and expectations of participants must be
weighed and addressed when planning how to work with a particular group and
to successfully address the various key elements.
A trained facilitator to guide the development of the collaboration is a
necessity. This person should be someone all parties can connect with and find
acceptable. Finding such a person can be a real challenge but is essential to
imbuing the process with reasonable neutrality and consequently the potential to
make decisions and effect real results.
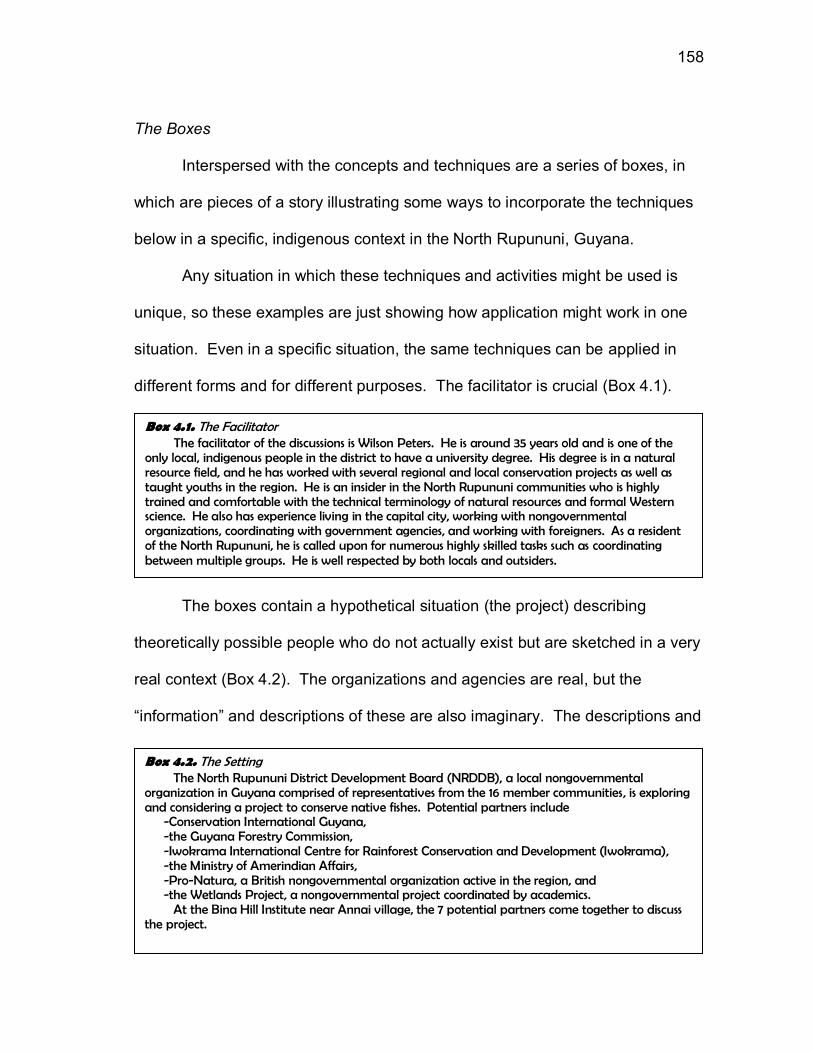
158
The Boxes
Interspersed with the concepts and techniques are a series of boxes, in
which are pieces of a story illustrating some ways to incorporate the techniques
below in a specific, indigenous context in the North Rupununi, Guyana.
Any situation in which these techniques and activities might be used is
unique, so these examples are just showing how application might work in one
situation. Even in a specific situation, the same techniques can be applied in
different forms and for different purposes. The facilitator is crucial (Box 4.1).
The boxes contain a hypothetical situation (the project) describing
theoretically possible people who do not actually exist but are sketched in a very
real context (Box 4.2). The organizations and agencies are real, but the
―information‖ and descriptions of these are also imaginary. The descriptions and
Box 4.1. The Facilitator The facilitator of the discussions is Wilson Peters. He is around 35 years old and is one of the
only local, indigenous people in the district to have a university degree. His degree is in a natural resource field, and he has worked with several regional and local conservation projects as well as taught youths in the region. He is an insider in the North Rupununi communities who is highly trained and comfortable with the technical terminology of natural resources and formal Western science. He also has experience living in the capital city, working with nongovernmental organizations, coordinating with government agencies, and working with foreigners. As a resident of the North Rupununi, he is called upon for numerous highly skilled tasks such as coordinating between multiple groups. He is well respected by both locals and outsiders.
Box 4.2. The Setting The North Rupununi District Development Board (NRDDB), a local nongovernmental
organization in Guyana comprised of representatives from the 16 member communities, is exploring and considering a project to conserve native fishes. Potential partners include
-Conservation International Guyana, -the Guyana Forestry Commission, -Iwokrama International Centre for Rainforest Conservation and Development (Iwokrama), -the Ministry of Amerindian Affairs, -Pro-Natura, a British nongovernmental organization active in the region, and -the Wetlands Project, a nongovernmental project coordinated by academics.
At the Bina Hill Institute near Annai village, the 7 potential partners come together to discuss the project.
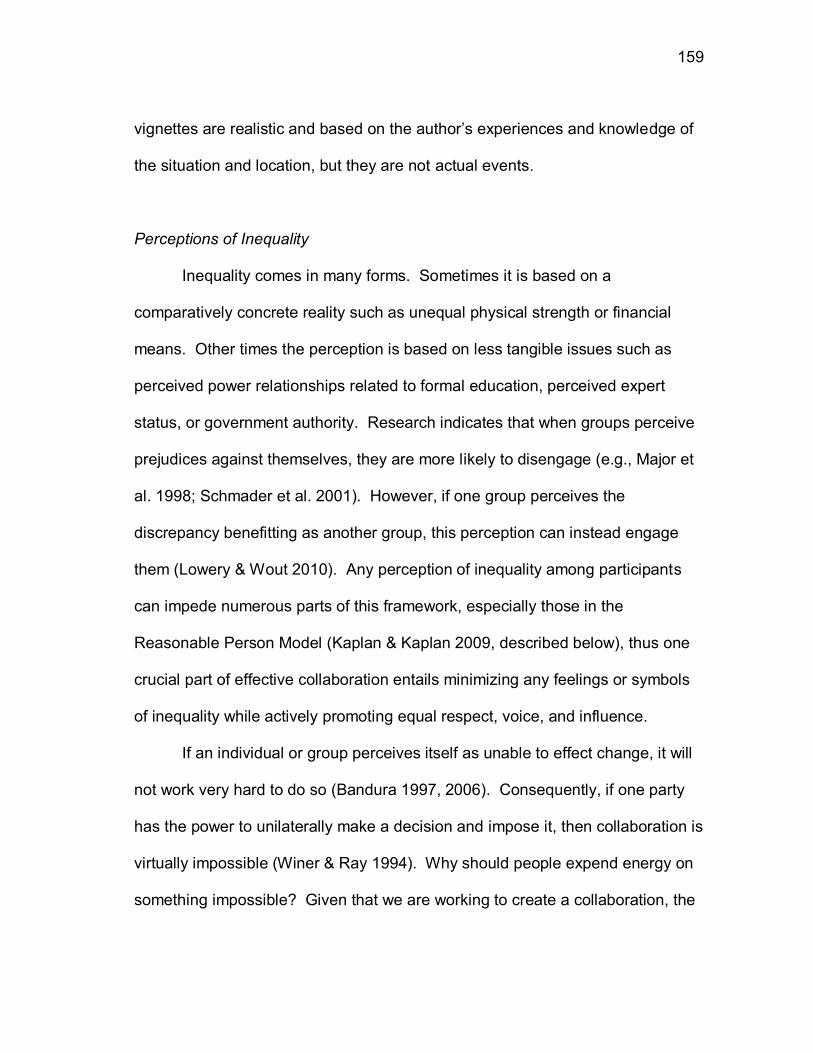
159
vignettes are realistic and based on the author‘s experiences and knowledge of
the situation and location, but they are not actual events.
Perceptions of Inequality
Inequality comes in many forms. Sometimes it is based on a
comparatively concrete reality such as unequal physical strength or financial
means. Other times the perception is based on less tangible issues such as
perceived power relationships related to formal education, perceived expert
status, or government authority. Research indicates that when groups perceive
prejudices against themselves, they are more likely to disengage (e.g., Major et
al. 1998; Schmader et al. 2001). However, if one group perceives the
discrepancy benefitting as another group, this perception can instead engage
them (Lowery & Wout 2010). Any perception of inequality among participants
can impede numerous parts of this framework, especially those in the
Reasonable Person Model (Kaplan & Kaplan 2009, described below), thus one
crucial part of effective collaboration entails minimizing any feelings or symbols
of inequality while actively promoting equal respect, voice, and influence.
If an individual or group perceives itself as unable to effect change, it will
not work very hard to do so (Bandura 1997, 2006). Consequently, if one party
has the power to unilaterally make a decision and impose it, then collaboration is
virtually impossible (Winer & Ray 1994). Why should people expend energy on
something impossible? Given that we are working to create a collaboration, the
160
parties involved need to have real power and influence, and thus, we need to
make sure they perceive the situation as relatively equal in spite of differences.
Thus, for techniques I will focus on some which minimize the negative aspects of
perceived inequalities.
Techniques to Turn Inequality into Equity
▪Establish equity: Winer and Ray (1994) propose that although different actors
have different powers, they can be balanced, and we should strive for equity
rather than equality. In fact, they make the point that each negotiator brings
different ‗goods‘ to the table in terms of power and the ability or potential to
accomplish a variety of things. These goods can be used together for creative
solutions using contributions from all parties. Discussing what each party has to
offer in the context of the situation at hand can help all parties perceive their own
as well as others‘ power and contribution potential.
▪Rules: Using key words such as ‗respect‘ and ‗trust,‘ the group can discuss and
define actions which exemplify each, both positively and negatively. For
example, punctuality might be an important part of respect in some groups as
time could be considered expensive; in other groups, punctuality might not be
practical or culturally relevant. If the group is mixed on its views, discussing the
terms and working together to create a relevant definition for the project
becomes even more important. With this as a starting place, basic rules can be
created for the project and related interactions.
161
▪Humor: In many cultures, sharing laughter minimizes personal differences of
many kinds, making other people seem more like us and maybe not as different
as we originally thought. This does not necessarily mean telling jokes or
creating silly situations to force laughter. Rather, this is really about creating a
relaxed environment so that people feel comfortable laughing when situations
present themselves. The common reaction to a situation or event can really
help us feel like we have something in common with others.
The Reasonable Person Model
Kaplan and Kaplan (2009) develop a psychological framework that is
based on the view that accounting for people‘s informational needs allows
people to interact with the world more effectively, facilitating our ability to help
ourselves. They posit that being reasonable is probably not a personal trait or
characteristic but rather the result of a situation that nurtures certain feelings in
people and consequently reasonable behavior. Here I present a brief overview
of their framework, the Reasonable Person Model (Kaplan & Kaplan 2009) and
suggest techniques to implement it.
The framework is an attempt to give practitioners the keys to deal with the
wide variety of circumstances that might come up. Instead of giving fixed steps
to follow, the focus is on the ‗environment‘—one of information and feelings
rather than natural resources—being created (Kaplan & Kaplan 2009).
162
The 3 basic components of the Reasonable Person Model are building
mental models, meaningful action, and being effective. The feedback loops
between the components spread the effects of each. For example, greater
feelings of competence (effectiveness) help alleviate feelings of confusion and
enable people to process more information (mental model), thus expanding their
areas of competence and making them feel they have more right to be listened
to and respected (action) (Kaplan & Kaplan 2009). On the other hand, if a
person does not understand the information being discussed (mental model),
she is likely to feel unable to contribute (action/effectiveness) and thus unworthy
of respect (action). Depending on the extent of the lack of understanding, she
may feel so incompetent and lacking in confidence that she is unwilling to
participate even by asking a question to help her understand.
Similarly, Senecah (2004) describes a schema incorporating the 3
components access, standing, and influence. While Senecah‘s individual
components are not exactly comparable to those in the Reasonable Person
Model (Kaplan & Kaplan 2009), overall the 2 theoretical models focus on the
same issues but structured differently. Likely these differences are largely due
to different disciplinary backgrounds: Senecah (2004) frames her theory in terms
of communication while Kaplan and Kaplan (2009) use psychology.
According to Kaplan and Kaplan (2009:331), mental models are ―a
simplified version of reality that one stores in one‘s head and uses to make
sense of things, to plan, and to evaluate possibilities.‖ When something
163
unfamiliar comes up, people choose one of their existing mental models as a
basic framework for organizing the new thing. Models are then modified as
people explore and understanding develops. In fact, we continuously update our
mental models (Kaplan & Kaplan 2009). Research shows that groups in which
members have more similar mental models, though not exactly the same ones,
are more successful in working toward relevant and meaningful action
(Grigorenko & Sternberg 2001) than those whose mental models differ more
(Carley 1997; Kraiger & Wenzel 1997; Mathieu et al. 2000; Zou & Lee 2010).
Meaningful action centers on taking an active part in accomplishing a
common goal in collaboration with others. This process involves achieving
respect and voice for oneself as well as for the others participating. Sometimes
this is a relatively simple and quick action, such as voting in a meeting, while
other actions might be time consuming or long term (Kaplan & Kaplan 2009).
Research substantiates the idea that working with others to achieve a common
goal that the participants feel is worthwhile is important to people and creates
satisfaction (Schroeder 2000).
Being effective focuses on ―achieving clear-headedness and enhancing
one‘s feeling of competence and confidence‖ (Kaplan & Kaplan 2009:332).
Competence leads to feelings of confidence, which help organize one‘s mind
and enhance perceptions of effectiveness (Kaplan & Kaplan 2009). An
additional factor involved in effectiveness is called ‗restorative environment.‘ It
refers to the time and situation which facilitate people recovering from mental
164
fatigue resulting from excessive use of directed attention in learning,
understanding, and being competent. We need to give our directed attention a
rest in order to rejuvenate our focus. To do so, we need to do something we
enjoy and that feels effortless to us. This can be a hobby, a visit in nature, or
even a relaxing conversation with people we enjoy, but resting from directed
attention pursuits is of critical importance (Kaplan & Kaplan 2009).
Techniques to Employ the Reasonable Person Model
▪Definitions: Early on participants can be asked to define basic key terms
through their own eyes. This is a starting point for the group to create communal
definitions. One could even start with simple definitions from an outside source
such as a dictionary. In particular, definitions which have controversial content
can really get participants discussing. Depending on the group composition and
size as well as comfort levels, the bulk of this discussion can be conducted with
the full group or in smaller groups with a concrete task, the results of which are
later shared with the full group. However, the definitions which result from this
and related tasks are only drafts and must continually be revisited as more
information, perspectives, etc., are added to the mental model(s).
▪Group work: Groups can be made in different sizes and combinations
depending on the participants and their levels of comfort in sharing, discussing,
and asking questions. Anytime groups are created, concrete tasks should be
assigned with a way to share the results with the full group. Writing their ideas,
in their own words, on large sheets of paper to post around the meeting room or
165
creating a complete list of the results that is photocopied and given to each
member both can work well. In my experience, a forum for discussing the
results is usually key to understanding them as well as for demonstrating respect
and increasing people‘s comfort for future activities.
▪Breaks: Everyone needs a breather. By allowing time for people to have a
minute alone to stop thinking, get a drink, use the restroom, have a snack, get a
breath of fresh air, or have a moment of friendly conversation, the participants
get a moment to rest from the intense focus of the process of co-creating long-
term conservation. This also allows people to assimilate and evaluate some of
the ideas and information before moving on to the next thing.
▪Individual Interviews: Sensitive information and/or information people might not
be readily able to communicate might be better discussed one-on-one. A few
minutes between the facilitator and each participant, especially in the very early
stages, can go a long way towards creating understanding in the facilitator while
engendering the feeling of being respected and important in each participant.
What the participant has to say is important enough for a personal consultation,
later to be shared with the group (probably anonymously). Thus, not only are
the ideas, knowledge, opinions, and individual mental models being tapped, but
the people are being listened to carefully and with obvious respect (Box 4.3).
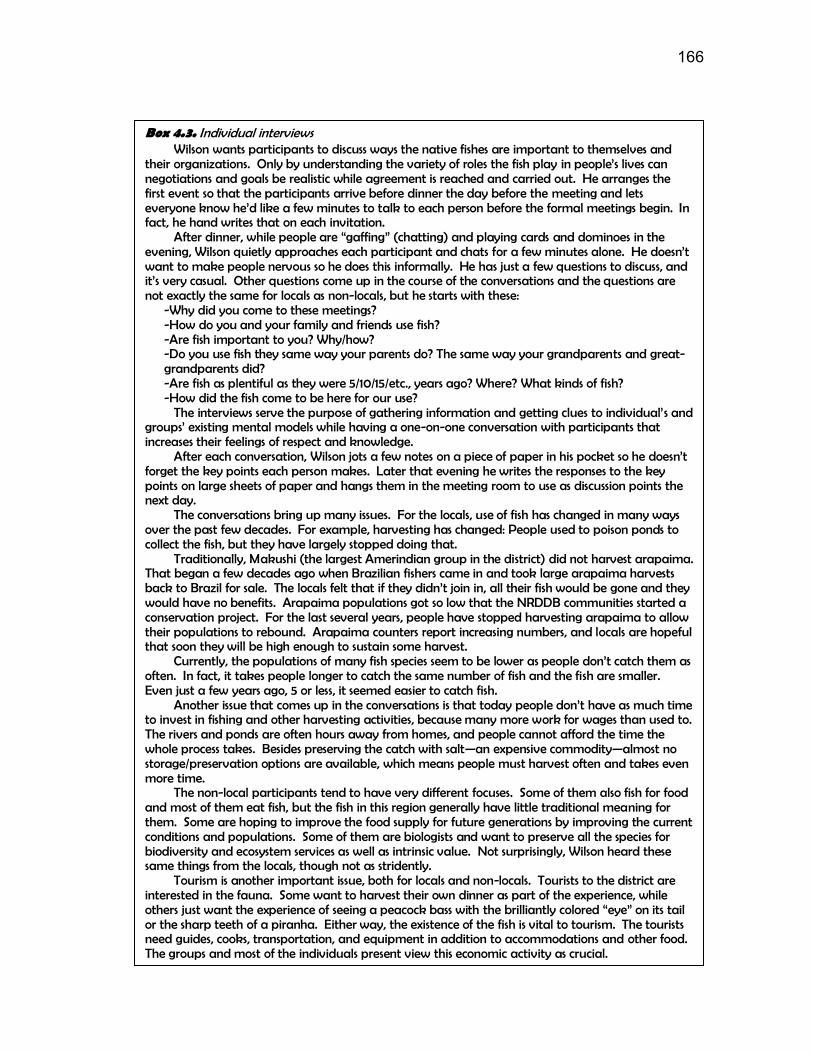
166
Box 4.3. Individual interviews Wilson wants participants to discuss ways the native fishes are important to themselves and
their organizations. Only by understanding the variety of roles the fish play in people‟s lives can negotiations and goals be realistic while agreement is reached and carried out. He arranges the first event so that the participants arrive before dinner the day before the meeting and lets everyone know he‟d like a few minutes to talk to each person before the formal meetings begin. In fact, he hand writes that on each invitation.
After dinner, while people are “gaffing” (chatting) and playing cards and dominoes in the evening, Wilson quietly approaches each participant and chats for a few minutes alone. He doesn‟t want to make people nervous so he does this informally. He has just a few questions to discuss, and it‟s very casual. Other questions come up in the course of the conversations and the questions are not exactly the same for locals as non-locals, but he starts with these:
-Why did you come to these meetings? -How do you and your family and friends use fish? -Are fish important to you? Why/how? -Do you use fish they same way your parents do? The same way your grandparents and great-grandparents did? -Are fish as plentiful as they were 5/10/15/etc., years ago? Where? What kinds of fish? -How did the fish come to be here for our use?
The interviews serve the purpose of gathering information and getting clues to individual‟s and groups‟ existing mental models while having a one-on-one conversation with participants that increases their feelings of respect and knowledge.
After each conversation, Wilson jots a few notes on a piece of paper in his pocket so he doesn‟t forget the key points each person makes. Later that evening he writes the responses to the key points on large sheets of paper and hangs them in the meeting room to use as discussion points the next day.
The conversations bring up many issues. For the locals, use of fish has changed in many ways over the past few decades. For example, harvesting has changed: People used to poison ponds to collect the fish, but they have largely stopped doing that.
Traditionally, Makushi (the largest Amerindian group in the district) did not harvest arapaima. That began a few decades ago when Brazilian fishers came in and took large arapaima harvests back to Brazil for sale. The locals felt that if they didn‟t join in, all their fish would be gone and they would have no benefits. Arapaima populations got so low that the NRDDB communities started a conservation project. For the last several years, people have stopped harvesting arapaima to allow their populations to rebound. Arapaima counters report increasing numbers, and locals are hopeful that soon they will be high enough to sustain some harvest.
Currently, the populations of many fish species seem to be lower as people don‟t catch them as often. In fact, it takes people longer to catch the same number of fish and the fish are smaller. Even just a few years ago, 5 or less, it seemed easier to catch fish.
Another issue that comes up in the conversations is that today people don‟t have as much time to invest in fishing and other harvesting activities, because many more work for wages than used to. The rivers and ponds are often hours away from homes, and people cannot afford the time the whole process takes. Besides preserving the catch with salt—an expensive commodity—almost no storage/preservation options are available, which means people must harvest often and takes even more time.
The non-local participants tend to have very different focuses. Some of them also fish for food and most of them eat fish, but the fish in this region generally have little traditional meaning for them. Some are hoping to improve the food supply for future generations by improving the current conditions and populations. Some of them are biologists and want to preserve all the species for biodiversity and ecosystem services as well as intrinsic value. Not surprisingly, Wilson heard these same things from the locals, though not as stridently.
Tourism is another important issue, both for locals and non-locals. Tourists to the district are interested in the fauna. Some want to harvest their own dinner as part of the experience, while others just want the experience of seeing a peacock bass with the brilliantly colored “eye” on its tail or the sharp teeth of a piranha. Either way, the existence of the fish is vital to tourism. The tourists need guides, cooks, transportation, and equipment in addition to accommodations and other food. The groups and most of the individuals present view this economic activity as crucial.
167
▪Setting the goals: As a group, the participants need to define their goal(s) for
the process. Everyone needs to understand and be in agreement with the
purpose. If the group does not set common goals, determining when or whether
the goals have been achieved will be impossible. As with the rest of the
process, the group members need to co-create their purpose, even if whoever
initiated the meetings and process had something specific in mind. The process
does not belong to the initiator but to all participants.
▪Someone else’s shoes: Role playing can give participants a chance to ―try on‖
another person‘s position and ideas, creating greater understanding of how
other‘s view things and feel about them. One way to do this is to create specific
personae based not on the group members themselves but perhaps on
theoretical group members. None of the participants should ―recognize‖
themselves as specific personae, but the personae should reflect real
characteristics, situations, and issues that the participants have so that a
persona could be someone at the meeting.
By creating only one-third or one-half as many personae as actual people
in the group, each persona has 2 – 3 people assigned to that role. Once the
roles are assigned, all of the people who are role A get together to discuss their
persona while all of the Bs do the same and so on. Once each role has time to
discuss and think through their views and opinions from the assigned
perspective, group discussions take place. Groups are made using 1 person
168
from each persona, thus 2 – 3 (or more) group discussions are taking place
simultaneously with each person engaged from the assigned role.
This activity gives people a chance to step out of themselves and look at
the situation from someone else‘s perspective. In doing so, they not only
distance themselves from their own positions but they can learn about others,
which helps them explore other perspectives and begin adding information about
those to their own mental models and to the shared one being created. (To be
most effective, this activity sometimes must be repeated with various scenarios,
especially if participants are not very skilled at empathy.)
▪ Voting: Even a poll involving raising hands to decide what time to break for
lunch can be action that is meaningful. Each participant is asked their opinion
and that is taken into equal consideration with everyone else‘s, which is also a
form of cooperation with others.
▪Field trips: Changing up the scenery can give everyone a mental rest, in
particular if it involves getting outside, moving around some, or seeing
something beautiful. Especially when people are working on natural resource
conservation, paying a visit to a related resource—perhaps a newly cut wildlife
viewing trail or checking out the problems with the river landing—can be a
productive way to give people a necessary mental break.
169
Perceived Knowledge
Perceived knowledge refers to what people believe they know. In
addition to verifiable facts—true or false—it includes beliefs about information
and perceptions of truth. Research has suggested that people‘s perceived
knowledge can have greater influence on their behaviors and action than actual
knowledge (Ajzen 2009). However, actual knowledge can become more
important when people need to make a decision, as they need to know what
results their actions might bring (Bord et al. 2000).
Techniques for Increasing Perceived Knowledge
▪Lists: If the people in the situation have solid knowledge—local, traditional,
Western scientific, any kind—about the topic of discussion, sometimes making a
list of what they know can make them feel more knowledgeable. For example,
for the term natural resources, participants can brainstorm different natural
resources around the area and discuss which are most important to the locals
and why. If a specific resource is the focus of discussion, a similar exercise can
focus on it. Additionally, people get exposed to the different knowledge sets and
even types of knowledge available in the group.
▪Questions: Once the facilitator is reasonably familiar with the group members,
their experiences and such, questions can be designed to get at their areas of
expertise as they might relate to the issue at hand. Open-ended questions that
elicit different knowledge from different participants and, better yet, lead to a
170
discussion, not only add to members‘ feelings of knowledge and competence but
can also extend people‘s mental maps in the process of knowledge sharing.
▪Mapping: Creating physical maps of the region, a resource, etc., can help
people share their knowledge, again reinforcing that they have significant
knowledge and competence while working with the group to create a physical
map which assists in developing the shared mental map. In an exercise like this
(as with all exercises and activities), however, facilitators have to be extremely
careful not to privilege certain concepts of maps or bring expectations which limit
what the maps should contain or how they should be structured (see Henkel &
Stirrat 2001).
Locus of Control
Locus of control refers to a person‘s perception of control in life or in a
dimension of life such as career, education, or family (Wang et al. 2010). It
forms a continuum with internal on one end and external on the other. An
internal locus of control indicates a feeling of control over one‘s life or aspects of
it. In contrast, externals believe the control is located outside of them and thus
believe their choices and actions have little to no effect on their lives and the
world around them (Rotter 1966). People appear to have a need to feel some
control over their surroundings (Ryan & Deci 2006) in order to feel effective,
which in turn promotes general wellbeing (Leotti et al. 2010). Because locus of
171
control and perceived choice are so closely related, the techniques for both are
listed after the section describing perceived choice below.
Perceived Choice
The perception of choice relates closely to perception of control.
Research indicates that when people feel they have a choice, they perceive
greater control (Leotti et al. 2010). This perception can benefit people even in
cases in which they do not have actual control or they do not exercise control
(Thompson 1981) as it can increase their confidence and feelings of success
(Henry & Sniezek 1993; Tafarodi et al. 1999) and leading to more actual
success in many situations (Cordova & Lepper 1996). In addition, choices that
seem positive increase the perception of control, particularly in people who have
a more internal locus of control (Harvey et al. 1974).
Techniques for Increasing Perception of Control and Choice
▪Reasoned veto: Bauer (1997) suggests that participants be trained in
consensus building in which a consensus is defined as reached when all
members of the group can respond ―yes‖ to the following 4 statements:
―I can live with the decision.
I understand the decision; it is clear, concrete and specific.
I contributed to the decision.
I will support the decision and do what I can to make it work‖ (Bauer
1997:14).
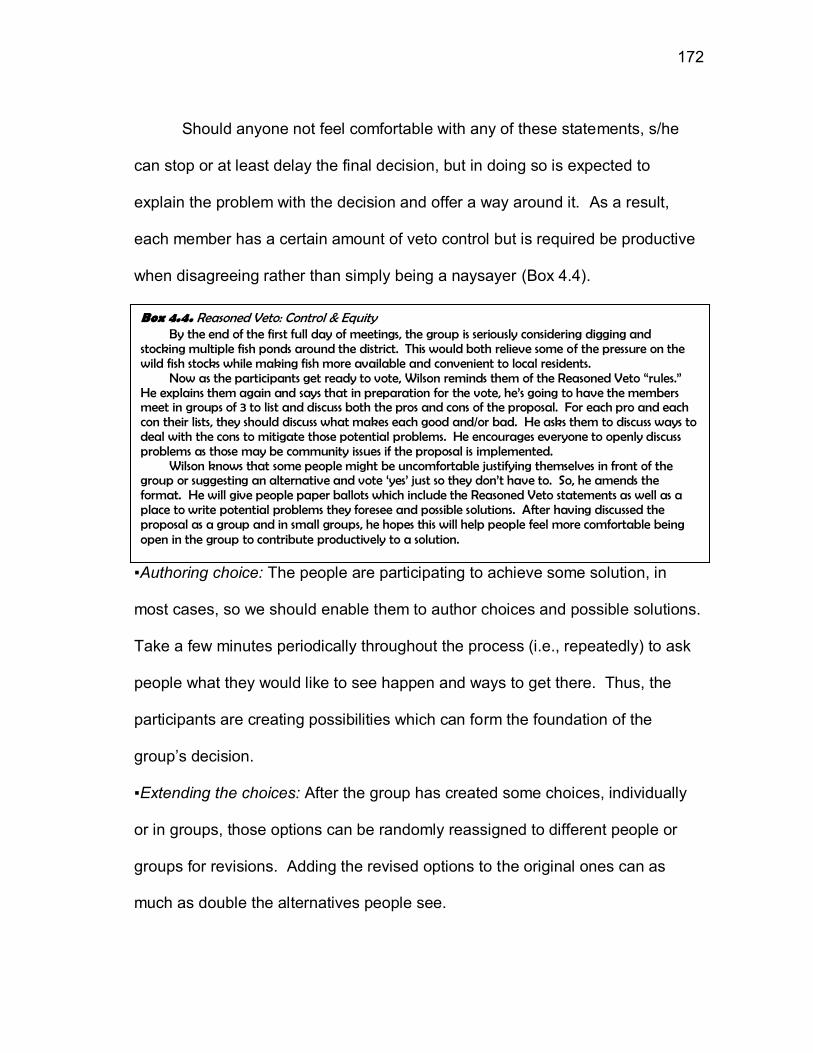
172
Should anyone not feel comfortable with any of these statements, s/he
can stop or at least delay the final decision, but in doing so is expected to
explain the problem with the decision and offer a way around it. As a result,
each member has a certain amount of veto control but is required be productive
when disagreeing rather than simply being a naysayer (Box 4.4).
▪Authoring choice: The people are participating to achieve some solution, in
most cases, so we should enable them to author choices and possible solutions.
Take a few minutes periodically throughout the process (i.e., repeatedly) to ask
people what they would like to see happen and ways to get there. Thus, the
participants are creating possibilities which can form the foundation of the
group‘s decision.
▪Extending the choices: After the group has created some choices, individually
or in groups, those options can be randomly reassigned to different people or
groups for revisions. Adding the revised options to the original ones can as
much as double the alternatives people see.
Box 4.4. Reasoned Veto: Control & Equity By the end of the first full day of meetings, the group is seriously considering digging and
stocking multiple fish ponds around the district. This would both relieve some of the pressure on the wild fish stocks while making fish more available and convenient to local residents.
Now as the participants get ready to vote, Wilson reminds them of the Reasoned Veto “rules.” He explains them again and says that in preparation for the vote, he‟s going to have the members meet in groups of 3 to list and discuss both the pros and cons of the proposal. For each pro and each con their lists, they should discuss what makes each good and/or bad. He asks them to discuss ways to deal with the cons to mitigate those potential problems. He encourages everyone to openly discuss problems as those may be community issues if the proposal is implemented.
Wilson knows that some people might be uncomfortable justifying themselves in front of the group or suggesting an alternative and vote „yes‟ just so they don‟t have to. So, he amends the format. He will give people paper ballots which include the Reasoned Veto statements as well as a place to write potential problems they foresee and possible solutions. After having discussed the proposal as a group and in small groups, he hopes this will help people feel more comfortable being open in the group to contribute productively to a solution.
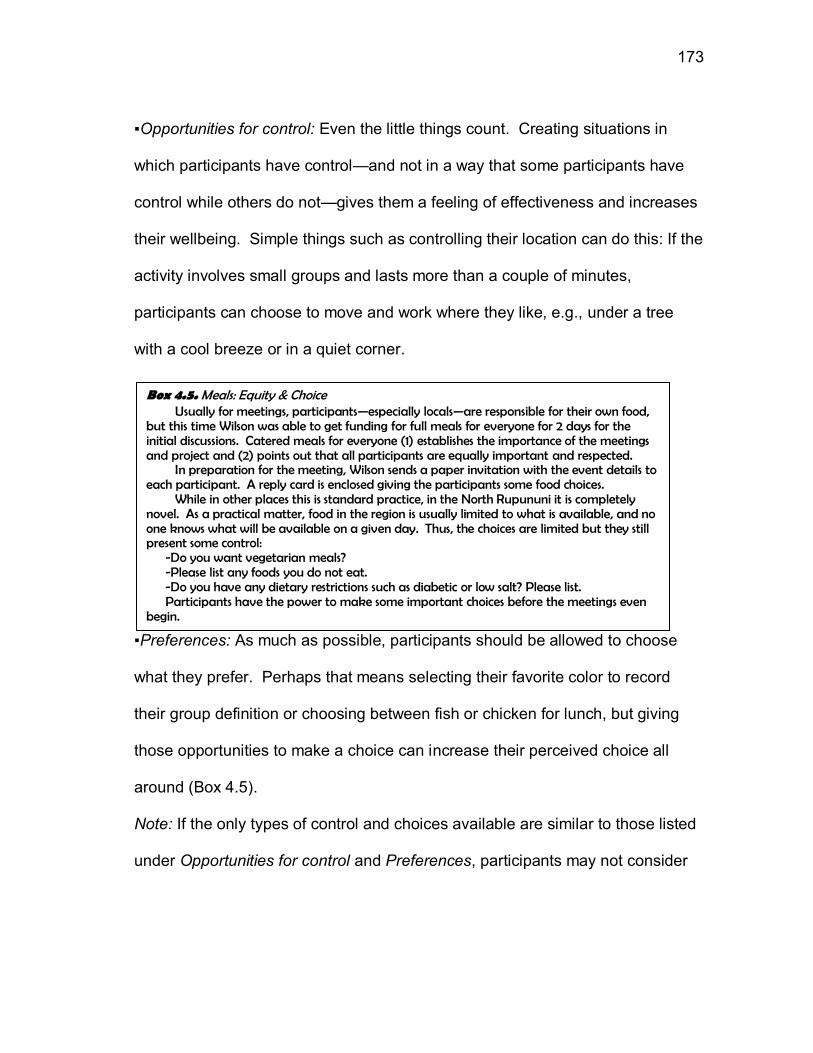
173
▪Opportunities for control: Even the little things count. Creating situations in
which participants have control—and not in a way that some participants have
control while others do not—gives them a feeling of effectiveness and increases
their wellbeing. Simple things such as controlling their location can do this: If the
activity involves small groups and lasts more than a couple of minutes,
participants can choose to move and work where they like, e.g., under a tree
with a cool breeze or in a quiet corner.
▪Preferences: As much as possible, participants should be allowed to choose
what they prefer. Perhaps that means selecting their favorite color to record
their group definition or choosing between fish or chicken for lunch, but giving
those opportunities to make a choice can increase their perceived choice all
around (Box 4.5).
Note: If the only types of control and choices available are similar to those listed
under Opportunities for control and Preferences, participants may not consider
Box 4.5. Meals: Equity & Choice Usually for meetings, participants—especially locals—are responsible for their own food,
but this time Wilson was able to get funding for full meals for everyone for 2 days for the initial discussions. Catered meals for everyone (1) establishes the importance of the meetings and project and (2) points out that all participants are equally important and respected.
In preparation for the meeting, Wilson sends a paper invitation with the event details to each participant. A reply card is enclosed giving the participants some food choices.
While in other places this is standard practice, in the North Rupununi it is completely novel. As a practical matter, food in the region is usually limited to what is available, and no one knows what will be available on a given day. Thus, the choices are limited but they still present some control:
-Do you want vegetarian meals? -Please list any foods you do not eat. -Do you have any dietary restrictions such as diabetic or low salt? Please list. Participants have the power to make some important choices before the meetings even
begin.
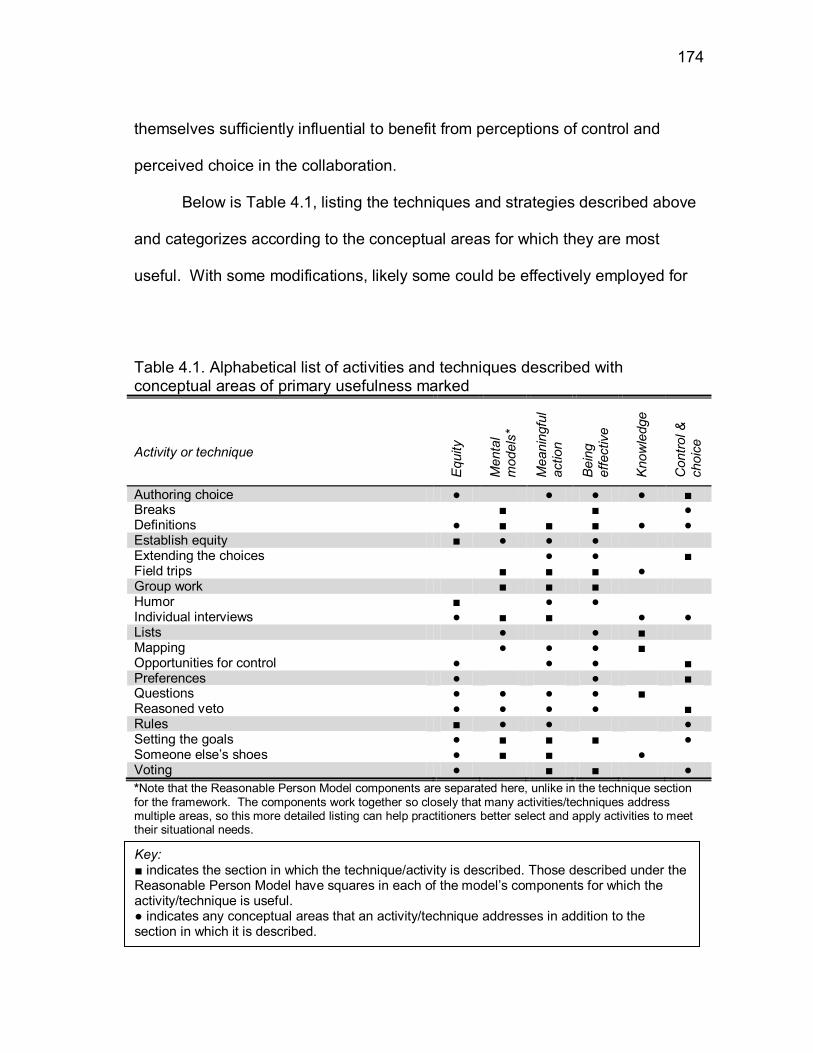
174
themselves sufficiently influential to benefit from perceptions of control and
perceived choice in the collaboration.
Below is Table 4.1, listing the techniques and strategies described above
and categorizes according to the conceptual areas for which they are most
useful. With some modifications, likely some could be effectively employed for
Table 4.1. Alphabetical list of activities and techniques described with conceptual areas of primary usefulness marked
Activity or technique
Equity
Menta
l m
odels
*
Meanin
gfu
l action
Bein
g
eff
ective
Know
ledge
Contr
ol &
choic
e
Authoring choice ● ● ● ● ■ Breaks ■ ■ ● Definitions ● ■ ■ ■ ● ● Establish equity ■ ● ● ● Extending the choices ● ● ■ Field trips ■ ■ ■ ● Group work ■ ■ ■ Humor ■ ● ● Individual interviews ● ■ ■ ● ● Lists ● ● ■ Mapping ● ● ● ■ Opportunities for control ● ● ● ■ Preferences ● ● ■ Questions ● ● ● ● ■ Reasoned veto ● ● ● ● ■ Rules ■ ● ● ● Setting the goals ● ■ ■ ■ ● Someone else‘s shoes ● ■ ■ ● Voting ● ■ ■ ●
*Note that the Reasonable Person Model components are separated here, unlike in the technique section for the framework. The components work together so closely that many activities/techniques address multiple areas, so this more detailed listing can help practitioners better select and apply activities to meet their situational needs.
Key: ■ indicates the section in which the technique/activity is described. Those described under the Reasonable Person Model have squares in each of the model‘s components for which the activity/technique is useful. ● indicates any conceptual areas that an activity/technique addresses in addition to the section in which it is described.
175
additional areas as well. Just as the list of techniques is far from exhaustive, the
ways to apply these techniques is also intended as a point of departure.
Another practical tool for applying this collaborative process applied in
Figure 4.1. This worksheet provides an outline of some of the primary aspects
that need to be considered in planning and offers a space to record what was
used as well as make notes about how the process unfolds and develops.
Conclusion
Collaboration is a way to enhance a situation for all participants. Through
sharing resources such as power, knowledge, understanding, and finances, all
participants can get more benefits. This chapter proposes conceptual areas of
focus and concrete techniques for achieving such benefits.
The toolkit developed provides suggestions not only for external groups
initiating projects with locals but can also be employed by locals. External
groups can use it to establish clarity and encourage participation leading to
negotiations and agreements that are more likely to be successfully
implemented. The process can help residents feel more competent, respected
and listened to, which makes them feel they participated in a meaningful way
and influenced the decisions made, increasing their ‗buy in.‘ Feeling influential
and part of the collaborative process also increases perceptions that
agreements are fair while improving actual understanding of the agreements
(Innes & Booher 1999), both of which increase the likelihood of project success.
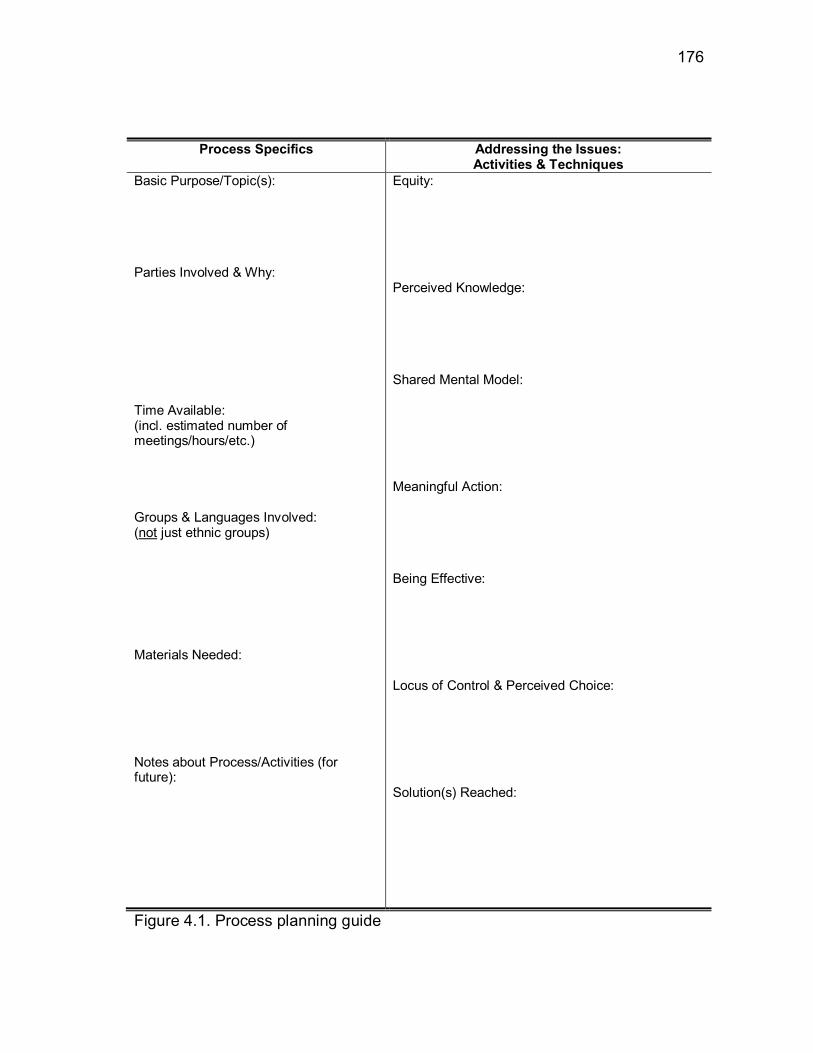
176
Process Specifics Addressing the Issues: Activities & Techniques
Basic Purpose/Topic(s): Parties Involved & Why: Time Available: (incl. estimated number of meetings/hours/etc.) Groups & Languages Involved: (not just ethnic groups) Materials Needed: Notes about Process/Activities (for future):
Equity: Perceived Knowledge: Shared Mental Model: Meaningful Action: Being Effective: Locus of Control & Perceived Choice: Solution(s) Reached:
Figure 4.1. Process planning guide
177
Local residents can empower themselves by requiring such a process
with outside groups seeking to influence natural resource decisions or when
initiating joint projects with external groups. The tools here can assist in
establishing more equity, mutual respect, understanding, and clarity among the
stakeholders, all of which help them improve their clarity about the situation,
especially regarding perceived knowledge and knowledge of choices and
solutions. Simultaneously, the tools can increase their perceived choices and
sense of internal control and influence. Thus, they are better able to negotiate
agreements that are in line with their society, lives and goals. They even gain
information about relevant topics and insights into the other parties that can
serve them well in the future.
In the end, all sides can benefit from the process. Everyone involved can
gain significant insight into the other participants‘ perspectives and
circumstances, allowing them to better consider the situation—and possibly
future situations—from the others‘ perspectives. As a result, everyone‘s
satisfaction with the decisions, agreements, or projects can be enhanced,
increasing the likelihood that they will result in effective and successful
conservation.
When conservation is successful, benefits are realized not only by the
parties directly involved in conservation but by all who benefit from the continued
and healthy existence of the resources.
178
CHAPTER V
SUMMARY
Natural resource conservation is a very complex and difficult process.
Natural resources are high stakes in many situations for numerous people, both
groups and individuals as well as powerful economic interests. Virtually
everything we have comes from natural resources, including basics such as
oxygen and water (WWF 2010). Some people harvest their subsistence directly
from the land while others are more removed from the resources that support
them, but their reliance is no smaller (MEA 2005). People also use natural
resources to generate income, often by harvesting the resources. Sometimes
large, multinational corporations are engaged in activities such as oil extraction
or logging, and in some cases the scale is much smaller and more local, such as
a family catching songbirds or fish to sell.
Because of the pivotal role of natural resources, control of access and
use is critical. Resource control and decision-making authority can translate into
additional economic and political power and influence (Harcourt 2006; Atal 2009;
Rudra & Jensen 2011). However, many resources are not discrete enough that
control or management can happen at individual or private levels. Usually, it
happens at larger scales, such as at the community, regional, or national level.
Natural resources are also notoriously disrespectful of political boundaries, so
international coordination is necessary in many cases (MEA 2005).
179
Clearly, with so many parties involved and their strong interests,
successful natural resource conservation requires effective collaboration. This
dissertation attempts to provide some useful insights into how to involve
stakeholders and how those involved can work together toward greater long-
term success in conservation. Not only natural resource professionals can
employ the findings and suggestions here, but local communities or other
stakeholders can also use them to make sure they are appropriately included in
the process of making decisions about natural resources.
This dissertation has two primary goals. The first is to examine and better
understand the socio-cultural conditions that facilitate natural resource
conservation. Secondly, I want to find ways to create and support such
conditions so that conservation can be more successful than it has been to date.
Conclusions
By examining the literature and analyzing my data from the North
Rupununi, I have come to the conclusion the following conditions can promote
better communication and negotiation, leading to more effective natural resource
conservation:
♦ Leveling the playing field of negotiation among all parties, regardless of
initial status;
♦ Ensuring that people feel empowered by emphasizing the different
kinds of knowledge, powers, influence, and choices they have;
180
♦ Co-creating a shared mental model or cognitive map of the terminology,
concepts, issues, and general situation to create common understanding
and help people feel knowledgeable;
♦ Making sure all the parties feel respected—that they have both a voice
to share with and that they are being listened to in a setting of
cooperation; and
♦ Fostering a comfortable situation so that confidence and competence
can surface to encourage active participation that people perceive as
meaningful.
Making participation in local natural resource organizations such as clubs
and other activities interesting, enjoyable, and rewarding can increase
participation. Participation, people‘s level of collectivism, and their level of
perceived knowledge appear to have the potential to work together and increase
engagement with regard to natural resources, though the relationships are not
clear.
Combining these components, we can create a situation that allows for
productive collaboration among the participating stakeholders to manage and
conserve natural resources with greater success. The parties will not only better
understand situations but are likely to perceive a greater stake in the success of
the program that results.
Some conservationists argue that the goals of many users of natural
resources are in direct conflict with the goals of conservation. Accordingly,
181
including users in the planning process could derail conservation outcomes
entirely (McClosky 1999; Oates 1999).
Other conservationists argue that such a collaborative process to include
stakeholders is too resource intensive to implement. Actually, the major
―resource‖ used seems to be time, as the conservation process takes a real
investment of time on the parts of everyone involved. The question then
becomes what is most effective over the long term, getting a conservation
program up and running as quickly as possible or taking the time to co-create
knowledge, understanding, relationships, and a solution to the conservation
issue. If the program is implemented swiftly but is not successful over time, then
the investment, generally a lot of money and technical expertise, might not yield
very good returns. On the other hand, if setting up a program requires a year
but the program has a foundation that people can build on and work with for
years of success, the extra time and manpower could be worth the results.
A single solution can not be a panacea; each situation requires an
individual assessment. In some cases, resources might be in such an
emergency state that immediate action is necessary. Even in that case,
authorities must be cautious about how they design and implement a solution,
even a temporary one. If people are neglected or abused in the process, the
consequences could be long-lasting distrust and other negative feelings that
could block collaboration and seriously impede natural resource conservation.
182
Future Research
Further research could provide serious benefits for natural resource
conservation. Firstly, the relationships among collectivism, knowledge,
perceived knowledge, participation, and education requires more thorough
investigation to attempt to understand the dynamics. The directionality and more
precise nature of these relationships could add significant usefulness to the
information, because they have the potential to give conservation professionals
a more concrete idea of how to build long-term, constructive settings for natural
resource conservation.
Whether variables mediate and/or moderate relationships to
environmental and conservation behavior or if a direct connection exists is an
important distinction (Baron & Kenny 1986). Perhaps the associations
measured here are not actually connections at all, but rather, the connections
are in relationships to third, unmeasured variables. Further information could be
truly useful in fostering effective conservation.
Another key area for continued research is to extend parallel research to
other cultural groups. Making instruments culturally appropriate in multiple
contexts is a genuine challenge, and success can be limited (Greenfield 1997;
Triandis 2000b). But a major point of importance is testing whether the
associations documented in previous chapters of this volume are specific to the
socio-cultural setting of the indigenous communities of the North Rupununi or
even to the 5 communities where the research was conducted. If similar results
183
are found in other socio-cultural groups and settings, exploring the emerging
patterns themselves as well as the number of contexts in which similar patterns
appear is key. Such investigations can lead to better understanding of how
people‘s basic psychological needs interact with conservation issues and affect
conservation behavior.
Attempting to clarify both the nature of the relationships themselves and
the extent to which these relationships appear to be present across cultures can
help conservation professionals appropriately activate the intrapersonal and
interpersonal factors that enable true collaboration. In doing so it can also
provide an opportunity to foster deep collaboration that by its very nature
includes and works to address the goals of all parties involved. Thus, the
research has the potential to improve interactions between individuals and
groups during all stages of natural resource conservation, bringing conservation
and development goals closer together and closer to being achieved.
184
LITERATURE CITED
Ajzen, I. 2009. Does sensible behavior depend on accurate knowledge? The
role of knowledge in the Theory of Planned Behavior. International
Conference on Small and Medium-sized Enterprises‘ (SMEs)
Organizational Behavior and Social Responsibility, Hangzhou, China.
Ali, A. 1987. Scaling an Islamic work ethic. Journal of Social Psychology
128:575-583.
Alphandery, P., and A. Fortier. 2001. Can a territorial policy be based on science
alone? The system for creating the Natura 2000 network in France.
Sociologia Ruralis 41:311–328.
Amazon Conservation Team. 2011. Participatory ethnographic mapping:
mapping indigenous lands. Available from
http://www.amazonteam.org/index.php/193/Participatory_Ethnographic_M
apping_Mapping_Indigenous_Lands (accessed April 2011).
Atal, M. 2009. India starts a water fight. Newsweek 154(25):10.
Bandura, A., C. B. Taylor, S. L. Williams, I. N. Mefford, and J. D. Barchas. 1985.
Catecholamine secretion as a function of perceived coping self-efficacy.
Journal of Consulting & Clinical Psychology 53:406-414.
Bandura, A. 1997. Self-efficacy: the exercise of control. W.H. Freeman, New
York, New York.
185
Bandura, A. 2006. Toward a psychology of human agency. Perspectives on
Psychological Science 1:164–180.
Barnes, J. I., J. E. Wall, D. Diaz, and P. Ballamingie. 2011. Missed
understandings: cultural and communication disconnects in indigenous
livelihood revitalization and conservation. Society & Natural Resources
24:972-983.
Baron, R. M., and D. A. Kenny. 1986. The mediator-moderator variable
distinction in social psychological research: conceptual, strategic, and
statistical considerations. Journal of Personality and Social Psychology
51:1173-1182.
Bauer, S. 1997. Creating a level playing field: structuring shared decision
making to promote authentic dialogue. Annual Meeting of the American
Educational Research Association, Chicago, Illinois.
Beltrán, J. 2000. Indigenous and traditional peoples and protected areas:
principles, guidelines and case studies. International Union for the
Conservation of Nature, Gland, Switzerland.
Bergen, L., and M. Carr. 2003. Establishing marine reserves: how can science
best inform policy? Environment 45:8-19.
Berger, I. 1997. The demographics of recycling and the structure of
environmental behavior. Environment and Behavior 29:515-531.
Bernard, H. R. 2000. Social research methods: qualitative and quantitative
approaches. Sage, Thousand Oaks, California.
186
Bierbrauer, G., H. Meyer, and U. Wolfradt. 1994. Measurement of normative and
evaluative aspects in individualistic and collectivistic orientations: the
Cultural Orientation Scale (COS). Pages 189-199 in U. Kim, H. C.
Triandis, C. Kagitcibasi, S. C. Choi and G. Yoon, editors. Individualism
and collectivism: theory, method, and applications. Sage, Thousand
Oaks, California.
Bord, R. J., R. E. O‘Connor, and A. Fisher. 2000. In what sense does the public
need to understand global climate change? Public Understanding of
Science 9:205-218.
Brandon, K., K. H. Redford, and S. E. Sanderson. 1998. Parks in peril: people,
politics and protected areas. The Nature Conservancy, Washington, D.C.
Brechin, S. R., P. R. Wilshusen, C. L. Fortwangler, and P. C. West. 2002.
Beyond the square wheel: toward a more comprehensive understanding
of biodiversity conservation as a social and political. Society and Natural
Resources 15:41-64.
Brosius, J. P., and D. Russell. 2003. Conservation from above: an
anthropological perspective on transboundary protected areas and
ecoregional planning. Journal of Sustainable Forestry 17:39-65.
Carley, K. M. 1997. Extracting team mental models through textual analysis.
Journal of Organizational Behavior 18:533-558.
187
Celinska, K. 2007. Individualism and collectivism in America: the case of gun
ownership and attitudes toward gun control. Sociological Perspectives
50:229-247.
Cernea, M. M. 1991. Putting people first: sociological variables in rural
development. Oxford University Press, New York, New York.
CIA (Central Intelligence Agency). 2011. World factbook: Guyana. Available
from https://www.cia.gov/library/publications/the-world-
factbook/geos/gy.html (accessed April 2011).
Chapin, M. 2004. A challenge to conservationists. World Watch 17:17-31.
Chen, X., M. N. Peterson, V. Hull, C. Lu, G. D. Lee, D. Hong, and J. Liu. 2011.
Effects of attitudinal and sociodemographic factors on pro-environmental
behaviour in urban China. Environmental Conservation 38:45-52.
Chew, K. H. 1996. Beyond individualism-collectivism: additional constructs to
consider. Unpublished doctoral dissertation, University of Oregon,
Eugene, Oregon.
Chung, S.-S., and M. M.-Y. Leung. 2007. The value-action gap in waste
recycling: the case of undergraduates in Hong Kong. Environmental
Management 40:603-612.
Clump, M. A., J. M. Brandel, and P. J. Sharpe. 2002. Differences in
environmental responsibility between materialistic groups. Psychologia
45:155-161.
188
Colchester, M. 2004. Conservation policy and indigenous peoples.
Environmental Science and Policy 7:145-153.
Conservation International. 2011. Indigenous and traditional peoples‘ program.
Available from
http://www.conservation.org/discover/centers_programs/itpp/pages/indige
nous_traditional_peoples.aspx (accessed May 2011).
Cooke, B., and U. Kothari. 2001. The case for participation as tyranny. Pages 1-
15 in B. Cooke and U. Kothari, editors. Participation: the new tyranny?
Zed Books, London, United Kingdom.
Cordova, D. I., and M. R. Lepper. 1996. Intrinsic motivation and the process of
learning: beneficial effects of contextualization, personalization, and
choice. Journal of Educational Psychology 88:715-730.
Costner, H. L. 1965. Criteria for measures of association. American Sociological
Review 30:341-353.
Crombez, G., C. Eccleston, P. De Vlieger, S. Van Damme, and A. De Clercq.
2008. Is it better to have controlled and lost or never to have controlled at
all? An experimental investigation of control over pain. Pain 137:631-639.
Dillman, D. A. 2000. Mail and Internet surveys: the tailored design method, 2nd
edition. Jon Wiley & Sons, New York, New York.
Dorfman, P., and J. P. Howell. 1988. Dimensions of national culture and
effective leadership patterns: Hofstede revisited. Pages 127-150 in R. N.
189
Farmer and E. G. McGoun, editors. Advances in International
Comparative Management. JAI Press, London, United Kingdom.
Dowie, M. 2009. Conservation refugees: the hundred-year conflict between
global conservation and native peoples. MIT Press, Cambridge,
Massachusetts.
Dunlap, R. E., and K. D. Van Liere. 1978. The ‗new environmental paradigm‘: a
proposed measuring instrument and preliminary results. Journal of
Environmental Education 9:10-19.
Earley, P. C. 1993. East meets West meets Mideast: further explorations of
collectivistic and individualistic work groups. Academy of Management
Journal 36:319-348.
Eisenstadt, T. A. 2006. Indigenous attitudes and ethnic identity construction in
Mexico. Mexican Studies/Estudios Mexicanos 22:107-129.
Erez, M. ,and P. C. Earley. 1989. Collectivism and Attitudes to Teamwork Scale.
Paper presented at the Academy of Management Conference,
Washington, D.C.
Fishbein, M. 1980. A theory of reasoned action: some applications and
implications. Pages 65-116 in H. E. Howe Jr. and M. M. Page, editors.
Nebraska Symposium on Motivation (1979). Vol. 27. University of
Nebraska Press, Lincoln, Nebraska.
190
Fraj, .E, and E. Martinez. 2006. Environmental values and lifestyles as
determining factors of ecological consumer behaviour: an empirical
analysis. Journal of Consumer Marketing 23:133-144.
Frankfort-Nachmias, C., and A. Leon-Guerrero. 2006. Social statistics for a
diverse society, 4th edition. Pine Forge Press, Thousand Oaks, California.
Freeman, M. A. 1997. Demographic correlates of individualism and collectivism:
a study of social values in Sri Lanka. Journal of Cross-Cultural
Psychology 28:321-341.
Fujii, S. 2006. Environmental concern, attitude toward frugality, and ease of
behavior as determinants of pro-environmental behavior intentions.
Journal of Environmental Psychology 26:262-268.
Gelfand, M. J., H. C. Triandis, and D. K. S. Chan. 1996. Individualism versus
collectivism or versus authoritarianism? European Journal of Social
Psychology 26:397-410.
Genskow, K. D. 2009. Catalyzing collaboration: Wisconsin‘s agency-initiated
basin partnerships. Environmental Management 43:411-424.
Goldman, M. 2003. Partitioned nature, privileged knowledge: community-based
conservation in Tanzania. Development and Change 34:833-862.
Gonsalves, J., T. Becker, A. Braun, D. Campilan, H. De Chavez, E. Fajber, M.
Kapiriri, J. Rivaca-Caminade, and R. Vernooy. 2005. Participatory
research and development for sustainable agriculture and natural
resource management: a sourcebook. Volume 1: Understanding
191
participatory research and development. International Potato Center-
Users‘ Perspectives With Agricultural Research and Development,
Laguna, Philippines and International Development Research Centre,
Ottawa, Canada. Available from http://idl-
bnc.idrc.ca/dspace/bitstream/10625/35115/1/120932_v1.pdf (accessed
May 2011).
Granek, E. F., E. M. P. Madin, M. A. Brown, W. Figueira, D. S. Cameron, Z.
Hogan, G. Kristianson, P. de Villiers, J. E. Williams, J. Post, S. Zahn, and
R. Arlinghaus. 2008. Engaging recreational fishers in management and
conservation: global case studies. Conservation Biology 22:125-1134.
Granzin. K. L., and J. E. Olsen. 1991. Characterizing participants in activities
protecting the environment: a focus on donating, recycling, and
conservation behaviors. Journal of Public Policy and Marketing 10:1-27.
Gray, A., A. Parellada, and H. Newing. 1997. Indigenous peoples and
biodiversity conservation in Latin America: from principles to practice.
International Work Group for Indigenous Affairs and Forest Peoples
Programme, Copenhagen, Denmark.
Greenfield, P. M. 1997. You can‘t take it with you. Why ability assessments don‘t
cross cultures. American Psychologist 52:1115-1124.
Grigorenko, E. L., and Sternberg, R. J. 2001. Family environment and
intellectual functioning: a life-span perspective. Lawrence Erlbaum,
Mahwah, New Jersey.
192
Guijt, I., and M. Shah. 1998. The myth of community: gender issues in
participatory development. IT Publications, London, United Kingdom.
Harcourt, W. 2006. Editorial: conflict, ecological justice and rights. Development
49(3):1-5.
Hardy, S. D., and T. M. Koontz. 2009. Rules for collaboration: institutional
analysis of group membership and levels of action in watershed
partnerships. The Policy Studies Journal 37:393-414.
Harvey, J. H., R. D. Barnes, D. L. Sperry, and B. Harris. 1974. Perceived choice
as a function of internal-external locus of control. Journal of Personality
42:437-452.
Helwig, C. C. 2006. The development of personal autonomy throughout cultures.
Cognitive Development 21:458-473.
Henkel, H., and R. Stirrat. 2001. Participation as spiritual duty; empowerment as
secular subjugation. Pages 168-184 in B. Cooke and U. Kothari, editors.
Participation: the new tyranny? Zed Books, London, United Kingdom.
Henry, R. A., and J. A. Sniezek. 1993. Situational factors affecting judgments of
future performance. Organizational Behavior and Human Decision
Processes 54:104-132.
Herrold-Menzies, M. 2006. Integrating conservation and development: what we
can learn from Caohai, China. Environment and Development 15:382-
406.
193
Hines, J. M., H. R. Hungerford, and A. N. Tomera. 1987. Analysis and synthesis
on research of responsible environmental behavior: a meta-analysis.
Journal of Environmental Education 18:1-8.
Hofstede, G. 1980. Culture‘s consequences: international differences in work-
related values. Sage, London, United Kingdom.
Hulme, D., and M. Murphree. 2001. African wildlife and livelihoods: the promise
and performance of community conservation. James Currey, Oxford,
United Kingdom.
Hunter, L. M., and J. M. Brehm. 2004. A qualitative examination of value
orientations toward wildlife and biodiversity by rural residents of the
Intermountain Region. Human Ecology Review 11:13-26.
Innes, J. E., and D. E. Booher. 1999. Consensus building and complex adaptive
systems: a framework for evaluating collaborative planning. Journal of
American Planning Association 65:412-423.
Iwokrama (Iwokrama International Centre for Rain Forest Conservation and
Development). 2007. GIS. Available at http://www.iwokrama.org/gis/
(accessed July 2007).
Iwokrama (Iwokrama International Centre for Rain Forest Conservation and
Development). 2011a. Iwokrama sustainable utilisation area: size and
location. Available at http://www.iwokrama.org/management/suasize.htm
(accessed March 2011).
194
Iwokrama (Iwokrama International Centre for Rain Forest Conservation and
Development). 2011b. Iwokrama wilderness preserve: size and location.
Available at http://www.iwokrama.org/management/wpsize.htm (accessed
March 2011).
Johnson, C. Y., J. M. Bowker, and H. K. Cordell. 2004. Ethnic variation in
environmental belief and behavior: an examination of the new ecological
paradigm in a social psychological context. Environment and Behavior
36:157-186.
Jung, J. M., and J. J. Kellaris. 2001. Measuring individualism and collectivism at
the level of the individual: preliminary report on the development and
assessment of a parsimonious scale. Paper presented at the American
Marketing Association, Winter 2001.
Jurin, R. R., and R. W. Fortner. 2002. Symbolic beliefs as barriers to responsible
environmental behavior. Environmental Education Research 8:373-394.
Kamanda, B., A. K. Angu, and J. Nguinguiri. 2003. The social value of the
Nayangkpe Sacred Forest of the Southwest Province of Cameroon.
Pages 77-89 in D. Harmon and A. Putney, editors. The full value of parks.
Rowman and Littlefield, Lanham, Maryland.
Kamath, S. J., and P. G. Oza. 2002. Encouraging tribal women to conserve
deciduous biodiversity. The Environmentalist 22:143-148.
195
Kaplan, S., and R. Kaplan. 2009. Creating a larger role for environmental
psychology: the Reasonable Person Model as an integrative framework.
Journal of Environmental Psychology 29:329-339.
Kilbourne, W., and G. Pickett. 2008. How materialism affects environmental
beliefs, concern, and environmentally responsible behavior. Journals of
Business Research 61:885-893.
Knussen, C., and F. Yule. 2008. ―I‘m not in the habit of recycling.‖ The role of
habitual behavior in the disposal of household waste. Environment and
Behavior 40:683-702.
Knussen, C., F. Yule, J. MacKenzie, and M. Wells. 2004. An analysis of
intentions to recycle household waste: The roles of past behaviour,
perceived habit, and perceived lack of facilities. Journal of Environmental
Psychology 24:237-246.
Kobayashi, E., H. R. Kerbo, and S. F. Sharp. 2010. Differences in individualistic
and collectivistic tendencies among college students in Japan and the
United States. International Journal of Comparative Sociology 51:59-84.
Kochanska, G., and N. Aksan. 2004. Development of a mutual responsiveness
between parents and their young children. Child Development 75:1657-
1676.
Kothari, U. 2001. Power, knowledge, and social control in participatory
development. Pages 139-152 in B. Cooke and U. Kothari, editors.
Participation: the new tyranny? Zed Books, London, United Kingdom.
196
Kraiger, K., and Wenzel, L. 1997. Conceptual development and empirical
evaluation of measures of shared mental models as indicators of team
effectiveness. Pages 63-84 in M. Brannick, E. Salas, and C. Prince,
editors. Team performance assessment and measurement. Lawrence
Erlbaum Associates, Mahwah, New Jersey.
Kurz, T., M. Linden, and N. Sheehy. 2007. Attitudinal and community influences
on participation in new curbside recycling initiatives in Northern Ireland.
Environment and Behavior 39:367-391.
Lefcourt, H. M. 1991. Locus of control. Pages 413-499 in J. P. Robinson, P. R.
Shaver, and L. S. Wrightsman, editors. Measures of personality and social
psychological attitudes. Vol. 1. Academic Press, San Diego, California.
Leotti, L. A., S. S. Iyengar, and K. N. Ochsner. 2010. Born to choose: the origins
and value of the need for control. Trends in Cognitive Sciences 14:457-
463.
Lowery, B. S. and D. A. Wout. 2010. When inequality matters: the effect of
inequality frames on academic engagement. Journal of Personality and
Social Psychology 98:956-966.
Maier, S. F., M. L. Laudenslager, and S. M. Ryan. 1985. Stressor controllability,
immune function, and endogenous opiates. Pages 183-201 in F. R. Brush
and J. B. Overmier, editors. Affect, conditioning, and cognition: essays on
the determinants of behavior: papers in honor of Richard L. Solomon.
Lawrence Erlbaum, Hillsdale, New Jersey.
197
Major, B., S. Spencer, T. Schmader, C. Wolfe, and J. Crocker. 1998. Coping
with negative stereotypes about intellectual performance: the role of
psychological disengagement. Personality and Social Psychology Bulletin
24:34-50.
Mannetti, L., A. Pierro, and S. Livi. 2004. Recycling: planned and self-expressive
behaviour. Journal of Environmental Psychology 24:227-236.
Mathieu, J. E., T. S. Heffner, G. F. Goodwin, E. Salas, E., and J. A. Cannon-
Bowers. 2000. The influence of shared mental models on team process
and performance. Journal of Applied Psychology 85:273–283.
McCarty, J. A., and L. J. Shrum. 1994. The recycling of solid wastes: personal
values, value orientations, and attitudes about recycling as antecedents
of recycling behavior. Journal of Business Research 30:53-62.
McCarty, J. A., and L. J. Shrum. 2001. The influence of individualism,
collectivism, and locus of control on environmental beliefs and behavior.
Journal of Public Policy and Marketing 20:93-104.
McClosky, M. 1999. Local communities and the management of public forests.
Ecology Law Quarterly 25:4.
MEA (Millenium Ecosystem Assessment). 2005. Ecosystems and human well-
being: synthesis. Island Press, Washington, DC.
Merriam-Webster OnLine. 2007. Available from http://www.merriam-
webster.com/ (accessed May 2007).
Microsoft Office Access 2007. 2006. Microsoft Corporation.
198
Mineka, S., and R. W. Henderson. 1985. Controllability and predictability in
acquired motivation. Annual Review of Psychology 36:495-529.
Minteer, B. A., and T. R. Miller. 2011. The new conservation debate: ethical
foundations, strategic trade-offs, and policy opportunities. Biological
Conservation 144:945-947.
Mosse, D. 2001. ‗People‘s knowledge‘, participation, and patronage: operations
and representations in rural development. Pages 16-35 in B. Cooke and
U. Kothari, editors. Participation: the new tyranny? Zed Books, London,
United Kingdom.
Mott MacDonald, and CEMCO. 2008. Georgetown - Lethem Road, Guyana pre-
feasibility study: final report. Available from
http://www.gina.gov.gy/GEORGETOWN-
LETHEM%20ROAD/07.%20Appendices%20-%20Chapters%2010-15.pdf
(accessed May 2011).
Nepal, S. K. 2002. Involving indigenous peoples in protected area management:
comparative perspectives from Nepal, Thailand, and China. Environmental
Management 30:748-763.
Newig, J., and O. Fritsch. 2009. Environmental governance: participatory, multi-
level – and effective? Environmental Policy and Governance 19:197-214.
Nicholson, E., et al. 2009. Priority research areas for ecosystem services in a
changing world. Journal of Applied Ecology 46:1139-1144.
199
NRCS (Natural Resources Conservation Service). 2004. Guide for estimating
participating in conservation programs and projects. Technical note,
series no. 1801, 2nd revision. East National Technical Support Center,
Greensboro, North Carolina.
NRDDB (North Rupununi District Development Board). 2005. North Rupununi
guidelines: community-based natural resource management. Draft version
of 7 June 2005. Bina Hill Institute, North Rupununi, Guyana.
Nordlund, A. M., and J. Garvill. 2002. Value structures behind proenvironmental
behavior. Environment and Behavior 34:740-756.
Ntiamoa-Baidu, Y., S. Zeba, D.-G. Mboje-Gamassa, and L. Bonnehin. 2000.
Principles in practice: staff observations of conservation projects in Africa.
Biodiversity Support Program, Washington, D.C.
Oates, J. 1999. Myth and reality in the rain forest. University of California Press,
Berkeley, California.
Oom do Valle, P., E. Rebelo, E. Reis, and J. Menezes. 2005. Combining
behavioral theories to predict recycling involvement. Environment and
Behavior 37:364-396.
Ouellette, J. A., and W. Wood. 1998. Habit and intention in everyday life: the
multiple processes by which past behavior predicts future behavior.
Psychological Bulletin 124:54-74.
Ousman, S., D. Macqueen, and G. Roberts. 2006. Stronger by association:
lessons from Guyana‘s forest-based associations. IIED Small and
200
Medium Forest Enterprise Series, No. 16. International Institute for
Environment and Development, Edinburgh, United Kingdom.
Oviedo, G., L. Maffi, and P. B. Larsen. 2000. Indigenous and traditional peoples
of the world and ecoregion conservation: an integrated approach to
saving the world‘s biological and cultural diversity. WWF-World Wide
Fund For Nature, Gland, Switzerland.
Oyserman, D. 1993. The lens of personhood: viewing the self and others in a
multicultural society. Journal of Personality and Social Psychology
65:993-1009.
Pathak, N., and A. Kothari. 2003. Community-conserved biodiversity areas:
Lessons from South Asia. Pages 211-226 in D. Harmon and A. Putney,
editors. The full value of parks. Rowman and Littlefield, Lanham,
Maryland.
PASW Statistics 18. 2009. SPSSInc.
Paulhus, D. L. 1991. Measurement and control of response bias. Pages 17-59 in
J. P. Robinson, P. R. Shaver, and L. S. Wrightsman, editors. Measures of
personality and social psychological attitudes. Vol. 1. Academic Press,
San Diego, California.
Peterson, M. N., M. J. Peterson, and T. R. Peterson. 2005. Conservation and
the myth of consensus. Conservation Biology 19:762-767.
201
Plummer, R., and J. FitzGibbon. 2004. Some observations on the terminology in
co-operative environmental management. Journal of Environmental
Management 70:63-72.
Posey, D. A. 1998. Indigenous peoples: missing links and lost knowledge in the
conservation of Brazil‘s tropical forests. Pages 113-124 in R.J. Hoage and
K. Moran, editors. Culture: the missing element in conservation and
development. Kendall/Hunt Publishing Co., Dubuque, Iowa.
Robson, M., J. Rosenthal, R. H. Lemelin, L. M. Hunt, N. McIntyre, and J. Moore.
2010. Information complexity as a constraint to public involvement in
sustainable forest management. Society and Natural Resources 23:1130-
1169.
Roschelle, J., and S. D. Teasley. 1995. The construction of shared knowledge
in collaborative problem solving. Pages 69-97 in C. E. O'Malley, editor.
Computer-supported collaborative Learning. Springer-Verlag, Berlin,
Germany.
Rotter, J. B. 1966. Generalized expectancies for internal versus external control
of reinforcement. Pages 1-28 in G. A. Kimble, editor. Psychological
monographs: general and applied. Vol. 80, No. 1. American Psychological
Association, Washington, D.C.
Rudra, N., and N. M. Jensen. 2011. Globalization and the politics of natural
resources. Comparative Political Studies 44:639-661.
202
Ryan, R. M., and E. L. Deci. 2006. Self-regulation and the problem of human
autonomy: does psychology need choice, self-determination, and will?
Journal of Personality 74:1557-1585.
Sachs, J. D., et al. 2009. Biodiversity conservation and the Millennium
Development Goals. Science 325:1502-1503.
Schmader, T., B. Major, and R. Gramzow. 2001. Coping with ethnic stereotypes
in the academic domain: perceived injustice and psychological
disengagement. Journal of Social Issues 57:93-111.
Schmidt-Soltau, K. 2004. The costs of rainforest conservation: local responses
towards integrated conservation and development projects in Cameroon.
Contemporary African Studies 22:93-117.
Schroeder, H. 2000. The restoration experience: volunteers‘ motives, values,
and concepts of nature. Pages 247-264 in P. H. Gobster and R. B. Hill,
editors. Restoring nature: perspectives from the social sciences and
humanities. Island Press, Washington, D.C.
Schultz, P. W., V. V. Gouveia, L. D. Cameron, G. Tankha, P. Schmuck, and M.
Franek. 2005. Values and their relationship to environmental concern and
conservation behavior. Journal of Cross-Cultural Psychology 36:457-475.
Schultz, P. W., and L. C. Zelezny. 1998. Values and proenvironmental
behaviour: a five-country survey. Journal of Cross-Cultural Psychology
29:540-558.
203
Scott, D. 1999. Equal opportunity, unequal results: determinants of household
recycling intensity. Environment and Behavior 31:267-290.
Senecah, S. L. 2004. The trinity of voice: the role of practical theory in planning
and evaluating the effectiveness of environmental participatory
processes. Pages 13-33 in S. P. Depoe, J. W. Delicath, and M.-F. A.
Elsenbeer, editors. Communication and public participation in
environmental decision making. State University of New York Press,
Albany, New York.
Shrum, L. J., T. M. Lowrey, and J. A. McCarty. 1994. Recycling as a marketing
problem: a framework for strategy development. Psychology and
Marketing 11:393-416.
Singelis, T. M. 1994. The measurement of independent and interdependent self-
construals. Personality and Social Psychology Bulletin 20:580-591.
Sinha, D., and R. C. Tripathi. 1994. Individualism in a collectivistic culture: a
case of coexistence of opposites. Pages 123-136 in U. Kim, H. C.
Triandis, C. Kagitcibasi, S.-C. Choi, and G. Yoon, editors. Individualism
and collectivism: theory, method, and applications. Sage, Thousand
Oaks, California.
Slocum, R., L. WIchhart, D. Rocheleau, and B. Thomas-Slayter. 1995.
Intermediate Technologies, London, United Kingdom.
204
Smith, P. B. 2004. Values and culture. Pages 633-640 in C. Spielberger, editor-
in-chief. Encyclopedia of applied psychology, vol. 3. Elsevier, San Diego,
California.
Somers, R. H. 1962. A new asymmetric measure of association for ordinal
variables. American Sociological Review 26:799-811.
Spector, P. E., J. I. Sanchez, O. L. Siu, J. Salgado, and J. Ma. 2004. Eastern
versus western control beliefs at work: an investigation of secondary
control, socioinstrumental control, and work locus of control in China and
the US. Applied Psychology 53:38-60.
Spiteri, A., and Nepal, S. K. 2006. Incentive-based conservation programs in
developing countries: a review of some key issues and suggestions for
improvements. Environmental Management 37:1-14.
Stern, P. C., T. Dietz, and G. A. Guagnano. 1995. The new environmental
paradigm in social psychological perspective. Environment and Behavior
27:723-745.
Stevens, S. 1997. Conservation through cultural survival: Indigenous peoples
and protected areas. Island Press, Washington, D.C.
Sullivan, M. W., and M. Lewis. 2003. Contextual determinants of anger and
other negative expressions in young infants. Developmental Psychology
39:693-705.
Suman, D., M. Shivlani, and J. Milon. 1999. Perceptions and attitudes regarding
marine reserves: a comparison of stakeholder groups in the Florida Keys
205
National Marine Sanctuary. Ocean & Coastal Management 42:1019-
1040.
Tafarodi, R. W., A. B. Milne, and A. J. Smith. 1999. The confidence of choice:
evidence for an augmentation effect on self-perceived performance.
Personality and Social Psychology Bulletin 25:1405-1416.
Terborgh, J. 1999. Requiem for nature. Island Press, Washington, D.C.
The Nature Conservancy. 2011a. Our initiatives. Available from
http://prod.nature.org/ourinitiatives/urgentissues/peopleandconservation/in
digenouspeople/index.htm (accessed May 2011).
The Nature Conservancy. 2011b. Our partners. Available from
http://prod.nature.org/aboutus/ourpartners/index.htm (accessed May 2011).
Thompson, S. C. 1981. Will it hurt less if I can control it? A complex answer to a
simple question. Psychological Bulletin 90:89-101.
Tipa, G., and R. Welch. 2006. Comanagement of natural resources: issues of
definition from an indigenous community perspective. Journal of Applied
Behavioral Science 42:373-391.
Triandis, H. C. 1993. Collectivism and individualism as cultural syndromes.
Cross-cultural Research 27:155-180.
Triandis, H. C. 1995. Individualism and collectivism. Westview Press, Boulder,
Colorado.
206
Triandis, H. C. 2000a. Collectivism and individualism. In A. E. Kazdin, editor,
Encyclopedia of psychology, vol. 2. American Psychological Association,
United States. DOI: 10.1037/10517-066.
Triandis, H. C. 2000b. Dialectics between cultural and cross-cultural psychology.
Asian Journal of Social Psychology 3:185-195.
Triandis, H. C., and M. J. Gelfand. 1998. Converging measurement of horizontal
and vertical individualism and collectivism. Journal of Personal and Social
Psychology 74:118-128.
UN (United Nations). 2010. Guidelines on stakeholder engagement in REDD+
readiness with a focus on the participation of indigenous peoples and
other forest-dependent communities (DRAFT – November 17, 2010).
Available at
http://www.beta.undp.org/content/dam/aplaws/publication/en/publications/
environment-energy/www-ee-library/local-development/draft-guidelines-
on-stakeholder-engagement-in-redd-readiness/UN-
REDD_Stakeholder_Guidelines_Note_Draft.pdf (accessed August 2011).
UNDP (United Nations Development Programme). 2011. Fast facts: fostering
inclusive participation. Available at
http://www.beta.undp.org/content/dam/undp/library/corporate/fast-
facts/english/FF-Inclusive-Participation.pdf (accessed August 2011).
207
Vicente, P., and E. Reis. 2007. Segmenting households according to recycling
attitudes in a Portuguese urban area. Resources, Conservation and
Recycling 52:1-12.
Vining, J., and A. Ebreo. 1990. What makes a recycler? A comparison of
recyclers and nonrecyclers. Environment and Behavior 22:55-73.
Vining, J., and A. Ebreo. 1992. Predicting recycling behavior from global and
specific environmental attitudes and changes in recycling opportunity.
Journal of Applied Social Psychology 22:1580-1607.
Wang, Q., N. A. Bowling, and K. J. Eschleman. 2010. A meta-analytic of work
and general locus of control. Journal of Applied Psychology 95:761-768.
Webster. 1987. Webster‘s Ninth New Collegiate Dictionary. Merriam-Webster,
Springfield, Massachusetts.
West, P., and D. Brockington. 2006. An anthropological perspective on some
unexpected consequences of protected areas. Conservation Biology
20:609-616.
West, P., J. Igoe, and D. Brockington. 2006. Parks and people: the social
impacts of protected areas. Annual Review of Anthropology 35:251-277.
Western, D., and R. M. Wright. 1994. Natural connections: perspectives in
community-based conservation. Island Press, Washington, D.C.
Whorf, B. L. 1940, republished 1956. Science and linguistics. Pages 207-219 in
J. B. Carroll, editor. Language, thought, and reality: selected writings of
Benjamin Lee Whorf. MIT Press, Cambridge, Massachusetts.
208
Wilshusen, P. R., S. R. Brechin, C. L. Fortwangler, and P. C. West. 2002.
Reinventing a square wheel: critique of a resurgent ―protection paradigm‖
in international biodiversity conservation. Society and Natural Resources
15:17-40.
Winer, M., and K. Ray. 1994. Collaboration handbook: creating, sustaining, and
enjoying the journey. Amherst H. Wilder Foundation, St. Paul, Minnesota.
WWF (World Wildlife Fund), 2000. Stakeholder collaboration: building bridges
for conservation. World Wildlife Fund, Washington, D.C.
WWF (World Wildlife Fund). 2010. Living planet report 2010: biodiversity,
biocapacity and development. World Wildlife Fund International, Gland,
Switzerland.
Wyckoff-Baird, B. 2000. Environmental governance: lessons from the Ju/‘hoan
Bushmen in Northeastern Namibia. Pages 113-135 in R. Weber, J. Butler
and P. Larson, editors. Indigenous peoples and conservation
organizations: experiences in collaboration. World Wildlife Fund, Gland,
Switzerland.
Yi, J.-S. 2004. Individualism-collectivism: a geographical comparison among
cities in Korea and the United States. Journal of Language for International
Business 15:19-33.
Yoo, S.-K. 1996. Individualism-collectivism, attribution styles of mental illness,
depression symptomatology, and attitudes toward seeking professional
209
help: A comparative study between Koreans and Americans. Unpublished
doctoral dissertation, University of Minnesota, Twin Cities, Minnesota.
Zou, T., and W. B. Lee. 2010. A study of the similarity in mental models and
team performance. Pages 536-544 in Proceedings of the International
Conference on Intellectual Capital, Knowledge Management &
Organizational Learning 2010.
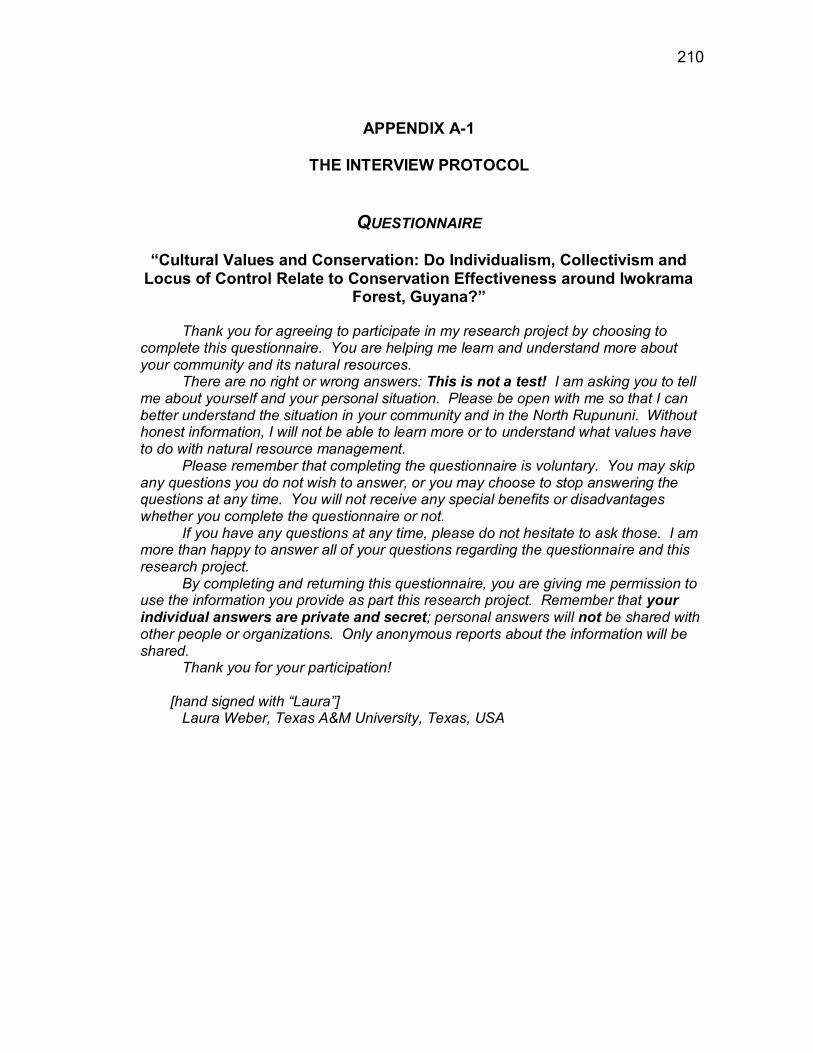
210
APPENDIX A-1
THE INTERVIEW PROTOCOL
QUESTIONNAIRE
“Cultural Values and Conservation: Do Individualism, Collectivism and Locus of Control Relate to Conservation Effectiveness around Iwokrama
Forest, Guyana?”
Thank you for agreeing to participate in my research project by choosing to complete this questionnaire. You are helping me learn and understand more about your community and its natural resources.
There are no right or wrong answers: This is not a test! I am asking you to tell me about yourself and your personal situation. Please be open with me so that I can better understand the situation in your community and in the North Rupununi. Without honest information, I will not be able to learn more or to understand what values have to do with natural resource management.
Please remember that completing the questionnaire is voluntary. You may skip any questions you do not wish to answer, or you may choose to stop answering the questions at any time. You will not receive any special benefits or disadvantages whether you complete the questionnaire or not.
If you have any questions at any time, please do not hesitate to ask those. I am more than happy to answer all of your questions regarding the questionnaire and this research project.
By completing and returning this questionnaire, you are giving me permission to use the information you provide as part this research project. Remember that your individual answers are private and secret; personal answers will not be shared with other people or organizations. Only anonymous reports about the information will be shared.
Thank you for your participation! [hand signed with “Laura”]
Laura Weber, Texas A&M University, Texas, USA
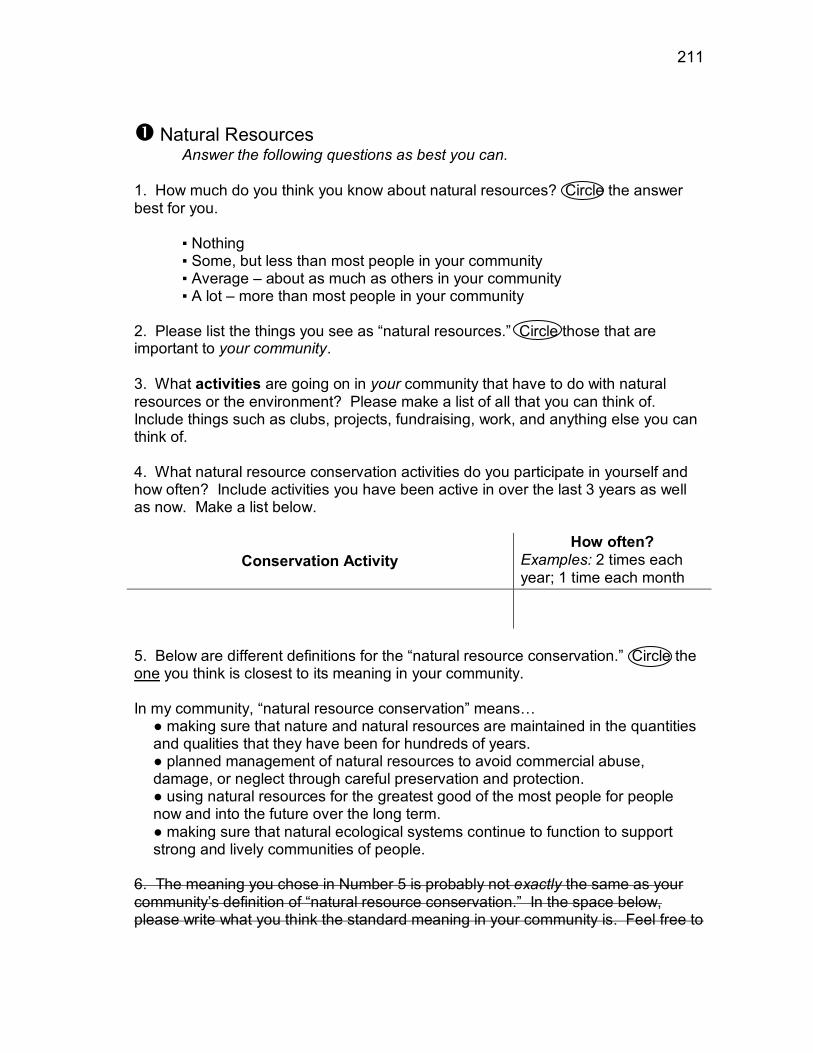
211
Natural Resources Answer the following questions as best you can.
1. How much do you think you know about natural resources? Circle the answer best for you. ▪ Nothing
▪ Some, but less than most people in your community ▪ Average – about as much as others in your community ▪ A lot – more than most people in your community
2. Please list the things you see as ―natural resources.‖ Circle those that are important to your community. 3. What activities are going on in your community that have to do with natural resources or the environment? Please make a list of all that you can think of. Include things such as clubs, projects, fundraising, work, and anything else you can think of. 4. What natural resource conservation activities do you participate in yourself and how often? Include activities you have been active in over the last 3 years as well as now. Make a list below.
Conservation Activity
How often? Examples: 2 times each year; 1 time each month
5. Below are different definitions for the ―natural resource conservation.‖ Circle the one you think is closest to its meaning in your community. In my community, ―natural resource conservation‖ means…
● making sure that nature and natural resources are maintained in the quantities and qualities that they have been for hundreds of years. ● planned management of natural resources to avoid commercial abuse, damage, or neglect through careful preservation and protection. ● using natural resources for the greatest good of the most people for people now and into the future over the long term. ● making sure that natural ecological systems continue to function to support strong and lively communities of people.
6. The meaning you chose in Number 5 is probably not exactly the same as your community‘s definition of ―natural resource conservation.‖ In the space below, please write what you think the standard meaning in your community is. Feel free to
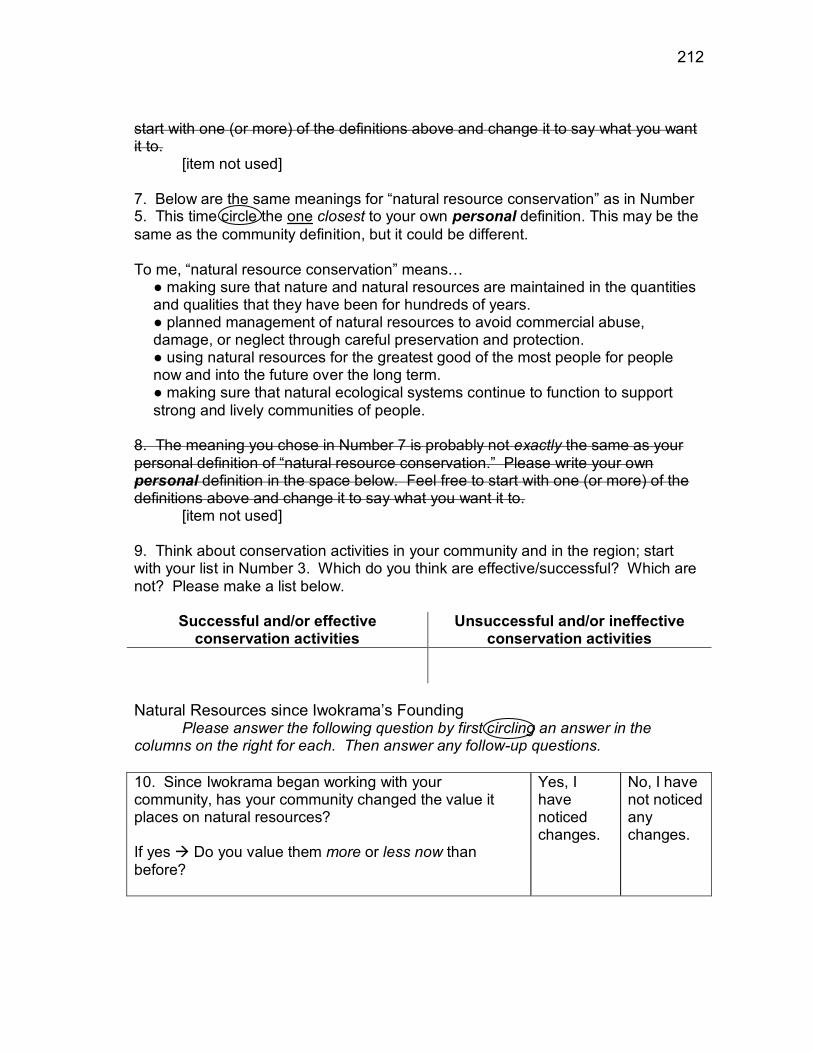
212
start with one (or more) of the definitions above and change it to say what you want it to. [item not used] 7. Below are the same meanings for ―natural resource conservation‖ as in Number 5. This time circle the one closest to your own personal definition. This may be the
same as the community definition, but it could be different. To me, ―natural resource conservation‖ means…
● making sure that nature and natural resources are maintained in the quantities and qualities that they have been for hundreds of years. ● planned management of natural resources to avoid commercial abuse, damage, or neglect through careful preservation and protection. ● using natural resources for the greatest good of the most people for people now and into the future over the long term. ● making sure that natural ecological systems continue to function to support strong and lively communities of people.
8. The meaning you chose in Number 7 is probably not exactly the same as your personal definition of ―natural resource conservation.‖ Please write your own personal definition in the space below. Feel free to start with one (or more) of the definitions above and change it to say what you want it to. [item not used] 9. Think about conservation activities in your community and in the region; start with your list in Number 3. Which do you think are effective/successful? Which are not? Please make a list below.
Successful and/or effective conservation activities
Unsuccessful and/or ineffective conservation activities
Natural Resources since Iwokrama‘s Founding
Please answer the following question by first circling an answer in the columns on the right for each. Then answer any follow-up questions.
10. Since Iwokrama began working with your community, has your community changed the value it places on natural resources? If yes Do you value them more or less now than before?
Yes, I have noticed changes.
No, I have not noticed any changes.
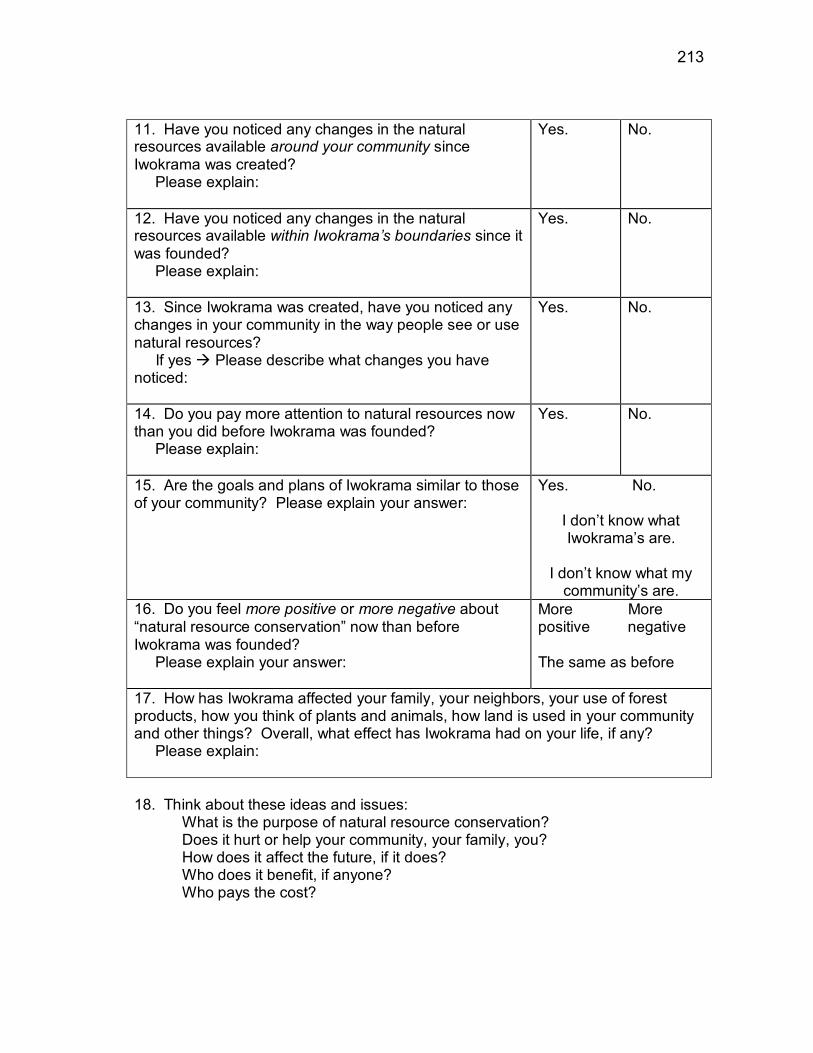
213
11. Have you noticed any changes in the natural resources available around your community since Iwokrama was created? Please explain:
Yes. No.
12. Have you noticed any changes in the natural resources available within Iwokrama’s boundaries since it was founded? Please explain:
Yes. No.
13. Since Iwokrama was created, have you noticed any changes in your community in the way people see or use natural resources? If yes Please describe what changes you have noticed:
Yes. No.
14. Do you pay more attention to natural resources now than you did before Iwokrama was founded? Please explain:
Yes. No.
15. Are the goals and plans of Iwokrama similar to those of your community? Please explain your answer:
Yes. No.
I don‘t know what Iwokrama‘s are.
I don‘t know what my
community‘s are.
16. Do you feel more positive or more negative about ―natural resource conservation‖ now than before Iwokrama was founded? Please explain your answer:
More More positive negative The same as before
17. How has Iwokrama affected your family, your neighbors, your use of forest products, how you think of plants and animals, how land is used in your community and other things? Overall, what effect has Iwokrama had on your life, if any? Please explain:
18. Think about these ideas and issues:
What is the purpose of natural resource conservation? Does it hurt or help your community, your family, you? How does it affect the future, if it does? Who does it benefit, if anyone? Who pays the cost?
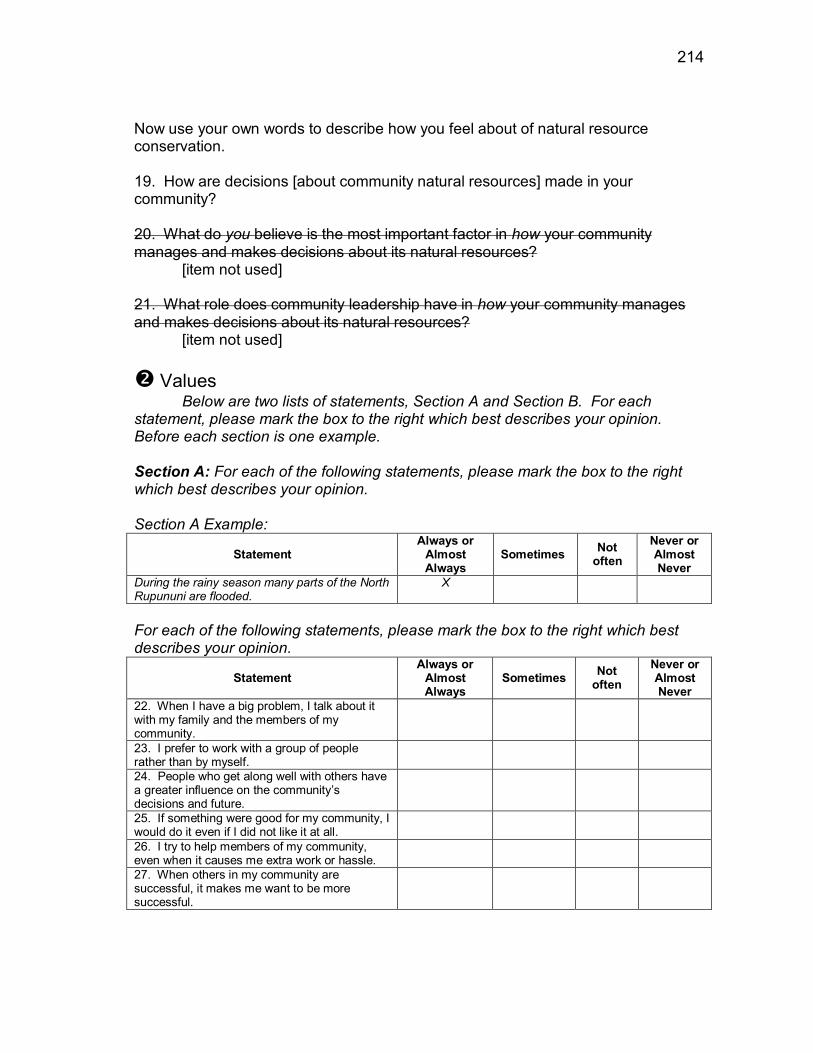
214
Now use your own words to describe how you feel about of natural resource conservation. 19. How are decisions [about community natural resources] made in your community? 20. What do you believe is the most important factor in how your community manages and makes decisions about its natural resources? [item not used] 21. What role does community leadership have in how your community manages and makes decisions about its natural resources? [item not used]
Values Below are two lists of statements, Section A and Section B. For each
statement, please mark the box to the right which best describes your opinion. Before each section is one example. Section A: For each of the following statements, please mark the box to the right which best describes your opinion. Section A Example:
Statement Always or
Almost Always
Sometimes Not
often
Never or Almost Never
During the rainy season many parts of the North Rupununi are flooded.
X
For each of the following statements, please mark the box to the right which best describes your opinion.
Statement Always or
Almost Always
Sometimes Not
often
Never or Almost Never
22. When I have a big problem, I talk about it with my family and the members of my community.
23. I prefer to work with a group of people rather than by myself.
24. People who get along well with others have a greater influence on the community‘s decisions and future.
25. If something were good for my community, I would do it even if I did not like it at all.
26. I try to help members of my community, even when it causes me extra work or hassle.
27. When others in my community are successful, it makes me want to be more successful.
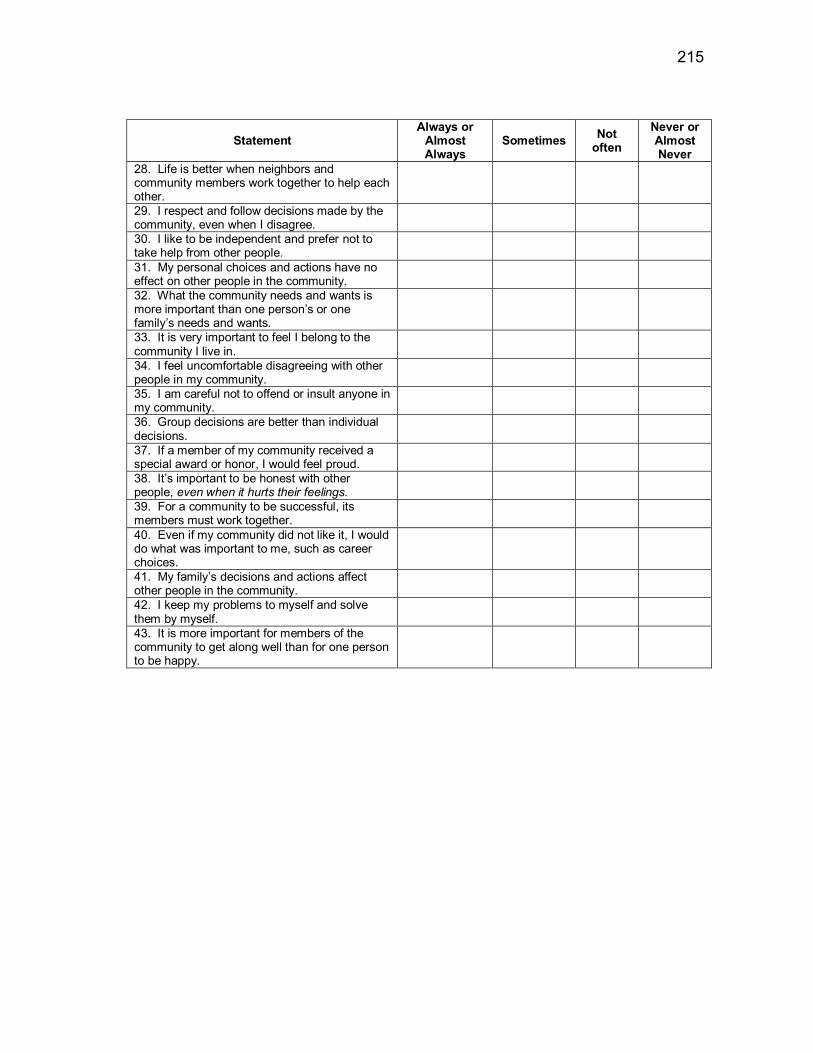
215
Statement Always or
Almost Always
Sometimes Not
often
Never or Almost Never
28. Life is better when neighbors and community members work together to help each other.
29. I respect and follow decisions made by the community, even when I disagree.
30. I like to be independent and prefer not to take help from other people.
31. My personal choices and actions have no effect on other people in the community.
32. What the community needs and wants is more important than one person‘s or one family‘s needs and wants.
33. It is very important to feel I belong to the community I live in.
34. I feel uncomfortable disagreeing with other people in my community.
35. I am careful not to offend or insult anyone in my community.
36. Group decisions are better than individual decisions.
37. If a member of my community received a special award or honor, I would feel proud.
38. It‘s important to be honest with other people, even when it hurts their feelings.
39. For a community to be successful, its members must work together.
40. Even if my community did not like it, I would do what was important to me, such as career choices.
41. My family‘s decisions and actions affect other people in the community.
42. I keep my problems to myself and solve them by myself.
43. It is more important for members of the community to get along well than for one person to be happy.
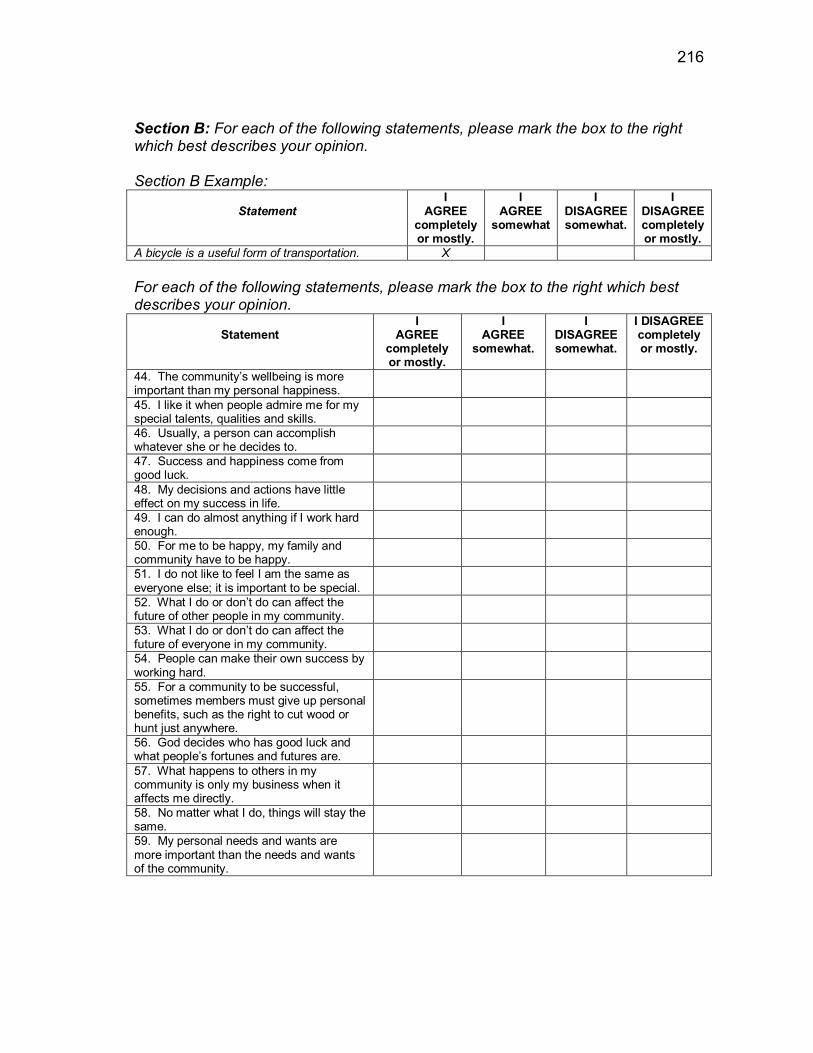
216
Section B: For each of the following statements, please mark the box to the right which best describes your opinion. Section B Example:
Statement
I AGREE
completely or mostly.
I AGREE
somewhat
I DISAGREE somewhat.
I DISAGREE completely or mostly.
A bicycle is a useful form of transportation. X
For each of the following statements, please mark the box to the right which best describes your opinion.
Statement
I AGREE
completely or mostly.
I AGREE
somewhat.
I DISAGREE somewhat.
I DISAGREE completely or mostly.
44. The community‘s wellbeing is more important than my personal happiness.
45. I like it when people admire me for my special talents, qualities and skills.
46. Usually, a person can accomplish whatever she or he decides to.
47. Success and happiness come from good luck.
48. My decisions and actions have little effect on my success in life.
49. I can do almost anything if I work hard enough.
50. For me to be happy, my family and community have to be happy.
51. I do not like to feel I am the same as everyone else; it is important to be special.
52. What I do or don‘t do can affect the future of other people in my community.
53. What I do or don‘t do can affect the future of everyone in my community.
54. People can make their own success by working hard.
55. For a community to be successful, sometimes members must give up personal benefits, such as the right to cut wood or hunt just anywhere.
56. God decides who has good luck and what people‘s fortunes and futures are.
57. What happens to others in my community is only my business when it affects me directly.
58. No matter what I do, things will stay the same.
59. My personal needs and wants are more important than the needs and wants of the community.
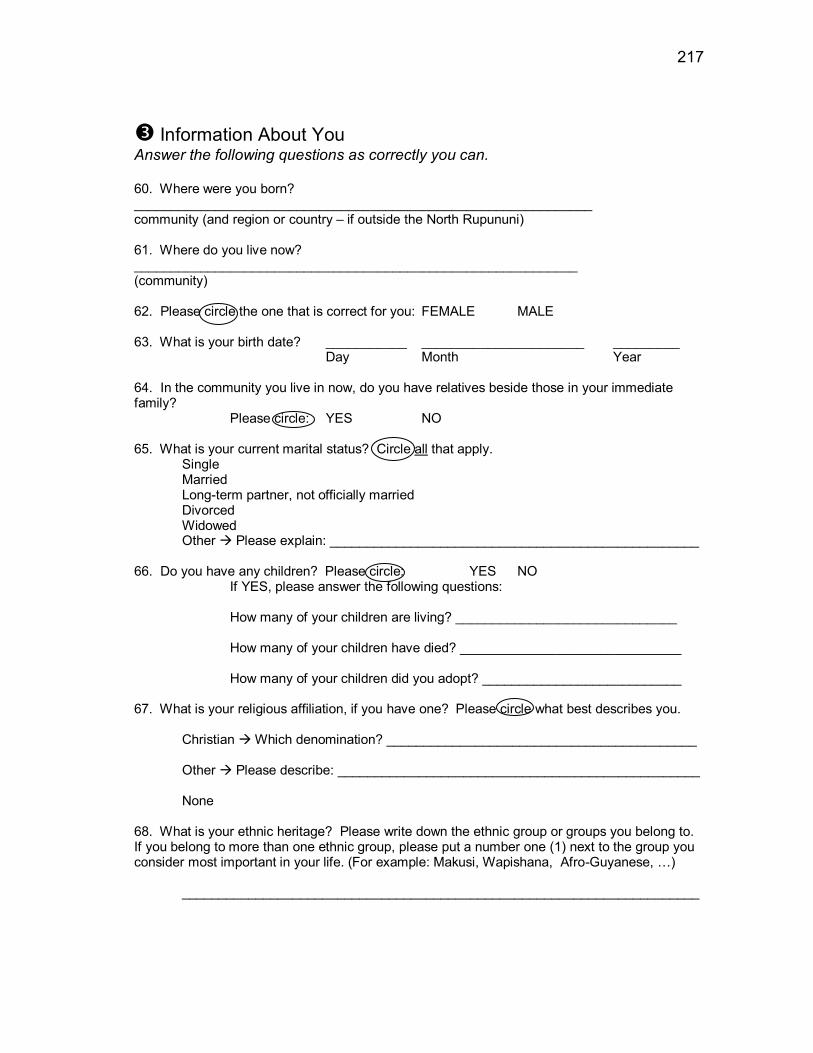
217
Information About You Answer the following questions as correctly you can. 60. Where were you born? ______________________________________________________________ community (and region or country – if outside the North Rupununi) 61. Where do you live now? ____________________________________________________________ (community) 62. Please circle the one that is correct for you: FEMALE MALE 63. What is your birth date? ___________ ______________________ _________ Day Month Year 64. In the community you live in now, do you have relatives beside those in your immediate family? Please circle: YES NO
65. What is your current marital status? Circle all that apply. Single
Married Long-term partner, not officially married Divorced Widowed Other Please explain: __________________________________________________ 66. Do you have any children? Please circle: YES NO
If YES, please answer the following questions: How many of your children are living? ______________________________
How many of your children have died? ______________________________ How many of your children did you adopt? ___________________________
67. What is your religious affiliation, if you have one? Please circle what best describes you.
Christian Which denomination? __________________________________________ Other Please describe: _________________________________________________ None
68. What is your ethnic heritage? Please write down the ethnic group or groups you belong to. If you belong to more than one ethnic group, please put a number one (1) next to the group you consider most important in your life. (For example: Makusi, Wapishana, Afro-Guyanese, …)
______________________________________________________________________
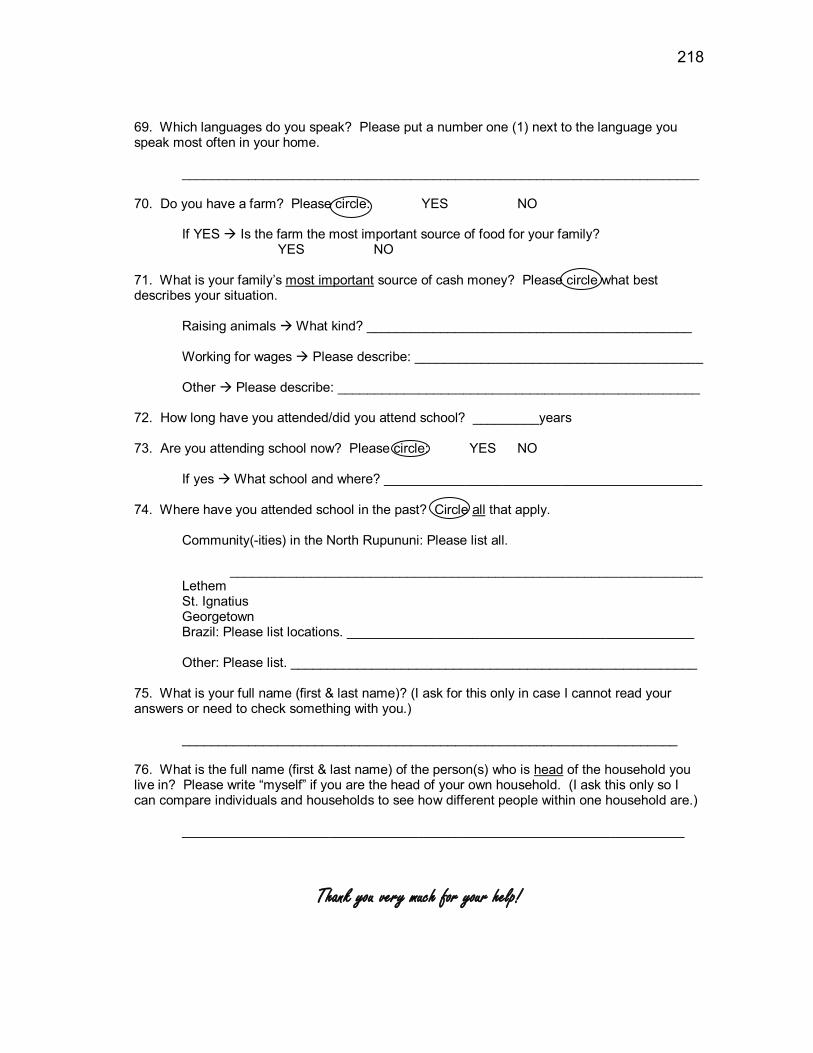
218
69. Which languages do you speak? Please put a number one (1) next to the language you speak most often in your home.
______________________________________________________________________ 70. Do you have a farm? Please circle: YES NO If YES Is the farm the most important source of food for your family?
YES NO 71. What is your family‘s most important source of cash money? Please circle what best describes your situation.
Raising animals What kind? ____________________________________________ Working for wages Please describe: _______________________________________
Other Please describe: _________________________________________________ 72. How long have you attended/did you attend school? _________years 73. Are you attending school now? Please circle: YES NO If yes What school and where? ___________________________________________ 74. Where have you attended school in the past? Circle all that apply.
Community(-ities) in the North Rupununi: Please list all.
________________________________________________________________ Lethem St. Ignatius Georgetown Brazil: Please list locations. _______________________________________________ Other: Please list. _______________________________________________________
75. What is your full name (first & last name)? (I ask for this only in case I cannot read your answers or need to check something with you.) ___________________________________________________________________ 76. What is the full name (first & last name) of the person(s) who is head of the household you live in? Please write ―myself‖ if you are the head of your own household. (I ask this only so I can compare individuals and households to see how different people within one household are.)
____________________________________________________________________
Thank you very much for your help!
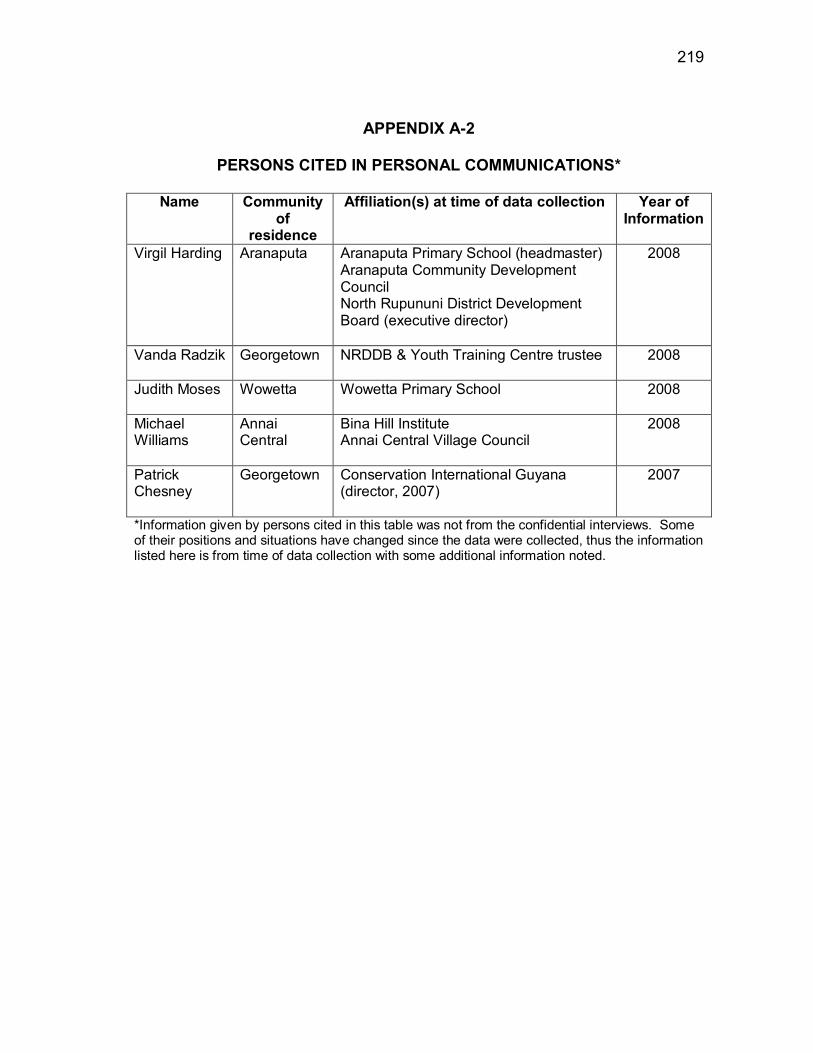
219
APPENDIX A-2
PERSONS CITED IN PERSONAL COMMUNICATIONS*
Name Community of
residence
Affiliation(s) at time of data collection Year of Information
Virgil Harding Aranaputa Aranaputa Primary School (headmaster) Aranaputa Community Development Council North Rupununi District Development Board (executive director)
2008
Vanda Radzik Georgetown NRDDB & Youth Training Centre trustee
2008
Judith Moses Wowetta Wowetta Primary School
2008
Michael Williams
Annai Central
Bina Hill Institute Annai Central Village Council
2008
Patrick Chesney
Georgetown Conservation International Guyana (director, 2007)
2007
*Information given by persons cited in this table was not from the confidential interviews. Some of their positions and situations have changed since the data were collected, thus the information listed here is from time of data collection with some additional information noted.
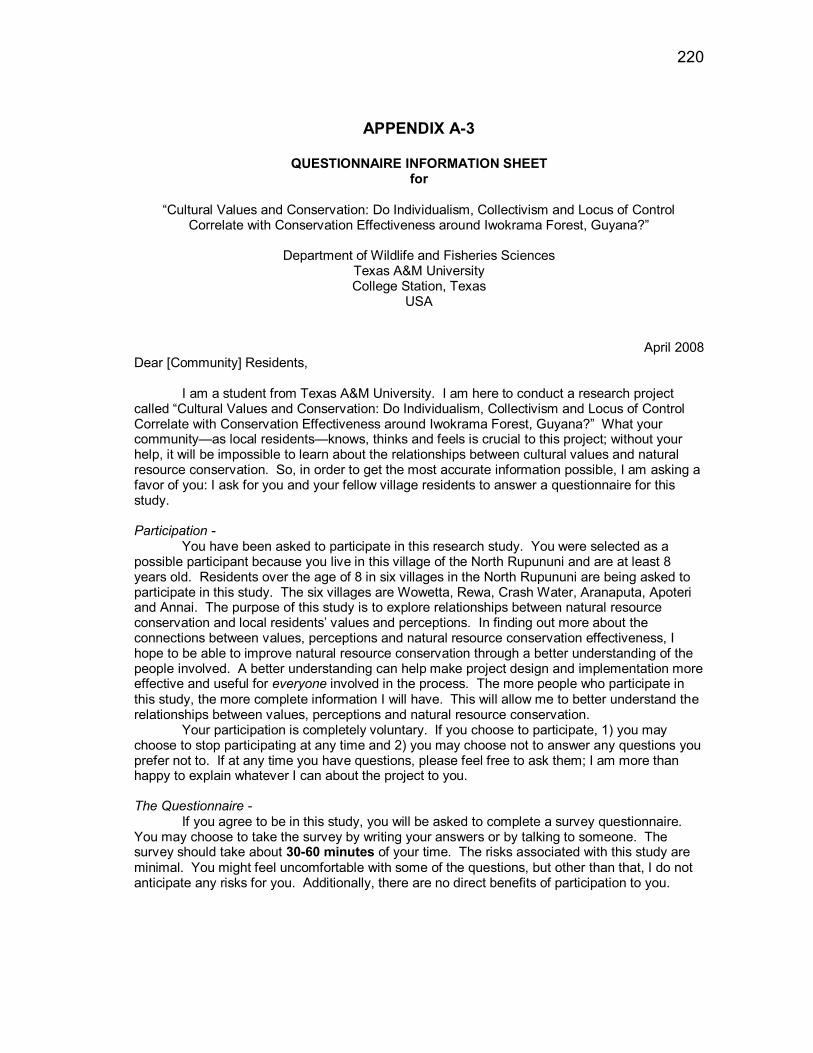
220
APPENDIX A-3
QUESTIONNAIRE INFORMATION SHEET for
―Cultural Values and Conservation: Do Individualism, Collectivism and Locus of Control
Correlate with Conservation Effectiveness around Iwokrama Forest, Guyana?‖
Department of Wildlife and Fisheries Sciences Texas A&M University College Station, Texas
USA
April 2008
Dear [Community] Residents,
I am a student from Texas A&M University. I am here to conduct a research project called ―Cultural Values and Conservation: Do Individualism, Collectivism and Locus of Control Correlate with Conservation Effectiveness around Iwokrama Forest, Guyana?‖ What your community—as local residents—knows, thinks and feels is crucial to this project; without your help, it will be impossible to learn about the relationships between cultural values and natural resource conservation. So, in order to get the most accurate information possible, I am asking a favor of you: I ask for you and your fellow village residents to answer a questionnaire for this study. Participation -
You have been asked to participate in this research study. You were selected as a possible participant because you live in this village of the North Rupununi and are at least 8 years old. Residents over the age of 8 in six villages in the North Rupununi are being asked to participate in this study. The six villages are Wowetta, Rewa, Crash Water, Aranaputa, Apoteri and Annai. The purpose of this study is to explore relationships between natural resource conservation and local residents‘ values and perceptions. In finding out more about the connections between values, perceptions and natural resource conservation effectiveness, I hope to be able to improve natural resource conservation through a better understanding of the people involved. A better understanding can help make project design and implementation more effective and useful for everyone involved in the process. The more people who participate in this study, the more complete information I will have. This will allow me to better understand the relationships between values, perceptions and natural resource conservation.
Your participation is completely voluntary. If you choose to participate, 1) you may choose to stop participating at any time and 2) you may choose not to answer any questions you prefer not to. If at any time you have questions, please feel free to ask them; I am more than happy to explain whatever I can about the project to you. The Questionnaire -
If you agree to be in this study, you will be asked to complete a survey questionnaire. You may choose to take the survey by writing your answers or by talking to someone. The survey should take about 30-60 minutes of your time. The risks associated with this study are minimal. You might feel uncomfortable with some of the questions, but other than that, I do not anticipate any risks for you. Additionally, there are no direct benefits of participation to you.
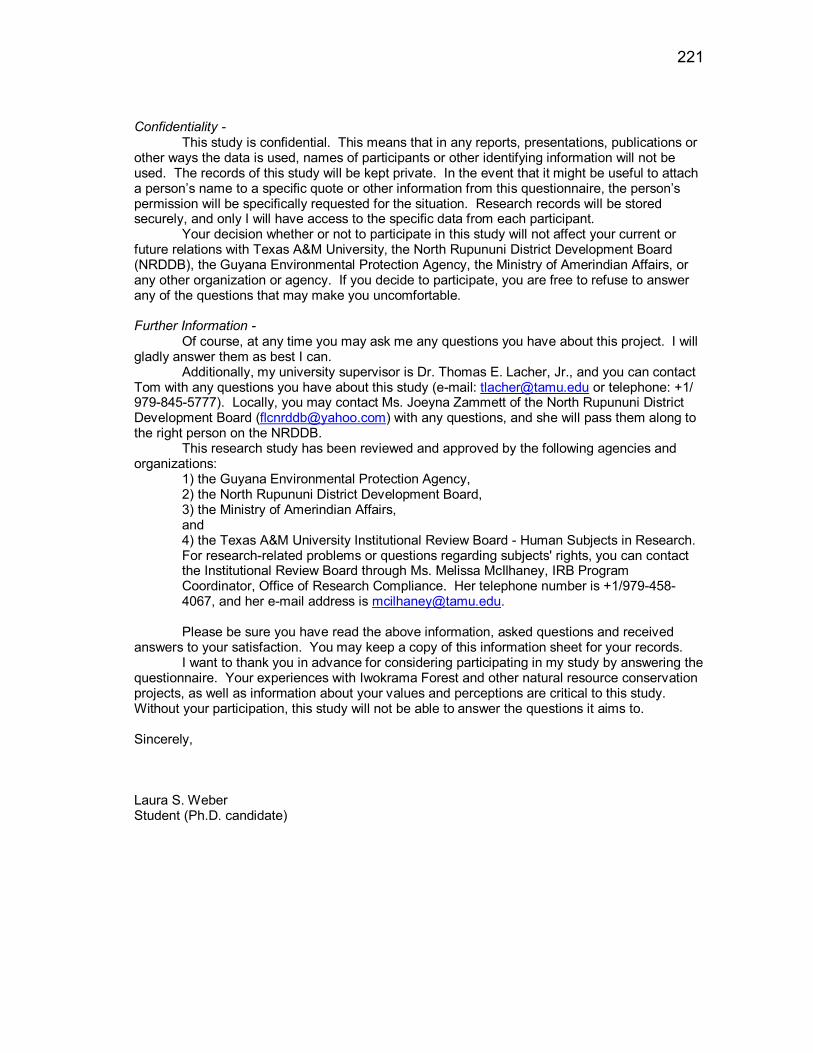
221
Confidentiality - This study is confidential. This means that in any reports, presentations, publications or
other ways the data is used, names of participants or other identifying information will not be used. The records of this study will be kept private. In the event that it might be useful to attach a person‘s name to a specific quote or other information from this questionnaire, the person‘s permission will be specifically requested for the situation. Research records will be stored securely, and only I will have access to the specific data from each participant.
Your decision whether or not to participate in this study will not affect your current or future relations with Texas A&M University, the North Rupununi District Development Board (NRDDB), the Guyana Environmental Protection Agency, the Ministry of Amerindian Affairs, or any other organization or agency. If you decide to participate, you are free to refuse to answer any of the questions that may make you uncomfortable. Further Information -
Of course, at any time you may ask me any questions you have about this project. I will gladly answer them as best I can.
Additionally, my university supervisor is Dr. Thomas E. Lacher, Jr., and you can contact Tom with any questions you have about this study (e-mail: [email protected] or telephone: +1/ 979-845-5777). Locally, you may contact Ms. Joeyna Zammett of the North Rupununi District Development Board ([email protected]) with any questions, and she will pass them along to the right person on the NRDDB.
This research study has been reviewed and approved by the following agencies and organizations:
1) the Guyana Environmental Protection Agency, 2) the North Rupununi District Development Board, 3) the Ministry of Amerindian Affairs, and 4) the Texas A&M University Institutional Review Board - Human Subjects in Research. For research-related problems or questions regarding subjects' rights, you can contact the Institutional Review Board through Ms. Melissa McIlhaney, IRB Program Coordinator, Office of Research Compliance. Her telephone number is +1/979-458-4067, and her e-mail address is [email protected].
Please be sure you have read the above information, asked questions and received
answers to your satisfaction. You may keep a copy of this information sheet for your records. I want to thank you in advance for considering participating in my study by answering the
questionnaire. Your experiences with Iwokrama Forest and other natural resource conservation projects, as well as information about your values and perceptions are critical to this study. Without your participation, this study will not be able to answer the questions it aims to. Sincerely, Laura S. Weber Student (Ph.D. candidate)
222
VITA
Laura Suzanne Weber earned a Bachelor of Arts at the American
University in Washington, D.C, after which she spent two years teaching in
Austria. She then received a fellowship from the German foundation the
Konrad-Adenauer-Stiftung and spent a year studying at the Universität Konstanz
in southern Germany before returning to the United States to earn a Master of
Arts from the University of Arizona in 2000. Dr. Weber may be reached via e-
mail at [email protected] or through the Department of Wildlife and
Fisheries Sciences at Texas A&M University, 210 Nagle Hall, College Station,
TX 77843-2258; tel. (979) 845-5777.