Embed Size (px)
Citation preview
CO2 Capture by Methanol, Ionic Liquid, and Their Binary
Mixtures: Experiments, Modeling, and Process Simulation
Mohsen Taheri, Chengna Dai, and Zhigang Lei*
State Key Laboratory of Chemical Resource Engineering, Beijing University of Chemical
Technology, Box 266, Beijing 100029, China
ABSTRACT: The CO2 solubility data in the ionic liquid (IL) 1-allyl-3-methylimidazolium
bis(trifluoromethyl sulfonyl)imide, methanol (MeOH), and their mixture with different
combinations at temperatures of (313.2, 333.2, and 353.2 K) and pressures up to 6.50 MPa
were measured experimentally. New group binary interaction parameters of the predictive
UNIFAC-Lei model, which has been continually advanced by our group, were introduced by
correlating the experimental data of this work and the literature. The consistency between
experimental data and predicted results proves the reliability of UNIFAC-Lei model for
CO2-IL-organic solvent systems. The newly obtained parameters were incorporated into the
UNIFAC property model of Aspen Plus software to optimize a conceptual process developed
for the purification of a CO2-containing gas stream. The simulation results indicate that the
use of IL either mixed with MeOH or purely considerably lowers the process power
consumption, and improves the process performance in terms of CO2 capture rate and solvent
loss.
Keywords: CO2 capture, physical absorption, ionic liquid (IL), methanol (MeOH),
UNIFAC-Lei model, process simulation
Additional Supporting Information may be found in the online version of this article. ∗ Correspondence concerning this article should be addressed to Z. Lei at [email protected].
Separations: Materials, Devices and Processes AIChE JournalDOI 10.1002/aic.16070
This article has been accepted for publication and undergone full peer review but has not beenthrough the copyediting, typesetting, pagination and proofreading process which may lead todifferences between this version and the Version of Record. Please cite this article asdoi: 10.1002/aic.16070© 2018 American Institute of Chemical Engineers (AIChE)Received: Jan 19, 2017; Revised: Jul 27, 2017; Accepted: Dec 24, 2017
This article is protected by copyright. All rights reserved.
2
Introduction
The observation of carbon dioxide (CO2) emissions in recent years shows the severe
destructive effects of CO2 as the primary long-lived greenhouse gas on the global warming
and climate change issues clearly.1 In particular, a significant amount of CO2 is sent out to the
atmosphere annually in the accustomed processes, involving fuels combustion and
purification.2 The conventional industrial approaches for CO2 capture and separation mainly
include solvent absorption, sorbent adsorption and membrane filtration.3 Among others,
physical absorption processes are the most common methods for acid gas removal, where
CO2 concentration (partial pressure) in feed gas stream is high. The main advantage of a
physical solvent is its low required regeneration energy due to the weak interaction between
the solvent and the gas to be captured. The famous physical solvent processes include Selexol,
Rectisol, Fluor, Purisol, and Ifpexol.4-7
Methanol (MeOH) as in the Rectisol process is widely
applied in industry for synthesis gas (syngas) purification with some advantages over other
physical solvents, such as low viscosity, availability, non-corrosivity, and deep CO2 removal
along with other impurities removal. However, a high vapor pressure of MeOH can cause
substantial reduction in the solvent. Thus, the process must be operated at very low
temperature that results in enormous elevation of power consumption.2,7-11
On the other hand, in the past few years, the non-volatile sustainable ionic liquids (ILs)
have been recognized by many researchers as propitious physical absorbents for CO2 and
other acid gases as well.12-20
Although the previous experimental data showed that the lower
operating temperatures and higher pressures bring about more CO2 dissolved in ILs, CO2
solubility in ILs doesn’t decline as sharp as it does in MeOH when the temperature increases
Page 2 of 49
AIChE Journal
AIChE Journal
This article is protected by copyright. All rights reserved.
3
at a constant pressure. For example, at the pressure 1 MPa, when the temperature increases
from 298.2 to 323.2 K, the solubility of CO2 in MeOH drops by 43% (Ref. 21-26), while the
values are 30%, 30%, 29%, 33%, 28%, and 27% for [BMIM]+[BF4]
- (Ref. 27),
[BMIM]+[Tf2N]
- (Ref. 27), [BMPYR]
+[Tf2N]
- (Ref. 27), [BMIM]
+[PF6]
- (Ref. 28),
[HMIM]+[Tf2N]
- (Ref. 29), and [HMPY]
+[Tf2N]
- (Ref. 29), respectively. This suggests that
the fall in CO2 solubility due to the exothermic CO2 absorption process for ILs is lower when
compared to MeOH. Therefore, adding an IL to MeOH and capturing CO2 at a higher
temperature can compensate the rise in temperature.
To provide the concept of ameliorated CO2 capture processes characterized with less gas
stream contamination and lower operating costs due to the higher operating temperatures, an
imidazolium-based IL was added into MeOH to have both advantages of organic solvents and
ILs. The IL 1-allyl-3-methylimidazolium bis(trifluoromethyl sulfonyl)imide
([AMIM]+[Tf2N]
-) was selected in this work, because (1) the [Tf2N]
- anion has a strong
affinity towards CO2;30
(2) the [Tf2N]-based ILs with imidazolium cation belong to the most
thermally stable ILs;31
and (3) [AMIM]+[Tf2N]
- has been reported as a promising IL for CO2
capture by Nonthanasin et al.32
Thus, the solubility of CO2 in pure [AMIM]+[Tf2N]
-, pure
MeOH, and their binary mixtures (80 wt% [AMIM]+[Tf2N]
- + 20 wt% MeOH, 50 wt%
[AMIM]+[Tf2N]
- + 50 wt% MeOH, and 20 wt% [AMIM]
+[Tf2N]
- + 80 wt% MeOH) at
temperatures 313.2, 333.2, and 353 K and pressures up to 6.5 MPa was measured in this work
by using a static gas-liquid equilibrium view-cell technique.
A number of predictive thermodynamic models are available for modeling the solubility
of CO2 in ILs.33-42
Among others, the universal quasichemical functional-group activity
Page 3 of 49
AIChE Journal
AIChE Journal
This article is protected by copyright. All rights reserved.
4
coefficients model for ILs constantly developed by our group (UNIFAC-Lei model)43-50
has
attracted wide attention, and it produces solid outcomes in various specific applications due
to the unique advantages: (1) it provides quantitative accurate predictions;51
(2) its
formulation is simple, and thus the calculation speed is rapid; (3) its parameters can be
readily utilized in the modern simulation packages (e.g., Aspen Plus, PROII, and ChemCAD)
for simulation and optimization of the desired industrial processes;52-54
and (4) in terms of the
UNIFAC-Lei preferable decomposition approach, the introduced main groups and subgroups
together with their derived parameters are appropriate for the ILs-based designing
methodologies for specific applications.55-58
Thus, the UNIFAC-Lei model has been extended
in this work to predict the solubility of CO2 in the proposed solvents.
The remainder of this article is arranged as follows: firstly, the experimental data of this
work, along with those collected from the literature, were correlated by the UNIFAC-Lei
equations and its data fitting procedure, and the new group binary interaction parameters (αmn
and αnm) between CO2 and MeOH/[AMIM]+[Tf2N]
- groups were obtained. The predicted
results were compared with experimental data to justify the applicability of UNIFAC-Lei
model for CO2-IL-organic solvent integrated systems. Then, a semi-Rectisol flow
configuration with rigorous RadFrac equilibrium models was set up in the Aspen Plus to
simulate and analyze the processes including IL solvents. The simulations were compared
with those just using conventional pure MeOH solvent from the perspectives of energy
consumption, CO2 capture ability, and evaporative loss. For this purpose, the
[AMIM]+[Tf2N]
- compound was added to the Aspen Plus module, and the newly obtained
UNIFAC-Lei parameters were input so that process simulations were implemented based on
Page 4 of 49
AIChE Journal
AIChE Journal
This article is protected by copyright. All rights reserved.
5
the Aspen Plus UNIFAC property model.
Experimental Section
Materials
The IL [AMIM]+[Tf2N]
- (molecular mass 403.32 g.mol
-1, and mass fraction purity >
99%) was purchased from the Shanghai ChengJie Chemical Co. Ltd. Before the experiment,
under a vacuum rotary evaporator device, [AMIM]+[Tf2N]
- was degassed and dried for 24
hours at 335.2 K to remove its water traces and other volatile impurities. After this treatment,
its water content was reduced to below 200 ppm as measured by the Karl Fischer titration
(KLFX device, model KLS701). MeOH (mass fraction purity > 99.5%) was purchased from
the Tianjin Damao Chemical Reagent Factory. CO2 (mass fraction purity 99.995%) was
purchased from the Beijing Longkou City Gas Plant. Sulfuric acid (H2SO4) and sodium
sulfate (Na2SO4) were purchased from the Beijing Chemical Plant with mass fraction purities
of 95% to 98% for H2SO4 and > 99% for Na2SO4. The four latter chemicals were used
directly without further purification.
Apparatus and procedure
A high-temperature high-pressure view-cell apparatus, the detailed schematic flowsheet
of which has been depicted in our previous work,59
was used in this work to conduct the
experimental vapor-liquid equilibrium measurements of CO2 and the solvents. The operating
procedure is explained in what follows. In each experiment, after the operating temperature
was set to the predetermined value, a vacuum pump (2XZ-1) was used to purge out the air
inside the equilibrium cell. After evacuation, a certain amount of solvent (about 35 mL) was
injected into the cell. Then, CO2 was introduced to the solvent by a syringe pump, while the
Page 5 of 49
AIChE Journal
AIChE Journal
This article is protected by copyright. All rights reserved.
6
magnetic stirring system was working at a speed of about 200 rpm. The CO2 started to
dissolve in the solvent, and thus the pressure began to drop down gradually. In accordance
with Duhem’s theorem,60
it was presumed that gas-liquid equilibrium is established when at
each fixed operating temperature, the system pressure becomes invariable for more than 6
hours. After reaching the equilibrium, a small amount of solvent containing the dissolved
CO2 (3 to 5 g) was extracted from the lower part of the equilibrium cell (liquid phase), and
was trapped in a stainless steel sample bomb. Subsequently, the Na2SO4 aqueous solution
with pH between 2.5 and 3 adjusted by H2SO4, was used to degas the CO2 from the sampler
solution, and also to keep the volatile organic components which may emit along with CO2.
As in the gravimetric method, based on the weights of the unloaded sampler (m1), loaded
sampler (m2), sampler after CO2 release (m3), Na2SO4 solution flask before exposing to the
sampler (m4), and Na2SO4 solution flask after exposing to the sampler (m5), the mole fraction
of CO2 in the liquid phase was measured. Moreover, a small charge of gas mixture (about 400
µL), which was taken out by a sealed sampler from the upper part of equilibrium cell (gas
phase), was fed to a gas chromatograph (GC 4000A) equipped with a thermal conductivity
detector (TCD) and a 3 m × 3 mm Porapak-Q column to analyze the equilibrium gas phase
composition. The GC column temperature, injector temperature, and hydrogen flow rate -
acting as the carrier gas - were set at 403.2 K, 423.2 K, and 30 mL·min-1
, respectively.
A pressure gauge (XSE, 0-10 MPa) and a Pt100 thermocouple (XMTD-751W) with the
digital displays and accuracies of ±0.06% FS and ±0.5%, respectively, had been installed on
the view-cell apparatus to monitor the pressure and temperature of equilibrium cell. These
errors don’t bring about any significant variation in the CO2 solubility measurement. An
Page 6 of 49
AIChE Journal
AIChE Journal
This article is protected by copyright. All rights reserved.
7
electronic balance (CPA 1003S, Sartorius) with a precision of ±0.001 g was used for
weighing the sampler and the flask. To ensure the accuracy of experimental data, at least
three repeated runs were performed for each equilibrium data point. By employing the
following equations together with the so-called Kragten spreadsheet method,61
the expanded
uncertainties with a level of confidence of approximately 95% (coverage factor k = 2) were
calculated for CO2 mole fractions in the liquid phase (x1) and CO2 mole fractions in the gas
phase (y1), which are termed as U(x1) and U(y1), respectively;
1 1 2 3 4 5( ) ( , , , , )nx F m m m m m= (1)
22 2
1 1 1c 1 1 2 5
1 2 5
( ) ( ) ( )( ) ( ) ( ) ... ( )n n n
n
x x xu x u m u m u m
m m m
∂ ∂ ∂= + + + ∂ ∂ ∂
(2)
1 1 1 2 1 1 1 1 2 11 1
( ) ( ) ... ( ) ( ) ( ) ... ( ),n nx x x y y y
x yn n
+ + + + + += = (3)
2 2
1 1 1 1
1 11 1
(( ) ) (( ) )
( ) , ( )1 1
n n
i i
i i
x x y y
u x u yn n
= =
− −= =
− −
∑ ∑ (4)
( )2 2
1 1 1 1 1( ) ( ) ( ( ) ) , ( ) ( )c nU x u x MAX u x k U y u y k= + = (5)
where n represents the number of experimental runs, uc stands for the combined standard
uncertainty due to the electric balance precision, and u is the standard uncertainty due to
repeatability of the experiments. These values are listed in the tables in Supporting
Information along with the experimentally measured results.
UNIFAC-Lei Model
Model description
Upon combining the solution-of-functional-groups concept with a model based on the
UNIQUAC (universal quasi-chemical) theory, the original UNIFAC (UNIQUAC
functional-group activity coefficient) group-contribution method was initially proposed by
Page 7 of 49
AIChE Journal
AIChE Journal
This article is protected by copyright. All rights reserved.
8
Fredenslund et al. in 197562
for the estimation of liquid-phase activity coefficients. Since then,
it became notably popular among chemists and chemical engineers as a powerful predictive
tool of thermodynamic properties of solvent-containing systems. In 2005, it was applied to
ILs for the first time by Kato and Gmehling.63
However, they only introduced two main
groups with an inappropriate fragmentation approach. Later on in 2007, in an attempt by Lei
et al.,64
the UNIFAC model for ILs was improved in some degree. Afterwards, because of its
high potential and the lack of group parameters, we decided to comprehensively develop the
original UNIFAC model and extensively extend it to ILs, in a manner that up to now over 700
come-in-handy group interaction parameters for ILs have been published by our group.44-50
Like all the other group contribution methods, in the UNIFAC-Lei model the existing
molecules in mixture should be decomposed into distinct functional groups. Three
approaches to ILs decomposition have been put forth by researchers. (1) The IL molecule is
divided into two groups: one cation group, and one anion group.65,66
(2) As what Kato and
Gmehling63
did, the IL molecule is divided into several groups: one anion group, one cation
core group (e.g., imidazolium or pyrrolidinium ring), and several other groups like CH2 or
CH3 groups.67-70
(3) The IL is also fragmented into several but electrically neutral groups: one
group comprised of the anion and the skeleton of the cation, and several groups on the
side-chain of the cation.33,34,39,44-50,71
The first approach is rejected since it doesn’t consider
the structural variation of substituents on both the cation and the anion. In the second
approach, the electrically charged functional groups are introduced. However, the original
UNIFAC model has been established based on the Derr and Deal’s ASOG
(analytical-solution-of-groups) model72
and the Abrams and Prausnitz’s UNIQUAC model,73
Page 8 of 49
AIChE Journal
AIChE Journal
This article is protected by copyright. All rights reserved.
9
which both had been proposed for the solutions with nonelectrolyte molecules. More
specifically, the UNIFAC activity coefficient equation doesn’t contain a term such as the
Debye-Hückel accounting for the electrostatic contribution of electrically charged functional
groups. In this regard, the UNIFAC-Lei model adopts the third approach to dissociate the IL
into electrically neutral functional groups. Accordingly, the [AMIM]+[Tf2N]
- molecule here is
decomposed into three individual functional groups as shown in Figure 1. Meanwhile, CO2
and MeOH are considered as two separate groups as in the original UNIFAC model.
Activity coefficient formulation and parameters
In the UNIFAC model, the activity coefficient of species i ( iγ ), as a function of
temperature and composition, in a nonideal liquid mixture is calculated by
C Rln ln lni i iγ γ γ= + (6)
where Cln iγ accounts for the combinatorial contribution to activity coefficient, essentially
due to differences in shape and size of the groups; and Rln iγ stands for the residual
contribution to activity coefficient, essentially due to energetic interactions between the
functional groups. The combinatorial part Cln iγ includes the group volume (Rk) and the
group surface area (Qk) parameters, which either can be found directly in the references or, in
case of unavailability, can be determined by the van der Waals group volume (Vk) and the van
der Waals group surface area (Ak), respectively. By using either the molar volume correlation
method44
or the COSMO-RS method45
as proposed in our previous work, the Vk and Ak of the
functional groups of ILs can be calculated. The residual part Rln iγ includes two
temperature-independent group binary interaction parameters (αmn and αnm, αmn ≠ αnm) for
each pair of groups m and n. In principle, the group interaction parameters must be computed
Page 9 of 49
AIChE Journal
AIChE Journal
This article is protected by copyright. All rights reserved.
10
by means of correlating the experimental phase equilibrium data.
As listed in Table 1, 20 group binary interaction parameters in addition to 10 group
volume and surface area parameters are required in this modeling work. However, the group
interaction parameters between CH3OH and CO2 as well as those between C=C and CO2
groups had not been reported in the literature yet. Thus, the parameters for CH3OH and CO2
were first fixed by fitting the experimental solubility data of CO2 in MeOH collected from the
literature,21-26,74-82
and presented in Table S1 in Supporting Information. Afterwards, by
correlating the experimental solubility data of CO2 in [AMIM]+[Tf2N]
- from the literature
32
and from this work as presented in Tables S2 and S3 in Supporting Information, the
parameters for C=C and CO2 were estimated. Other group interaction, group volume and
surface area parameters are collected from the references.44,46,83-85
Procedure for estimating the group interaction parameters
For the CO2-IL or -MeOH binary and CO2-IL-MeOH ternary systems, the gas-liquid
equilibrium states at low to moderate pressures are expressed as
s
1 1 1 1 1 1( , , )y P T P y x Pϕ γ= (7)
given CO2 as the component number 1. 1y and 1x are the mole fractions of CO2 in the gas
and liquid phases, respectively; P is the system pressure; 1 1( , , )T P yϕ refers to the fugacity
coefficient of CO2 in the gas phase evaluated using the Span and Wagner’s equation of
state;86
1γ is the activity coefficient of CO2 in the liquid phase calculated by the
UNIFAC-Lei model; and s
1P is the saturated vapor pressure of pure CO2 obtained by using
the extrapolated Antoine equation as proposed by Shiflett and Yokozeki.87
The group binary interaction parameters were estimated by minimizing the average
Page 10 of 49
AIChE Journal
AIChE Journal
This article is protected by copyright. All rights reserved.
11
relative deviation (ARD) of experimental data and calculated values via the following
objective function:
cal exp
1 exp
1min
N x xOF
N x
− =
∑ (8)
where expx is the mole fraction of CO2 in the liquid phase obtained experimentally; calx is
the one calculated by the UNIFAC-Lei model; and N is the number of data points employed
in the fitting procedure which is performed by using the generalized reduced gradient (GRG)
nonlinear optimization algorithm of the Solver function of Microsoft Excel 2016.
Process Simulation
Pure MeOH processes operate at reduced temperatures, sometimes as low as 200 K.88
Besides complex refrigeration schemes and refrigerants demand, there are two CO2 emission
sources in such a kind of processes. (1) Direct CO2 emission: coming from the CO2 escaped
from the process itself. (2) Indirect CO2 emission: coming from the fuel combustion
processes in power plants to supply the required energy of the process, especially the heavy
power requirement of refrigeration system.10,89
Therefore, by focusing on the higher- or
ambient-temperature processes, the indirect CO2 emission can be diminished or even omitted.
Hereby, by an adaptation of the Rectisol-based processes layouts,10,89,90
a conceptual CO2
capture process configuration has been developed, and its simulations have been carried out
in Aspen Plus environment. To assess and interpret the separation performance at different
temperatures for different solvents, five absorption processes as for pure MeOH at 243.2 K,
mixed MeOH-IL at 243.2 K, pure IL at 243.2 K, pure IL at 265.7 K, and pure IL at 288.2 K
were simulated and the results were compared with each other.
Page 11 of 49
AIChE Journal
AIChE Journal
This article is protected by copyright. All rights reserved.
12
Process scheme
The process flowsheet depicted in Figure 2, is made up of one absorption tower (TW1),
one rectification column (TW2), one flash drum (TW3), two feed mixers (MX1, and MX2),
four heat exchangers (HE1, HE2, HE3, and HE4), one compressor (CM1), and one solvent
recycle pump (PM1). In all the five cases investigated, the raw gas to be treated, with 47% H2,
34% CO2, and 19% CO mole composition, enters the MX2 at 6 MPa and 298.2 K. After
mixing with the retrieved gas from the top of TW2, it is cooled down by HE2 and fed to the
bottom of the TW1. In each process, all the heat exchangers are set at the corresponding
operating temperature, i.e., 243.2, 265.7, or 288.2 K. Makeup solvent is added to the recycled
solvent pumped from the bottom of TW3, and after being cooled down, the solvent is fed to
the top of TW1. TW1, in which the CO2 is absorbed in an exothermic process, is equipped
with one side-draw liquid cooling loop. The purified gas is withdrawn from the top of TW1,
while the CO2-loaded solvent enters the top stage of TW2. The CO and H2 gases co-absorbed
with CO2 are recovered in this rectification column equipped with reboiler, and are recycled
back to the TW1. The solvent is then conveyed to the vacuum flash drum to desorb CO2.
For each of the four low temperature processes with defined flow rates of raw gas and
solvent feeds, parametric sensitivity analysis of the operative variables was performed to
acquire their optimal values. First, the runnable range and optimum pattern of every
parameter are elucidated, setting the captured CO2 rate leaving out the flash drum as the main
performance measure of the process. From Tables S4a to S4d in Supporting Information,
theoretical stage number of TW1, pressure of TW1, pressure of TW3, and temperature of
TW3 are perceived as the decisive parameters since they influence the production of captured
Page 12 of 49
AIChE Journal
AIChE Journal
This article is protected by copyright. All rights reserved.
13
CO2 to a greater extent than other three parameters, i.e., number of stages, pressure, and
boilup ratio of TW2. Nevertheless, TW2 and TW3 variables play a dual role as the retrieved
gas yield relies on the former and the solvent loss strongly depends on the latter. Therefore,
under multioptimal consideration, fixing TW1 pressure and number of stages, TW2 and TW3
variables are then defined by way of compensation. However, this approach doesn’t hold for
the 288.2 K pure IL process since its higher solvent flow rate prevents the simulation runs
from convergence in most of the cases. In this context, taking the knowledge of the low
temperature processes into account, trial and error was used to reach the proximity of its
optimal conditions. Ultimately, the operating conditions and design specifications of five CO2
capture processes established in this study are given in Table 2.
UNIFAC property method
The IL [AMIM]+[Tf2N]
- was not available in the Aspen Plus databank. Thus, it was
added by the User Defined as a conventional component. The [AMIM]+[Tf2N]
- critical
properties were obtained using the group contribution method developed by Valderrama et
al.91
Its viscosity and liquid molar volume data, and liquid surface tension data were collected
from Ref. 92 and Ref. 93, respectively. Its ideal gas heat capacities and liquid heat capacities
were calculated using the Joback group contribution model extended for ILs by Ge et al.94
During the whole simulation and modelling procedures using Aspen Plus software,
UNIFAC model was selected. The parameters listed in Table 1 in addition to those for H2 and
CO functional groups are a prerequisite to run the simulations. H2 and CO group volume and
surface area parameters as well as their binary interaction parameters with all the existing
functional groups except those with C=C and CH3OH groups have been published in our
Page 13 of 49
AIChE Journal
AIChE Journal
This article is protected by copyright. All rights reserved.
14
previous work.47
However, the group interaction parameters between H2/CO groups and C=C
group cannot be acquired since there is no relevant data available in the literature to enable to
calculate them. Therefore, likewise the binary interaction parameters between two gaseous
groups, they were input as zero. Nevertheless, the references experimental solubility data of
H2 in MeOH25,82,95-98
and CO in MeOH25,99-101
collected and presented in Tables S5 and S6 in
Supporting Information were used to derive the group interaction parameters of CH3OH/H2
and CH3OH/CO. The ARDs between experimental data and calculated results for MeOH-H2
and MeOH-CO systems are 9.35% and 8.94%, respectively. In this case, the fugacity
coefficient of H2 and CO gases in Eq. 7 were calculated using the Peng-Robinson (PR)
equation of state, and the saturated vapor pressure of H2 and CO were calculated using the
extrapolated Antoine equation as proposed by Fogg and Gerrard.102
These additional
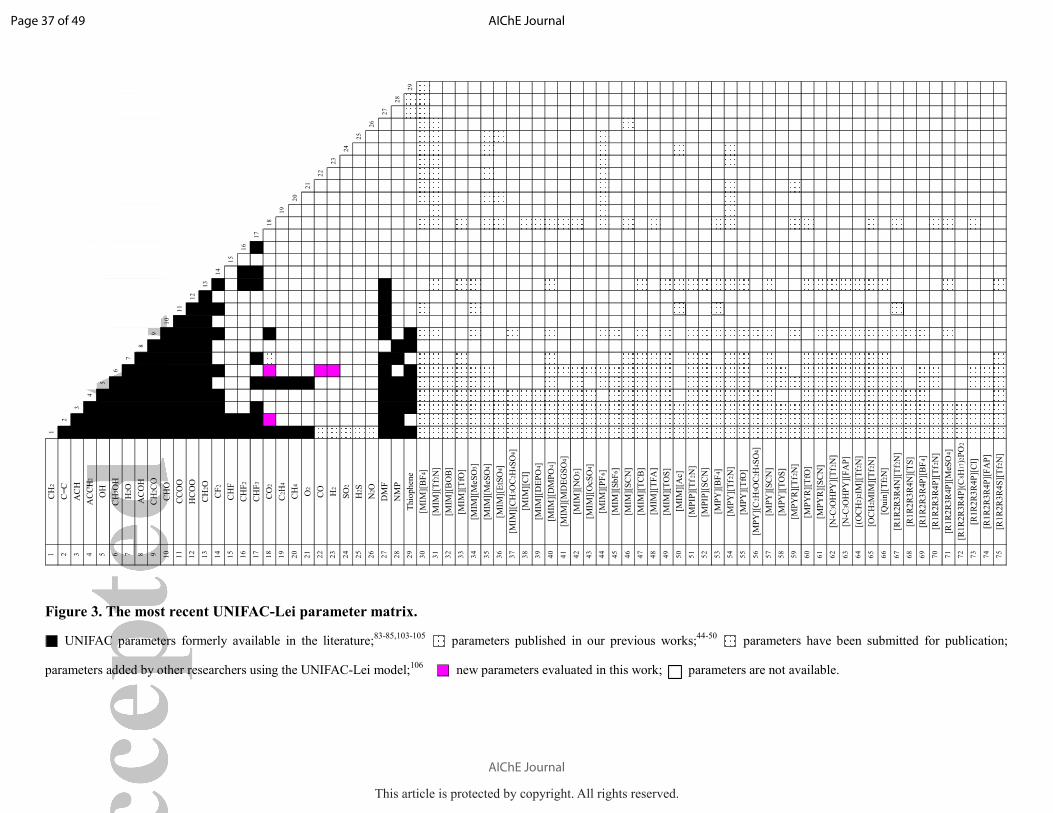
parameters used in this work are given in Table 3. The most recent UNIFAC-Lei parameter
matrix for IL and non-IL systems is illustrated in Figure 3.
Results and Discussion
Solubility of CO2 in pure IL and pure MeOH: experiments and predictions
The solubility data of CO2 in pure [AMIM]+[Tf2N]
- and pure MeOH at three
temperatures (313.2, 333.2, and 353.2 K) and pressures up to 6.5 MPa were measured
experimentally, and the solubility data expressed on the dimensionless mole-fraction basis are
listed in Tables S3 and S7, respectively. To validate the accuracy of experimental data, our
solubility data were compared with those available in the literature. The results fall within the
acceptable norms with the highest ARD of 6.30%, as depicted in Figures S1 to S4 in
Supporting Information. The solubility of CO2 in pure IL and pure MeOH follows the normal
Page 14 of 49
AIChE Journal
AIChE Journal
This article is protected by copyright. All rights reserved.
15
trend, that is, increasing with decreasing the temperature and increasing the pressure.
Furthermore, while the IL is assumed as non-vaporizable, MeOH appears in the gas phase. As
shown in Figure S5 in Supporting Information, the amount of MeOH vaporized into the gas
phase increases as the temperature goes up. This would add energy consumption to the
subsequent MeOH recovery in the solvent regeneration step.
The previously obtained parameters from the experimental data correlation in
UNIFAC-Lei model are used here to predict the CO2 mole fractions in pure MeOH and pure
[AMIM]+[Tf2N]
-. The comparisons between experimental data and predicted values for the
IL-CO2 and MeOH-CO2 systems are illustrated in Figures 4a and 4b, respectively. They agree
well with an ARD of 3.22% for IL-CO2 system and an ARD of 9.87% for MeOH-CO2 system.
In addition, 312 CO2-MeOH data points presented in Table S1 and 39 CO2-[AMIM]+[Tf2N]
-
data points collected from the references presented in Table S2 give the ARDs equal to 8.31%
and 3.61%, respectively. This confirmed that the UNIFAC-Lei model can reliably predict the
solubility of CO2 in pure ILs and pure organic solvents.
Solubility of CO2 in binary mixtures of IL and MeOH: experiments and predictions
The solubility data of CO2 in the binary mixtures of [AMIM]+[Tf2N]
- and MeOH at
three different mass fraction combinations (0.8 IL + 0.2 MeOH, 0.5 IL + 0.5 MeOH, and 0.2
IL + 0.8 MeOH) at temperatures of 313.2, 333.2, and 353.2 K and pressures up to 6.5 MPa
were measured experimentally, as listed in Table S8 in Supporting Information. Under the
same temperature and pressure, the solubility of CO2 in mixed solvents goes up as the amount
of IL increases. Furthermore, Figures S6 to S8 in Supporting Information give the
information on the influence of the addition of IL into MeOH on the gas phase. It can be seen
Page 15 of 49
AIChE Journal
AIChE Journal
This article is protected by copyright. All rights reserved.
16
that adding a certain amount of IL into MeOH can lead to a relative decrease of CH3OH in
the gas phase. This means that solvent loss and consequently the required regeneration energy
for the mixed IL-MeOH solvents are less than those for pure MeOH.
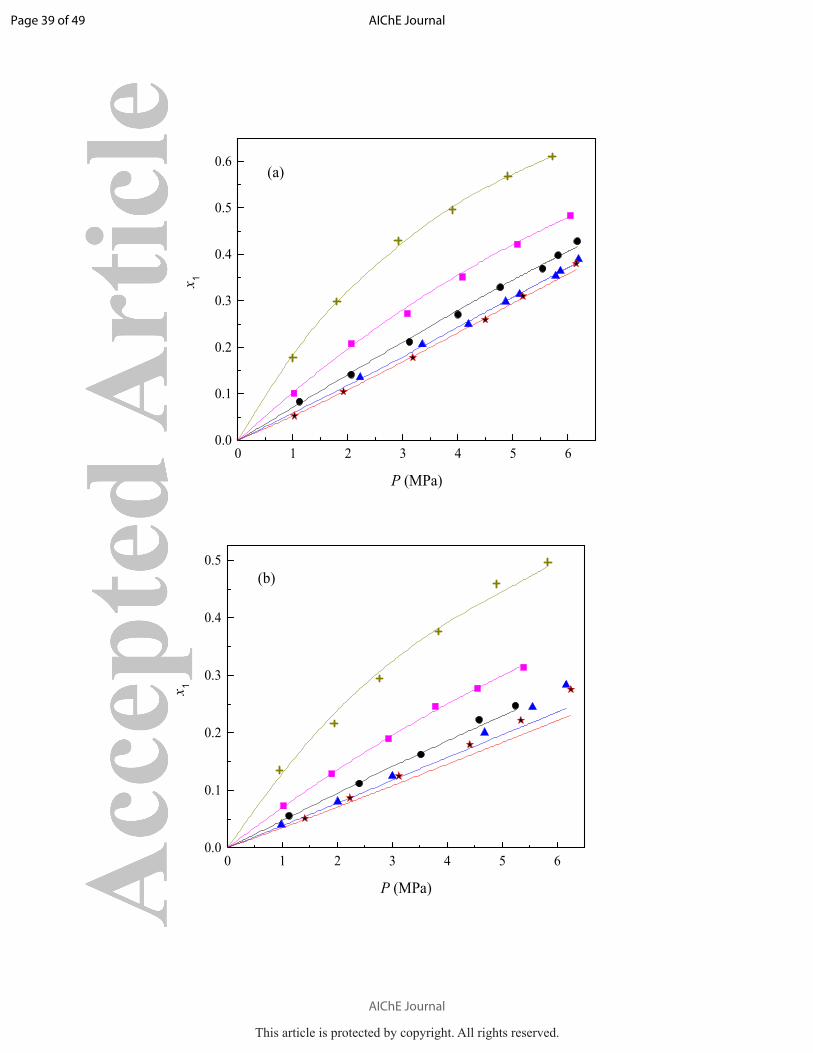
By incorporating the predetermined CH3OH/CO2 and C=C/CO2 group parameters into
the UNIFAC equations and evaluating the activity coefficients, the predicted CO2 solubility
data for the binary IL-MeOH solvents are obtained. Comparison between experimental data
and predicted values is depicted in Figure 5, showing that they are in good agreement with an
ARD of 4.45%. Therefore, the UNIFAC-Lei parameters obtained by correlation of the pure
solvent experimental data can be effectively applied to the binary solvents, enabling to
extrapolate from the current single solvent CO2 capture processes to the optimized more
efficient mixed solvents processes.
Prediction of Henry’s constants of CO2
The magnitude of solubility of CO2 gas in each solvent at respective operating
temperature can be described by Henry’s constant. Expressing on the mole fraction basis, it
has the unit of pressure and is defined as
1 1
s s1 1 11 1 1 1 1
0 01
( , , )( ) lim lim ( )
x x
y P T P yH T P P T
x
ϕγ γ ∞
→ →= = ≅ (9)
where 1γ∞ is the activity coefficient of CO2 in solvent as it approaches infinite dilution. A
smaller value of the Henry’s constant implies a larger gas solubility.
Herein, the Henry’s constants of CO2 in five solvents (pure IL, 80 wt% IL + 20 wt%
MeOH, 50 wt% IL + 50 wt% MeOH, 20 wt% IL + 80 wt% MeOH, and pure MeOH) at
different temperatures (313.2, 333.2, and 353.2 K) have been obtained experimentally using
linear extrapolation at x1→0 from the fugacity divided by mole fraction. Whereupon, the
Page 16 of 49
AIChE Journal
AIChE Journal
This article is protected by copyright. All rights reserved.
17
activity coefficients at infinite dilution predicted by UNIFAC-Lei model were used to obtain
the Henry’s constants. As shown in Figure 6, good agreement between the experimental and
predicted CO2 Henry’s constants for [AMIM]+[Tf2N]
-, MeOH, and their binary mixtures is
observed. Moreover, the low Henry’s constants for pure IL even at temperature of 353.2 K
are notable, demonstrating the good absorption capability of ILs in capturing CO2.
Simulation results and analysis
Simulation results of the purified gas stream leaving the absorber TW1, and the captured
CO2 gas stream leaving the flash drum TW3 are given in Table 4. Table 5 gives the
information on power penalty of the processes, which is comprised of heat duties of four heat
exchangers, heat duty of TW2 reboiler, heat duty of TW3 flash drum, and electricity demand
of CM1 and PM1. Table 6 provides the information on separation performance of the five
processes in terms of H2 and CO fuel gases production rate, CO2 capture rate, CO2 venting
rate in the purified gas stream, and solvent loss rate.
In order to analyze the efficiency of the five simulated processes on producing nearly the
same amount of fuel gases, the pure MeOH process operating at 243.2 K is taken on as the
benchmark. It can be seen that (1) by employing the mixed MeOH-IL solvents and applying
the exactly same design specifications and operating conditions as the pure MeOH solvent,
less energy is required while better separation performance is achieved. Thus, adding IL to
MeOH is in favor for Rectisol-based processes. (2) The pure IL process operating at 243.2 K
is distinctly more efficient than the pure MeOH process since its power penalty of the
energy-intensive blocks, i.e., TW2 reboiler and TW3, along with the CO2 venting rate decline
sharply, while there is more CO2 captured and almost no solvent loss. (3) In the two
Page 17 of 49
AIChE Journal
AIChE Journal
This article is protected by copyright. All rights reserved.
18
higher-temperature pure IL processes, i.e., at 265.7 and 288.2 K, operating costs go down
substantially since the energy consumption of each block is less, and there is almost no
solvent loss. This is apart from the elimination of the negative environmental impacts caused
by volatilization loss of the organic solvent. (4) The 265.7 and 288.2 K absorption processes
using pure IL as solvent, require 64% and 32% less heat duty for their refrigeration systems,
respectively. This is particularly important since all the pure MeOH processes have
energy-intensive cooling systems in common.
To quantitatively compare the energy requirement of the processes, block specific
energy penalty (BSEP) is defined as
22
[ ]block heat duty or energy demand GJBSEP
kmol captured COflowrateof captured CO= (10)
The BSEPs of the energy-consuming blocks (i.e., heat exchangers, rectification column
reboiler, and flash drum) in the IL + MeOH (50 + 50 wt%) process, in which solvent and raw
gas flow rates are the same as those in the pure MeOH process, decrease from 0.055, 0.171,
and 0.127 GJ/kmol captured CO2 to 0.027, 0.096, and 0.074 GJ/kmol captured CO2,
respectively. Furthermore, by increasing the temperature from 243.2 to 265.7 K (increased
22.5 K) for pure IL process, the BSEPs for heat exchangers, TW2 reboiler, and TW3, varies
from 0.034, 0.018, and 0 to 0.022, 0.070, and 0.050, respectively. However, if the temperature
further increases 22.5 K from 265.7 to 288.2 K, double amount of solvent will be needed, and
the corresponding BSEPs reach 0.014, 0.119, and 0.108, respectively. The values of process
specific energy penalty (PSEP) calculated as the sum of BSEPs for heat exchangers, TW2
reboiler, and TW3 are given in Table 7. As can be seen, in comparison with the pure MeOH
process, all the four processes including IL need much less energy to capture 1 kmol of CO2.
Page 18 of 49
AIChE Journal
AIChE Journal
This article is protected by copyright. All rights reserved.
19
When considering environmental benignity together, the pure IL process operating at 243.2 K
is the most efficient since its PSEP, vented CO2 rate, and solvent loss rate are at the very least
while its CO2 capture rate is the highest.
We take a further step to study the indirect CO2 emission discharged into the atmosphere
by running the flowsheets. The entire power demand is defined by the process electricity
consumption (PEC):
PM1 CM1 HEs TW2 TW3( )PEC W W Q Q Qη= + + + + (11)
where W is the electricity, and Q is the heat duty required for the designated blocks. η is the
efficiency factor for converting thermal to electrical energy assumed at 0.38. PEC has the
unit of MW. Meanwhile, the average CO2 emission factor (EFCO2) for electricity generation
in USA was reported at 11.296 kmol/MW·h in 2015.107
The process indirect CO2 emission
(PIECO2) is then calculated by
2
1
CO2 CO [kmol h ]PIE PEC EF −= × ⋅ (12)
PIECO2 is the indirect CO2 emission resulting from the electricity supply to the cooling (HEs
and TW3), heating (TW2), and compression blocks (CM1 and PM1). As shown in Figure 7,
using pure IL or mixed with MeOH brings about a massive reduction in CO2 emission from
power plants. Indirect CO2 generated by the 243.2 K pure MeOH process is six times larger
than that of its 243.2 K pure IL counterpart.
Moreover, while elevated pressure is essential to CO2 physical absorption, in an attempt
to examine a lower-pressure condition, pressures of the feed gas and TW1 in the 243.2 K
pure IL process are brought down to 4 MPa. It revealed that by equipping TW1 with another
side-draw cooling loop (7+7+6), the captured CO2 rate decreases only by 1.52%, still
Page 19 of 49
AIChE Journal
AIChE Journal
This article is protected by copyright. All rights reserved.
20
separating 98.32% (5951.13 kmol·h-1
) of the CO2 fed to the system, with no considerable
change to other performance measures, e.g., PSEP equals to 0.047 GJ/kmol captured CO2.
Viscosity, toxicity, and cost of the deployed IL are of significant practical value to its
industrial exploitation. [AMIM]+[Tf2N]
- belongs to the family of low-viscous ILs since it has
a viscosity of 31.9 mPa·s at 298.2 K, far below the acceptable limit of 100 mPa.s for
industrial applications.92,108-110
High CO2 uptake in a pure IL as well as the addition of MeOH
to an IL also can cause a drastic reduction in viscosity of the fluid. Liu et al. demonstrated
that upon the dissolution of 50 mol% CO2 at 313.2 K and 6 MPa, the viscosity of
[BMIM]+[PF6]
- drops from 92 mPa·s to 32 mPa·s.
111 Therefore, in this work, viscosity of
[AMIM]+[Tf2N]
- doesn’t seem to be a barrier to its implementation. To our knowledge, the
only direct toxicity assessment of [AMIM]+[Tf2N]
- was reported towards human HeLa cell.
112
Out of 40 distinct ILs ranging 48 h EC50 values from 80 to 34000 µmol·L-1
, [AMIM]+[Tf2N]
-
has a value of 1630 µmol.L-1
(higher values denote lower toxicity). In general, although for
some biological targets [Tf2N]- might be regarded as a toxic anion, the allyl-substituted
[AMIM]+ can moderate the harmfulness degree whereby the cations containing smaller
number of carbon atoms in their substituents demonstrate lower toxicity.112-116
Finally, ILs
typically costs up to 100 times more than organic solvents.117
For our experiment, there was
an 80-fold difference in price between 1 kg [AMIM]+[Tf2N]
- and 1 kg MeOH. Accordingly,
with respect to solvent losses of the two 243.2 K pure MeOH and pure IL processes in Table
6, MeOH is 298 times costlier than [AMIM]+[Tf2N]
-. In this regard, the initial cost of IL
solvent is higher; however, the operating expense due to its running losses is much lower. The
vaporized MeOH in the acid gas stream may be further water washed, which adds on the
Page 20 of 49
AIChE Journal
AIChE Journal
This article is protected by copyright. All rights reserved.
21
process cost in turn. Therefore, the higher price of [AMIM]+[Tf2N]
- doesn’t necessarily
impair the commercial promise of its implementation.
Development and techno-economic analysis of a whole IL-integrated sour gas treating
process requires intermolecular knowledge of other compounds such as AR, CH4, H2S, N2,
and COS with ILs, which will be addressed in the future work.
Conclusions
In this work, the experimental CO2 solubility data in pure IL, pure MeOH, and mixed
IL-MeOH solvents at different temperatures (313.2, 333.2, and 353.2 K) and pressures up to
6.5 MPa were measured. Adding certain quantities of IL to MeOH brings about an increase in
CO2 solubility in the liquid phase and a decrease in the volatile MeOH content in the gas
phase. Mole fraction of CO2 in pure [AMIM]+[Tf2N]
- reaches around 0.6, 0.5, and 0.4 at
pressure of 6 MPa and temperatures of 313.2, 333.2, and 353.2 K, respectively. The
experimental CO2 solubility data in pure [AMIM]+[Tf2N]
- and pure MeOH along with those
exhaustively collected from the literature were correlated with the UNIFAC-Lei model to
obtain the group interaction parameters for further prediction of CO2 solubility in the solvents
investigated. Both experimental data and predicted values agree well with the ARDs below
10%. Moreover, since process simulation involving H2 and CO compounds has to be carried
out in this work, the H2 and CO solubility data in MeOH coming from the literature were
used to correlate the CH3OH/H2 and CH3OH/CO parameters. Together with the CH3OH-CO2
and C=C-CO2 parameters, 8 new group binary interaction parameters were evaluated and
added to the current UNIFAC-Lei parameter matrix.
The newly obtained UNIFAC-Lei parameters are important because, as what we did here,
Page 21 of 49
AIChE Journal
AIChE Journal
This article is protected by copyright. All rights reserved.
22
they can be easily incorporated into the modern process simulation softwares to design and
optimize the absorption processes. A non-volatile physical solvent with a high CO2 uptake
capacity at a higher temperature would improve the efficiency of the currently widely
industrialized energy-intensive CO2 capture processes, which should be operated at deep low
temperatures. Therefore, the comparison between pure MeOH process and four other
IL-integrated processes for CO2 capture shows the practical applicability and effectiveness of
ILs in capturing CO2. Besides having the advantage of less or almost no solvent loss, the
mixed IL-MeOH process operating at low temperature or the pure IL processes operating at
either low or high temperatures lessen the power consumption substantially, while producing
nearly the same amount of fuel gases. This also leads to a massive reduction in indirect CO2
emission sourcing from the power plants. Moreover, both mixed IL-MeOH and pure IL
processes using the same amount of solvent as the pure MeOH process and operating at the
same temperature, i.e., 243.2 K, capture more CO2 and release less CO2 along with the
purified gases.
Acknowledgements
This work was financially supported by the National Natural Science Foundation of China under
grants (Nos. 21476009, 21406007, and U1462104), and by the Higher Education and High-quality and
World-class Universities (PY201608).
Page 22 of 49
AIChE Journal
AIChE Journal
This article is protected by copyright. All rights reserved.
23
Literature Cited
1. WMO Greenhouse Gas Bulletin. No. 12: January 2017. Available at:
http://www.wmo.int/pages/prog/arep/gaw/ghg/GHGbulletin.html; accessed November 29, 2016.
2. Figueroa JD, Fout T, Plasynski S, McIlvried H, Srivastava RD. Advances in CO2 capture
technology-The U.S. Department of Energy’s Carbon Sequestration Program. Int J Greenh Gas Con.
2008;2:9-20.
3. Li B, Duan Y, Luebke D, Morreale B. Advances in CO2 capture technology: A patent review. Appl
Energy. 2013;12:1439-1447.
4. Heintz YJ, Sehabiague L, Morsi BI, Jones KL, Pennline HW. Novel physical solvents for selective
CO2 capture from fuel gas streams at elevated pressures and temperatures. Energy & Fuels.
2008;22:3824-3837.
5. Chen WH, Chen SM, Hung CI. Carbon dioxide capture by single droplet using Selexol, Rectisol and
water as absorbents: A theoretical approach. Appl Energy. 2013;111:731-741.
6. White CM, Strazisar BR, Granite EJ, Hoffman JS, Pennline HW. Separation and capture of CO2
from large stationary sources and sequestration in geological formations-coalbeds and deep saline
aquifers. J Air Waste Manage Assoc. 2003;53:645-715.
7. Mokhatab S, Poe WA. Handbook of Natural Gas Transmission and Processing, 2nd ed. Boston: Gulf
Professional Publishing, 2012.
8. Olajire AA. CO2 capture and separation technologies for end-of-pipe applications-A review. Energy.
2010;35:2610-2628.
9. Koytsoumpa EI, Atsonios K, Panopoulos KD, Karellas S, Kakaras E, Karl J. Modelling and
assessment of acid gas removal processes in coal-derived SNG production. Appl Therm Eng.
2015;74:128-135.
10. Gatti M, Martelli E, Marechal F, Consonni S. Review, modeling, Heat Integration, and improved
schemes of Rectisol®
-based processes for CO2 capture. Appl Therm Eng. 2014;70:1123-1140.
11. Zamam M, Lee JH. Carbon capture from stationary power generation sources: A review of the current
status of the technologies. Korean J Chem Eng. 2013;30:1497-1526.
12. Hasib-ur-Rahman M, Siaj M, Larachi F. Ionic liquids for CO2 capture-Development and progress.
Chem Eng Process. 2010;49:313-322.
13. Theo WL, Lim JS, Hashim H, Mustaffa AA, Ho WS. Review of pre-combustion capture and ionic
Page 23 of 49
AIChE Journal
AIChE Journal
This article is protected by copyright. All rights reserved.
24
liquid in carbon capture and storage. Appl Energy. 2016;183:1633-1663.
14. Soriano AN, Doma Jr BT, Li MH. Carbon dioxide solubility in some ionic liquids at moderate
pressures. J Taiwan Inst Chem E. 2009;40:387-393.
15. Jalili AH, Mehdizadeh A, Shokouhi M, Sakhaeinia H, Taghikhani V. Solubility of CO2 in
1-(2-hydroxyethyl)-3-methylimidazolium ionic liquids with different anions. J Chem Thermodyn.
2010;42:787-791.
16. Raeissi S, Florusse LJ, Peters CJ. Purification of flue gas by ionic liquids: carbon monoxide capture in
[bmim][Tf2N]. AIChE J. 2013;59:3886-3891.
17. Valencia-Marquez D, Flores-Tlacuahuac A, Ricardez-Sandoval L. A controllability analysis of a
pilot-scale CO2 capture plant using ionic liquids. AIChE J. 2016;62:3298-3309.
18. Jalili AH, Mehdizadeh A, Shokouhi M, Ahmadi AN, Hosseini-Jenab M, Fateminassab F. Solubility
and diffusion of CO2 and H2S in the ionic liquid 1-ethyl-3-methylimidazolium ethylsulfate. J Chem
Thermodyn. 2010;42:1298-1303.
19. Heintz YJ, Sehabiague L, Morsi BI, Jones KL, Luebke DR, Pennline HW. Hydrogen sulfide and
carbon dioxide removal from dry fuel gas streams using an ionic liquid as a physical solvent. Energy
& Fuels. 2009;23:4822-4830.
20. Zubeir LF, Lipman PJL, Awwad N, Peters CJ, Kroon MC, Schaaf J. Novel method for determination
of gas solubilities in low vapor pressure liquids. AIChE J. 2017;63:2981-2986.
21. Secuianu C, Feroiu V, Geană D. Phase equilibria experiments and calculations for carbon dioxide +
methanol binary system. Cent Eur J Chem. 2009;7:1-7.
22. Chang T, Rousseau RW. Solubilities of carbon dioxide in methanol and methanol-water at high
pressures: experimental data and modeling. Fluid Phase Equilib. 1985;23:243-258.
23. Ohgaki K, Katayama T. Isothermal vapor-liquid equilibrium data for binary systems containing
carbon dioxide at high pressures: methanol-carbon dioxide, n-hexane-carbon dioxide, and
benzene-carbon dioxide systems. J Chem Eng Data. 1976;21:53-55.
24. Chang CJ, Day CY, Ko CM, Chiu KL. Densities and P-x-y diagrams for carbon dioxide dissolution in
methanol, ethanol, and acetone mixtures. Fluid Phase Equilib. 1997;131:243-258.
25. Brunner E, Hültenschmidt W, Schlichthärle G. Fluid mixtures at high pressures Ⅳ Isothermal phase
equilibria in binary mixtures consisting of (methanol + hydrogen or nitrogen or methane or carbon
monoxide or carbon dioxide). J Chem Thermodyn. 1987;19:273-291.
Page 24 of 49
AIChE Journal
AIChE Journal
This article is protected by copyright. All rights reserved.
25
26. Leu AD, Chung SYK, Robinson DB. The equilibrium phase properties of (carbon dioxide +
methanol). J Chem Thermodyn. 1991;23:979-985.
27. Anthony JL, Anderson JL, Maginn EJ, Brennecke JF. Anion effects on gas solubility in ionic liquids. J
Phys Chem B. 2005;109:6366-6374.
28. Anthony JL, Maginn EJ, Brennecke JF. Solubilities and thermodynamic properties of gases in the
ionic liquid 1-n-butyl-3-methylimidazolium hexafluorophosphate. J Phys Chem B.
2002;106:7315-7320.
29. Muldoon MJ, Aki SNVK, Anderson JL, Dixon JK, Brennecke JF. Improving carbon dioxide solubility
in ionic liquids. J Phys Chem B. 2007;111:9001-9009.
30. Ramdin M, Loos TW, Vlugt TJH. State-of-the-art of CO2 capture with ionic liquids. Ind Eng Chem
Res. 2012;51:8149-8177.
31. Cao Y, Mu T. Comprehensive investigation on the thermal stability of 66 ionic liquids by
thermogravimetric analysis. Ind Eng Chem Res. 2014;53:8651-8664.
32. Nonthanasin T, Henni A, Saiwan C. Densities and low pressure solubilities of carbon dioxide in five
promising ionic liquids. RSC Adv. 2014;4:7566-7578.
33. Kim YS, Choi WY, Jang JH, Yoo KP, Lee CS. Solubility measurement and prediction of carbon
dioxide in ionic liquids. Fluid Phase Equilib. 2005;228-229:439-445.
34. Breure B, Bottini SB, Witkamp GJ, Peters CJ. Thermodynamic modeling of the phase behavior of
binary systems of ionic liquids and carbon dioxide with the group contribution equation of state. J
Phys Chem B. 2007;111:14265-14270.
35. Althuluth M, Berrouk A, Kroon MC, Peters CJ. Modeling solubilities of gases in ionic liquid
1-ethyl-3-methylimidazolium tris(pentafluoroethyl)trifluorophosphate using the Peng-Robinson
equation of state. Ind Eng Chem Res. 2014;53:11818-11821.
36. Kroon MC, Karakatsani EK, Economou IG, Witkamp GJ, Peters CJ. Modeling of the carbon dioxide
solubility in imidazolium-based ionic liquids with the tPC-PSAFT equation of state. J Phys Chem B.
2006;110:9262-9269.
37. Chen Y, Mutelet F, Jaubert JN. Modeling the solubility of carbon dioxide in imidazolium-based ionic
liquids with the PC-SAFT equation of state. J Phys Chem B. 2012;116:14375-14388.
38. Andreu JS, Vega LF. Modeling the solubility behavior of CO2, H2, and Xe in [Cn-mim][Tf2N] ionic
liquids. J Phys Chem B. 2008;112:15398-15406.
Page 25 of 49
AIChE Journal
AIChE Journal
This article is protected by copyright. All rights reserved.
26
39. Kim JE, Lim JS, Kang JW. Measurement and correlation of solubility of carbon dioxide in
1-alkyl-3-methylimidazolium hexafluorophosphate ionic liquids. Fluid Phase Equilib.
2011;306:251-255.
40. Dai C, Lei Z, Wang W, Xiao L, Chen B. Group contribution lattice fluid equation of state for
CO2-ionic liquid systems: an experimental and modeling study. AIChE J. 2013;59:4399-4412.
41. Mortazavi-Manesh S, Satyro M, Marriott RA. Modeling carbon dioxide solubility in ionic liquids.
Can J Chem Eng. 2013;91:783-789.
42. Hossain MZ, Teja AS. Extension of an associated lattice-fluid equation of state to CO2 + ionic liquid
systems. J Chem Eng Data. 2014;59:1038-1044.
43. Lei Z, Chen B, Li C, Liu H. Predictive molecular thermodynamic models for liquid solvents, solid
salts, polymers, and ionic liquids. Chem Rev. 2008;108:1419-1455.
44. Lei Z, Zhang J, Li Q, Chen B. UNIFAC model for ionic liquids. Ind Eng Chem Res.
2009;48:2697-2704.
45. Lei Z, Dai C, Liu X, Xiao L, Chen B. Extension of the UNIFAC model for ionic liquids. Ind Eng
Chem Res. 2012;51:12135-12144.
46. Lei Z, Dai C, Wang W, Chen B. UNIFAC model for ionic liquid-CO2 systems. AIChE J.
2014;60:716-729.
47. Lei Z, Dai C, Yang Q, Zhu J, Chen B. UNIFAC model for ionic liquid-CO (H2) systems: an
experimental and modeling study on gas solubility. AIChE J. 2014;60:4222-4231.
48. Dai C, Lei Z, Chen B. Predictive thermodynamic models for ionic liquid-SO2 systems. Ind Eng Chem
Res. 2015;54:10910-10917.
49. Han J, Lei Z, Dong Y, Dai C, Chen B. Process intensification on the separation of benzene and
thiophene by extractive distillation. AIChE J. 2015;61:4470-4480.
50. Dai C, Dong Y, Han J, Lei Z. Separation of benzene and thiophene with a mixture of
N-methyl-2-pyrrolidinone (NMP) and ionic liquid as the entrainer. Fluid Phase Equilib.
2015;388:142-150.
51. Lei Z, Dai C, Chen B. Gas solubility in ionic liquids. Chem Rev. 2013;114:1289-1326.
52. Chávez-Islas LM, Vásquez-Medrano R, Flores-Tlacuahuac A. Optimal synthesis of a high purity
bioethanol distillation column using ionic liquids. Ind Eng Chem Res. 2011;50:5175-5190.
53. Valencia-Marquez D, Flores-Tlacuahuac A, Vasquez-Medrano R. Simultaneous optimal design of an
Page 26 of 49
AIChE Journal
AIChE Journal
This article is protected by copyright. All rights reserved.
27
extractive column and ionic liquid for separation of bioethanol-water mixtures. Ind Eng Chem Res.
2012;51:5866-5880.
54. Aniya V, De D, Satyavathi B. Comprehensive approach toward dehydration of tert-butyl alcohol by
extractive distillation: entrainer selection, thermodynamic modeling and process optimization. Ind
Eng Chem Res. 2016;55:6982-6995.
55. Harini M, Jian S, Adhikari J, Noronha SB, Rani KY. Design of an ionic liquid as a solvent for the
extraction of a pharmaceutical intermediate. Sep Purif Technol. 2015;155:45-57.
56. Chong FK, Eljack FT, Atilhan M, Foo DCY, Chemmangattuvalappil NG. A systematic visual
methodology to design ionic liquids and ionic liquid mixtures: Green solvent alternative for carbon
capture. Comput Chem Eng. 2016;91:219-232.
57. Roughton BC, Christian B, White J, Camarda KV, Gani R. Simultaneous design of ionic liquid
entrainers and energy efficient azeotropic separation processes. Comput Chem Eng. 2012;42:248-262.
58. Chong FK, Foo DCY, Eljack FT, Atilhan M, Chemmangattuvalappil NG. A systematic approach to
design task-specific ionic liquids and their optimal operating conditions. Mol Syst Des Eng.
2016;1:109-121.
59. Lei Z, Yuan J, Zhu J. Solubility of CO2 in propanone, 1-ethyl-3-methylimidazolium tetrafluoroborate,
and their mixtures. J Chem Eng Data. 2010;55:4190-4194.
60. Smith JM, Van Ness HC, Abbott MM. Introduction to chemical engineering thermodynamics, 7th ed.
New York: McGraw-Hill, 2005.
61. Kragten J. Calculating standard deviations and confidence intervals with a universally applicable
spreadsheet technique. Analyst. 1994;119:2161-2165.
62. Fredenslund A, Jones RL, Pransnitz JM. Group contribution estimation of activity coefficients in
nonideal liquid mixture. AIChE J. 1975;21:1086-1099.
63. Kato R, Gmehling J. Systems with ionic liquids: Measurement of VLE and γ∞ data and prediction of
their thermodynamic behavior using original UNIFAC, mod. UNIFAC(Do) and COSMO-RS(Ol). J
Chem Thermodyn. 2005;37:603-619.
64. Lei Z, Arlt W, Wasserscheid P. Selection of entrainers in the 1-hexene/n-hexane system with a limited
solubility. Fluid Phase Equilib. 2007;260:29-35.
65. Santiago RS, Santos GR, Aznar M. liquid-liquid equilibrium in ternary ionic liquid systems by
UNIFAC: New volume, surface area and interaction parameters. Part I. Fluid Phase Equilib.
Page 27 of 49
AIChE Journal
AIChE Journal
This article is protected by copyright. All rights reserved.
28
2010;295:93-97.
66. Santiago RS, Aznar M. liquid-liquid equilibrium in ternary ionic liquid systems by UNIFAC: New
volume, surface area and interaction parameters. Part II. Fluid Phase Equilib. 2011;303:111-114.
67. Nebig S, Bölts R, Gmehling J. Measurement of vapor-liquid equilibria (VLE) and excess enthalpies
(HE) of binary systems with 1-alkyl-3-methylimidazolium bis(trifluoromethylsulfonyl)imide and
prediction of these properties and γ∞ using modified UNIFAC (Dortmund). Fluid Phase Equilib.
2007;258:168-178.
68. Nebig S, Liebert V, Gmehling J. Measurement and prediction of activity coefficients at infinite
dilution (γ∞), vapor-liquid equilibria (VLE) and excess enthalpies (HE) of binary systems with
1,1-dialkyl-pyrrolidinium bis(trifluoromethylsulfonyl)imide using mod. UNIFAC (Dortmund). Fluid
Phase Equilib. 2009;277:61-67.
69. Nebig S, Gmehling J. Measurements of different thermodynamic properties of systems containing
ionic liquids and correlation of these properties using modified UNIFAC (Dortmund). Fluid Phase
Equilib. 2010;294:206-212.
70. Alevizou EI, Pappa GD, Voutsas EC. Prediction of phase equilibrium in mixtures containing ionic
liquids using UNIFAC. Fluid Phase Equilib. 2009;284:99-105.
71. Bermejo MD, Martin A, Foco G, Cocero MJ, Bottini SB, Peters CJ. Application of a group
contribution equation of state for the thermdynamic modeling of the binary systems
CO2–1-butyl-3-methyl imidazolium nitrate and CO2–1-hydroxy-1-methyl imidazolium nitrate. J
Supercrit Fluids. 2009;50:112-117.
72. Acree JR WE. Thermodynamic properties of nonelectrolyte solutions. Orlando: Academic Press,
1984.
73. Abrams DS, Prausnitz JM. Statistical thermodynamics of liquid mixtures: a new expression of the
excess Gibbs energy of partly or completely miscible systems. AIChE J. 1975;21:116-128.
74. Hong JH, Kobayashi R. Vapor-liquid equilibrium studies for the carbon dioxide-methanol system.
Fluid Phase Equilib. 1988;41:269-276.
75. Suzuki K, Sue H. Isothermal vapor-liquid equilibrium data for binary systems at high pressures:
carbon dioxide-methanol, carbon dioxide-ethanol, carbon dioxide-1-propanol, methane-ethanol,
methane-1-propanol, ethane-ethanol, and ethane-1-propanol systems. J Chem Eng Data.
1990;35:63-66.
Page 28 of 49
AIChE Journal
AIChE Journal
This article is protected by copyright. All rights reserved.
29
76. Yoon JH, Lee HS, Lee H. High-pressure vapor-liquid equilibria for carbon dioxide + methanol,
carbon dioxide + ethanol, and carbon dioxide + methanol + ethanol. J Chem Eng Data.
1993;38:53-55.
77. Lei Z, Zhang B, Zhu J, Gong W, Lv J, Li Y. Solubility of CO2 in methanol,
1-octyl-3-methylimidazolium bis(trifluoromethylsulfonyl)imide, and their mixtures. Chinese J Chem
Eng. 2013;21:310-317.
78. Dai C, Wei W, Lei Z, Li C, Chen B. Absorption of CO2 with methanol and ionic liquid mixture at low
temperatures. Fluid Phase Equilib. 2015;391:9-17.
79. Zhu HG, Tian YL, Chen L, Feng JJ, Fu HF. Studies on vapor-liquid phase equilibria for SCF CO2 +
CH3OH and SCF CO2 + C2H5OH systems. Chem J Chinese U. 2002;23:1588-1591 (in Chinese).
80. Joung SN, Yoo CW, Shin HY, Kim SY, Yoo KP, Lee CS, Huh WS. Measurements and correlation of
high-pressure VLE of binary CO2-alcohol systems (methanol, ethanol, 2-methoxyethanol and
2-ethpxyethanol). Fluid Phase Equilib. 2001;185:219-230.
81. Reighard TS, Lee ST, Olesik SV. Determination of methanol/CO2 and acetonitrile/CO2 vapor-liquid
phase equilibria using a variable-volume view cell. Fluid Phase Equilib. 1996;123:215-230.
82. Bezanehtak K, Combes GB, Dehghani F, Foster NR. Vapor-liquid equilibrium for binary systems of
carbon dioxide + methanol, hydrogen + methanol, and hydrogen + carbon dioxide at high pressures. J
Chem Eng Data. 2002;47:161-168.
83. Nocon G, Weidlich U, Gmehling J, Menke J, Onken U. Prediction of gas solubilities by a modified
UNIFAC equation. Fluid Phase Equilib. 1983;13:381-392.
84. Skjold-Jørgensen S, Kolbe B, Gmehling J, Rasmussen P. Vapor-liquid equilibria by UNIFAC group
contribution. Revision and extension. Ind Eng Chem Process Des Dev. 1979;18:714-722.
85. Hansen HK, Rasmussen P, Fredenslund A, Schiller M, Gmehling J. Vapor-liquid equilibria by
UNIFAC group contribution. 5. Revision and extension. Ind Eng Chem Res. 1991;30:2352-2355.
86. Span R, Wagner W. A new equation of state for carbon dioxide covering the fluid region from the
triple-point temperature to 1100 K at pressures up to 800 MPa. J Phys Chem Ref Data.
1996;25:1509-1596.
87. Shiflett MB, Yokozeki A. Solubility and diffusivity of hydrocarbons in room-temperature ionic liquids.
AIChE J. 2006;52:1205-1219.
88. Kohl AL, Nielsen RB. Gas purification, 5th ed. Houston: Gulf Publishing Co., 1997.
Page 29 of 49
AIChE Journal
AIChE Journal
This article is protected by copyright. All rights reserved.
30
89. Sun L, Smith R. Rectisol wash process simulation and analysis. J Clean Prod. 2013;39:321-328.
90. Yang S, Qian Y, Yang S. Development of a full CO2 capture process based on the Rectisol was
technology. Ind Eng Chem Res. 2016;55:6186-6193.
91. Valderrama JO, Rojas RE. Critical properties of ionic liquids. Revised. Ind Eng Chem Res.
2009;48:6890-6900.
92. Wlazło M, Karpińska M, Domańska U. Thermodynamics and selectivity of separation based on
activity coefficients at infinite dilution of various solutes in 1-allyl-3-methylimidazolium
bis{(trifluoromethyl)sulfonyl}imide ionic liquid. J Chem Thermodyn. 2016;102:39-47.
93. Domańska U, Królikowski M, Zawadzki M, Wróblewska A. Phase equilibrium investigation with
ionic liquids and selectivity in separation of 2-phenylethanol from water. J Chem Thermodyn.
2016;102:357-366.
94. Ge R, Hardacre C, Jacquemin J, Nancarrow P, Rooney DW. Heat capacities of ionic liquids as a
function of temperature at 0.1 MPa. Measurement and prediction. Ind Eng Chem Res.
2008;53:2148-2153.
95. Descamps C, Coquelet C, Bouallou C, Richon D. Solubility of hydrogen in methanol at temperatures
from 248.41 to 308.20. Thermochima Acta. 2005;430:1-7.
96. Liu Q, Takemura F, Yabe A. Solubility of hydrogen in liquid methanol and methyl formate at 20 oC to
140 oC. J Chem Eng Data. 1996;41:1141-1143.
97. Walnwright MS, Ahn T, Trimm DL. Solubility of hydrogen in alcohols and esters. J Chem Eng Data.
1987;32:22-24.
98. Choudhary VR, Sane MG, Vadgaonkar HG. Solubility of hydrogen in methanol containing reaction
species for hydrogenation of o-nitrophenol. J Chem Eng Data. 1986;31:294-296.
99. Liu Q. Solubility of carbon monoxide in liquid phase methyl formate and methanol at various
pressures and temperatures. J of the M.E.S.J. 1998;4:300-305 (in Japanese).
100. Liu Q, Takemura F, Yabe A. Solubility and diffusivity of carbon monoxide in liquid methanol. J Chem
Eng Data. 1996;41:589-592.
101. Tonner SP, Walnwright MS, Trimm DL. Solubility of carbon monoxide in alcohols. J Chem Eng Data.
1983;28:59-61.
102. Fogg PGT, Gerrard W. Solubility of Gases in Liquids: A Critical Evaluation of Gas/Liquid Systems in
Theory and Practice. New York: Wiley, 1991.
Page 30 of 49
AIChE Journal
AIChE Journal
This article is protected by copyright. All rights reserved.
31
103. Gmehling J, Rasmussen P, Fredenslund A. Vapor-liquid equilibria by UNIFAC group contribution.
Revision and extension. 2. Ind Eng Chem Process Des Dev. 1982;21:118-127.
104. Kleiber M. An extension to the UNIFAC group assignment for prediction of vapor-liquid equilibria of
mixtures containing refrigerants. Fluid Phase Equilib. 1995;107:161-188.
105. Wittig R, Lohmann J, Gmehling J. Vapor-liquid equilibria by UNIFAC group contribution. 6.
Revision and extension. Ind Eng Chem Res. 2003;42:183-188.
106. Dong L, Zheng D, Wu X. Working pair selection of compression and absorption hybrid cycles
through predicting the activity coefficients of hydrofluorocarbon + ionic liquid systems by the
UNIFAC model. Ind Eng Chem Res. 2012;51:4741-4747.
107. United States Electricity Profile 2015. U.S. Energy Information Administration. Release date: January
17, 2017. Available at: http://www.eia.gov/electricity/state/unitedstates; accessed July 18, 2017.
108. Seiler M, Jork C, Kavarnou A, Arlt W, Hirsch R. Separation of azeotropic mixtures using
hyperbranched polymers or ionic liquids. AIChE J. 2004;50:2439-2454.
109. Orchillés AV, Miguel PJ, Vercher E, Martínez-Andreu A. Using 1-ethyl-3-methylimidazolium
trifluoromethanesulfonate as an entrainer for the extractive distillation of ethanol + water mixtures. J
Chem Eng Data. 2010;55:1669-1674.
110. Chai M, Jin Y, Fang S, Yang L, Hirano S, Tachibana K. Ether-functionalized pyrazolium ionic liquids
as new electrolytes for lithium battery. Electrochimica Acta. 2012;66:67-74.
111. Liu Z, Wu W, Han B, Dong Z, Zhao G, Wang J, Jiang T, Yang G. Study on the phase behaviors,
viscosities, and thermodynamic properties of CO2/[C4mim][PF6]/methanol system at elevated
pressures. Chem. Eur. J. 2003;9:3897-3903.
112. Wang X, Ohlin CA, Lu Q, Fei Z, Hu J, Dyson PJ. Cytotoxicity of ionic liquids and precursor
compounds towards human cell line HeLa. Green Chem. 2007;9:1191-1197.
113. Ventura SPM, Gonçalves AMM, Sintra T, Pereira JL, Gonçalves F, Coutinho JAP. Designing ionic
liquids: the chemical structure role in the toxicity. Ecotoxicology. 2013;22:1-12.
114. Egorova KS, Ananikov VP. Toxicity of ionic liquids: eco(cyto)activity as complicated, but
unavoidable parameter for task-specific optimization. Chemsuschem. 2014;7:336-360.
115. Pretti C, Chiappe C, Baldetti I, Brunini S, Monni G, Intorre L. Acute toxicity of ionic liquids for three
fresh water organisms: Pseudokirchneriella subcapitata, Daphnia magna and Danio rerio. Ecotox.
Environ. Safe. 2009;72:1170-1176.
Page 31 of 49
AIChE Journal
AIChE Journal
This article is protected by copyright. All rights reserved.

32
116. Frade RFM, Matias A, Branco LC, Afonso CAM, Duarte CMM. Effect of ionic liquids on human
colon carcinoma HT-29 and CaCo-2 cell lines. Green Chem. 2007;9:873-877.
117. Plechkova NV, Seddon KR. Applications of ionic liquids in the chemical industry. Chem. Soc. Rev.
2008;37:123-150.
Page 32 of 49
AIChE Journal
AIChE Journal
This article is protected by copyright. All rights reserved.
33
Table captions
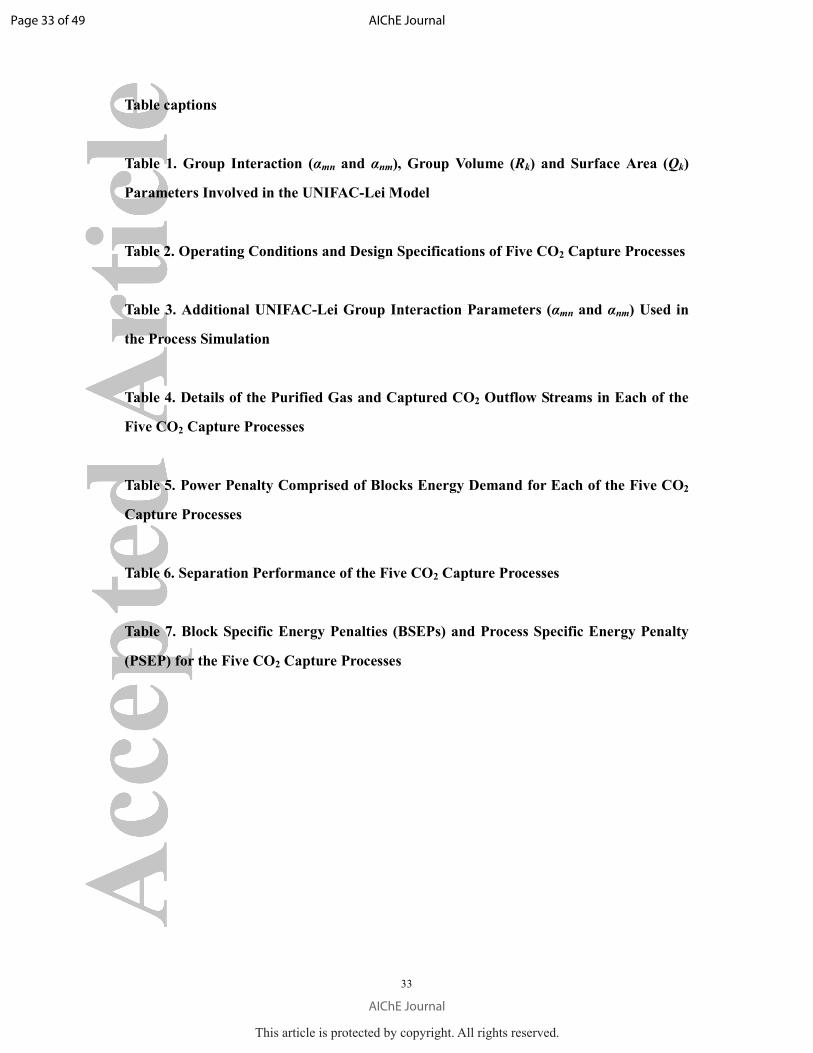
Table 1. Group Interaction (αmn and αnm), Group Volume (Rk) and Surface Area (Qk)
Parameters Involved in the UNIFAC-Lei Model
Table 2. Operating Conditions and Design Specifications of Five CO2 Capture Processes
Table 3. Additional UNIFAC-Lei Group Interaction Parameters (αmn and αnm) Used in
the Process Simulation
Table 4. Details of the Purified Gas and Captured CO2 Outflow Streams in Each of the
Five CO2 Capture Processes
Table 5. Power Penalty Comprised of Blocks Energy Demand for Each of the Five CO2
Capture Processes
Table 6. Separation Performance of the Five CO2 Capture Processes
Table 7. Block Specific Energy Penalties (BSEPs) and Process Specific Energy Penalty
(PSEP) for the Five CO2 Capture Processes
Page 33 of 49
AIChE Journal
AIChE Journal
This article is protected by copyright. All rights reserved.
34
Figure captions
Figure 1. Decomposition of the IL [AMIM]+[Tf2N]
- into individual functional groups.
Figure 2. Flowsheet of the CO2 capture processes developed in this work.
Figure 3. The most recent UNIFAC-Lei parameter matrix.
UNIFAC parameters formerly available in the literature;83-85,103-105
parameters published in our
previous works;44-50
parameters have been submitted for publication; parameters added by other
researchers using the UNIFAC-Lei method;106
new parameters evaluated in this work; parameters
are not available.
Figure 4. Solubility of CO2 (1) in pure [AMIM]+[Tf2N]
- (a), and pure MeOH (b).
Lines, predicted results by the UNIFAC-Lei model; scattered points, experimental data. (▲) 313.2 K; (●)
333.2 K; (■) 353.2 K.
Figure 5. Solubility of CO2 in pure [AMIM]+[Tf2N]
-, pure MeOH, and their binary
mixtures at 313.2 K (a), 333.2 K (b), and 353.2 K (c).
Lines, predicted results by the UNIFAC-Lei model; scattered points, experimental data. ( ) pure
[AMIM]+[Tf2N]
-; (■) 80 wt% [AMIM]
+[Tf2N]
- + 20 wt% MeOH; (●) 50 wt% [AMIM]
+[Tf2N]
- + 50 wt%
MeOH; (▲) 20 wt% [AMIM]+[Tf2N]
- + 80 wt% MeOH; (★) pure MeOH.
Figure 6. Henry’s constants of CO2 (1) in pure [AMIM]+[Tf2N]
-, pure MeOH, and their
binary mixtures.
Lines and unfilled scattered points, predicted results by the UNIFAC-Lei model; filled scattered points,
experimental data. (■) 313.2 K; (●) 333.2 K; (▲) 353.2 K.
Figure 7. Indirect CO2 generated from electricity supply to each of the processes
(PIECO2, comprised of compression, cooling, and heating facilities).
Page 34 of 49
AIChE Journal
AIChE Journal
This article is protected by copyright. All rights reserved.
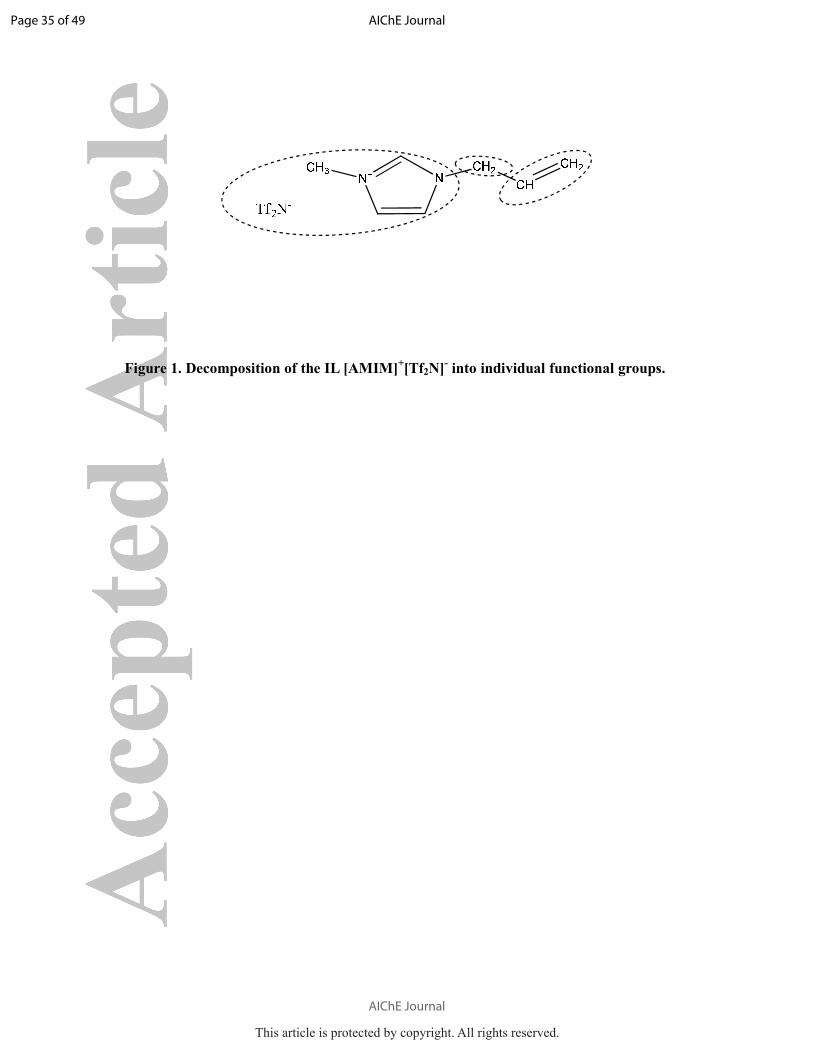
Figure 1. Decomposition of the IL [AMIM]+[Tf2N]
- into individual functional groups.
Page 35 of 49
AIChE Journal
AIChE Journal
This article is protected by copyright. All rights reserved.
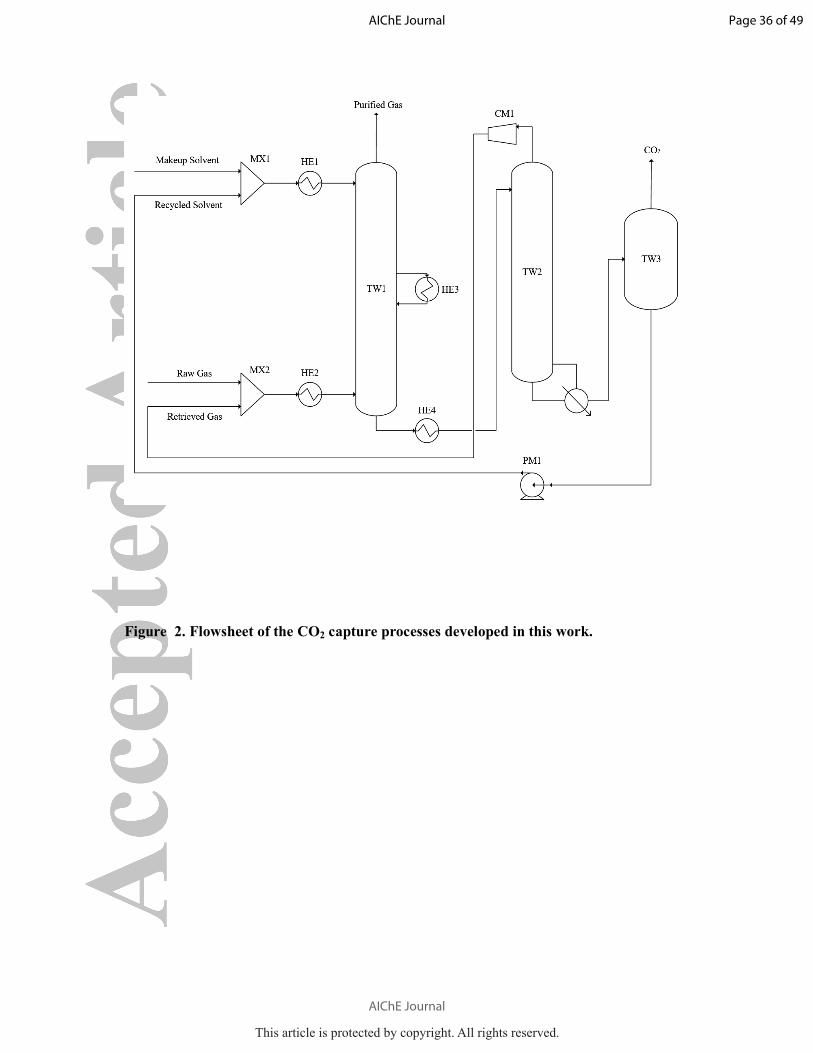
Figure 2. Flowsheet of the CO2 capture processes developed in this work.
Page 36 of 49
AIChE Journal
AIChE Journal
This article is protected by copyright. All rights reserved.
29
28
27
26
25
24
23
22
21
20
19
18
17
16
15
14
13
12
11
10
9
8
7
6
5
4
3
2
1C
H2
C=
C
AC
H
AC
CH
2
OH
CH
3O
H
H2O
AC
OH
CH
2C
O
CH
O
CC
OO
HC
OO
CH
2O
CF
2
CH
F
CH
F2
CH
F3
CO
2
C2H
4
CH
4
O2
CO
H2
SO
2
H2S
N2O
DM
F
NM
P
Thio
ph
ene
[MIM
][B
F4]
[MIM
][T
f2N
]
[MIM
][B
OB
]
[MIM
][T
fO]
[MIM
][M
eSO
3]
[MIM
][M
eSO
4]
[MIM
][E
tSO
4]
[MIM
][C
H3O
C2H
4S
O4]
[MIM
][C
l]
[MIM
][D
EP
O4]
[MIM
][D
MP
O4]
[MIM
][M
DE
GS
O4]
[MIM
][N
O3]
[MIM
][O
cSO
4]
[MIM
][P
F6]
[MIM
][S
bF
6]
[MIM
][S
CN
]
[MIM
][T
CB
]
[MIM
][T
FA
]
[MIM
][T
OS
]
[MIM
][A
c]
[MP
IP][
Tf
2N
]
[MP
IP][
SC
N]
[MP
Y][
BF
4]
[MP
Y][
Tf2
N]
[MP
Y][
TfO
]
[MP
Y][
C2H
5O
C2H
4S
O4]
[MP
Y][
SC
N]
[MP
Y][
TO
S]
[MP
YR
][T
f2N
]
[MP
YR
][T
fO]
[MP
YR
][S
CN
]
[N-C
3O
HP
Y][
Tf2
N]
[N-C
3O
HP
Y][
FA
P]
[(O
CH
2)2
IM][
Tf2
N]
[OC
H2M
IM][
Tf2
N]
[Qu
in][
Tf2
N]
[R1R
2R
3R
4N
][T
f2N
]
[R1
R2
R3
R4
N][
TS
]
[R1
R2
R3
R4P
][B
F4]
[R1
R2R
3R
4P
][T
f2N
]
[R1
R2
R3
R4P
][M
eSO
4]
[R1
R2
R3R
4P
](C
8H
17)2
PO
2
[R1R
2R
3R
4P
][C
l]
[R1
R2
R3R
4P
][F
AP
]
[R1
R2R
3R
4S
][T
f2N
]
1 2 3 4 5 6 7 8 9 10
11
12
13
14
15
16
17
18
19
20
21
22
23
24
25
26
27
28
29
30
31
32
33
34
35
36
37
38
39
40
41
42
43
44
45
46
47
48
49
50
51
52
53
54
55
56
57
58
59
60
61
62
63
64
65
66
67
68
69
70
71
72
73
74
75
Figure 3. The most recent UNIFAC-Lei parameter matrix.
UNIFAC parameters formerly available in the literature;83-85,103-105
parameters published in our previous works;44-50
parameters have been submitted for publication;
parameters added by other researchers using the UNIFAC-Lei model;106
new parameters evaluated in this work; parameters are not available.
Page 37 of 49
AIChE Journal
AIChE Journal
This article is protected by copyright. All rights reserved.
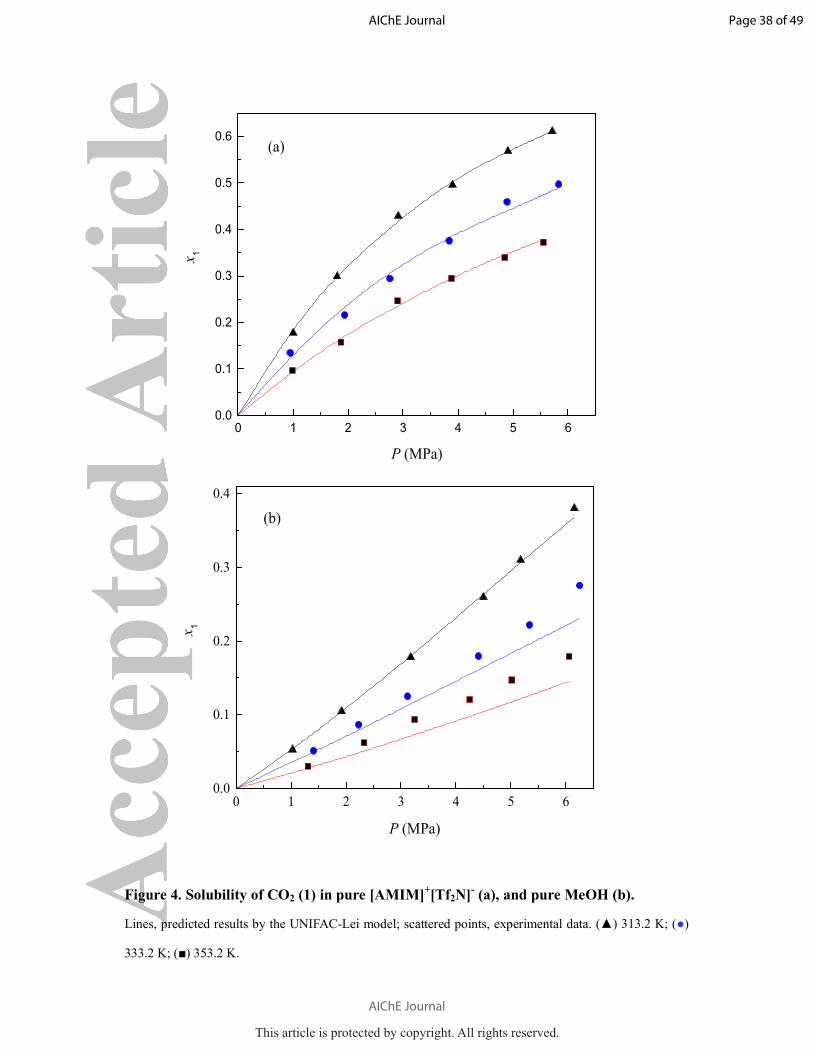
Figure 4. Solubility of CO2 (1) in pure [AMIM]+[Tf2N]
- (a), and pure MeOH (b).
Lines, predicted results by the UNIFAC-Lei model; scattered points, experimental data. (▲) 313.2 K; (●)
333.2 K; (■) 353.2 K.
0 1 2 3 4 5 6
0.0
0.1
0.2
0.3
0.4
0.5
0.6(a)
x1
P (MPa)
0 1 2 3 4 5 60.0
0.1
0.2
0.3
0.4
(b)
x1
P (MPa)
Page 38 of 49
AIChE Journal
AIChE Journal
This article is protected by copyright. All rights reserved.
0 1 2 3 4 5 60.0
0.1
0.2
0.3
0.4
0.5
0.6(a)
x1
P (MPa)
0 1 2 3 4 5 60.0
0.1
0.2
0.3
0.4
0.5
(b)
x1
P (MPa)
Page 39 of 49
AIChE Journal
AIChE Journal
This article is protected by copyright. All rights reserved.
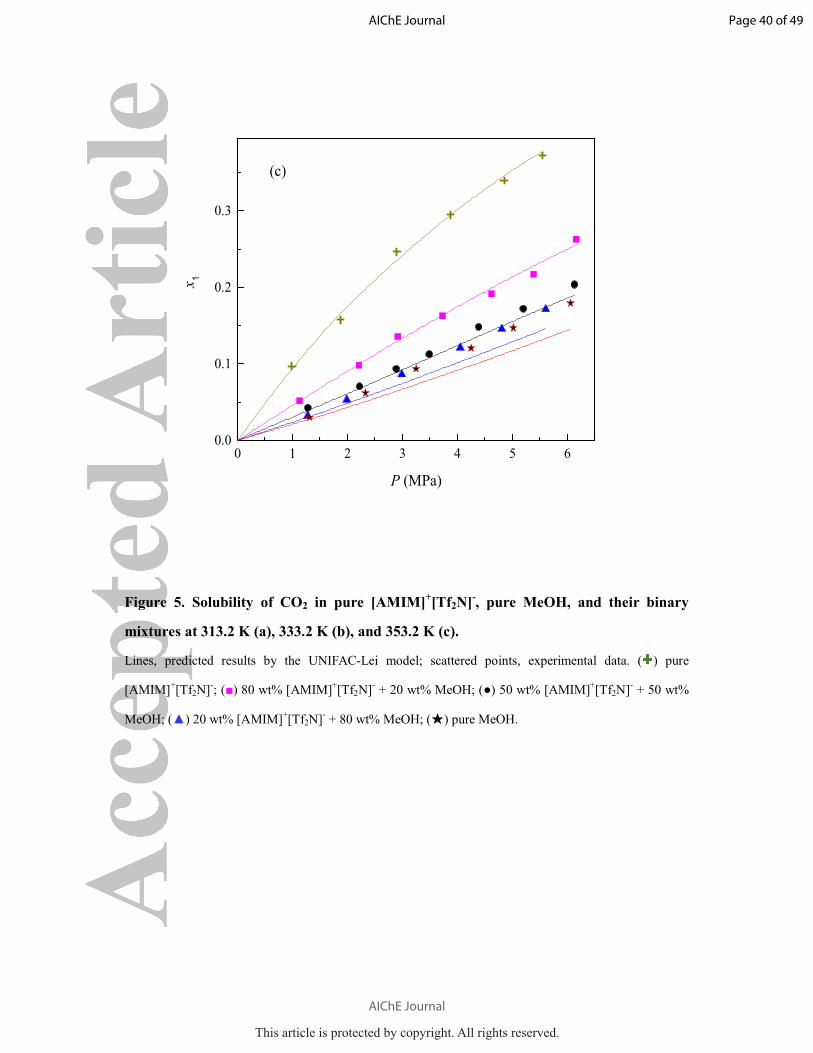
Figure 5. Solubility of CO2 in pure [AMIM]+[Tf2N]
-, pure MeOH, and their binary
mixtures at 313.2 K (a), 333.2 K (b), and 353.2 K (c).
Lines, predicted results by the UNIFAC-Lei model; scattered points, experimental data. ( ) pure
[AMIM]+[Tf2N]
-; (■) 80 wt% [AMIM]
+[Tf2N]
- + 20 wt% MeOH; (●) 50 wt% [AMIM]
+[Tf2N]
- + 50 wt%
MeOH; (▲) 20 wt% [AMIM]+[Tf2N]
- + 80 wt% MeOH; (★) pure MeOH.
0 1 2 3 4 5 60.0
0.1
0.2
0.3
x1
P (MPa)
(c)
Page 40 of 49
AIChE Journal
AIChE Journal
This article is protected by copyright. All rights reserved.
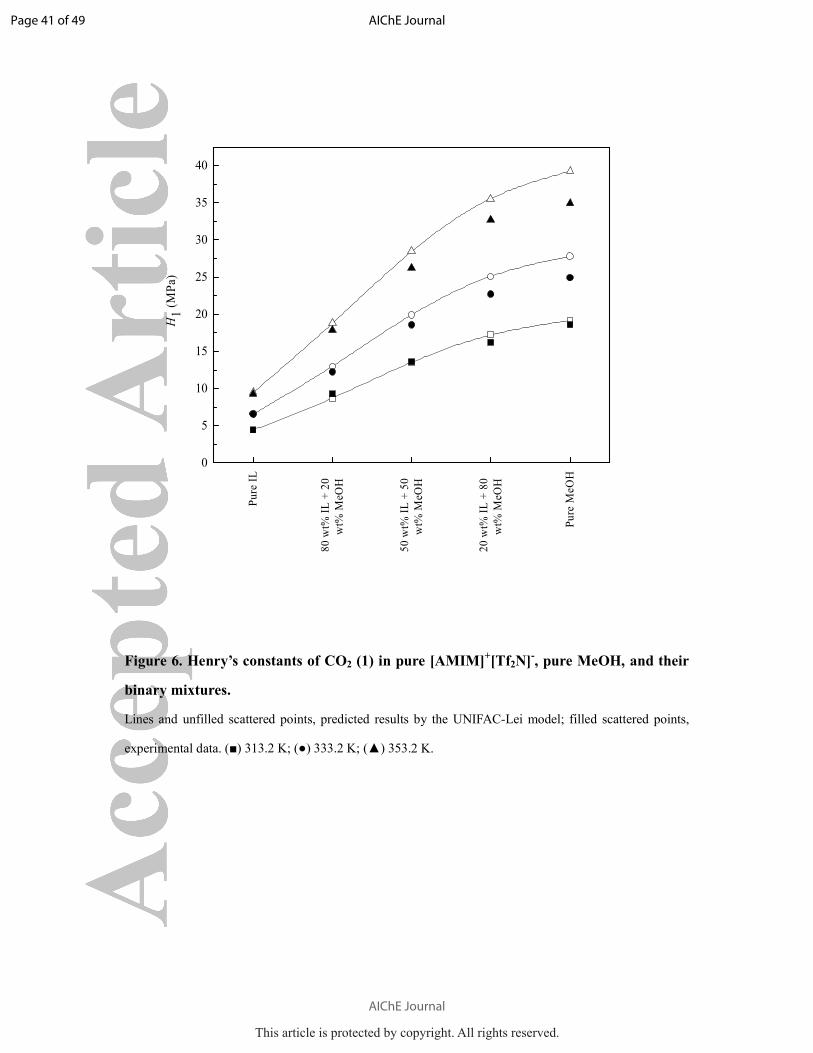
Figure 6. Henry’s constants of CO2 (1) in pure [AMIM]+[Tf2N]
-, pure MeOH, and their
binary mixtures.
Lines and unfilled scattered points, predicted results by the UNIFAC-Lei model; filled scattered points,
experimental data. (■) 313.2 K; (●) 333.2 K; (▲) 353.2 K.
Pu
re I
L
80
wt%
IL
+ 2
0
wt%
MeO
H
50
wt%
IL
+ 5
0
wt%
MeO
H
20
wt%
IL
+ 8
0
wt%
MeO
H
Pu
re M
eOH
0
5
10
15
20
25
30
35
40H
1 (
MP
a)
Page 41 of 49
AIChE Journal
AIChE Journal
This article is protected by copyright. All rights reserved.
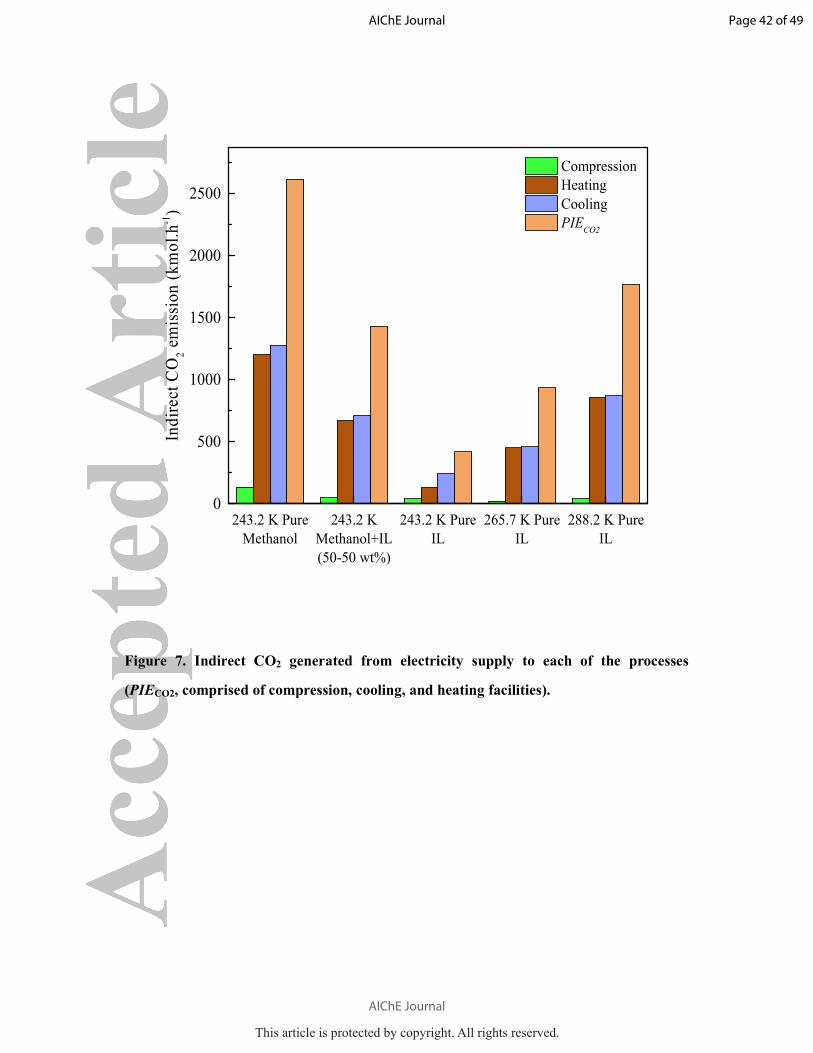
Figure 7. Indirect CO2 generated from electricity supply to each of the processes
(PIECO2, comprised of compression, cooling, and heating facilities).
243.2 K Pure
Methanol
243.2 K
Methanol+IL
(50-50 wt%)
243.2 K Pure
IL
265.7 K Pure
IL
288.2 K Pure
IL
0
500
1000
1500
2000
2500
Ind
irec
t C
O2 e
mis
sio
n (
km
ol.
h-1
) Compression
Heating
Cooling
PIECO2
Page 42 of 49
AIChE Journal
AIChE Journal
This article is protected by copyright. All rights reserved.
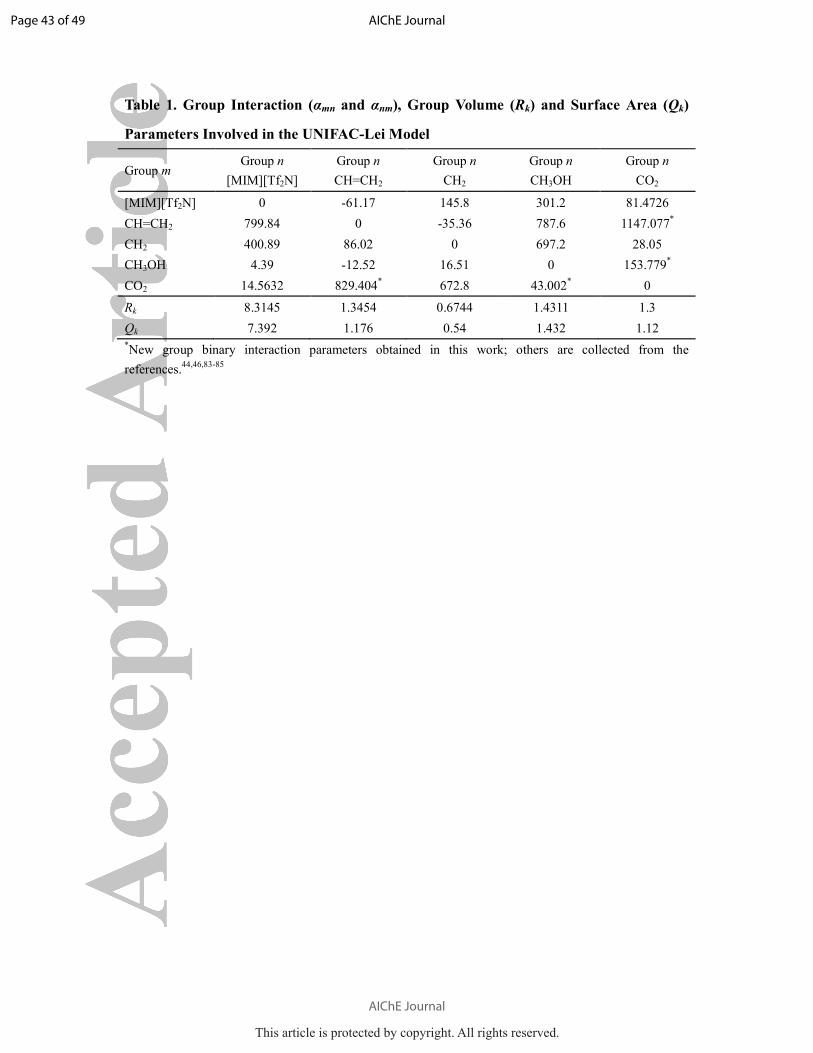
Table 1. Group Interaction (αmn and αnm), Group Volume (Rk) and Surface Area (Qk)
Parameters Involved in the UNIFAC-Lei Model
Group m Group n
[MIM][Tf2N]
Group n
CH=CH2
Group n
CH2
Group n
CH3OH
Group n
CO2
[MIM][Tf2N] 0 -61.17 145.8 301.2 81.4726
CH=CH2 799.84 0 -35.36 787.6 1147.077*
CH2 400.89 86.02 0 697.2 28.05
CH3OH 4.39 -12.52 16.51 0 153.779*
CO2 14.5632 829.404* 672.8 43.002
* 0
Rk 8.3145 1.3454 0.6744 1.4311 1.3
Qk 7.392 1.176 0.54 1.432 1.12
*New group binary interaction parameters obtained in this work; others are collected from the
references.44,46,83-85
Page 43 of 49
AIChE Journal
AIChE Journal
This article is protected by copyright. All rights reserved.
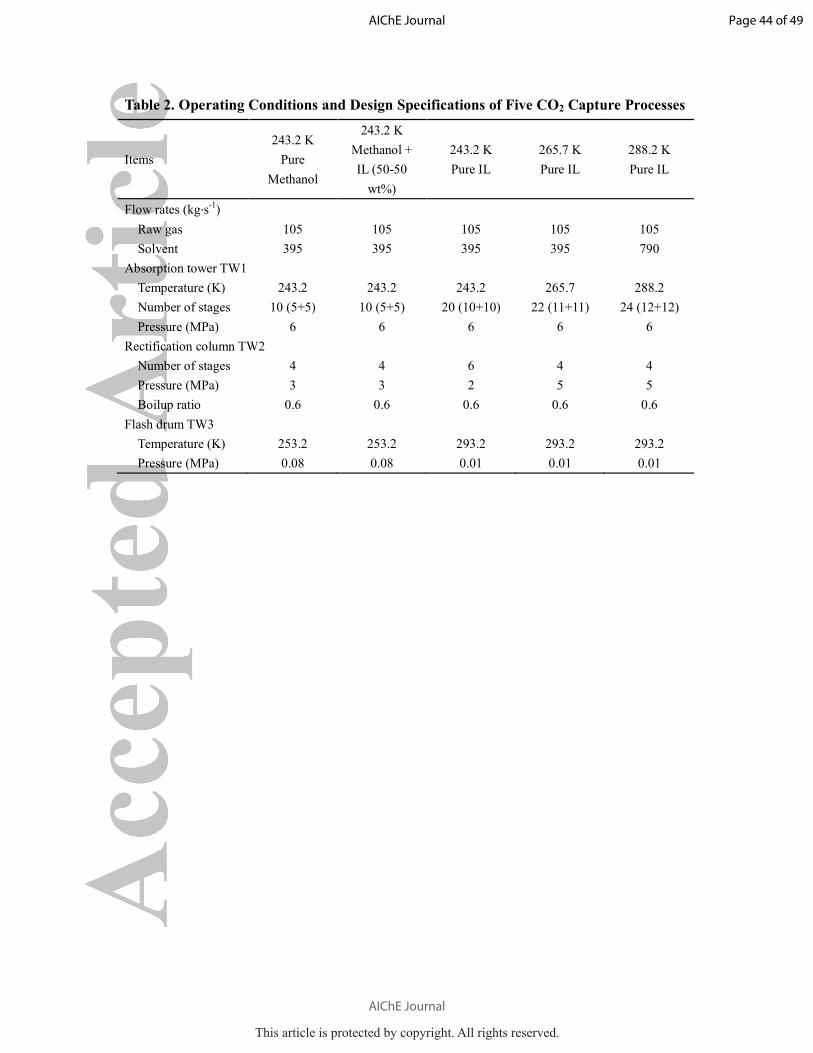
Table 2. Operating Conditions and Design Specifications of Five CO2 Capture Processes
Items
243.2 K
Pure
Methanol
243.2 K
Methanol +
IL (50-50
wt%)
243.2 K
Pure IL
265.7 K
Pure IL
288.2 K
Pure IL
Flow rates (kg·s-1
)
Raw gas 105 105 105 105 105
Solvent 395 395 395 395 790
Absorption tower TW1
Temperature (K) 243.2 243.2 243.2 265.7 288.2
Number of stages 10 (5+5) 10 (5+5) 20 (10+10) 22 (11+11) 24 (12+12)
Pressure (MPa) 6 6 6 6 6
Rectification column TW2
Number of stages 4 4 6 4 4
Pressure (MPa) 3 3 2 5 5
Boilup ratio 0.6 0.6 0.6 0.6 0.6
Flash drum TW3
Temperature (K) 253.2 253.2 293.2 293.2 293.2
Pressure (MPa) 0.08 0.08 0.01 0.01 0.01
Page 44 of 49
AIChE Journal
AIChE Journal
This article is protected by copyright. All rights reserved.
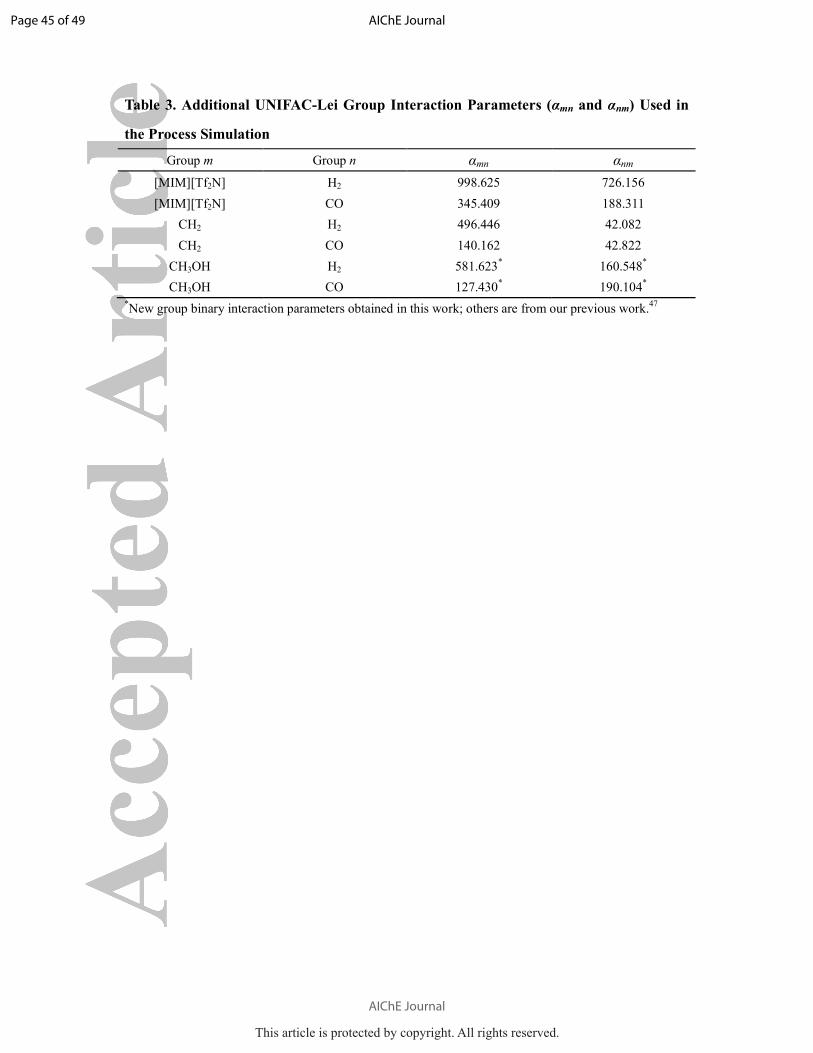
Table 3. Additional UNIFAC-Lei Group Interaction Parameters (αmn and αnm) Used in
the Process Simulation
Group m Group n αmn αnm
[MIM][Tf2N] H2 998.625 726.156
[MIM][Tf2N] CO 345.409 188.311
CH2 H2 496.446 42.082
CH2 CO 140.162 42.822
CH3OH H2 581.623* 160.548
*
CH3OH CO 127.430* 190.104
*
*New group binary interaction parameters obtained in this work; others are from our previous work.
47
Page 45 of 49
AIChE Journal
AIChE Journal
This article is protected by copyright. All rights reserved.
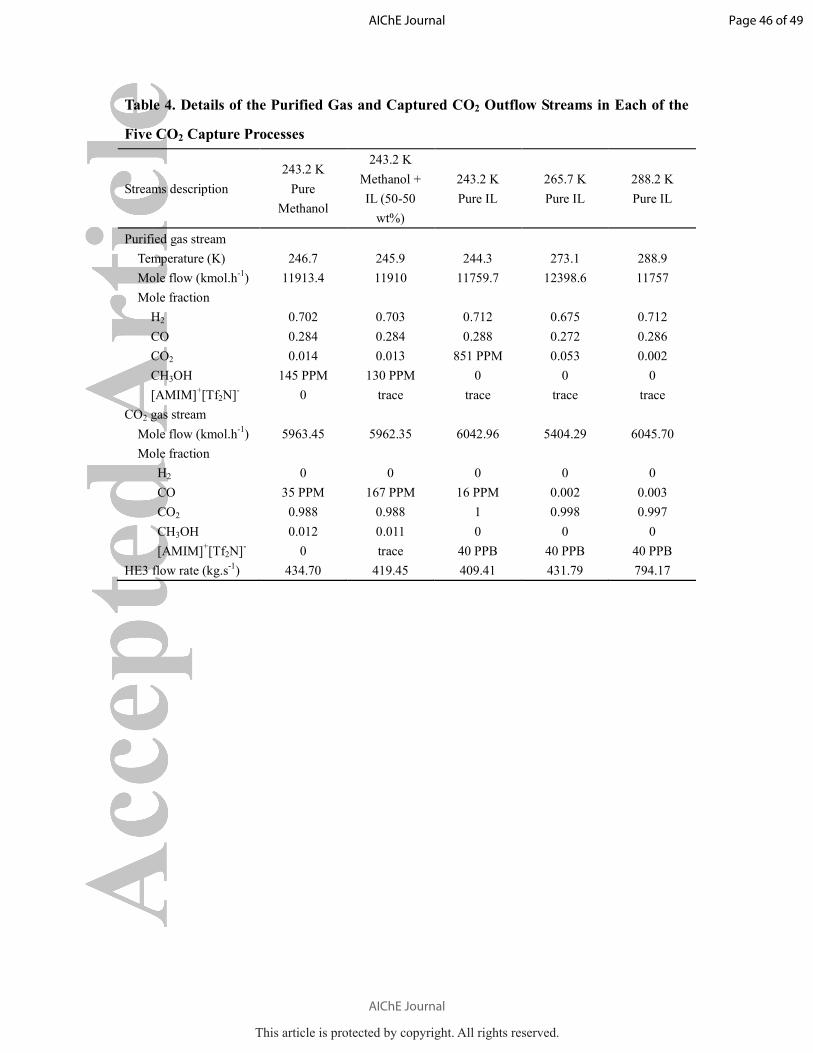
Table 4. Details of the Purified Gas and Captured CO2 Outflow Streams in Each of the
Five CO2 Capture Processes
Streams description
243.2 K
Pure
Methanol
243.2 K
Methanol +
IL (50-50
wt%)
243.2 K
Pure IL
265.7 K
Pure IL
288.2 K
Pure IL
Purified gas stream
Temperature (K) 246.7 245.9 244.3 273.1 288.9
Mole flow (kmol.h-1
) 11913.4 11910 11759.7 12398.6 11757
Mole fraction
H2 0.702 0.703 0.712 0.675 0.712
CO 0.284 0.284 0.288 0.272 0.286
CO2 0.014 0.013 851 PPM 0.053 0.002
CH3OH 145 PPM 130 PPM 0 0 0
[AMIM]+[Tf2N]
- 0 trace trace trace trace
CO2 gas stream
Mole flow (kmol.h-1
) 5963.45 5962.35 6042.96 5404.29 6045.70
Mole fraction
H2 0 0 0 0 0
CO 35 PPM 167 PPM 16 PPM 0.002 0.003
CO2 0.988 0.988 1 0.998 0.997
CH3OH 0.012 0.011 0 0 0
[AMIM]+[Tf2N]
- 0 trace 40 PPB 40 PPB 40 PPB
HE3 flow rate (kg.s-1
) 434.70 419.45 409.41 431.79 794.17
Page 46 of 49
AIChE Journal
AIChE Journal
This article is protected by copyright. All rights reserved.
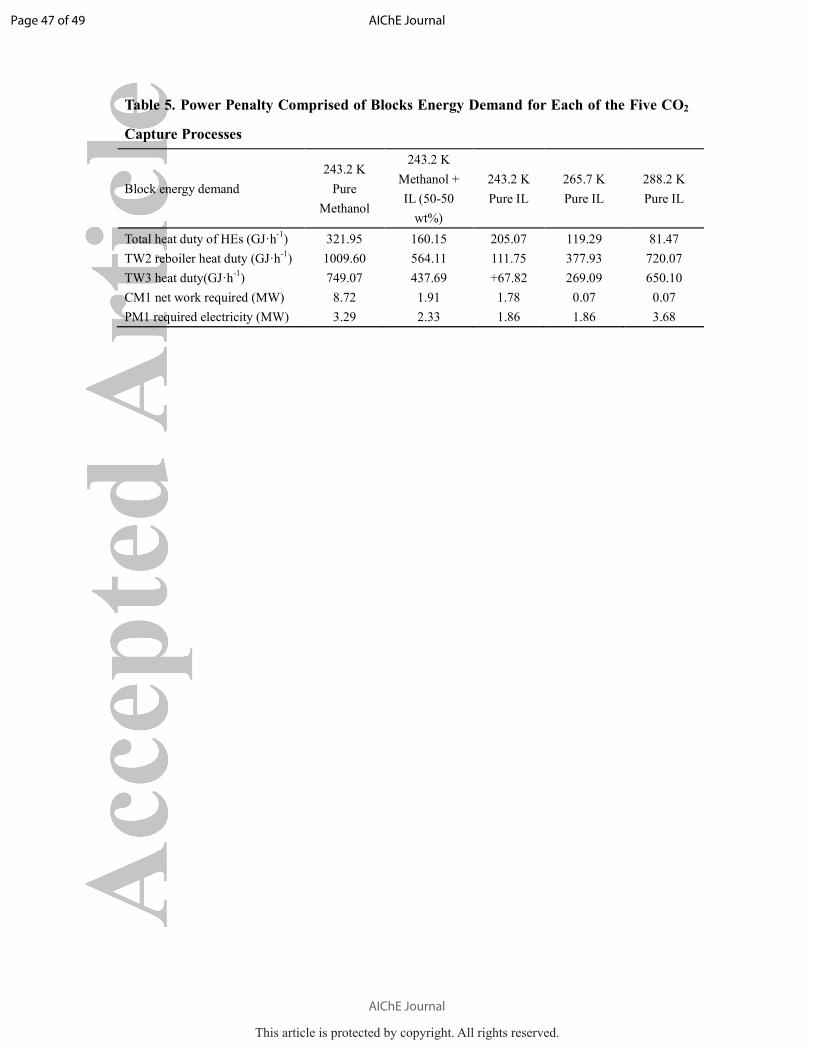
Table 5. Power Penalty Comprised of Blocks Energy Demand for Each of the Five CO2
Capture Processes
Block energy demand
243.2 K
Pure
Methanol
243.2 K
Methanol +
IL (50-50
wt%)
243.2 K
Pure IL
265.7 K
Pure IL
288.2 K
Pure IL
Total heat duty of HEs (GJ·h-1
) 321.95 160.15 205.07 119.29 81.47
TW2 reboiler heat duty (GJ·h-1
) 1009.60 564.11 111.75 377.93 720.07
TW3 heat duty(GJ·h-1
) 749.07 437.69 +67.82 269.09 650.10
CM1 net work required (MW) 8.72 1.91 1.78 0.07 0.07
PM1 required electricity (MW) 3.29 2.33 1.86 1.86 3.68
Page 47 of 49
AIChE Journal
AIChE Journal
This article is protected by copyright. All rights reserved.
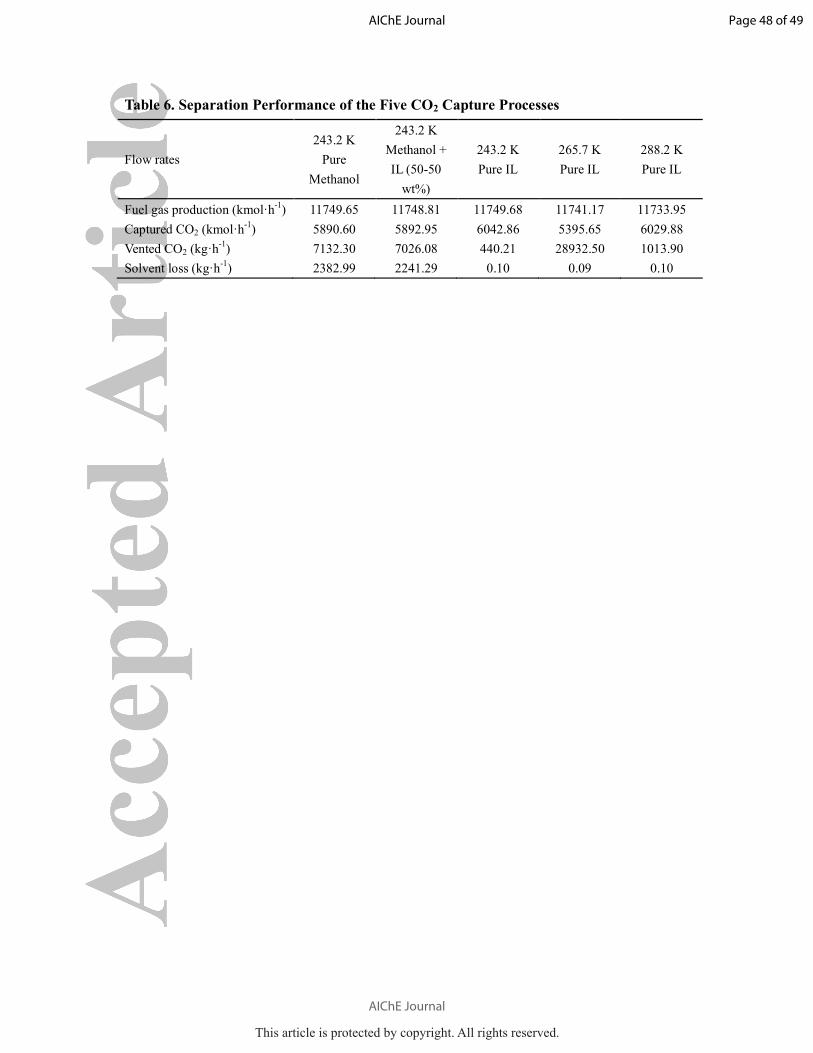
Table 6. Separation Performance of the Five CO2 Capture Processes
Flow rates
243.2 K
Pure
Methanol
243.2 K
Methanol +
IL (50-50
wt%)
243.2 K
Pure IL
265.7 K
Pure IL
288.2 K
Pure IL
Fuel gas production (kmol·h-1
) 11749.65 11748.81 11749.68 11741.17 11733.95
Captured CO2 (kmol·h-1
) 5890.60 5892.95 6042.86 5395.65 6029.88
Vented CO2 (kg·h-1
) 7132.30 7026.08 440.21 28932.50 1013.90
Solvent loss (kg·h-1
) 2382.99 2241.29 0.10 0.09 0.10
Page 48 of 49
AIChE Journal
AIChE Journal
This article is protected by copyright. All rights reserved.
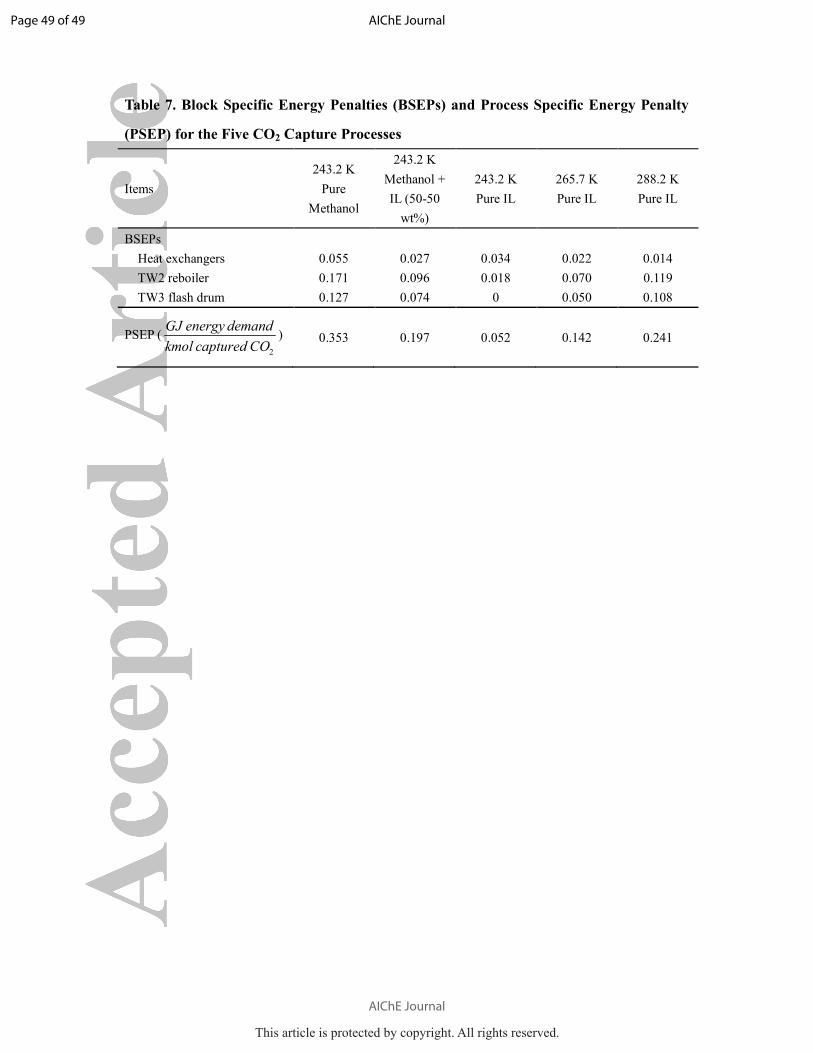
Table 7. Block Specific Energy Penalties (BSEPs) and Process Specific Energy Penalty
(PSEP) for the Five CO2 Capture Processes
Items
243.2 K
Pure
Methanol
243.2 K
Methanol +
IL (50-50
wt%)
243.2 K
Pure IL
265.7 K
Pure IL
288.2 K
Pure IL
BSEPs
Heat exchangers 0.055 0.027 0.034 0.022 0.014
TW2 reboiler 0.171 0.096 0.018 0.070 0.119
TW3 flash drum 0.127 0.074 0 0.050 0.108
PSEP (
2
GJ energy demand
kmol captured CO) 0.353 0.197 0.052 0.142 0.241
Page 49 of 49
AIChE Journal
AIChE Journal
This article is protected by copyright. All rights reserved.

本文献由“学霸图书馆-文献云下载”收集自网络,仅供学习交流使用。
学霸图书馆(www.xuebalib.com)是一个“整合众多图书馆数据库资源,
提供一站式文献检索和下载服务”的24 小时在线不限IP
图书馆。
图书馆致力于便利、促进学习与科研,提供最强文献下载服务。
图书馆导航:
图书馆首页 文献云下载 图书馆入口 外文数据库大全 疑难文献辅助工具

![Luminescence Properties of [Ln2(L2)(MeOH)2] (Ln = La, Eu ... · 1. Analytical data for [La2(L2)(MeOH)2] (1) Fig S1. FT-IR spectrum of 1. Fig. S2. ESI mass spectrum of 1 (MeOH/CH2Cl2](https://img.pdfslide.net/doc/110x75/5f8cc0e37fc8f37349315cca/luminescence-properties-of-ln2l2meoh2-ln-la-eu-1-analytical-data.jpg)


![Atropselektive Synthese von Isoplagiochin C und ... · MeCN Acetonitril MeOH Methanol MOPBIN 2-Methoxy-4,4,5,5-tetramethyl-[1,3,2]dioxaborolan NaOAc Natriumacetat n-BuLi n-Butyllithium](https://img.pdfslide.net/doc/110x75/5e03a6bc471a905ddc50e042/atropselektive-synthese-von-isoplagiochin-c-und-mecn-acetonitril-meoh-methanol.jpg)