Embed Size (px)
Citation preview

Procedia Environmental Sciences 17 (2013) 648 – 657
1878-0296 © 2013 The Authors. Published by Elsevier B.V.Selection and peer-review under responsibility of SUSTAIN conference’s committee and supported by Kyoto University; (OPIR), (GCOE-ES), (GCOE-HSE), (CSEAS), (RISH), (GCOE-ARS) and (GSS) as co-hosts.doi:10.1016/j.proenv.2013.02.081
Available online at www.sciencedirect.com
Available online at www.sciencedirect.com
Procedia Environmental Sciences 00 (2012) 649-658
The 3rd International Conference on Sustainable Future for Human Security SUSTAIN 2012
CO2 capture technical analysis for gas turbine flue gases with complementary cycle assistance including non linear
mathematical modeling Meisam Moghadasia, Hossein Ghadamianb,*, Hooman Farzaneha,
Mohammad Moghadasic,d and Hassan Ali Ozgolia aDepartment of Energy, Science and Research Branch, Islamic Azad University, 1477893855, Tehran, IRAN
bDepartment of Energy, Materials and Energy Research Center (MERC), 14155-4777, Tehran,IRAN cDivision of Systems Engineering, Boston University, Boston, Massachusetts, 02215, United States of America
dCenter for Information and Systems Engineering, Boston University, Boston, Massachusetts, 02246, United States of America
Abstract
In this study, a Gas Turbine (GT) fed by the fossil fuel of type PG6561B (installed at South-Pars Gas Field) is simulated and implemented as an integrated model in Cycle-Tempo and GasTurb-11. Next, the energy driving forces, which cause of the temperature difference between the GT flue gases and the input stream to CO2 capture cycle, are applied in the Heat Recovery Steam Generator (HRSG). This process is also designed and modeled in Cycle-Tempo. Then, the local power plant data acquisition is done based on the data loggers, which are applied as the initial values for the modeling evaluation purposes. Finally, based on the CO2 abatement and emission control, the post-combustion CO2 capture cycle is simulated in MATLAB using the method of lines discretization in the spatial direction along the length of the columns. © 2012 The Authors. Published by Elsevier B.V. Selection and/or peer-review under responsibility of SUSTAIN conferences committee and supported by Kyoto University; (OPIR), (GCOE-ES), (GCOE-HSE), (CSEAS), (RISH), (GCOE-ARS) and (GSS) as co-hosts. Keywords: CO2 Capture; Integrated Comprehensive Cycle; Gas Turbine; HRSG; Dynamic Simulation.
* Corresponding author. Tel.: +98-912-2541353; fax: +98-21-88773352. E-mail address: [email protected]
Available online at www.sciencedirect.com
© 2013 The Authors. Published by Elsevier B.V.Selection and peer-review under responsibility of SUSTAIN conference’s committee and supported by Kyoto University; (OPIR), (GCOE-ES), (GCOE-HSE), (CSEAS), (RISH), (GCOE-ARS) and (GSS) as co-hosts.
Open access under CC BY-NC-ND license.
Open access under CC BY-NC-ND license.

649Meisam Moghadasi et al. / Procedia Environmental Sciences 17 (2013) 648 – 657650 M.Moghadasi et al. / Procedia Environmental Sciences 00 (2012) 649-658
Nomenclature
LHV Lower Heating Value, (Kj/kg) liC Concentration of component in liquid phase, (mol/m3)
T Time, (s)
U Velocity of fluid, (m/s)
H Height, (m)
din , Component diffusion mole flow, (mol/m3s)
geniR , Component mole generation value, (mol/m3s)
viC Concentration of component in vapor phase, (mol/m3)
lT Temperature of liquid inside control volume, (k) vliH~ Difference between the enthalpy of vapor and liquid for each species, (J/mol)
lipC~ Specific molar heat capacity of species in liquid phase, (J/mol K)
REH Enthalpy of reaction, (J/mol)
lvU Overall Convective heat transfer coefficient, (J/m2 K S)
vT Temperature of liquid inside control volume, (k) vipC~ Concentration of component in vapor phase, (mol/m3)
Acronyms
HRSG Heat Recovery Steam Generation
GT Gas Turbine
MEA Monoethanolamine

650 Meisam Moghadasi et al. / Procedia Environmental Sciences 17 (2013) 648 – 657 M.Moghadasi et al. / Procedia Environmental Sciences 00 (2012) 649-658 651
1. Introduction
The increasing rate of carbon dioxide is approximately estimated at 1.5ppmv per year, which corresponds to a temperature increase in the range of 4 to 8 degrees in the coming century. As it was reported in 2000, 23.5 giga-tonnes of CO2 were released from man-made resources with a 60% share discharged from the point sources such as fossil fuel power stations, industrial processes, and oil and gas extraction plants [1].
Several investigations in CO2 capture have been done in power-plants industry since then. These investigations mainly focus on coal-fired cycles, and CO2 capture systems are considered individually. In this paper, we consider different stages of the process, which include power and HRSG cycles and CO2 capture system. In particular, we apply the studied case of the GT 42 MW type PG6561B for modeling and CO2 capture purpose.
Generally, water and CO2 are the main products of fossil fuels combustions. The emission of carbon dioxide has specific effects on increasing the amounts of greenhouse gases, and consequently causes the climate changes and global warning, which is considered as a worldwide challenge [2]. In this respect, some international rules have been legislated in order to reduce CO2 emissions to the atmosphere. As a result, the CO2 capture systems have got so much attention recently and have been improved to meet some controlling criterions [3].
CO2 capture consists of three different types in technology reviews, namely, Post-combustion, Pre-combustion and Oxy-fuel. Among these methods, we mainly apply the post-combustion chemical absorption with RNH2 or MEA (Monoethanolamine) solution, which is the most common and precisely developed technology to capture CO2 from combustion-based power plants [4], and is quantified to 97.70% in consistency of CO2 removal in the flue gas inlet. The rate of this value is equal to 7.3640Kg/s, which is appropriate at 7.59176 Kg/s inlet. By these means, the global model target is achieved.
2. System Approach
The approach of this study can be categorized as the following: The quantification of the amount of carbon dioxide coming out of the natural gas combustion in GT in
various atmospheric conditions i.e. summer and winter cases with different humidity and temperature profiles.
Applying the hot flue gases as an energy driving force due to combustion, in HRSG for the heat recovery purposes.
The dynamic simulation of CO2 capture cycle, time intervals process analysis based on molecular dynamics and reactions to achieve CO2 removal percentage target (Above 95%).
3. System Configuration
As it is illustrated in figure 1, this system is comprised of different sections. In this work, 42MW GT is applied to enter compressed air, which burns at a combustion chamber with natural gas. The out-coming hot flue gases run the turbine, which is coupled with the generator that produces power [5]. After this stage, recoverable energy which belongs to the flue gases is applied in HRSG cycle and as a consequence, the 530°C super-heated steam is also produced. Before the flue gases enter the absorption column, it is necessary to cool down and compress the gases to meet the absorber operational conditions. The absorption tower, which is a large cylindrical tower, is filled with the packing and operates within a temperature range of 40-45ºC. The inlet gas is entered at the bottom of the tower and flows up through

651 Meisam Moghadasi et al. / Procedia Environmental Sciences 17 ( 2013 ) 648 – 657
the tower while the lean liquid mixture (30% MEA and 70% water) is rinsed at the top and showers down over the packing [6]. The rich amine is pumped up from the bottom of the absorption tower to the heat-exchanger and top of the stripping tower. The purpose of the stripper is heating up the mixture to 110-120°C temperature level to pursue reverse chemical reactions and to decrease the solubility of CO2 in the solution [7].
Fig. 1. Schematic of comprehensive cycle includes GT, HRSG and Amine based CO2 capture system
4. System Modeling
4.1. GT and HRSG Modeling4.1. GT and HRSG Modeling4.1. GT and H
GT and HRSG models have been built in Cycle-Tempo Software [8]. The main purpose of using this software was to create a model in the steady state. Based on the site reports, the main input assumptions of the model can be characterized as following the tables 1 and 2.
HRSG
Gas Turbine
Inlet Air
Compressor
Generator
Inlet Fuel
Turbine
Combustion Chamber
Filter
Electricity
Economizer
Evaporator
Super heater
SteamDrum
Feed Water
Flue Gases
CO2 Capture
N2, O2, H2O
Absorber
Rich Pump CO2, N2, O2, H2O
Lean Pump
Stripper
Re-boiler
Condenser
Cleaned CO2 to compression
Hea
t exc
hang
er
Cooler

652 Meisam Moghadasi et al. / Procedia Environmental Sciences 17 (2013) 648 – 657 M.Moghadasi et al. / Procedia Environmental Sciences 00 (2012) 649-658 653
Table 1. GT modeling input data
No Input Unit Value 1 Inlet Air 1-1 Temperature oc 5 37 43 48 1-2 Relative humidity % 100 65 65 65 1-3 Pressure Bar 0.0997 1-4 Mass flow Kg/s 145.253 1-5 Pressure drop in air filter Bar 0.01 2 Compressor 2-1 Output pressure Bar 11.6474 2-2 Isentropic efficiency 0.8533
3 Inlet Fuel and Combustion Chamber
3-1 Inlet fuel temperature oc 15 3-2 Inlet fuel pressure Bar 25.2
3-3 LHV Kj/Kg 45661
3-4 Output pressure Bar 11.056
4 Turbine
4-1 Isentropic efficiency 0.8
Table 2. HRSG modeling input data
No Input Unit Value 1 Super-heater 1-1 Output steam temperature oc 530 1-2 Flue gases pressure drop Bar 1 1-3 Steam pressure drop Bar 0.01 2 Evaporator 2-1 Flue gases pressure drop Bar 1.5 2-2 Steam pressure drop Bar 0.1 2-3 SteamT oc 10
3 Economizer 3-1 Flue gases pressure drop Bar 1 3-2 Water pressure drop Bar 0.1 3-3 WaterT oc 15
4 Feed water 4-1 Temperature oc 41 4-2 Pressure Bar 25 5 Pump 5-1 Isentropic efficiency 0.75 6 Drum
6-1 WaterSteam
4
ulation are
extracted from the mentioned site reports. In addition, for any further steps in the simulations, we need to define the exact properties of the natural gas.

653Meisam Moghadasi et al. / Procedia Environmental Sciences 17 (2013) 648 – 657654 M.Moghadasi et al. / Procedia Environmental Sciences 00 (2012) 649-658
4.2. Dynamic Simulation Proposed CO2 Capture System Modeling
The simulation of the system is implemented in MATLAB using the method of discreteness in the spatial direction along the length of the absorber and stripper columns. The system is characterized by the closed loop recirculation of the Monoethanolamine Solution (RNH2). Numerical solver ODE15s-(solution method) is applied to solve the model including time durations (Dynamic simulation approach). This integrated comprehensive cycle needs to be processed for one hour to pass the transient state and reach the steady state of the carbon dioxide capture dominated value.
4.2.1. Reactions
The following chemical reactions are taking place simultaneously in the CO2 abatement cycle [9]:
1. Overall reaction rate of MEA and Carbon dioxide 2MEA + CO2 + MEAH +
2. Hydrolyze of CO2 with Water CO2 + 2H2 3
+ H3O + 3. Bicarbonate Formation
CO2 + OH 3
4. Disassociation of Water 2H2 3O + + OH
5. Dissociation of MEA+ MEA+ + H2 3O +
6. MEA Carbonate H2O + MEACOO
3 + MEA
4.2.2. Equations
The chemical reactions of MEA and CO2 vapor-liquid equilibrium for CO2 [10, 11]. The concentrations of MEA, H2O, N2 and O2 in both phases are calculated according to Peng-Robinson equation of state [12], using the fugacity of individual species [13]. The main equations to determine the concentrations and temperatures of liquid and gas phases are listed below [14]:
genidi
li
li Rn
dzdcu
dtdc
,, (1)
di
vi
vi n
dzdcu
dtdc
, (2)
]~[][)(
]~[][]~[][]~[][ ,2
li
Tli
vllvT
li
Tli
RECOli
Tli
vli
Td
ll
pCCTTU
pCCHn
pCCHn
dzdTu
dtdT (3)
]~[][)(
]~[][]~[][ ,
vi
Tvi
vllvT
vi
Tvi
vli
Td
vv
pCCTTU
pCCHn
dzdTu
dtdT (4)
4.2.3. Assumptions
Table 3 lists the main input assumptions of the model.

654 Meisam Moghadasi et al. / Procedia Environmental Sciences 17 (2013) 648 – 657 M.Moghadasi et al. / Procedia Environmental Sciences 00 (2012) 649-658 655
Table 3. CO2 capture system Input data No Input Unit Value
1 Mole flow of CO2 into the capture system Mol/s 172.54 2 Absorber gas inlet temperature K 313 3 Volume flow of liquid M3/s 0.67875 4 Condenser reflux percentage % 10 5 Re-boiler pressure Pa 200000 6 Re-boiler temperature K 394.2 7 Absorber liquid temperature K 318 8 Condenser liquid temperature K 380 9 Lean pump pressure m 15 10 Rich pump pressure m 15
5. Results and Conclusions Gas Turbine and HRSG modeling results indicate the percentage of carbon dioxide variations in the
flue gases, which is between 3.18% and 3.32%. The amount of carbon dioxide has minor changes under different conditions of GT operations. These results, which have been also verified with GT modeling in Gas-Turb11 software, are shown in Table4:
Table 4. GT and HRSG modeling results
No Inlet air
temperature (oC)
CO2 percentage in flue gases
(%)
Power generation
(MW)
Net Efficiency
(%)
Turbine flue gases temperature
(oC)
Flue gases mass flow
(Kg/s) 1 5 3.32 42.74 31.69 555 148.20 2 37 3.21 34.91 29.75 578 129.23 3 43 3.18 33.38 29.10 583 125.33 4 48 3.32 32.11 27.01 587 122.19
According to table 3, as the inlet air temperature increases, the GT power generation as well as the flue gases mass flow will decrease, and the flue gases temperature increases. On the other hand, since the percentage of CO2 varies in the flue gases, sensitivity analysis under the various conditions of ambient temperature is not considered, and 5oC is applied as the inlet air temperature for dynamic simulation of the absorption cycle. In this case, the flue gases mole flow is 28.52 Kg/kmol that 3.32% of it includes CO2, which produces 179560 tonnes of CO2 annual.
Four scenarios with different absorbers and stripper heights and diameters are applied in CO2 capture system simulations. These results are shown in the table 5, as the following:
Table 5. CO2 capture system simulation results
No Absorber
height (m)
Absorber diameter
(m)
Stripper height
(m)
Stripper diameter
(m)
CO2 capture
percentage (%)
1 10 2.75 5 1.5 35.32 2 15 2.75 10 1.5 53.48 3 15 10.00 8 3.0 97.70 4 15 10.00 10 5.0 97.70
Based on the aforementioned results, even though CO2 capture percentage in the first and second runs do not agree, even with the excepted range, it is improved to 97.70% in the third run. Consequently, the values of 15m and 10m are respectively accepted for the height and the diameter of the absorber. Similarly, to obtain the desirable CO2 recovery, a stripper with 10m height and 5m diameter is considered. The process of achieving these values using MATLAB is shown through figures 2-8.
655Meisam Moghadasi et al. / Procedia Environmental Sciences 17 (2013) 648 – 657656 M.Moghadasi et al. / Procedia Environmental Sciences 00 (2012) 649-658
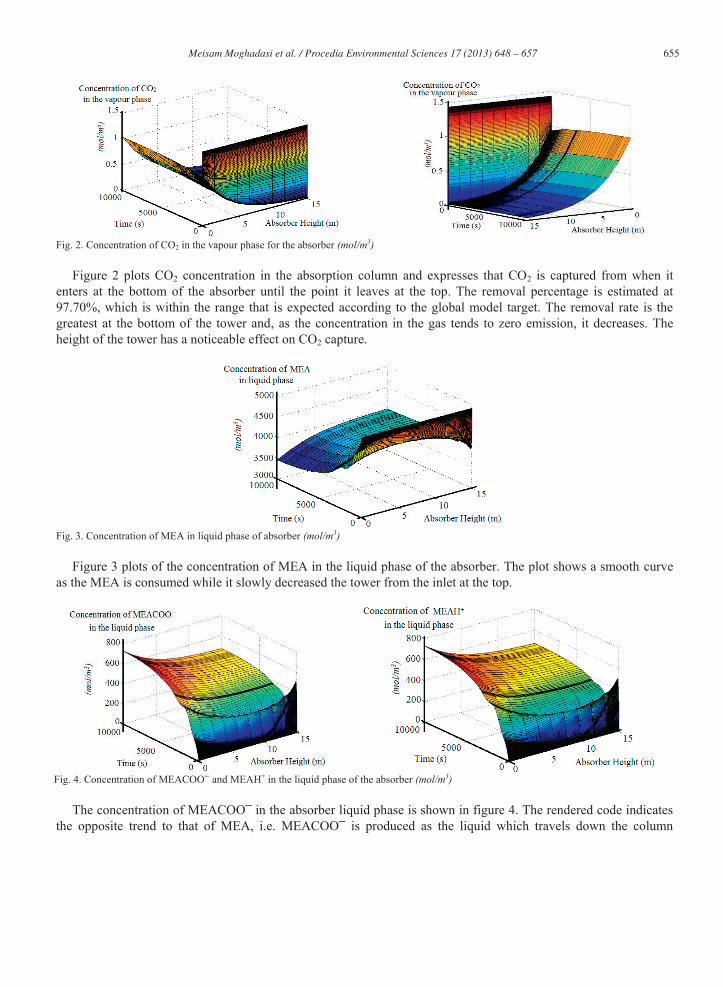
Fig. 2. Concentration of CO2 in the vapour phase for the absorber (mol/m3)
Figure 2 plots CO2 concentration in the absorption column and expresses that CO2 is captured from when it enters at the bottom of the absorber until the point it leaves at the top. The removal percentage is estimated at 97.70%, which is within the range that is expected according to the global model target. The removal rate is the greatest at the bottom of the tower and, as the concentration in the gas tends to zero emission, it decreases. The height of the tower has a noticeable effect on CO2 capture.
Fig. 3. Concentration of MEA in liquid phase of absorber (mol/m3)
Figure 3 plots of the concentration of MEA in the liquid phase of the absorber. The plot shows a smooth curve as the MEA is consumed while it slowly decreased the tower from the inlet at the top.
Fig. 4. Concentration of MEACOO and MEAH+ in the liquid phase of the absorber (mol/m3)
The concentration of MEACOO in the absorber liquid phase is shown in figure 4. The rendered code indicates the opposite trend to that of MEA, i.e. MEACOO is produced as the liquid which travels down the column

656 Meisam Moghadasi et al. / Procedia Environmental Sciences 17 (2013) 648 – 657 M.Moghadasi et al. / Procedia Environmental Sciences 00 (2012) 649-658 657
absorbing CO2. MEAH+ concentration plot has the same shape and values as MEACOO , and the level of increase is about 0.5 times greater than the consumption rate of the MEA because in the operating range of the tower, two moles of MEA is required to remove one mole of CO2
Fig. 5. Temperature of the vapour phase in the absorber (k) Fig. 6. Temperature of the liquid in the absorber (k)
Figure 5 shows the vapor phase temperature profile that follows almost the same manners as the liquid temperature profile. At the bottom of the tower, the gas phase receives heat from the liquid phase and then at the top of the tower, the gas phase transfers heat to the liquid phase.
Figure 6 is the plot of the liquid temperature profile. It can be characterized as an increase to its maximum value in about 1/3 of the way down the tower and then a decrease. The increase is a consequence of the heat supplied from the exothermic reaction between MEA and CO2.
Fig. 7. Concentration of CO2 in the vapour phase of the stripper (mol/m3)
The CO2 concentration in the cleaned gas at the stripper is shown in figure 7. The concentration increases quickly as the reaction spruced rapidly at the bottom of the tower where the steam enters the tower to supply the energy.
Fig. 8. Concentration of MEACOO and MEAH+ in the liquid phase of the stripper (mol/m3)

657Meisam Moghadasi et al. / Procedia Environmental Sciences 17 (2013) 648 – 657658 M.Moghadasi et al. / Procedia Environmental Sciences 00 (2012) 649-658
The reversibility of the chemical reactions is indicated in figure 8. As shown above, MEAH+ concentration is decreasing as the liquid enters the stripper. The concentration of the MEACOO ion has the same profile.
In short, the major conclusions headlines can be listed as below: The modeling of the CO2 capture system is a complex problem with many interactions. In this
model, many assumptions and simplifications have been made while the results are still reasonable and in acceptable range.
2 as a function of temperature, solubility of CO2 in water, solubility of CO2 in MEA and ionic strength is adequate to describe the vapor-liquid equilibrium for Carbon dioxide.
The residence time of the liquids in the absorption tower has a great effect on the result. Thus increasing the absorption tower diameter and height produces a higher removal rate.
There are many parameters and inputs that can affect the results, so finding an optimal solution is a challenging task, especially if we include the balance between capital and operational costs.
Significant amounts of H2O and MEA leave the system with the exhaust gas and the purified steam. Therefore, water wash and make up water and MEA should be applied.
6. Recommendations for future work
In future work, the optimization of MEA-based capture process integrated with power plants will be examined. The MEA-based capture process needs to be optimized for the operation, as well.
7. References
[1] IPCC. (2007) Climate change Syntheses report, Intergovernmental Panel on Climate Change. Available from http://www.ipcc.ch [2] Green facts. (2005) scientific facts on CO2 Capture and storage. Greenfacts.org. [Online]. Available from
http://www.greenfacts.org/en/co2-capture-storage [3] Wallace, D. (2000) Capture and Storage of CO2 what needs to be done? November 2000. Available from
http://www.iea.org/textbase/papers/2000/capstor.pdf [4] Vaidya P.D. and Kenig E.Y. (2007) CO2-Alkanolamine Reaction Kinetics: A Review of Recent Studies. Chemical Engineering
Technology, volume 30, No. 11, pp1467 1474. [5] Walsh P.P. and Fletcher P. (2004) Gas Turbine Performance, 2nd Edition, Blackwell Publishing. [6] Billet, R and Schulte TransIChemE,
volume 77. [7] Hansen D.K. (2004) Dynamic modeling of an absorption tower for the removal of carbon dioxide from exhaust gas by
means of Monoethanolamine. Telemark University College, Faculty of Technology. Thesis carried out at NTNU. [8] Delft University of technology. (2011) A program for thermodynamic modeling and optimization of energy conversion systems.
Available from http://www.cycle-tempo.nl [9] Aboudheir A., Tontiwachwuthikula P., Chakma A. and Idem R. (2003) Kinetics of the reactive absorption of carbon dioxide in
high CO2-loaded, concentrated aqueous Monoethanolamine solutions. Chemical Engineering Science, volume 58, pp5195 5210.
[10] Park S.B. and Lee H. (1997) Vapour-Liquid equilibrium for the binary Monoethanolamine + water and Monoethanolamine + ethanol systems. Korean Journal of chemical engineering.
[11] Lee J.L., Otto F.D and Mather A.E. (1976) Equilibrium between carbon dioxide and aqueous Monoethanolamine solution. Journal of applied chemistry Biotechnology.
[12] Peng, D.Y. and Robinson D.B. (1976) A New two constant equation of state. Industrial Engineering Chemical Fundamentals. [13] Smith R. (2005) Chemical Process Design and Integration. First edition, John Wiley & sons, Chichester, England. [14] Timothy Greer. (2008) Modeling and Simulation of Post Combustion CO2 Capturing. Telemark University College, Faculty of
Technology. Master thesis carried out at NTNU.