Embed Size (px)
Citation preview
Greenpeace Southeast Asia - Indonesia | 1
Coal Mines Polluting South Kalimantan’s Water
December 2014
GREENPEACE SOUTHEAST ASIA - INDONESIA
Coal Mines PollutingSouth Kalimantan’s Water

Coal Mines Polluting South Kalimantan’s Water
2 | Greenpeace Southeast Asia – Indonesia
TABLE OF CONTENTSTables/Figures, Abbreviations 3Greenpeace Investigation: Map of South Kalimantan sampling sites 41. Executive Summary 62. Methodology 73. Background 8 History: The Coal Boom in Indonesia 8 South Kalimantan: A Major Player in Indonesia’s Coal Industry 104. Understanding the Environmental Context: Geo-Spatial Analysis 12 Purpose and Scope 12 Map Source 12 DefinitionofMineConcessionStagesforLicensing 13 Geo-Spatial Analysis Results 15 a) CoalMiningConcessions 15 b) Forest Cover Within Coal Concessions 17 c) RiverCatchmentArea/WaterwaysDownstreamofCoalConcessions 195. Environmental Impacts of Coal Mining in Indonesia 20 OpenCastCoalMining 20 CoalMiningandDeforestation 20 AcidMineDrainage 23 HealthImpactsfromCoalMiningWastewatersonHumans,OtherAnimals, Fish,andPlants 25 LandErosiionLeadingtoWaterQualityDegradationandFloodingRisks 28 Post-MiningReclamationandLongTermRecovery 286. Greenpeace Investigation 32 PurposeandScope 32 SamplingResults 32 WhatDoestheSamplingMean?BreakingItDown 35 PoorandNon-ExistentSignageMayIndicateInadequateMonitoring 35 ThreeIn-DepthCaseStudies:TheFullerPictureofWhatWeFound 37 a)TopToxicTrouble–Arutmin 37 b)Banpu–EnvironmentalThreat 39 c)TanjungAlamJaya–ContaminatingaNearbyFarm 407. Government Agencies Acknowledge Degradation of Water Quality 42 a) GovernmentAcknowledgmentinSouthKalimantan 42 b)GovernmentAcknowledgmentinOtherRegionsofIndonesia 448. Conclusion and Demands 46End Notes 50Appendix 1. Analytical report Greenpeace Research Laboratories no. 04-2014 54
Greenpeace Southeast Asia - Indonesia | 3
Coal Mines Polluting South Kalimantan’s Water
ABBREVIATIONS
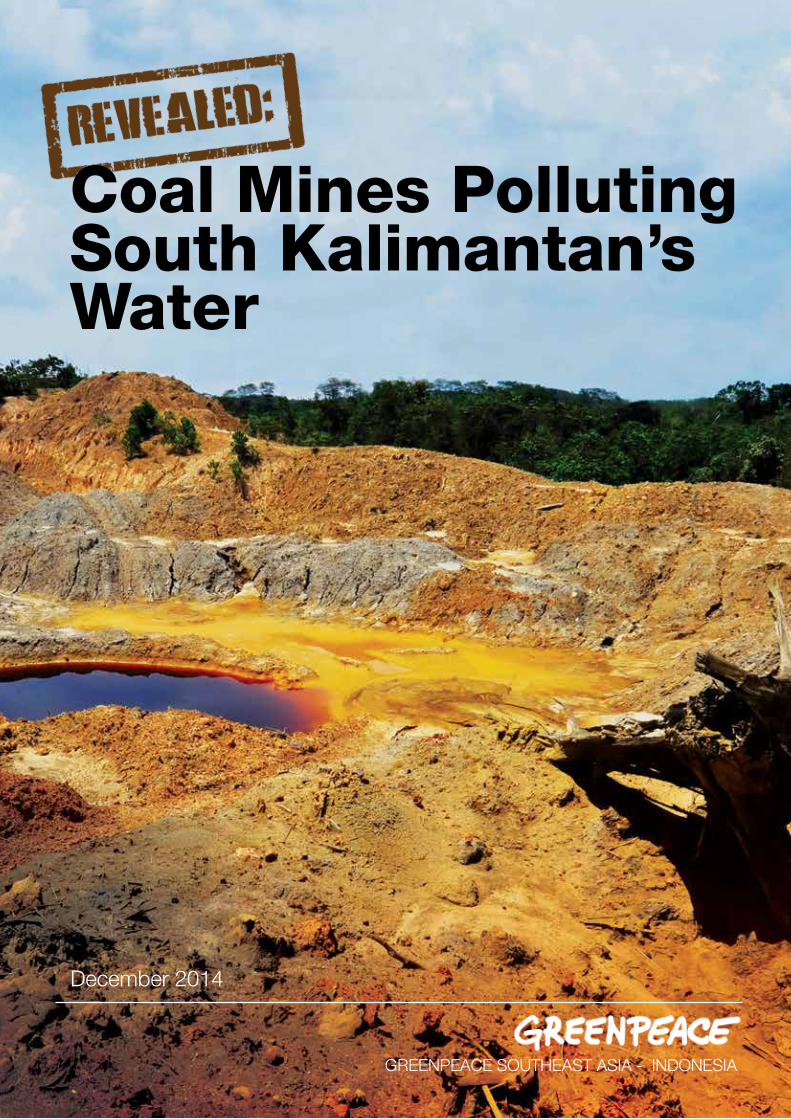
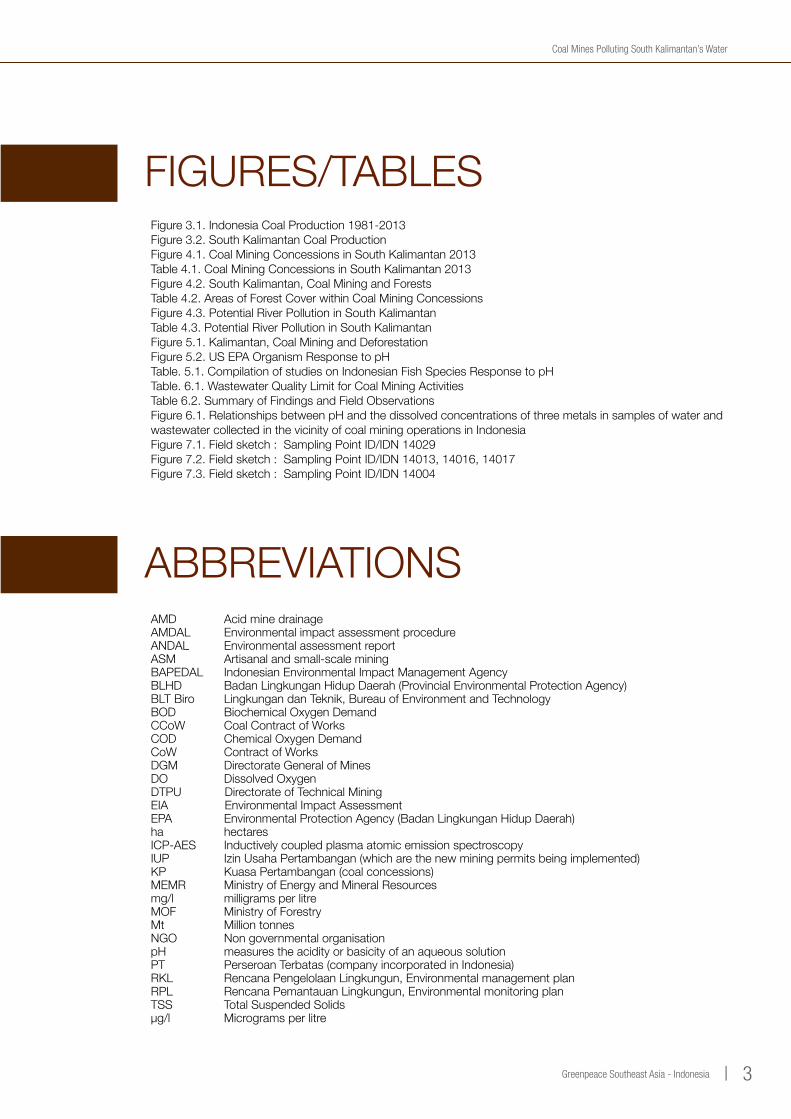
FIGURES/TABLES
AMD AcidminedrainageAMDAL Environmental impact assessment procedureANDAL Environmental assessment reportASM Artisanalandsmall-scaleminingBAPEDAL IndonesianEnvironmentalImpactManagementAgencyBLHD BadanLingkunganHidupDaerah(ProvincialEnvironmentalProtectionAgency)BLTBiro LingkungandanTeknik,BureauofEnvironmentandTechnologyBOD BiochemicalOxygenDemandCCoW CoalContractofWorksCOD ChemicalOxygenDemandCoW ContractofWorksDGM DirectorateGeneralofMinesDO DissolvedOxygenDTPUDirectorateofTechnicalMiningEIA Environmental Impact AssessmentEPA EnvironmentalProtectionAgency(BadanLingkunganHidupDaerah)ha hectaresICP-AES Inductively coupled plasma atomic emission spectroscopyIUP IzinUsahaPertambangan(whicharethenewminingpermitsbeingimplemented)KP KuasaPertambangan(coalconcessions)MEMR MinistryofEnergyandMineralResourcesmg/l milligramsperlitreMOFMinistryofForestryMt Million tonnesNGONongovernmentalorganisationpHmeasurestheacidityorbasicityofanaqueoussolutionPT PerseroanTerbatas(companyincorporatedinIndonesia)RKL RencanaPengelolaanLingkungun,EnvironmentalmanagementplanRPL RencanaPemantauanLingkungun,EnvironmentalmonitoringplanTSS Total Suspended Solids μg/l Microgramsperlitre
Figure3.1.IndonesiaCoalProduction1981-2013Figure3.2.SouthKalimantanCoalProductionFigure4.1.CoalMiningConcessionsinSouthKalimantan2013Table4.1.CoalMiningConcessionsinSouthKalimantan2013Figure4.2.SouthKalimantan,CoalMiningandForestsTable4.2.AreasofForestCoverwithinCoalMiningConcessionsFigure4.3.PotentialRiverPollutioninSouthKalimantanTable4.3.PotentialRiverPollutioninSouthKalimantanFigure5.1.Kalimantan,CoalMiningandDeforestationFigure5.2.USEPAOrganismResponsetopHTable.5.1.CompilationofstudiesonIndonesianFishSpeciesResponsetopHTable.6.1.WastewaterQualityLimitforCoalMiningActivitiesTable6.2.SummaryofFindingsandFieldObservationsFigure6.1.RelationshipsbetweenpHandthedissolvedconcentrationsofthreemetalsinsamplesofwaterandwastewatercollectedinthevicinityofcoalminingoperationsinIndonesiaFigure7.1.Fieldsketch:SamplingPointID/IDN14029Figure7.2.Fieldsketch:SamplingPointID/IDN14013,14016,14017Figure7.3.Fieldsketch:SamplingPointID/IDN14004

Coal Mines Polluting South Kalimantan’s WaterCoal Mines Polluting South Kalimantan’s Water
5 | Greenpeace Southeast Asia – Indonesia Greenpeace Southeast Asia - Indonesia | 5
PT. Arutmin Indonesia
15 18
04
PT. Tanjung Alam Jaya
A breach in the bank of an abandoned mine pit is leaking acid water (pH 3.74) into a stream used by the community
PD. Baramarta
PT. Jorong Barutama Greston
PT. Adaro Indonesia“.. Water scarcity is bad in this village. We never had it before the coal company came. Now every dry season, there's no water. Because the forests are gone. My village is high up so we don't get flash floods but this village gets a lot of flooding. The concession (well) is too deep. Like 100 m. And the community well is only 20 m deep…”
(Villager of South Kalimantan, Age 32, on water scarcity, refer to testimony: Coal Impact on People
(Not covered by Greenpeace sampling)
KOTABANJARMASIN
TANAHBUMBU
CENGAL-BATULICINRIVER AREA
BARITOKUALA
KAPUAS
BARITOSELATAN
BARITOTIMUR
HULUSUNGAIUTARA
HULUSUNGAI
SELATAN
HULUSUNGAITENGAH
RABALONG
BALANGAN
PASER
KOTABANJARBARU
BANJAR
KOTA BARU
TAPIN
TANAHLAUT
BARITORIVER AREA
12
1
234 8 11
10
9
24
25
26
2728 13
20
17
15
2114
1918
6
57
29
NOTES : *In comparison to regulatory limits for discharge of coal wastewater: Manganese (Mn) = 4mg/L = 4000 µg/L; Iron (Fe) = 7mg/L = 7000 µg/LMOE (2003) Indonesia Ministry of Environment (MOE) Decree No. 113 on Wastewater Quality Limit for Coal Mining Activities ** Testing results from all 29 locations are available in Table: Concentration of Metals and Metalloids, Analytical Report 04-2014
SOURCE:Coal Map of South Kalimantan, Petromindo, August 2013, IndonesiaBasemap 1:250.000 Geospasial Information Agency, 2014 River Area, Dir. Gen. of Water Resource, Ministry of Public Work,,
IMAGE: Erik Wirawan, Richi Raimba, DigitalGlobe, 2012-12-01 up to 2014-03-18, resolution spectral 60 x 60
108
Acid water with 10 times the discharge limit for Manganese leaks from a set of ponds *
pH 2.34; 40 times the discharge limit for Iron. * Also found higher levels of Ni, Zn, Cu, Cr, Co, Hg than other samples. This acid pond is right beside the main road used by villagers of Salaman, South Kalimantan.
29
12 PT. Kadya Caraka Mulia
An acid pond (pH 3.38) right beside a public road in a valley of paddy fields.3 times the discharge limit for Manganese*
25
SOUTH KALIMANTAN
N
A leak was detected at point No. 025. (pH 4.4)
26
An abandoned mine pit has become a 2 km long acid lake (pH 3.74).
Greenpeace Investigation: South Kalimantan Sampling Sites LEGEND
River Areas boundary
Province Boundary
District/Kabupaten Boundary
Coal Production & Exploration
Construction and Feasibility StudySource:Coal Map of South Kalimantan, Petromondo, August 2013Indonesia Basemap 1:250.000, Badan Informasi Geospasial, 2014River Area, Ditjen Sumber Daya Air - Kem PU, Map Analysis

Coal Mines Polluting South Kalimantan’s WaterCoal Mines Polluting South Kalimantan’s Water
6 | Greenpeace Southeast Asia – Indonesia Greenpeace Southeast Asia - Indonesia | 6
Greenpeace has uncovered evidence that the intensive coal mining activities in Indonesia’s South Kalimantan province are discharging toxic pollution into rivers, and in some instances, violating national standards for wastewater discharges from mines. Local environmental authorities have failed to stop or prevent the violations. Due to the large amount of coal mining, almost half of the province’s rivers are at risk of being affected by water pollution from the mines.
In this report, Greenpeace is publishing findings from our first field-investigation on the impacts of large-scale coal mining on water quality in South Kalimantan. Coal mines are degrading the water in the region and harming the environment. Twenty-two of twenty-nine samples taken by Greenpeace from ponds and effluents associated with mining activities within five coal concessions across the province were found to have unacceptably high acidity. Of those samples, 18 had a pH below 4, and many of those contained elevated concentrations of metals. The actual leakage and potential for further overflow or seepage from such contaminated ponds in coal concessions poses grave dangers to nearby creeks, swamps, and rivers.
Greenpeace research indicates that around 3,000 km of South Kalimantan’s rivers - almost 45% of the total - are downstream from coal mines and hence potentially at risk of toxic pollution from different coal concessions. Coal mining companies are being allowed to violate the public’s right to clean water, and are jeopardising the current and future health and wellbeing of South Kalimantan’s people.
The Greenpeace investigation team on the ground discovered leaks and discharges of acid and toxic water well over legal limits set for discharges from operating coal mines and from abandoned mine pits. Scientific analysis of samples collected shows that wastes containing elevated concentrations of certain heavy metals, including iron, manganese, nickel and copper, are being released into the water bodies and surrounding areas at some of the sites, in addition to the presence of unacceptably low pH levels in the water. Around three quarters of all samples collected by Greenpeace had pHs outside regulatory norms for mine wastewater. Due to limited access, security threats, and time constraints, this sampling only covered a small number of the concessions in South Kalimantan, and thus it seems probable that there are many more violations. Moreover, every concession visited by Greenpeace revealed some evidence of environmental negligence. This report presents several cases of mining companies whose operations deserve deeper investigation by the relevant government agencies and subsequent regulatory control.
Our research has focused on mining activities in South Kalimantan – one of the areas most affected by Indonesia’s coal mining boom. This report incorporates a snapshot of different sampling points from several mining concessions in the province. The samples consisted of waters collected from leaks, engineered water discharge channels and abandoned mine pits.
Greenpeace believes that there is a clear and present danger of hazardous materials being released into neighbouring water bodies and the surrounding environment. As you are reading
this report, neighbouring and downstream local communities may be using potentially contaminated water to bathe, wash, and farm. The risks they face are unacceptable.
The mining companies who are profiting from these dirty and, in some cases, illegal operations have a legal and moral responsibility to reduce pollution into the water bodies that communities depend on, or they should be shut down. Moreover, companies found to be violating the law should pay for clean-up operations even if their mining licenses expire or are cancelled, since acid mine drainage (AMD) problems typically persist for many decades.
Greenpeace’s research is not to be generalised as a survey of every discharge point in all mining activities in South Kalimantan, nor as a survey of all mining companies. The purpose of this report is to present the data from those sampling points we were able to access and to give a snapshot of the releases of wastewater and drainage water into the environment due to some specific coal mining activities, and to reveal how the state appears to be failing to protect the environment and the public’s right to clean water.
Greenpeace’s field investigation findings correlate with a 2013 government water quality survey of the Barito and Martapura rivers, as well as other rivers, showing that the rapid expansion of coal mines over the previous fifteen years had contributed to the poor water quality in the region now, significantly driving up public spending to provide a safe drinking water supply. Indeed, some companies that Greenpeace investigated had previously been given fails (red rankings) and warnings from government authorities, which also found that these same companies were violating crucial regulations designed to protect human health
and the environment. These companies must be brought to justice and made to pay for the clean-up of the water bodies they have contaminated, as well as being forced to pay compensation to the people whose health and livelihoods they have endangered.
The people of South Kalimantan deserve better. All Indonesians are entitled to justice and to a healthy, bright future, with clean water for them and their children.
Greenpeace conducted research over a period of nine months, including three months of scouting and sampling. The investigation team visited South Kalimantan three times and collected 29 samples from five mining companies’ concessions; PT. Arutmin Indonesia, PT. Jorong Barutama Greston, PT. Tanjung Alam Jaya, PT. Kadya Caraka Mulia, PD. Baramarta and several smaller concessions in the districts of Tapin, Banjar and Tanah Laut, as well as conducting field pH measurements in
1 EXECUTIVE SUMMARY 2 METHODOLOGY
additional mining concessions. Desk research reviewed publicly available data on the subject, with a focus on government data provided by the South Kalimantan provincial environmental protection agency, Badan Lingkungan Hidup Hidup Daerah (BLHD), and data from the Ministry of Energy and Natural Resources Department of Mining. Data published by the Indonesian Coal Mining Association, along with other corporate data from coal companies, were also crucial to our desk review.
©greenpeaceCoal mining changes the landscape of
Asam-asam, Tanah laut, South Kalimantan
Coal Mines Polluting South Kalimantan’s Water
8 | Greenpeace Southeast Asia – Indonesia
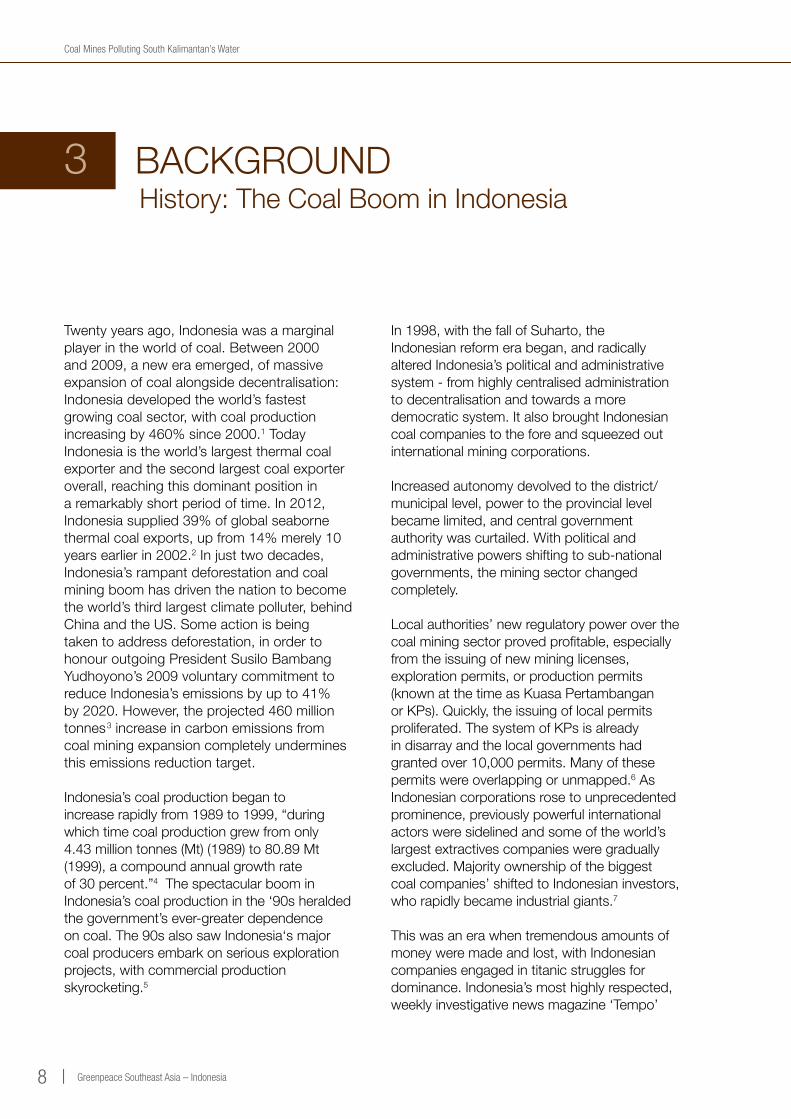
Twentyyearsago,Indonesiawasamarginalplayerintheworldofcoal.Between2000and2009,aneweraemerged,ofmassiveexpansionofcoalalongsidedecentralisation:Indonesiadevelopedtheworld’sfastestgrowingcoalsector,withcoalproductionincreasingby460%since2000.1 Today Indonesiaistheworld’slargestthermalcoalexporterandthesecondlargestcoalexporteroverall,reachingthisdominantpositioninaremarkablyshortperiodoftime.In2012,Indonesiasupplied39%ofglobalseabornethermalcoalexports,upfrom14%merely10yearsearlierin2002.2Injusttwodecades,Indonesia’srampantdeforestationandcoalminingboomhasdriventhenationtobecometheworld’sthirdlargestclimatepolluter,behindChinaandtheUS.Someactionisbeingtakentoaddressdeforestation,inordertohonouroutgoingPresidentSusiloBambangYudhoyono’s2009voluntarycommitmenttoreduceIndonesia’semissionsbyupto41%by2020.However,theprojected460milliontonnes3increaseincarbonemissionsfromcoalminingexpansioncompletelyunderminesthisemissionsreductiontarget.
Indonesia’scoalproductionbegantoincreaserapidlyfrom1989to1999,“duringwhichtimecoalproductiongrewfromonly4.43milliontonnes(Mt)(1989)to80.89Mt(1999),acompoundannualgrowthrateof30percent.”4 The spectacular boom in Indonesia’scoalproductioninthe‘90sheraldedthegovernment’sever-greaterdependenceoncoal.The90salsosawIndonesia‘smajorcoalproducersembarkonseriousexplorationprojects,withcommercialproductionskyrocketing.5
In1998,withthefallofSuharto,theIndonesianreformerabegan,andradicallyaltered Indonesia’s political and administrative system-fromhighlycentralisedadministrationto decentralisation and towards a more democraticsystem.ItalsobroughtIndonesiancoalcompaniestotheforeandsqueezedoutinternationalminingcorporations.
Increased autonomy devolved to the district/municipallevel,powertotheprovinciallevelbecamelimited,andcentralgovernmentauthoritywascurtailed.Withpoliticalandadministrativepowersshiftingtosub-nationalgovernments,theminingsectorchangedcompletely.
Localauthorities’newregulatorypoweroverthecoalminingsectorprovedprofitable,especiallyfromtheissuingofnewmininglicenses,explorationpermits,orproductionpermits(knownatthetimeasKuasaPertambanganorKPs).Quickly,theissuingoflocalpermitsproliferated.ThesystemofKPsisalreadyindisarrayandthelocalgovernmentshadgrantedover10,000permits.Manyofthesepermitswereoverlappingorunmapped.6 As Indonesian corporations rose to unprecedented prominence,previouslypowerfulinternationalactorsweresidelinedandsomeoftheworld’slargestextractivescompaniesweregraduallyexcluded.Majorityownershipofthebiggestcoalcompanies’shiftedtoIndonesianinvestors,whorapidlybecameindustrialgiants.7
Thiswasanerawhentremendousamountsofmoneyweremadeandlost,withIndonesiancompaniesengagedintitanicstrugglesfordominance.Indonesia’smosthighlyrespected,weeklyinvestigativenewsmagazine‘Tempo’
3BACKGROUND History: The Coal Boom in Indonesia

Greenpeace Southeast Asia - Indonesia | 9
Coal Mines Polluting South Kalimantan’s Water
reportedaproliferationof“Coalmafias” 8 and “coalwars”9;thugswerehired;transparencylessened;corruptionexpanded;illegalminingoperationsmushroomed;governmentcoordinationdiminished;andfromthesky,muchofKalimantan,theIndonesianpartoftheislandofBorneo,begantolookmoreandmoreravaged.By2008therewerethreeenormous,legalcoalminingcontractorsinSouthKalimantan-buthundredsofillegal,unlicensedsmall-scalecoalminers.“AlmosteverydistrictofSouthKalimantanProvince
containsseveralillegalcoalmines,andtheirnumbersaregrowing.In1997,157individualsorbusinessesofthistypewererecorded,risingto445in2000and842in2004.”10 While large-scaleconcessionspollutemorebecauseoftheirsize,smallerconcessionsmaybeworseintheintensityoftheirpollution,giventheneartotallackofenvironmentalandotheroversightinmanycases.Someexpertsbelievethat“Artisanalandsmall-scalemining(ASM)inIndonesiaisundertakenwithlittleornoenvironmentalcare.” 11
Figure 3.1. Indonesia Coal Production 1981-2013
450
425
400
375
350
325
300
275
250
225
200
175
150
125
100
75
50
25
01981 1982 1983 1984 1985 1986 1987 1988 1989 1990 1991 1992 1993 1994 1995 1996 1997 1998 1999 2000 2001 2002 2003 2004 2005 2006 2007 2008 2009 2010 2011 2012 2013 YEAR
Source: BP Statistical Review of World Energy 2014
Indonesia Coal Production (tonnes)
0.40 0.59 0.65 1.47 2.00 2.59 3.03 4.49 8.70 10.73 13.8422.36 27.58
32.8741.84
50.35 54.8262.23
73.6877.04
92.54103.33
132.35
152.72
193.76
216.95
240.25256.18
275.16
353.27
386.00
421.00
114.28
Coal Mines Polluting South Kalimantan’s Water
10 | Greenpeace Southeast Asia – Indonesia
South Kalimantan: A Major Player in Indonesia’s Coal Industry
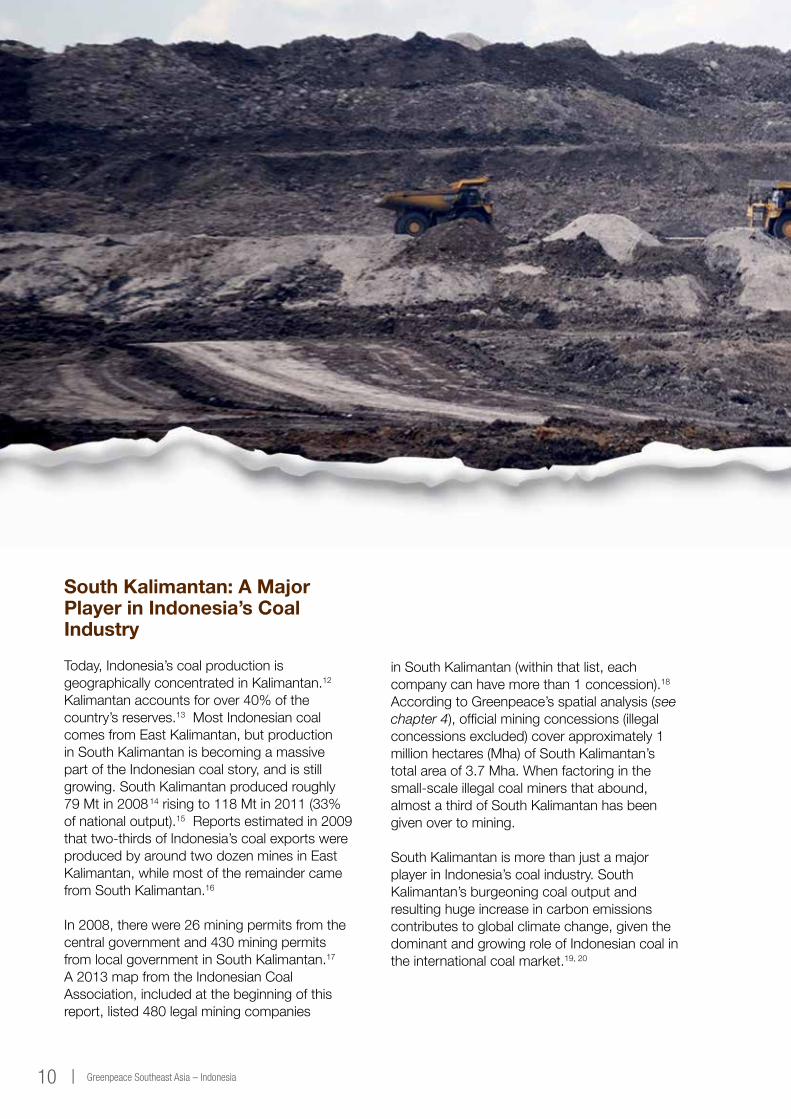
Today,Indonesia’scoalproductionisgeographicallyconcentratedinKalimantan.12 Kalimantanaccountsforover40%ofthecountry’sreserves.13 Most Indonesian coal comesfromEastKalimantan,butproductioninSouthKalimantanisbecomingamassivepartoftheIndonesiancoalstory,andisstillgrowing.SouthKalimantanproducedroughly79Mtin2008 14risingto118Mtin2011(33%ofnationaloutput).15Reportsestimatedin2009thattwo-thirdsofIndonesia’scoalexportswereproduced by around two dozen mines in East Kalimantan,whilemostoftheremaindercamefromSouthKalimantan.16
In2008,therewere26miningpermitsfromthecentralgovernmentand430miningpermitsfromlocalgovernmentinSouthKalimantan.17 A2013mapfromtheIndonesianCoalAssociation,includedatthebeginningofthisreport,listed480legalminingcompanies
inSouthKalimantan(withinthatlist,eachcompanycanhavemorethan1concession).18 AccordingtoGreenpeace’sspatialanalysis(see chapter 4),officialminingconcessions(illegalconcessions excluded) cover approximately 1 millionhectares(Mha)ofSouthKalimantan’stotalareaof3.7Mha.Whenfactoringinthesmall-scaleillegalcoalminersthatabound,almostathirdofSouthKalimantanhasbeengivenovertomining.
South Kalimantan is more than just a major playerinIndonesia’scoalindustry.SouthKalimantan’sburgeoningcoaloutputandresultinghugeincreaseincarbonemissionscontributestoglobalclimatechange,giventhedominantandgrowingroleofIndonesiancoalintheinternationalcoalmarket.19,20

Greenpeace Southeast Asia - Indonesia | 11
Coal Mines Polluting South Kalimantan’s Water
Source: Indonesia Mineral and Coal Statistics 2012 21
Adaro Indonesia, PT
Antang Gunung Meratus, PT
Arutmin Indonesia, PT
Bahari Cakrawala Sebuku, PT
Bangun Banua Persada Kalimantan, PT
Baramarta, PD
Borneo Indobara, PT
Jorong Barutama Greston, PT
Kadya Caraka Mulya, PT
Sumber Kurnia Buana, PT
Tanjung Alam Jaya, PT
Wahana Baratama Mining, PT
Senamas Energindo Mulia, PT
Additional companies[1]
Figure 3.2. South Kalimantan Coal Production
Tonnes5000000047500000450000004250000040000000375000003500000032500000300000002750000025000000225000002000000017500000150000001250000010000000
750000050000002500000
0 2010 2011
CoalmininginSouthKalimantan,Indonesia
©greenpeace/LauryMyllyvirta
[1] real numbers may be higher since local governments have not shared all their data.
Coal Mines Polluting South Kalimantan’s Water
12 | Greenpeace Southeast Asia – Indonesia
Purpose and Scope
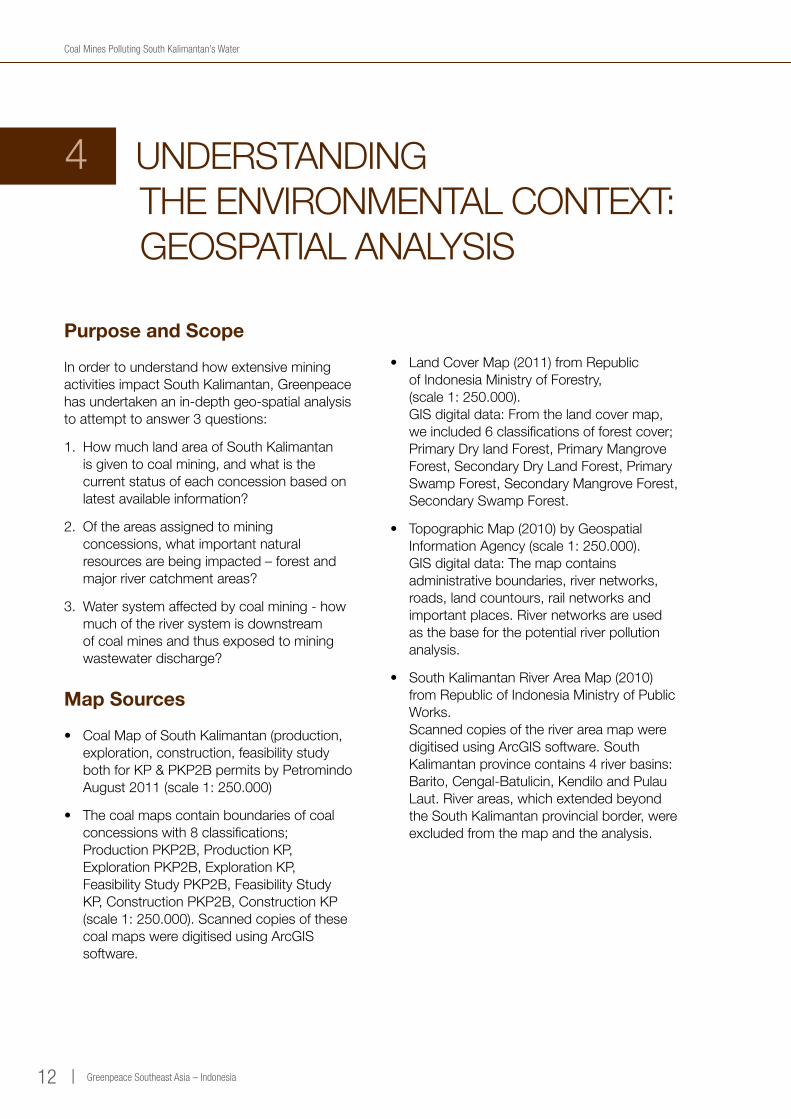
InordertounderstandhowextensiveminingactivitiesimpactSouthKalimantan,Greenpeacehasundertakenanin-depthgeo-spatialanalysistoattempttoanswer3questions:
1. HowmuchlandareaofSouthKalimantanisgiventocoalmining,andwhatisthecurrentstatusofeachconcessionbasedonlatestavailableinformation?
2. Oftheareasassignedtominingconcessions,whatimportantnaturalresourcesarebeingimpacted–forestandmajorrivercatchmentareas?
3. Watersystemaffectedbycoalmining-howmuchoftheriversystemisdownstreamofcoalminesandthusexposedtominingwastewaterdischarge?
Map Sources
• CoalMapofSouthKalimantan(production,exploration,construction,feasibilitystudybothforKP&PKP2BpermitsbyPetromindoAugust2011(scale1:250.000)
• Thecoalmapscontainboundariesofcoalconcessionswith8classifications;ProductionPKP2B,ProductionKP,ExplorationPKP2B,ExplorationKP,FeasibilityStudyPKP2B,FeasibilityStudyKP,ConstructionPKP2B,ConstructionKP(scale1:250.000).ScannedcopiesofthesecoalmapsweredigitisedusingArcGISsoftware.
• LandCoverMap(2011)fromRepublicofIndonesiaMinistryofForestry,(scale1:250.000).GISdigitaldata:Fromthelandcovermap,weincluded6classificationsofforestcover;PrimaryDrylandForest,PrimaryMangroveForest,SecondaryDryLandForest,PrimarySwampForest,SecondaryMangroveForest,SecondarySwampForest.
• TopographicMap(2010)byGeospatialInformationAgency(scale1:250.000).GISdigitaldata:Themapcontainsadministrativeboundaries,rivernetworks,roads,landcountours,railnetworksandimportantplaces.Rivernetworksareusedasthebaseforthepotentialriverpollutionanalysis.
• SouthKalimantanRiverAreaMap(2010)fromRepublicofIndonesiaMinistryofPublicWorks.ScannedcopiesoftheriverareamapweredigitisedusingArcGISsoftware.SouthKalimantan province contains 4 river basins: Barito,Cengal-Batulicin,KendiloandPulauLaut.Riverareas,whichextendedbeyondtheSouthKalimantanprovincialborder,wereexcludedfromthemapandtheanalysis.
4 UNDERSTANDING THE ENVIRONMENTAL CONTEXT: GEOSPATIAL ANALYSIS

Greenpeace Southeast Asia - Indonesia | 13
Coal Mines Polluting South Kalimantan’s Water
Definition of MineConcession Stages for Licensing:
AccordingtotheMinistryofMiningandEnergyResourcesLawNo.4/2009
1. Exploration: Thestageofminingactivitiesthataimstoobtainaccurateanddetailedinformationaboutthelocation,shape,dimension,distribution,qualityandmeasuredresourceofminerals,aswellasinformationaboutthelocalsocialandenvironmentalsituation.
2. Feasibility Study: Thestageofminingoperationstoobtaindetailedinformationonallaspectsthatrelatetotheeconomicandtechnicalfeasibilityofmining.Thisincludestheanalysisoftheenvironmental impacts as well as post-miningplanning.
3. Construction: Thestageofminingactivitiesthatcoverstheconstructionofallfacilitiesrelatedtoproductionoperations,includingenvironmentalimpactcontrol.
4. Production: Thestageofminingactivitiesthatincludesconstructionattheminingsite,processing,refining,includingtransportationandsales,aswellasameansofcontrollingenvironmental impacts in accordance with theresultsofthefeasibilitystudy.
Data analysis:Usingthespatialdatafromtheabovesourcemaps,theareaofeachcoalconcessionwascalculatedandaggregated.Theareaofrivercatchmentareasandforestcover areas in each coal concession were alsocalculatedusinganoverlayanalysisandtabularanalysisprocess.Thelengthofriversandstreamsthatarewithinordownstreamoftheconcessionswasalsocalculatedusinganoverlayanalysisandtabularanalysisprocess.The results are presented below:
SouthKalimantan’sopencastcoalmining©greenpeace/YudhiMahatma
Coal Mines Polluting South Kalimantan’s Water
14 | Greenpeace Southeast Asia – Indonesia
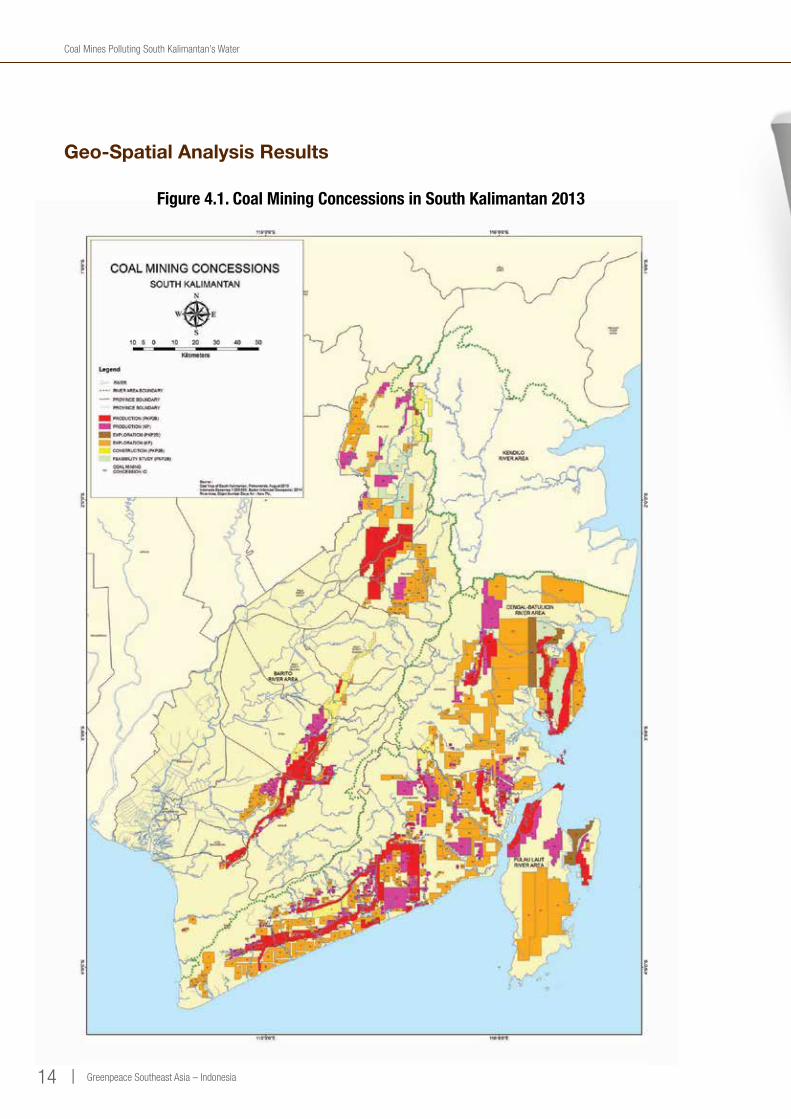
Figure 4.1. Coal Mining Concessions in South Kalimantan 2013
Geo-Spatial Analysis Results

Greenpeace Southeast Asia - Indonesia | 15
Coal Mines Polluting South Kalimantan’s Water
Table 4.1. Coal Mining Concessions in South Kalimantan 2013
Row Labels
PRODUCTION (PKP2B)
PRODUCTION (KP)
EXPLORATION (PKP2B)
EXPLORATION (KP)
CONSTRUCTION (PKP2B)
FEASIBILITY STUDY (PKP2B)
Grand Total
Sum in Ha
81363
45443
--
97083
27199
22838
273926
%
2.11%
56.22%
2.53%
4.07%
17.88%
17.18%
100%
%
9.93%
35.44%
0.00%
8.34%
16.59%
29.70%
100%
Sum in Ha
183
530
--
--
417
8478
9608
Sum in Ha
17941
18323
531
75197
--
--
111992
210035
179290
24809
532685
49172
48860
1044851
Sum in Ha
109774
114275
16176
359301
13495
26023
639044
%
88.24%
4.34%
0.00%
0.00%
5.51%
1.91%
100%
%
0.00%
67.14%
0.47%
0.00%
16.36%
16.02%
100%
%
4.71%
50.98%
2.37%
4.68%
17.16%
20.10%
100%
%
0.00%
6.68%
78.78%
0.00%
7.00%
7.53%
100%
Sum in Ha
775
720
8101
687
--
--
10283
BARITOCENGAL-
BATULICIN
PULAULAUT
KENDILOSOUTH
KALIMANTAN
KENDILOEAST
KALIMANTAN*
TOTAL(Ha)
* As the GIS digital data that we extracted from the maps is based on coal concession boundaries, we have included some coal concessions that extend across the provincial border into East Kalimantan. However, as only small portions of these concessions extend across the border, we are confident that South Kalimantan level data is not distorted as a result.
Source: Indonesia Mineral and Coal Statistics 2012 i
Result: officialminingconcessions(illegalconcessions excluded) cover approximately1millionhectares(Mha)ofSouthKalimantan’stotalareaof3.7Mha.Whenfactoringinthesmall-scaleillegalcoalminesthatabound,almostathirdofSouthKalimantanhasbeengivenovertomining.
©gr
eenp
eace
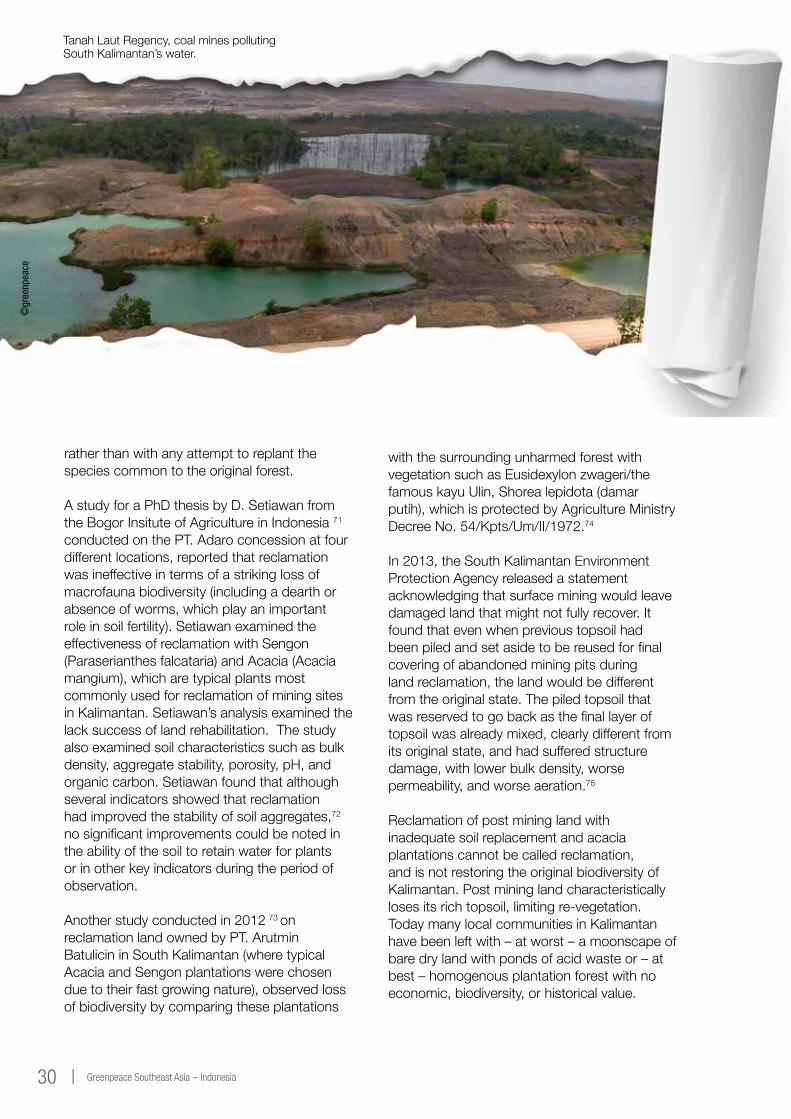
TanahLautRegency,coalminespollutingSouthKalimantan’swater.
a) Coal Mining Concessions
ThisanalysisisbasedontheCoalMapofSouthKalimantan(production,exploration,construction,feasibilitystudybothforKP&PKP2Bpermits),byPetromindoAugust2011(scale1:250.000)
Coal Mines Polluting South Kalimantan’s Water
16 | Greenpeace Southeast Asia – Indonesia
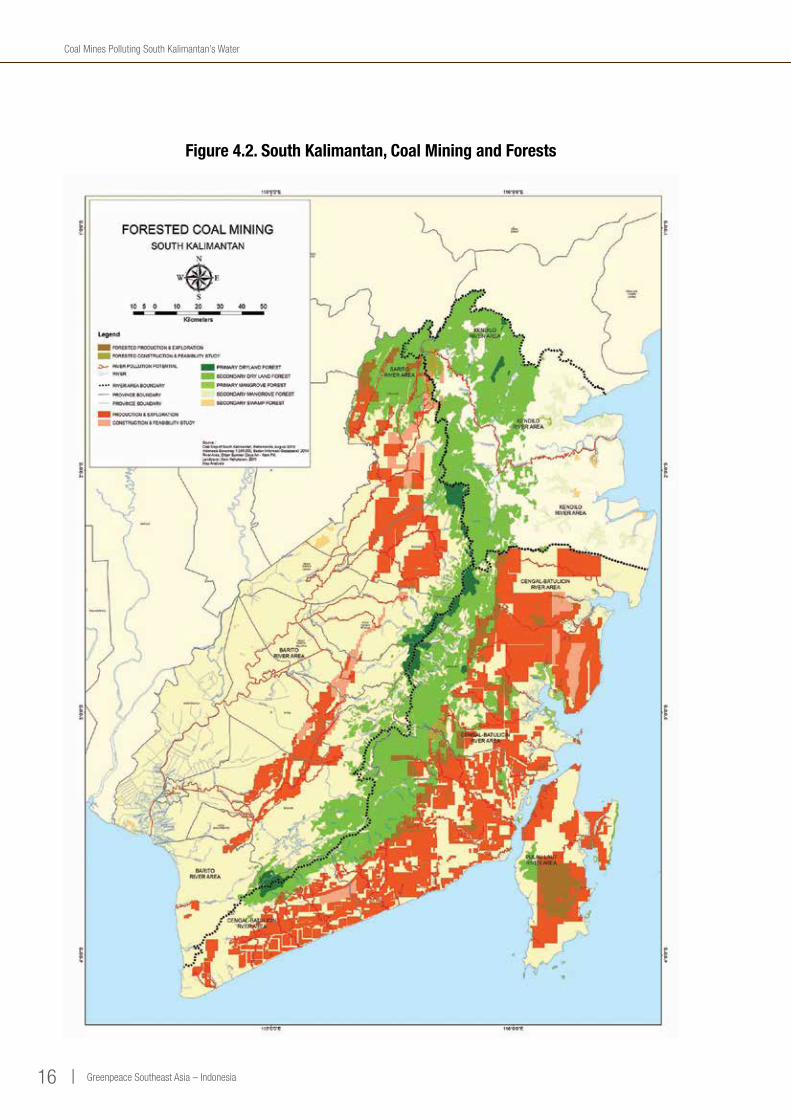
Figure 4.2. South Kalimantan, Coal Mining and Forests
Greenpeace Southeast Asia - Indonesia | 17
Coal Mines Polluting South Kalimantan’s Water
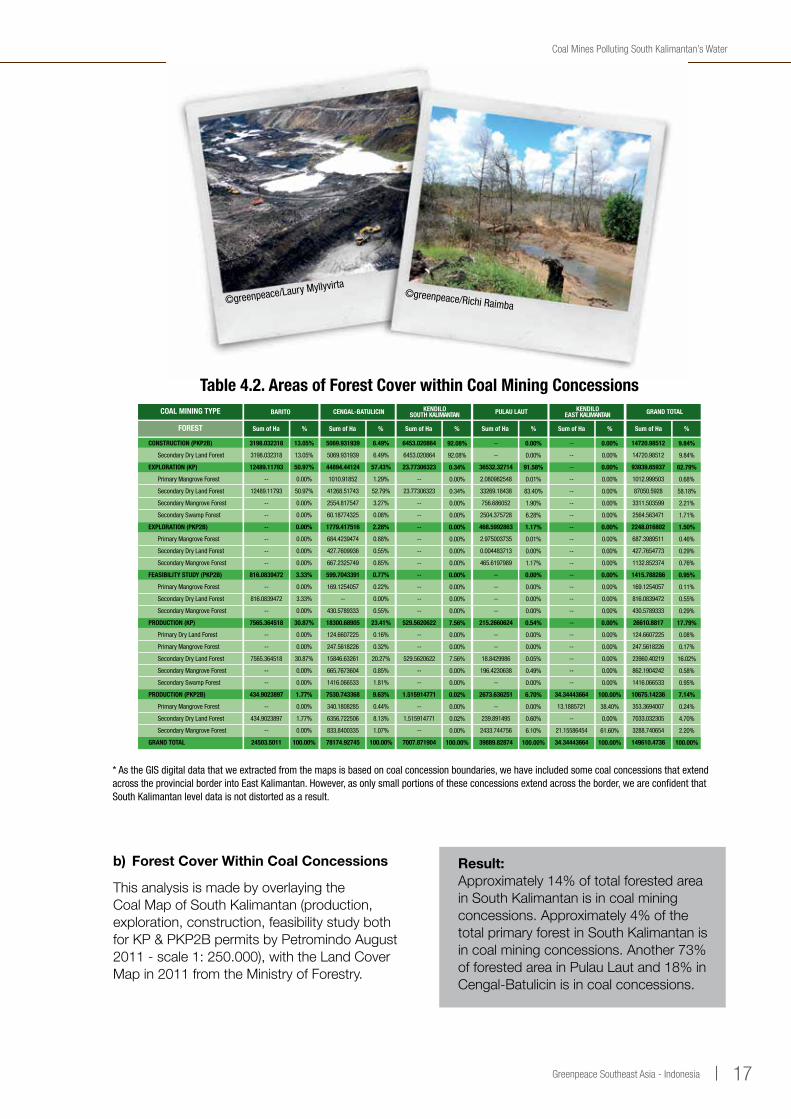
b) Forest Cover Within Coal Concessions
ThisanalysisismadebyoverlayingtheCoalMapofSouthKalimantan(production,exploration,construction,feasibilitystudybothforKP&PKP2BpermitsbyPetromindoAugust2011-scale1:250.000),withtheLandCoverMapin2011fromtheMinistryofForestry.
Table 4.2. Areas of Forest Cover within Coal Mining Concessions
* As the GIS digital data that we extracted from the maps is based on coal concession boundaries, we have included some coal concessions that extend across the provincial border into East Kalimantan. However, as only small portions of these concessions extend across the border, we are confident that South Kalimantan level data is not distorted as a result.
Result: Approximately14%oftotalforestedareainSouthKalimantanisincoalminingconcessions.Approximately4%ofthetotalprimaryforestinSouthKalimantanisincoalminingconcessions.Another73%offorestedareainPulauLautand18%inCengal-Batulicinisincoalconcessions.
©greenpeace/Laury Myllyvirta©greenpeace/Richi Raimba
Sum of Ha Sum of Ha% %
PULAU LAUT GRAND TOTAL
Sum of Ha Sum of Ha Sum of Ha Sum of Ha
BARITO
3198.032318
3198.032318
12489.11793
--
12489.11793
--
--
--
--
--
--
816.0839472
--
816.0839472
--
7565.364518
--
--
7565.364518
--
--
434.9023897
--
434.9023897
--
24503.5011
6453.020864
6453.020864
23.77306323
--
23.77306323
--
--
--
--
--
--
--
--
--
--
529.5620622
--
--
529.5620622
--
--
1.515914771
--
1.515914771
--
7007.871904
--
--
36532.32714
2.080982548
33269.18438
756.686052
2504.375728
468.5992863
2.975003735
0.004483713
465.6197989
--
--
--
--
215.2660624
--
--
18.8429986
196.4230638
--
2673.636251
--
239.891495
2433.744756
39889.82874
--
--
--
--
--
--
--
--
--
--
--
--
--
--
--
--
--
--
--
--
--
34.34443664
13.1885721
--
21.15586454
34.34443664
14720.98512
14720.98512
93939.65937
1012.999503
87050.5928
3311.503599
2564.563471
2248.016802
687.3989511
427.7654773
1132.852374
1415.788286
169.1254057
816.0839472
430.5789333
26610.8817
124.6607225
247.5618226
23960.40219
862.1904242
1416.066533
10675.14236
353.3694007
7033.032305
3288.740654
149610.4736
13.05%
13.05%
50.97%
0.00%
50.97%
0.00%
0.00%
0.00%
0.00%
0.00%
0.00%
3.33%
0.00%
3.33%
0.00%
30.87%
0.00%
0.00%
30.87%
0.00%
0.00%
1.77%
0.00%
1.77%
0.00%
100.00%
92.08%
92.08%
0.34%
0.00%
0.34%
0.00%
0.00%
0.00%
0.00%
0.00%
0.00%
0.00%
0.00%
0.00%
0.00%
7.56%
0.00%
0.00%
7.56%
0.00%
0.00%
0.02%
0.00%
0.02%
0.00%
100.00%
0.00%
0.00%
91.58%
0.01%
83.40%
1.90%
6.28%
1.17%
0.01%
0.00%
1.17%
0.00%
0.00%
0.00%
0.00%
0.54%
0.00%
0.00%
0.05%
0.49%
0.00%
6.70%
0.00%
0.60%
6.10%
100.00%
0.00%
0.00%
0.00%
0.00%
0.00%
0.00%
0.00%
0.00%
0.00%
0.00%
0.00%
0.00%
0.00%
0.00%
0.00%
0.00%
0.00%
0.00%
0.00%
0.00%
0.00%
100.00%
38.40%
0.00%
61.60%
100.00%
9.84%
9.84%
62.79%
0.68%
58.18%
2.21%
1.71%
1.50%
0.46%
0.29%
0.76%
0.95%
0.11%
0.55%
0.29%
17.79%
0.08%
0.17%
16.02%
0.58%
0.95%
7.14%
0.24%
4.70%
2.20%
100.00%
COAL MINING TYPE
FOREST
CONSTRUCTION (PKP2B)
Secondary Dry Land Forest
EXPLORATION (KP)
Primary Mangrove Forest
Secondary Dry Land Forest
Secondary Mangrove Forest
Secondary Swamp Forest
EXPLORATION (PKP2B)
Primary Mangrove Forest
Secondary Dry Land Forest
Secondary Mangrove Forest
FEASIBILITY STUDY (PKP2B)
Primary Mangrove Forest
Secondary Dry Land Forest
Secondary Mangrove Forest
PRODUCTION (KP)
Primary Dry Land Forest
Primary Mangrove Forest
Secondary Dry Land Forest
Secondary Mangrove Forest
Secondary Swamp Forest
PRODUCTION (PKP2B)
Primary Mangrove Forest
Secondary Dry Land Forest
Secondary Mangrove Forest
GRAND TOTAL
% % % %
6.49%
6.49%
57.43%
1.29%
52.79%
3.27%
0.08%
2.28%
0.88%
0.55%
0.85%
0.77%
0.22%
0.00%
0.55%
23.41%
0.16%
0.32%
20.27%
0.85%
1.81%
9.63%
0.44%
8.13%
1.07%
100.00%
5069.931939
5069.931939
44894.44124
1010.91852
41268.51743
2554.817547
60.18774325
1779.417516
684.4239474
427.7609936
667.2325749
599.7043391
169.1254057
--
430.5789333
18300.68905
124.6607225
247.5618226
15846.63261
665.7673604
1416.066533
7530.743368
340.1808285
6356.722506
833.8400335
78174.92745
CENGAL-BATULICIN KENDILOSOUTH KALIMANTAN
KENDILOEAST KALIMANTAN

Coal Mines Polluting South Kalimantan’s Water
18 | Greenpeace Southeast Asia – Indonesia
Figure 4.3. Potential River Pollution in South Kalimantan

Greenpeace Southeast Asia - Indonesia | 19
Coal Mines Polluting South Kalimantan’s Water
Table 4.3. Potential River Pollution in South Kalimantan
River at risk of mining activitiesNot directly impacted by mining activitiesGRAND TOTAL
River at risk of mining activitiesNot directly impacted by mining activitiesGRAND TOTAL
RIVER POLLUTION
RIVER POLLUTION
BARITO
BARITO
153228214353
31.18%64.82%100%
KENDILO
KENDILO
234339573
40.82%59.18%100%
PULAU LAUT
PULAU LAUT
7245
117
61.39%38.61%100%
GRAND TOTAL
GRAND TOTAL
325039357185
45.23%54.77%100%
CENGAL -BATULICIN
CENGAL -BATULICIN
1413729
2142
65.96%34.04%100%
LENGTH OF RIVER (KM)
LENGTH OF RIVER (%)
c) River Catchment Area/Waterways Downstream of Coal Concessions
The river area map analysis is based on overlayingtheCoalMapofSouthKalimantan(production,exploration,construction,feasibilitystudybothforKP&PKP2BpermitbyPetromindoAugust2011(scale1:250.000),withtheRiverAreaMapfromtheMinistryofPublicWorks.
Forthepotentialriverpollutionanalysis,wecalculatedthelengthofriver(km)flowingthroughcoalminingconcessionsandtracedtheflowsdownstreamusingtheTopographicMapbytheGeospatialInformationAgency(scale1:250.000)andtheCoalMapofSouthKalimantan,PetromindoAugust2011(scale1:250.000).Themapmaynotshowallthetributariesduetoitsscale.Ouranalysisonlyincludesrivers,orsectionsofrivers,intheprovinceofSouthKalimantan.
Result:Approximately3,000kmofSouthKalimantan’srivers-around45%ofallrivers in the province - are downstream fromcoalminesandhencepotentiallyatriskoftoxicpollutionfromcoalminingactivities.CarefulanalysisofmultiplemapsfromthecoalindustryandgovernmentauthoritiesindicatesthatseveralofSouthKalimantan’swatershedsareatriskduetothehighconcentrationofcoalminingoperationsthere.AccordingtoGreenpeacemappingcalculations,33%ofthecoalproductionconcessions in the province lie in the Baritowatershedand58%intheCengal-Batulicinwatershed,makingthesethemostcoalaffectedareas(see Table 4.1).
Coal Mines Polluting South Kalimantan’s Water
20 | Greenpeace Southeast Asia – Indonesia
5 ENVIRONMENTAL IMPACTS OF COAL MINING IN INDONESIA
Open Cast Coal Mining
Indonesiapermits“opencast”mining,sometimesalsocalled“stripmining”or“surfacemining,”aswellas“mountaintopremovalmining”.Broadlyspeakingthisisminingwherebyallthesoilandrock,whichlieontopofthemineralbeingmined,areremoved,oftenbybulldozingorblasting.Opencastminingisdifferentfromundergroundmining,wherethesurfaceisleftmoreorlessinplaceandwhereminersmustremovemineralsviashaftsortunnels.22
Opencastminingmethodsusedtoextractshallowcoalreservesarecommon.InIndonesiagenerally,andinKalimantanspecifically,opencastminingisresponsibleforextremeandsometimes irreversible environmental destruction withintheareamined,andwithespeciallydetrimentalimpactsonlocalwaterresources.Groundwaterneedstobepumpedoutoftheminepitsinordertoaccesstheseams,loweringgroundwaterlevelsoveralargearea.Forestsneedtocleared,andfertiletopsoilisremovedinordertoaccessthecoal.Intheprocess,opencastcoalminingcandestroyvaluableundergroundaquifers,streamsandrivers.
Moreover,barrenlandsareeasilyeroded,degradingthewaterqualityandcloggingupriversdownstream,leadingtoincreasedfloodingrisks.JATAM,theleadNGOforminingadvocacyinIndonesia,estimatesthatforeverytonneofcoalextracted,7-10tonnesofsoilneedtoberemoved.AccordingtoJATAM,“inEastandSouthKalimantan…agreatnumberofplantationsandpaddyfieldsthatusedtobeproductivehavebeenturnedintogapingminingholes.”23
Coal Mining and Deforestation
Massivelandclearanceforcoalminingthreatensforests,contributingtothecriticaldeforestationbroughtaboutbypalmoilplantations,logging,andotherthreats.Whenitcomestoforeststhreatenedbycoalmining,drylandforestsmaybemostatrisk.BasedonGreenpeaceanalysisofminingconcessionandlandcovermaps, see Tables 4.1 and 4.2,approximately14%oftotalforestedareainSouthKalimantanisincoalminingconcessions.AccordingtoGreenpeacemappingcalculations,33%ofthecoalproductionconcessionsintheprovincelieintheBaritowatershedand58%intheCengal-Batulicinwatershed,makingthesethemostcoalaffectedareas.
Fromthemapbelow,lookingatKalimantanasawhole,Greenpeacemappingshows0.13millionhectaresbeingdeforestedincoalminingconcessionsbetween2009and2011–weestimatethataroundone-quarterofthetotaldeforestationinKalimantanbetween2009and2011appearstobeattributabletocoal,contributing0.13milliontothetotal0.44MhaofforestcutdowninKalimantan. Coalminingcoulddofarmoredamageinthefuturethanwehavealreadyseeninthe pasttwoyears.Coal mining could be a deforestation time bomb waiting to happen. With 3.45 Mha of forests designated as coal mining concessions throughout the whole of Kalimantan in2011,Indonesiastandstolosehundredsofthousandsmorehectaresofforestifcoalcompaniesarepermittedtominethem.

Greenpeace Southeast Asia - Indonesia | 21
Coal Mines Polluting South Kalimantan’s Water
©gr
eenp
eace
/Yud
hi M
ahat
ma
Opencastcoalminingcreatesextremechangesinlandscape.Therichtopsoilislostandmayneverbefullyrecovered.Coal
miningpotentiallychangesthelandscape,createserosion,andaltersnaturalwaterways.

Coal Mines Polluting South Kalimantan’s Water
22 | Greenpeace Southeast Asia – Indonesia
Figure 5.1. Kalimantan, Coal Mining and Deforestation

Greenpeace Southeast Asia - Indonesia | 23
Coal Mines Polluting South Kalimantan’s Water
Acid Mine Drainage
Acidminedrainage(AMD)isthefloworrunoffofpolluted,acidic,metal-richwaterfromoperatingor old abandoned coal mines and areas with surfacedepositsofminewastesuchasrockpiles,tailings,openpits,undergroundtunnels,andleachpads.Dependingonthearea,thecontaminatedwatermaycontainhighlevelsofsalts,sulphate,iron,aluminium,andtoxicheavymetalssuchascadmiumandcobalt. 25 AMD occurswhenmetalsulfides,commoninrocksurroundingthecoalseams,comeintocontactwithwater,generatingacidity. 26Waterqualityisfurtherdegradedbecausethisacidicwateriscapableofdissolvingharmfulmetalsinthesurroundingrocks. 27 AMD can have a direct impactonthequalityofdrinkingwaterdrawnfromimpactedsurfacewater,onanimalorplantlife,andevencausethecorrosionofequipmentorstructures. 28Asmentionedabove,AMDisoftenlinkedtoanincreaseinheavymetalsinwaterbodiesorrivers,dissolvedironoxides,sulphates,aswellasincreasedacidity. 29 Many heavymetalsbio-accumulateintissue,andiftheyreachhighenoughconcentrationstheycan cause health and reproductive problems in wildlifeandhumans.
Thisistruenotonlynowbutforthelongtermfutureaswell.EvenifKalimantan’scoalminingcompaniescleaneduptheiroperationsandcompliedwiththeregulations,theirpastoperations would still threaten human health andtheenvironmentformanyyearstocome.This is partly because metals can cause problemsovermanyyears,sincetheydonotbreakdownintheenvironment,butrathersettleandpersistinbottomsofstreams.Thiscreateslong-termcontaminationforaquaticinsectsandanyanimalsthatfeedonthem.Existingtechnologydoesnotenableustostopacidminedrainageoncethereactionshavestarted.Indeed,coalminesthatcontaminateneighbouringstreamswithAMDwillposeproblemsthatfuturegenerationsmayhavetoaddressandmanageforhundredsofyears.Ideasandprognosticationsabouthowtomanagesuchwasteinthelongrunremainspeculative. 31
“Acidminedrainageisconsideredoneofmining’s
most serious threats to water resources.Aminewithacid
minedrainagehasthepotentialforlong-termdevastating
impactsonrivers,streamsandaquaticlife.”24
Worldwideitisknownthatcoalminingcancausesignificantwaterpollution.Ingeneral,theimpactsofacidminedrainage(AMD),primarilyfromabandonedminelands,onhundredsandpossiblythousandsofstreammilesgloballythatareaffectedbyacidification,caninclude:
• Contaminationofdrinkingwater,• Contaminationofindustrialwatersupplies,• Killingoralteringgrowthand reproductionofaquaticfloraandfauna,• Restrictedstreamuseforwashing,• Skinailmentsassociatedwithexposure tocontaminatedwater,• Decreaseinagriculturalyields,• Decreaseinfisheriesyields,• Declineinfoodsecurityforthose dependingonfishingorneighboring agriculture,• Declineinvalueofrealestatelocated
nearpollutedwatersources(housingsales data in some countries indicates thatbeinglocatednearastreamcontaminatedbyacidminedrainagelowersthevalueofapropertyorhouse).
©gr
eenp
eace
/Ric
hi R
aim
ba
Coal Mines Polluting South Kalimantan’s Water
24 | Greenpeace Southeast Asia – Indonesia
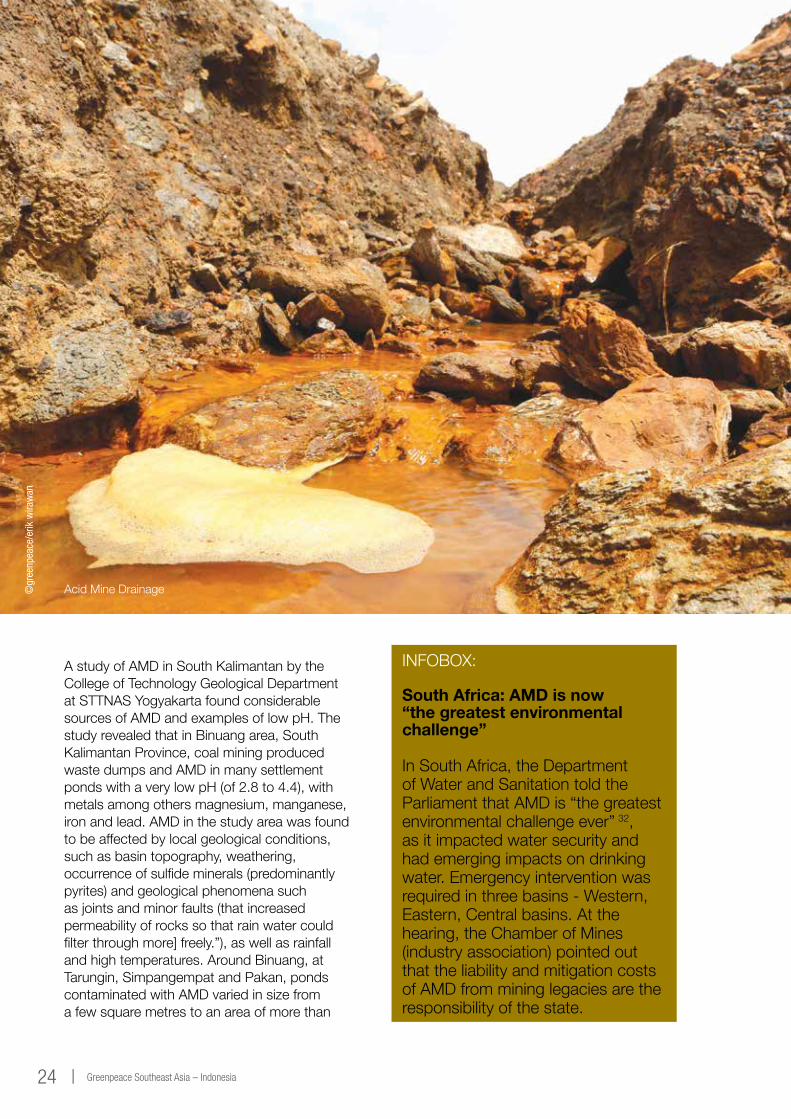
AstudyofAMDinSouthKalimantanbytheCollegeofTechnologyGeologicalDepartmentatSTTNASYogyakartafoundconsiderablesourcesofAMDandexamplesoflowpH.ThestudyrevealedthatinBinuangarea,SouthKalimantanProvince,coalminingproducedwaste dumps and AMD in many settlement pondswithaverylowpH(of2.8to4.4),withmetalsamongothersmagnesium,manganese,ironandlead.AMDinthestudyareawasfoundtobeaffectedbylocalgeologicalconditions,suchasbasintopography,weathering,occurrenceofsulfideminerals(predominantlypyrites)andgeologicalphenomenasuchasjointsandminorfaults(thatincreasedpermeabilityofrockssothatrainwatercouldfilterthroughmore]freely.”),aswellasrainfallandhightemperatures.AroundBinuang,atTarungin,SimpangempatandPakan,pondscontaminatedwithAMDvariedinsizefromafewsquaremetrestoanareaofmorethan
INFOBOX:
South Africa: AMD is now “the greatest environmental challenge”
InSouthAfrica,theDepartmentofWaterandSanitationtoldtheParliamentthatAMDis“thegreatestenvironmentalchallengeever”32,as it impacted water security and hademergingimpactsondrinkingwater.Emergencyinterventionwasrequiredinthreebasins-Western,Eastern,Centralbasins.Atthehearing,theChamberofMines(industryassociation)pointedoutthattheliabilityandmitigationcostsofAMDfrommininglegaciesaretheresponsibilityofthestate.
AcidMineDrainage©gr
eenp
eace
/erik
wira
wan

Greenpeace Southeast Asia - Indonesia | 25
Coal Mines Polluting South Kalimantan’s Water
25,000m2.Thestudyfoundthatminingwastewaterhadmixedwithgroundwater,surfacewater,andrainwater.33Sinceminingactivitiesatthissiteareongoing,thestudyconcluded that the mine would continue toproduceAMDinyearstocome,posingproblemsthatneededtobeovercome.34
AfurtherstudyalsofoundAMDfromaPT.BeraumineinEastKalimantan,andfoundalowpH(3.96to4.49)atalmostallmonitoringpointsin11sub-catchmentsoftheUkudriverdownstream.Italsofoundmetalssuchasiron,aluminum,andmanganese.35The study foundthat“inthepastoperationtherewasnosegregationbetweenpotentiallyacidformingmaterialandnon-acidformingmaterialwhendumpingtheoverburdeninthiscatchment.” 36
Furtherafield,inSumatra,similarproblemsofcoalminescontaminatingriverswithAMDhavebeenidentifiedaswell–raisingthepossibilitythat what happens in South Kalimantan may notbeanexceptionbutratherthenorm.OnesuchstudybyRizaetal,surveyedandanalysedwaterqualityfromApriltoNovember2011inseveraltributariesoftheSingingiriver,tounderstandtheeffectofcoalminesinKuantanSingingiRegency,RiauProvince.WatersamplescontaminatedbymineseffluentswerecollectedfromfourSingingirivertributaries,Sepuhriver,Geringgingriver,Keruhriver,andTapiriver.ThestudyconcludedthatGeringgingriverandKeruhriverwereheavilypolluted,andSepuhandTapiriversweremoderatelypolluted. 37
TheIndonesiangovernmenthasaresponsibilitytotestallofthepotentiallyAMDaffectedwaterbodies in Kalimantan that may be impactedbycoalmining,andtoexaminesamplesfor:lowpH,anincreaseintotalsuspendedsolids(TSS),totaldissolvedsolids(TDS),biologicaloxygendemand(BOD),andheavymetalconcentration.
Health Impacts from Coal Mining Wastewaters on Humans, Other Animals, Fish, and Plants
Wastewaterfromcoalminescanincludeelevatedlevelsofaluminium,arsenic,cadmium,chloride,copper,fluoride,hydrogensulphide,iron,lead,manganese,nickel,nitrate,nitrite,phosphate,potassium,sodium,sulphate,zincandothercontaminants.
Differenttoxicpollutants,whichtypicallyemergefromcoalmines,canpotentiallycauseavarietyofhealthproblems,38,39,40can harm crops when usedforirrigation,aswellasaffectfisheriesandfreshwaterecosystems(see box below).
44 United States Environmental Protection Agency
TROUT
BASS
PERCH
FROGS
SALAMANDERS
CLAMS
CRAYFISH
SNAILS
MAYFLY
6.5 5.5 4.56.0 5.0 4.0
pH
Figure 5.2. US EPA OrganismResponse to pH

Coal Mines Polluting South Kalimantan’s Water
26 | Greenpeace Southeast Asia – Indonesia
Acidwastefromcoalminescanseverelyharmorkillfish,animalsandplants,reducingoreveneliminatingfishpopulations.ApHofaround7ishealthy,neutral,andnaturalformostwaterbodies(althoughrainwateranduplandwateroftenhasapHbelow7throughcompletelynaturalprocesses).ManystreamsthatareaffectedbyAMDfromcoalmininghavepHvaluesofaround4orevenlessthan4. 41
AtsuchlowpHlevels,plants,fish,andotheranimalscanhavetroublesurviving.WhenwaterpHdropsto4or5,fishreproductionisaffectedandmostfisheggsarenotabletohatch;andadultfishcandieatlevelsof3to4: 42 Some plantsandfisharemoreresilientthanothersand can withstand low pH better than more acid-sensitivespecies,buteveninthosecases,eggsandyoungfishtendtobemoreacid-sensitivethanadults.“Thechartbelowshowsthatnotallfish,shellfish,ortheinsectsthattheyeatcantoleratethesameamountofacid.”43
TheboxaboveillustratesclearlyhowdifferentaquaticspeciesintheUnitedStatesareaffectedbylowpH,andalthoughthereisnocomprehensiveequivalentforKalimantan,someinformationdoesexistonhowafewpopularfishthatarewidelyconsumedinIndonesia,respondtodifferentlevelsofpH.
TheUSEPAalsonotedthatallbiologicalorganismsareinterdependentandinterrelatedto each other and to the environment in which theylive.Thus,eveniffrogsareabletotoleratehigherlevelsofaciditythanmayflies,iftheyneedtoeatinsectslikethemayflyinordertosurvive,frogsmaydiewhenmayfliesdie–simplybecausetheirfoodsupplyhascriticallydwindled.“Thus,aslakesandstreamsbecomemoreacidic,thenumbersandtypesoffishandotheraquaticplantsandanimalsthatliveinthesewatersdecrease.” 49
BesidespH,metalcontaminationofwatercanhavesignificantimpactsonfishandotheraquaticlife,andtheIndonesianauthoritiesmustinvestigatetheseimpactsinandaroundSouthKalimantan’scoalmines,toassessthemagnitudeofdamagedone.Aluminium,arsenic,manganese,nickel,cobaltandchromiumareknowntobeharmful(andoccasionallyevenlethal)toaquaticorganismsat the concentrations detected in Greenpeace samples(seeboxbelow). 50 Water pollution fromcoalminescanhaveimpactsfardownstream,especiallygiventheverylargenumberofcoalminesinthecatchmentsofSouthKalimantan’smainrivers.Whennotjustonetributarybuttheentireriverispolluted,dilution cannot be counted on to lower contaminantconcentrationstosafelevels.
Aspreviouslynoted,acidwaterreleasesmetalsfromsoilsintolakesandstreams;somemetalsarehighlytoxictomanyspeciesofaquaticorganisms.Manyaquaticorganismsareextremelysensitivetocopper,particularlyinsolubleforms,whicharegenerallyfarmorebioavailableandtoxictoawiderangeofaquaticplantsandanimals,51 withsomeeffectsoccurringevenatverylowconcentrations.52
Increased copper levels cause chronic stress thatmaynotkillindividualfish,butleadstolowerbodyweightandsmallersizeandmakesfishlessabletocompeteforfoodandhabitat.Greenpeacefoundcopperathighconcentrationsinsomewaters(upto1880microgramsperlitreorμg/l).Backgroundconcentrationsofsolublecopperinuncontaminatedsurfacewaterscanvarysignificantly,butlevelsaretypicallybelow10μg/l,andoftenfarlower.53
Fish Speciesin Indonesia
Respon to pH*
Ikan Nila (Nile Tilapia)Oreochromis niloticus
Ikan Gabus (snakehead fish)Channa striata
Ikan MasCyprinus carpio
Ikan Lele (Catfish)Clarias gariepinus
At pH 4 -5 only 30% survived (red strain); other strains died with various gill damages. 45
At pH 5 only 72% survived. 46
pH 6,5 - 8,5- optimum. 47
pH 6,5 - 8,6- optimum. 48
*Compilation of studies, each measured under different testing conditions, including various environmental parameters and life’s stages.
Table. 5.1. Compilation of studies onIndonesian Fish Species Response to pH

Greenpeace Southeast Asia - Indonesia | 27
Coal Mines Polluting South Kalimantan’s Water
Potential Impacts of the Heavy Metals Detected in South Kalimantan Coal Mining Wastewaters
Very few studies have been carried out on toxicity of heavy metals to Indonesian freshwater species and ecosystems. This box highlights findings from other parts of the world that clearly indicate that the detected levels of heavy metals can have serious impacts in Indonesia as well – and that groundwater flowing through active or abandoned coal mines often has depressed pH levels and elevated levels of dissolved metals such as arsenic, iron, copper and zinc, which can affect health of plants or animals. 55
Aluminium hasgreatertoxicityinacidicwater(pH5.5andbelow).Concentrationsof0.1-0.3mg/lhavebeenfoundtoreducesurvivaloffisheggsandhampergrowthinacidicwater.Concentrationsof0.7-3.3mg/lare reported to be chronically toxic in neutral waterwitheffectsincludingweightloss&impairedswimmingandfeedingability(thisrelatestochronicorlongtermtoxicityratherthanacutetoxicity).Athigherconcentrations,effectsincludedamagetogills,clogging
anddisturbanceofgillfunction;changesininternalorgansandreproduction.56
Manganese concentrationsofaround1mg/lcancausetoxiceffectsonorganismsinstreams,riversandlakes,asshownbybothlaboratorytestsandfieldobservations.Effectsincludeinhibitionofgrowth&photosynthesisofalgae;survivalandhatchingofcrabembryos;cankillsomefishandfishembryos,aswellasamphibianembryos,alreadyatconcentrationswellbelowtheIndonesiandischargestandards.Otherdocumentedeffectsincludeshelldisease in crabs and discoloration in the gillsoflobsters.Manganeseisalsotoxictosometerrestrialplants,withtoxicityvaryingwidelywithspecies;effectsincludemarginalchloroses,necroticlesions,anddistorteddevelopmentoftheleaves.57
Iron: Dissolvedironistoxicathighconcentrations,suchasthosewhichcanoccurinacidicwaterlackingoxygen,suchasminedischarge.Studieshavesuggestedthatdissolvedironconcentrationsinfreshwatershouldbebelow0.2-0.4mg/l,basedonimpactsonfreshwaterfish,clams,insectsandplants.58 Particulate iron can settle on the bottomofwaterbodies,destroyingplants,
bottom-dwellinginvertebratesandfisheggs.
For every species that locals notice have been affected,theremaybemanymorethatslipundertheradar.Indeed,althoughbiodiversityappearstobeheavilyaffected,thereisnoreliablestudyontheexactextentofthelossoffloraandfaunaincoal-miningaffectedforests.
Greenpeace calls on the authorities to conduct such a study, as a matter of urgency. Theneedforsuchastudyisallthemorepressinggiventhatstudiesinothercountries’miningaffectedareasrevealedclearnegativeimpactsofcoalpollutiononfloraandfauna.OnesuchreportaboutstreamsintheCentralAppalachianCoalfieldsintheUSassessedthestateofthescienceon
environmentalimpactsofmountaintopcoalminesand“valleyfills”bycoalcompanies(namelydumpingsomuchminingwasteintovalleysthattheywerecompletelyfilledupanddisappeared).Thestudyconcludedthatminingharmed stream ecosystems in numerous ways.Springsandsmallstreamshadbeencompletely lost due to mountaintop removal orburialunderfill;concentrationsofmajorchemicalionswerefounddownstream;waterqualitywasat“levelsthatareacutelylethaltostandardlaboratorytestorganisms”;seleniumconcentrationsweresohighthatthey“havecausedtoxiceffectsinfishandbirds”;and“macro-invertebrateandfishcommunitiesareconsistentlydegraded.”54

Coal Mines Polluting South Kalimantan’s Water
28 | Greenpeace Southeast Asia – Indonesia
Land Erosion Leading to Water Quality Degradation and Flooding Risks
ManyofSouthKalimantan’scoalminesandconcessionsarelocatedinfloodproneareas.GreenpeaceinvestigatorswitnessedaflashfloodwhiletheywereinvestigatingcoalminesinKabupatenTanahLaut,recognisedasafloodproneareabythelocalgovernment.Basedonananalysisofthelastfiveyearsbythelocaldisastermanagementagency,thereare939floodpointsinSouthKalimantan,whicharelocatedinthedistrictsofBanjar,TanahLaut,TanahBambuandHuluSungaiUtara.68Coalminingcontributestofloodingbecause land clearance destroys the water retentioncapacityofthesoil,leadingtoquickrunoffafterrainfall,andbecauselargeamountsofsedimentdischargesclogwaterways.Thosewaterwaysthenoverflowmoreeasilywhenheavyrainscome.Coalminingalsoexacerbatesfloodingbecauseitistypicallyprecededbyloggingand,duringmining,notreesareallowedtogrowbackinkeyareas.Loggingtreesincreasesthefloodriskinthelongtermbecausetreessoakupvastamountsofwater.Withouttheseforeststhereisnothingtosoakupheavyrainfall,anditfrequentlyleadstoflashfloods.
Post-Mining Reclamation and Long Term Recovery
Thewholesaledestructionofvegetationandsoiloverlargeareas,aswellasminetailingsandtoxicpitsleftbehindbymining,affectecosystemsandwaterresourcesfordecades.Miningcompanieshaveanobligationtoalleviatetheimpactstotheextentpossiblethroughpost-miningreclamation,butinrealitythisposesterribleproblems.Inmanycases,reclamationinSouthKalimantaniscompletelyneglected.Whenminingcompanieshaveremovedallthecoaltheywant,theyoftenabandongiantpits,whichfillwithtoxicwater,leavingbehindlagoonsthatareespeciallydangerousforfish,amphibians,otheranimals,andlocalcommunities.
Inmanycases,post-miningreclamationinKalimantanisdoneverypoorly–althoughGreenpeace posits that there is no truly good way to conduct reclamation, which is precisely one of the crucial reasons why strip mining should not be allowed. With bad reclamation, loss of topsoil, failure to save and reinstate original topsoil, re-planting with homogenous plantations of acacias,69 the land and its original biodiversity will never fully recover.
Nickel: Infreshwaterecosystems,nickelcaninhibitalgaegrowthandharmthesurvivaloftheembryosofsomefishspecies.Nickelcaninhibitgrowthofcrops.Besidesinhibitingplantgrowth,othersymptomsofnickeltoxicityinplantsincludechlorosis,stuntedrootgrowthandbrowninterveinalnecrosis.59,60,61,62
Cobalt causesreducedsurvivalandgrowthoffishembryosinsomespecies,anditislethal to toad larvae and sensitive invertebrate species.Cobaltisalsotoxictoavarietyoffoodcrops.63
Chromium cancauseallergicdermatitisthroughbothskincontactanddrinking.Theconditionischaracterisedbydryness,erythema,fissuring,papules,scaling,smallvesicles,andswellingofskin.TheU.S.EPAhasproposedtoclassifychromium-6aslikelytobecarcinogenictohumanswheningested,andanassessmentiscurrentlyongoing.Infreshwaterecosystems,chromiumdecreasesinsurvivalandgrowthratesofaquaticanimals;cancauseDNAdamageandeffectsonfertilizationandbloodcompositioninsomespecies.64,65,66,67

Greenpeace Southeast Asia - Indonesia | 29
Coal Mines Polluting South Kalimantan’s Water
There are severe limits to what can be achievedthroughreclamation.AUniversityofCaliforniastudybyKarenHoll,UniversityofCalifornia,reviewedthelong-termeffectsofreclamationeffortsofdegradedlandscapeson plant conservation to determine whether vegetationofreclaimedminesapproximatedthesurroundingforestafteralongperiodofreclamation.Thestudyalsoevaluated“howintensive reclamation practices used to address short-termerosionandwaterqualityconcernsaffectlong-termrecovery.”ThehardwoodforestreferencesitesinsouthwesternVirginiahadnotrecovered.Itwasfoundthatchangespersisted,evenonlandsthathadbeenreclaimedforover35years.Thisstudy’sresultsshowedthatplantingwithaggressivenon-nativegroundcover species to minimize short-term erosion in highlydisturbedsitesmayhaveslowedlong-termrecoveryonthesitesstudied.70 This is particularly relevant because what reclamation thereisinKalimantanisoftendoneonthequickandonthecheap,withinadequatesoilreplacementandplantingofaggressivenon-nativegroundcoverspeciessuchasacacia,
East Kalimantan: Environmental Devastation from Coal Mining
East Kalimantan is Indonesia’s most significantcoalexportregion.Over200milliontonnesofcoalwasshippedoutin2011.Ifitwasacountry,itwouldbetheeighthbiggestcoalproducerintheworld.
Landerosionfromdeforestationandmininghasdramaticallyincreasedtheriskoffloodingintheregion.From2010to2012,thecityofSamarindahasrecordedatotalof218floodsandhasnowacquiredthereputationof“KotaBanjir”,orfloodcity.
Thecoalminingboominthepast15years has also caused widespread water pollutionintheMakahamriver,whichflowsthroughrainforestsandishometo147indigenousfreshwaterfishspecies.
CoalMininginSouthKalimantan
©gr
eenp
eace
/Lau
ry M
ylly
virta
Coal Mines Polluting South Kalimantan’s Water
30 | Greenpeace Southeast Asia – Indonesia
rather than with any attempt to replant the speciescommontotheoriginalforest.
AstudyforaPhDthesisbyD.SetiawanfromtheBogorInsituteofAgricultureinIndonesia71
conductedonthePT.Adaroconcessionatfourdifferentlocations,reportedthatreclamationwasineffectiveintermsofastrikinglossofmacrofaunabiodiversity(includingadearthorabsenceofworms,whichplayanimportantroleinsoilfertility).SetiawanexaminedtheeffectivenessofreclamationwithSengon(Paraserianthesfalcataria)andAcacia(Acaciamangium),whicharetypicalplantsmostcommonlyusedforreclamationofminingsitesinKalimantan.Setiawan’sanalysisexaminedthelacksuccessoflandrehabilitation.Thestudyalsoexaminedsoilcharacteristicssuchasbulkdensity,aggregatestability,porosity,pH,andorganiccarbon.Setiawanfoundthatalthoughseveral indicators showed that reclamation hadimprovedthestabilityofsoilaggregates,72 nosignificantimprovementscouldbenotedintheabilityofthesoiltoretainwaterforplantsorinotherkeyindicatorsduringtheperiodofobservation.
Another study conducted in 2012 73on reclamationlandownedbyPT.ArutminBatulicininSouthKalimantan(wheretypicalAcaciaandSengonplantationswerechosenduetotheirfastgrowingnature),observedlossofbiodiversitybycomparingtheseplantations
withthesurroundingunharmedforestwithvegetationsuchasEusidexylonzwageri/thefamouskayuUlin,Shorealepidota(damarputih),whichisprotectedbyAgricultureMinistryDecreeNo.54/Kpts/Um/II/1972.74
In2013,theSouthKalimantanEnvironmentProtectionAgencyreleasedastatementacknowledgingthatsurfaceminingwouldleavedamagedlandthatmightnotfullyrecover.Itfoundthatevenwhenprevioustopsoilhadbeenpiledandsetasidetobereusedforfinalcoveringofabandonedminingpitsduringlandreclamation,thelandwouldbedifferentfromtheoriginalstate.Thepiledtopsoilthatwasreservedtogobackasthefinallayeroftopsoilwasalreadymixed,clearlydifferentfromitsoriginalstate,andhadsufferedstructuredamage,withlowerbulkdensity,worsepermeability,andworseaeration.75
Reclamationofpostmininglandwithinadequatesoilreplacementandacaciaplantationscannotbecalledreclamation,andisnotrestoringtheoriginalbiodiversityofKalimantan.Postmininglandcharacteristicallylosesitsrichtopsoil,limitingre-vegetation.Today many local communities in Kalimantan havebeenleftwith–atworst–amoonscapeofbaredrylandwithpondsofacidwasteor–atbest–homogenousplantationforestwithnoeconomic,biodiversity,orhistoricalvalue.
©gr
eenp
eace
TanahLautRegency,coalminespollutingSouthKalimantan’swater.

Greenpeace Southeast Asia - Indonesia | 31
Coal Mines Polluting South Kalimantan’s Water
©gr
eenp
eace
/rich
i rai
mba
Anacidpondfromcoalminingactivities

Coal Mines Polluting South Kalimantan’s Water
32 | Greenpeace Southeast Asia – Indonesia
Purpose and Scope
ThepurposeofthisreportistoexploreandexplainthereleaseofhazardousmaterialsintotheenvironmentduetosomespecificcoalminingactivitiesandtorevealhowtheIndonesiangovernmenthasfailedtoprotectthepublic’srighttocleanwater.Greenpeace’ssamplingofminedischargeaimedtoprovideasnapshotofthesituationandtocomplementextensivedeskresearchandpriorinvestigationsintotheoverallsituationofcoalmininginSouthKalimantan.ItisnotasurveyofeverydischargepointinallcoalminingactivitiesinSouthKalimantannorasurveyofallcoalminingcompanies in the area
After,extensivedesktopresearch,analysisofGoogleEarthandsatellitemaps,andapreliminaryroundofscoutinginthefield,GreenpeaceteamsreturnedtothefieldandcollectedwatersamplesfromcoalconcessionsinSouthKalimantan.
Sampling Results
29samplesofwastewaterorsurfacewater were collected and were sent to the GreenpeaceResearchLaboratoriesinExeter,UK,intwoseparatebatches,inJulyandAugust2014.Allsampleswerecollectedfromlocationsassociatedwithcoalminingactivities,withthefirstsetcollectedbetween19th-23rdJuly2014,and the second set collected between 11th-14th August2014.
Allsampleswerecollectedinpre-cleanedglass,screw-cappedbottlesandkeptcoldanddarkbeforeshipmenttoourlaboratoryintheUKforanalysis.Sampleswereanalysedquantitatively
6GREENPEACE INVESTIGATION
formetals.ThepHofeachwastewaterwasmeasuredbothinthefieldusinganumberofcalibratedhand-helddevicesforcross-checkingandalsouponreceiptofthesamplesatthelaboratory.(See Appendix for the full report: Greenpeace Research Laboratories Analytical Report 04 – 2014)
Allsampleswereanalysedquantitativelyforthepresenceofarangeofmetals.Concentrationsofmetalsinbothwholeandfilteredwaterweredeterminedinordertodistinguishbetweenmetals associated with suspended matter and thosepresentindissolvedforminthewater.
Forthemajorityofsamples,themetalconcentrationsinthefilteredsamplewereverysimilartothoseinthewhole(unfiltered)sample,indicatingthatthesemetalswerepresentinthese samples almost exclusively in dissolved formsratherthanboundtosuspendedparticleswithinthewater.
WastewatersgeneratedbycoalminingactivitiesaresubjecttoregulationinIndonesiawhichsetsmaximumpermissiblelimitsforcertainparameters,includingiron(7milligramsperlitreormg/l=7000μg/l),manganese(4mg/l=4000μg/l)andpH(between6-9).76
18ofthecases(see Table6.2)weresampledfromwastewaterbeingdischargedatthemomentofinvestigation,orfromwateroutsideman-madepitsandpools,whichconstitutesadirectviolationofIndonesianregulation.Inothercases,aviolationiscommittedifthewaterisdischargedwithoutsubstantialtreatment.
For22ofthe29samples(76%),allofwhichwerewastewatersamples,thepHwasbelow6.Inthe

Greenpeace Southeast Asia - Indonesia | 33
Coal Mines Polluting South Kalimantan’s Water
caseofthese22samples,pHvaluesrangedfrompH4.66(IDN14007)topH2.32(IDN14029),with7sampleshavingapHbelow3.
Theconcentrationsofmanganeseexceededthepermissiblelimitforwastewaterdischargesin17ofthe27wastewatersamples(63%),inboththefilteredandwholesampleinallcases,withconcentrationsinthewholesamplerangingfrom5350μg/l(5.35mg/l)to40200μg/l(40.2mg/l).Thehighestconcentration,insampleIDN14029,exceededthelimitby10times.Forallbutone(IDN14001)ofthese17samples,thepHwasalsooutsidetheallowedrange(pH6-9),andthehighestmanganese
Parameter
pH
TSS (Suspended Solids)
Iron (Fe) total
Mn total
Chromium
Nickel
Zinc
Copper
6-9
400 mg/l
7 mg/l
4 mg/l
None
None
None
None
6-9
50 mg/l
2 mg/l
--
0.1 mg/l
0.5 mg/l
0.5 mg/l
0.3 mg/l
IndonesianStandard
World BankGroup
Guidelines
(Indonesian standards are much weaker than those recommended by the USA78 or the World Bank Group guidelines).79
*World Bank safeguards are stronger than Indonesian regulation and practice.
Wastewaters from many of the locations sampled in this study did not comply with these regulations at the time of sampling, due to elevated concentrations of manganese and iron, and/or due to high acidity (pH below 6).
Table. 6.1. Wastewater Quality Limit for Coal Mining Activities77
SampleCode
IDN14001
IDN14002
IDN14003
IDN14004
IDN14005
IDN14006
IDN14007
IDN14008
IDN14009
IDN14010
IDN14011
IDN14012
IDN14013
IDN14014
IDN14015
Wastewater
Wastewater
Wastewater
Wastewater
Wastewater
Wastewater
Wastewater
Creek water
Wastewater
Wastewater
Wastewater
Wastewater
Wastewater
Wastewater
Wastewater
Yes
No
Yes
Yes
Yes
Yes
No
N/A
Yes
Yes
Yes
No
Yes
Yes
No
Yes
Yes
Yes
Yes
No
Yes
No
No
No
No
No
Yes
Yes
Yes
Yes – highest level of Iron, 40
times above standards
Discharge/ flows out
Not a Discharge. Abandoned pit, water is few centimeters from overflowing
Discharge/flows out
Discharge/flows out
Discharge/flows out
Discharge/flows out
Not a discharge. Set of ponds located uphill, already breaking in the edge/Prone to landslide
N/A
Discharge/flows out
Discharge/flows out
Discharge/flows out
Not a Discharge. The pond is already breaking in the edge. The pond is a few centimeter from overflowing to the road use also by the community.
Discharge/flows out
Discharge/flows out
Not a Discharge. The pond is already breaking in the edge. The pond is a few centimeter from overflowing to the road use by the community.
SampleType
FlowsOut?
Results Abovethe limit set
for discharge by the MoE?
Field Observation
IDN14016
IDN14017
IDN14018
IDN14019
IDN14020
IDN14021
IDN14022
IDN14023
IDN14024
IDN14025
IDN14026
IDN14027
IDN14028
IDN14029
Wastewater
Wastewater
Wastewater
Wastewater
Pond water
Wastewater
Wastewater
Wastewater
Wastewater
Wastewater
Wastewater
Wastewater
Wastewater
Wastewater
Yes
No
Yes
Yes
N/A
No
Yes
Yes
No
Yes
No
No
Yes
Yes
Yes
Yes
Yes
Yes
No
Yes
Yes
Yes
Yes
Yes
Yes
Yes
Yes
Yes – highest level of Mn found, ten
times above standards
Discharge/flows out
Not a Discharge. Ponds are uphill, ± 112 m from a valley of swamp
Discharge/flows out
Discharge/flows out
N/A
Not a Discharge.
Discharge/flows out
Discharge/flows out
Not a discharge. Abandoned Pit.
Discharge/flows out
Not a discharge. Abandoned Pit.
Not a discharge. Abandoned Pit.
Discharge/flows out
Discharge/flows out
Table 6.2. Summary of Findings and Field Observations

Coal Mines Polluting South Kalimantan’s Water
34 | Greenpeace Southeast Asia – Indonesia
concentration(40.2mg/l)wasfoundinsampleIDN14029,whichhadthelowestpH(2.32).
Ofthese17samples,7alsohadconcentrationsofironthatexceededthemaximumpermissiblelevel,withsimilarlevelsinboththefilteredandwholesampleinallcases.Concentrationsoftotalironinwholesampleswereintherange9740μg/l(9.74mg/l)to280000μg/l(280mg/l),withthehighestconcentrationexceedingthelimitby40times.ThehighestironconcentrationwasalsofoundinasamplewithoneofthelowestpHvalues(IDN14015,pH2.34).Thesefindingsareconsistentwiththehighacidityofmanysamplessolubilisingironandmanganesefrommineralsinthelocalenvironment.
Threesamples(IDN14015,IDN14017andIDN14029)hadnotablyhigherconcentrationsofaluminium(94700-184000μg/l,or94.7-184mg/l),nickel(1360-1690μg/l),zinc(3210-3880μg/l)andcopper(100-1890μg/l)comparedtootherwastewaters.Twoofthesesamples(IDN14015&IDN14029)hadthelowestpHofallwastewatersamplesandalsocontainedthehighestconcentrationofeitheriron(IDN14015)ormanganese(IDN14029).Toalesserextent,concentrationsofchromium,cobalt,mercuryandvanadiumwereelevatedinsomewastewatersamples,particularlyforIDN14015andIDN14017.Theseadditionalmetals may also be present in the samples at elevatedconcentrationsasaresultofhavingbeensolubilisedfrommineralsinthelocalenvironment.
Overall,thedataindicateastronglinkbetweenhighacidity(lowpH)inwastewaters(particularlyforthosebelowpH4)andelevatedconcentrationsofmetals(especiallyiron,manganeseandaluminium),predominantlyinsolubleforms(see Figure1).Thedataalsoindicatethatthereiscommonlyalinkbetweenhighconcentrationsofironand/ormanganeseinwastewatersandhigherconcentrationsofothermetals.
TherelevantregulationsetsparametersonlyforpH,twometals(ironandmanganese),andtotaldissolvedsolids.Nevertheless,thedataand
correlationsapparentfromthecurrentstudysuggestthatwastewatersfromothersimilarlocations which have been reported by others alsotoexhibitlowpHmayalsohavehighconcentrationsofmetals,particularlyironandmanganese,andalsothathighconcentrationsofironandmanganeseinwastewatersmayalsoindicatehighconcentrationsofothermetals.
300000
250000
200000
150000
100000
50000
00 1 2 3 4 5 6 7 8 9
Iron (Fe)
pH
Concentration(ug/l)
200000
180000
160000
140000
120000
100000
80000
60000
40000
20000
0
0 1 2 3 4 5 6 7 8 9
Aluminium (Al)
pH
Concentration(ug/l)
45000
40000
35000
30000
25000
20000
15000
10000
5000
0
0 1 2 3 4 5 6 7 8 9
Manganese (Mn)
pH
Concentration(ug/l)
Figure 6.1. Relationships between pH and the dissolved concentrations of
three metals in samples of water and wastewater collected in the vicinity of coal mining operations in Indonesia
Source: Greenpeace Research Laboratories (University of Exeter, UK)

Greenpeace Southeast Asia - Indonesia | 35
Coal Mines Polluting South Kalimantan’s Water
What does the Sampling Mean? Breaking It Down
ThelowpHin22ofGreenpeace’ssamples(pH4.66to2.32)meansthatthewaterwetestedcouldharmorkillfish,insects,otherlivingbeings,andevenplants–aswellasharmpeoplecomingintodirectcontactwithit.Ifthiswaterand/orsimilarwaterfromholdingpondsandnearbywaterpuddlesweretoleachoroverflowortrickleintoriversandlakesdownstream,itcouldharmfloraandfaunatheretoo(somesamplesweretakenfromwaterswhichwereleaching/overflowingatthetime).
AsexplainedintheAcidMineDrainagesection,whenwaterpHdropsto5or4,fishreproductionisaffected,mostfisheggscannothatchatpH5orbelow,andadultfishoftendieatlevelsof4to3orbelow.OtherlivingorganismsbesidesfishwouldalsobeaffectedbystreamscontaminatedfromrunoffofpondswithsuchlowpH,aswouldplants.
Whentestingformetals,Greenpeacefoundveryhighlevelsofironandmanganeseinmanyofthewatersamples,andinsomealsohighlevelsoftoxicheavymetalsincludingnickel,zinc,and
copper.ThelevelsofironandmanganesethatGreenpeacefoundinthewaterwasoftenfarabovethelegallimitsetbythegovernmentforcoalwaterdischarge-withonecase40timesabovethelegallimit.TherearelegallimitsfordischargefromcoalminesinIndonesia,andifthewaterisabovethoselimits,andisbeingdischargedorhadbeendischargedwithouttreatmentintotheenvironmentand/orintorivers,thisisaviolationofthelaw.
Inaddition,noneofthepondscontaininghighlyacidicwaterorhighmetalconcentrationswhereGreenpeace collected its samples were lined orappeareddesignedtopreventseepageintoneighbouringwaterbodies.Madeofearth,theyarevulnerabletoseepageaswellasoverflowintherainyseason.Somewereleakingwhenthesampleswerecollected.
Poor and Non-Existent Signage May Indicate Inadequate Monitoring
Duringtheirinvestigations,Greenpeacestaffsawveryfewsignsanywhere,forwarningormonitoring.Evenworse,therewerenosignsat
Afadingsign“Penaatan”/”Compliance”markingawastewatersettlingpondofacoalminein
TapinDistrict,SouthKalimantan.Coalmininghasleftacidpondsthatarepronetolandslide,overflows,andmanywithoutpropersignage.©
gree
npea
ce/E
rik W
iraw
an

Coal Mines Polluting South Kalimantan’s Water
36 | Greenpeace Southeast Asia – Indonesia
allatsitesthatwesubsequentlyfoundtohavetheworstsamplingresults–lowestpHandhighestheavymetalcontamination.
Greenpeaceinvestigatorsidentifiedtwodistinctkindsofsettlingponds–asmallnumberofofficialsettlingpondswithsignage,whicharetreatedandmonitored,andamoonscapeofabandonedminepitswithfewornosignsandnoevidenceofbeingtreatedormonitored.
ThelackofsignagemayindicatethatthereislackofmonitoringandsurveillancearoundtheissuanceofWastewaterDischargeLicenses(Ijinpembuanganlimbah).Inordertoproperlymonitorwastewater,andtoadequatelytrackchangeovertime,governmentcomplianceofficersmustusespecificcompliancepoints.The2003MinistryofEnvironmentDecreeNo.113onWastewaterQualityLimitsforCoalMiningActivities,Article1.7statesthat:“APointofComplianceisoneormorelocationthatisthereferenceformonitoringcomplianceoverwastewaterlimit.”Accordingtoarticles8,9and11,theRegentorMayormustissuelicensesforwastewaterdischarge,whichspecifythe
locationoftheCompliancePoints.Iftherearechangesinbusinesslocationoractivity,thecompanymustreporttogetapprovalofnewCompliancePoints.GreenpeacesawpoorevidenceofCompliancePoints,giventhelackofappropriatesignage.
Greenpeacechallengesthegovernmenttoprovetransparentlywhatroutinemonitoringhasbeendone,bothbycompaniesandbythegovernment,bypublishingdates,locations,andfindingsofitsmonitoringonlineforthepublic.Moreover,asmanyruralcommunitiesinSouthKalimantandonothaveinternetaccess,itisalsocrucialformonitoringresultstobepublished in local newspapers and posted on villagenoticeboards.
Sour
ce :
Digi
talG
lobe
, 201
2-12
-01
up to
201
4-03
-18,
reso
lutio
n sp
ectra
l 60
x 60
Coalminingandwastewaterponds,TanahLaut,SouthKalimantan.

Greenpeace Southeast Asia - Indonesia | 37
Coal Mines Polluting South Kalimantan’s Water
Three In-Depth Case Studies: The Fuller Picture of What We Found
a) Top toxic trouble – Arutmin
The Arutmin concession in Asam Asam district wastheworstofallthesitesthatGreenpeacesampled,withitsscarredbarrenlandscape,deadtrees,luridcolouredtoxicponds,andabandonedpits.
Onesample(IDN14029)takenfromtheArutminconcessionhadthelowestpHofalloursamples:pH2.32Asacomparison,theregulationoncoalwastewaterqualitylimits(MoE,No.113,2003)specifiesthatthepHshouldbebetween6and9.Thesamplealsorecordedthehighestmanganeseconcentration:10timesthelegallimitforpermissibledischargesfromcoalmines.TheGreenpeaceinvestigationteamdocumentedclearevidencethatthedirty,contaminatedsettlingpondswereflowingintothebroaderwatersystem.InthissampleareaGreenpeacefieldinvestigatorswereabletoclearlyidentifytracksleftfrom
wateroverflowingfromaholdingpond.Waterwasoverflowingatthetimeinsomeplaces.Moreover,inotherplacestherewasevidenceofpreviousoverflowevents:additionaldrytracesofpreviouslyoverflowingwaterwereunmistakable,althoughatthetimeofsamplingitwasthemiddleofthedryseason.Itwasclearthatonepondhadrecentlyoverflowedintoapuddle,andwas1-2cmbelowthepointofoverflowingagain.Thedirty,contaminatedsettlingpondswereobservedatthetimeofsamplingtobeflowingintothebroaderwatersystem.
Moreover,theponds,overflowpuddleandthecoursetakenbythecontaminatedwaterwerealllessthan20metresfromapublicroadthatwasfrequentlyusedbylocalvillagers.Inthesameconcession,butatadifferentlocationfromwhereGreenpeacewasabletosample,ourfieldinvestigatorsdocumentedaleakintoacreekthatflowsintoariver.Thereisarisk,therefore,thatcontaminatedwaterfromthisArutminconcessionmaybeaffectingtheresidentsofneighbouringSalamanvillage.
Coal Mines Polluting South Kalimantan’s Water
38 | Greenpeace Southeast Asia – Indonesia
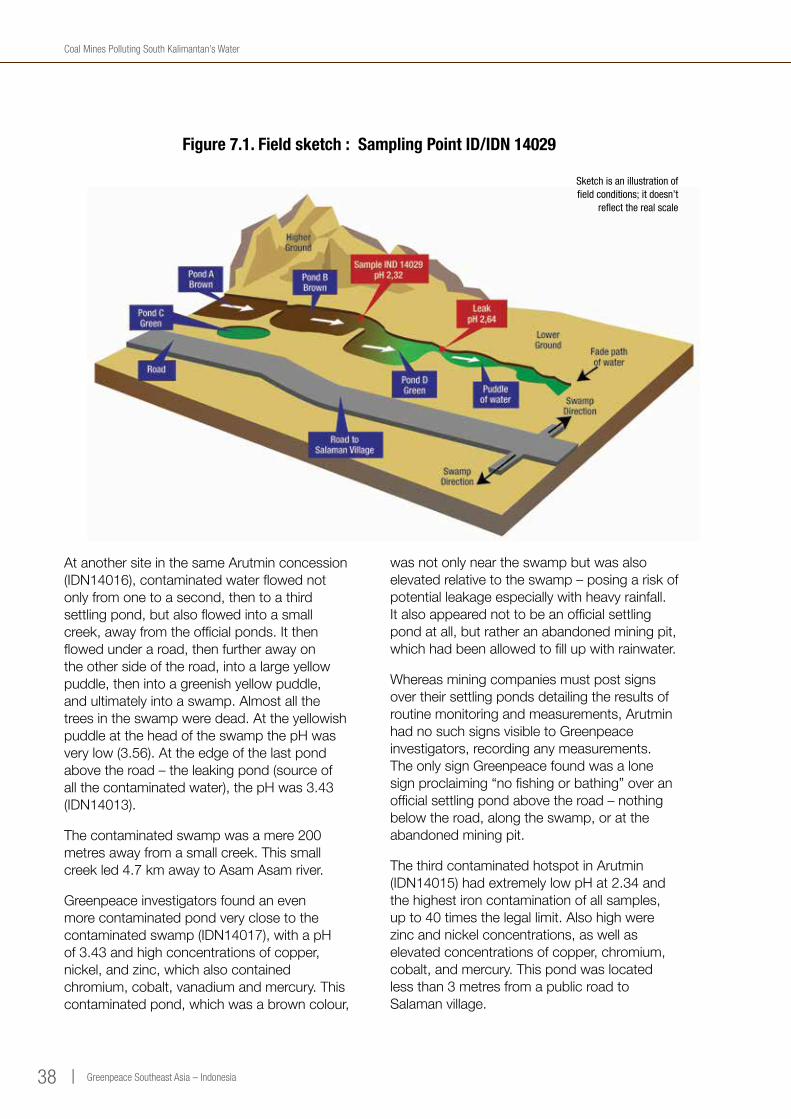
At another site in the same Arutmin concession (IDN14016),contaminatedwaterflowednotonlyfromonetoasecond,thentoathirdsettlingpond,butalsoflowedintoasmallcreek,awayfromtheofficialponds.Itthenflowedunderaroad,thenfurtherawayontheothersideoftheroad,intoalargeyellowpuddle,thenintoagreenishyellowpuddle,andultimatelyintoaswamp.Almostallthetreesintheswampweredead.AttheyellowishpuddleattheheadoftheswampthepHwasverylow(3.56).Attheedgeofthelastpondabovetheroad–theleakingpond(sourceofallthecontaminatedwater),thepHwas3.43(IDN14013).
The contaminated swamp was a mere 200 metresawayfromasmallcreek.Thissmallcreekled4.7kmawaytoAsamAsamriver.
Greenpeaceinvestigatorsfoundanevenmore contaminated pond very close to the contaminatedswamp(IDN14017),withapHof3.43andhighconcentrationsofcopper,nickel,andzinc,whichalsocontainedchromium,cobalt,vanadiumandmercury.Thiscontaminatedpond,whichwasabrowncolour,
was not only near the swamp but was also elevatedrelativetotheswamp–posingariskofpotentialleakageespeciallywithheavyrainfall.Italsoappearednottobeanofficialsettlingpondatall,butratheranabandonedminingpit,whichhadbeenallowedtofillupwithrainwater.
Whereasminingcompaniesmustpostsignsovertheirsettlingpondsdetailingtheresultsofroutinemonitoringandmeasurements,ArutminhadnosuchsignsvisibletoGreenpeaceinvestigators,recordinganymeasurements.TheonlysignGreenpeacefoundwasalonesignproclaiming“nofishingorbathing”overanofficialsettlingpondabovetheroad–nothingbelowtheroad,alongtheswamp,orattheabandonedminingpit.
The third contaminated hotspot in Arutmin (IDN14015)hadextremelylowpHat2.34andthehighestironcontaminationofallsamples,upto40timesthelegallimit.Alsohighwerezincandnickelconcentrations,aswellaselevatedconcentrationsofcopper,chromium,cobalt,andmercury.Thispondwaslocatedlessthan3metresfromapublicroadtoSalamanvillage.
Figure 7.1. Field sketch : Sampling Point ID/IDN 14029
Sketch is an illustration of field conditions; it doesn’t
reflect the real scale

Greenpeace Southeast Asia - Indonesia | 39
Coal Mines Polluting South Kalimantan’s Water
Drinkingwatershouldnotexceed0.3mgofironperlitre(mg/l)accordingtotheIndonesianauthorities.80 Theotherheavymetalsfoundinhighconcentrationsinthisthirdcontaminatedhotspot–zinc,nickel,copper,chromium,cobaltandvanadium–mayalsobeofconcerninrelationtohumanhealthiftheycontaminatedrinkingwater.
b) Banpu – Enviromental threat
BanpuanditsfullyownedsubsidiaryJorongBarutama Greston have a concession that Greenpeacealsoinvestigated.
TheGreenpeaceinvestigationrevealedthattheminehasamassiveacidminedrainageproblem.Wefoundalargeabandonedminepit200mx2km(visibleinaGreenpeacedronevideo)withacidityandmanganeselevelswellabovedischargestandards(IDN14026).Yettherewasanuncontrolledandunregulateddischargeofacidwaterrightnexttothelargepit(IDN14025).Moreover,smallerpondstestedbyGreenpeaceallaroundthelargepitwereallrevealedtobeacidic,withpHrangingfrom3.15to4.66.
Eveniftheyareweakerthaninmanyothercountries,Indonesiahaslegallimitsondischargesofpollutedwaterfromcoalmines.Theseregulationsrequirethatwastewaterfromminingisdischargedthroughregulateddischargepointsand,inmostcases,thewatermustbetreatedinsettlingpondsbeforedischarge.Yettheteamwitnessedseveralcaseswherecontaminatedwaterwasbeingdischargedoutsideofthemineareapastsettlingpondsandthemonitoringpoints.TheBanpu-JBGcasewasamongtheworstofthesecases.Waterinthelarge200mx2kmpitthatGreenpeacetestedhadapHof3.74atthetimeofsampling,andtheleakedorspilledwateroutsidetheminehadapHof4.48.Moreover,concentrationsofmanganeseclearlyexceededregulatorylevels.
In 2010 the entire concession was closed by the authorities due to permit violation in a protectedforestarea.Lateronthematterwasresolved.81 Theconcessionreceiveda“red”ranking(meaning:itfailed)inthegovernmentenvironmentalrankingsystemcalled“PROPER”from2009and2010.82 DetailsofBanpu’scompliancewerenotmadepublic.Withinthe
Figure 7.2. Field sketch : Sampling Point ID/IDN 14013, 14016, 14017
Sketch is an illustrationof field conditions;
it doesn’t reflect the real scale
Real distances of ID 14013 - 14016 = ± 600 m;
ID 14016 - ID 14017 = ±112 m; ID 14017 - ID 14013 = ± 558 m

Coal Mines Polluting South Kalimantan’s Water
40 | Greenpeace Southeast Asia – Indonesia
PROPERsystem,rankingsareissuedbytheMinistryoftheEnvironment.Aredrankingmeansthatthecompanyhasbrokenthelawandfailedtoprotecttheenvironment.PROPER,whichhasbeenlongcriticisedbyNGOsforleniency,weakness,lackoftransparency,andenablingcorporategreenwashing,isnotconsideredwidelytohavestringentcriteria.YetevenPROPERhasfoundthisconcessiontobefailing,inthepast.
Greenpeace was physically prevented by securityforcesfromtestingfurtherpondsandpotentiallycontaminatedcreeksandriversallaroundthegiant2km-longpit,includingbyoneindividualwearinganarmyuniform.
Nonetheless,Greenpeaceaerialfootagefromadroneindicatesthatmanyrivuletsandcreekscould well be contaminated by the many apparentlytoxicpondsintheBanpu-Jorongconcession.Thesefindingsappeartobecorroboratedbyananalysisofsatelliteimagery.
NGOsandlocalparliamentariansrepresentingtheareaaroundtheJorongconcessionhaverepeatedlycomplainedaboutthelackof
adequatereclamation.83A local NGO in South Kalimantan,MERAHPUTIH,alsoquestionedJorong’sreclamation,sinceitonlyplantedacaciatrees.(Acaciatreesareknownforbeingespeciallyabletowithstandlowqualitylandwithpoornutrients,drought,andarethoughttoberesilienttopollution).GreenpeacejoinsthecallforJorongtofulfilitslegalresponsibilitiesandtoimplementeffectivelarge-scalereclamationasamatterofurgency.
c) Tanjung Alam Jaya – contaminating a nearby farm
OurthirdcasestudyconcernsTanjungAlamJaya,whichwasacquiredbystateownedtinminingcompanyPTTimah’ssubsidiaryPTTimahInvestasiMineralin2003.84 When GreenpeacesentinvestigatorstosampleintheTanjungAlamJayaconcession,samplingsitesrevealednumerousproblems.Atonesite,thewestsideofanabandonedpithadapipeleadingtoacreek.Testingupstreamanddownstreamofthepipeinthecreek,GreenpeacefoundthatthepHbeforethepipewas7.45,whichisconsideredneutralornatural,whereasthepHdownstreamwas3.74
Figure 7.3. Field sketch : Sampling Point ID/IDN 14004
Sketch is an illustration of field conditions; it doesn’t
reflect the real scale

Greenpeace Southeast Asia - Indonesia | 41
Coal Mines Polluting South Kalimantan’s Water
(IDN14004),whichishighlyacidicandtoxictomanyfishorotheraquaticspecies.
Thecontaminatedacidicwaterflowedthroughthecreekdowntoapond.Twoadditionalpipesledtothatpondaswell.Theiroriginpointwasunknown.Thatpondwasveryclosetoapublicroad.
Worseyet,alongtherightsideofthecreekwasasmallplantationwherealocalfarmergrewcassava,banana,andothercrops.His“pondok”(aplantationhut)waslessthan20metresfromthecreek,whichheusedforbathinganddrinking.Withouttherightequipment,itwasnotpossibleforGreenpeacetoconducttestsonhiscrops,butthepotentialforcontaminationofsoilsandcropsintheareaisclear.
Belowtheabandonedpitonthesouthside,aleakappearedtobeleadingtoaswamp,whichappeared,inturn,tobeconnectedtothelocalwatersystem.ThelocationatwhichGreenpeacetestedthecreekwasapproximately500metresfromtheMangkaokriver,atributaryoftheMartapurariver.
Greenpeaceisnotaloneinnotingproblematicissuesinthisconcession.In2010,Tanjung
AlamJayawassanctionedbyIndonesia’sMinisterofEnvironment–forpollutingwater.In2010,asettlingpondintheTanjungAlamJayaconcessionleakedintoRiamKiwaRiver,Banjarregency.Thiscreatedhighturbidity,withhighlevelsofsuspendedsolidsthatsurpassedthepollutantdischargelimitforcoalminesof400mg/l).“Itwasreportedthatturbiditylevels…[were]threateningthedeathoffishintheriverandalsocausinghumanhealthproblemsduetothewaterbeingusedforbathinganddailyconsumption.”85 Due to this scandal,TanjungAlamJayawassubjectedtoadministrativesanctionsfromtheEnvironmentalMinistry,alongside4othercompaniesinSouthKalimantan.Theyweregiven6monthstocleanupandfixtheirenvironmentalmanagementsystems.GreenpeacenowquestionstowhatextentTanjungAlamJayahastrulycleanedupandimproveditsperformance.
TheIndonesianCoalMiningAssociationreportedthatTanjungAlamJayawillbeshutdownin2014,86raisingthequestionofreclamation.Ifoperationsaretrulyslatedtoendin2014,whyhasreclamationstillnotbeenrolledoutcomprehensivelythroughouttheentireconcession?
Sour
ce :
Digi
talG
lobe
, 201
2-12
-01
up to
201
4-03
-18,
reso
lutio
n sp
ectra
l 60
x 60
Coalminingandwastewaterponds,TanahLaut,SouthKalimantan.
Coal Mines Polluting South Kalimantan’s Water
42 | Greenpeace Southeast Asia – Indonesia
GreenpeaceisnotaloneinfindingsubstantialcontaminationofwaterbycoalcompaniesinIndonesia.Governmentagenciesconfirmedseriousdegradationofwaterqualityaroundnumerous coal mines across Indonesia; andacknowledgedthatcoalminingplaysasignificantrole.ThissectionoutlinesgovernmentstudiesofhowcoalispollutingwaterwaysinSouthKalimantan,aswellasinseveralotherregionstoindicatetheseverityandscopeofthisproblemnationwide.
a) Government Acknowledgment in South Kalimantan
Greenpeace’sanalyses,layingoutdataaboutpollutionthatindictsthecoalcompanies,affirmsthefindingsofthelocalEnvironmentProtectionAgency(BadanLingkunganHidupDaerahorBLDH)forSouthKalimantanProvince.
Key conclusions of the ‘Annual Report: Regional Environment Status South Kalimantan Province 2013’ 87
• Thetestingresultsfromseveralgovernmentsamplingstationsshowsacidity(lowpH),highTotalSolidSolution(TSS),highManganese(Mn)andhighIron(Fe).Onesampleevenreaches1,000%theallowedlimitforIron(accordingtoGovernor’sdecreeNo.05from2007).Theseindicatorsshowshazardsthatareposedtoaquaticlife;andshowlowerwaterqualityduetointenselanderosion,responsibilityforwhichthegovernmentspecificallyattributestotheminingsector,namingcoalminingastheculprit.
• Opencastcoalminingcreatesextremechangesinlandscape.Coalminingcreatesgapingpitsthatcanneverbefullyreclaimedorcovered.Therichtopsoil,evenifpreservedonthesideforlaterreclamation,undergoesmixturethateventuallyleadstoearthwithstructuredamage,lowerbulkdensity(Bobotisi/BI),smallerporosity,worsepermeabilityandaeration,andwhichisunfertile.Coalminingpotentiallychangesthelandscape,createserosion,andaltersnaturalwaterways.
• Furtherpotentiallanddamageincoalminingareasisthedestructionofnaturaldrainageinwaterbodiesduetolandscapechanges,erosion,andlandslides.Ingeneral,miningactivity can create water pollution and leave behindunproductivelandthatcannolongerbeusedforfarming.
In addition, the South Kalimantan government EPA report listed a number of key findings regarding the Barito river and coal:
• TheBaritoriverisimpactedbythemassivevolumeofcoaltransportontheriver,amountingtoapproximately65milliontons(±63,170,000metrictonnes).
• Thetransporttakesplaceusingbargeswithacapacityofaround5,000tons(±4,500metrictonnes),implying13,000loadedbargesandthesameamountof[returning]emptybargesperyear.
• Thebargesandtugboatspullingthemcausecoaldustpollution,spreadcoalintotheriver(withspillsandscatteringofbitsofcoalfromcoalbargesandtugboats),andcauseturbulence.
7 GOVERNMENT AGENCIES ACKNOWLEDGE DEGRADATION OFWATERQUALITY

Greenpeace Southeast Asia - Indonesia | 43
Coal Mines Polluting South Kalimantan’s Water
• Thephysicalconditionoftheriversidehasdegradeddramatically.Itisimpactedbythehighfrequencyofcoaltransportbybargesonalargescale.Heavytrafficfromvariousactivities,includingcoaltransportation,hascausedlandslides.
• DamagetoanddestructionofthemanymangroveforestscanbeseenontheriverbankinLautKualaLupak,TabunganenDistrict.
• 252,677peoplelivealongtheriverside.
• Governmentwaterqualitymeasurement:1. pH:lowpHwasduetotheconditionof
thecatchmentareaoftheBaritowatershedthatreceiveswastewaterfromtheminingsector.LowpHmaydeterminetheoverallwaterqualityespeciallysincewateracidityincreasesthedissolutionofmetalsintothewater.LowpHthreatenstheaquaticecosystemasonlycertainfishcanwithstandhigheracidity.
2. TSS:ThehighestTSSreached117mg/linAugust2013,surpassingtheallowedlimitof50mg/linaccordancewiththeGovernor’sdecreeNo.05Year2007onriverwaterquality.TSSrisesduetomudandfinesandthataremostlycausedbylanderosion,thatimpactsthewaterbody.ThemanymeasurementsofTSSsurpassinglimitsintheBaritoriverareduetoinputsfromriverswherecoalminingpersists.
3. Thewatersheddestructionand destructionofcriticallandinKalimantan reaches3millionhectares.
4. Fe(Iron):Inalmosteverymonthoftesting,Fe measurement results surpassed the
allowed limit set by the Governor decree No.05,2007.TheGovernmentclaimedthat one measurement even reached 1000%abovethelimit.
5. Manganese(Mn):Thehighestmeasurementin2013was0.5697mg/lintheAlalakfloatingmarket,whichwasmorethan5timestheallowedlimit.
6. Theseindicatorshighlighthazardsthatareposedtoaquaticlife,andproblemsforthecommunitywatersupply,andthegovernmentspecificallypointstotheminingsector–especiallycoal–astheculprit.
The South Kalimantan government EPA report also listed a number of key findings regarding the Martapura river and coal:
• TheMartapurariverwithstandsthedumpingofwasteandnumerousactivitieslinkedtovariousriverineindustriesincludingplywood,glue,rubber,sandmining,andcoalmining(PT.Baramarta).Someofthemonitoringpointsreceiveaburdenofwastefromthecoalminingsector.
• TSS:Atmanytimesandmanystationpoints,themeasurementofTSSsurpassestheallowedlimitof50mg/l(Governor’sdecreeNo.05Year2007)onriverwaterqualitylimit,forexample494mg/linOctober2013.TSSrisesduetomudandfinesandthataremostlyattributedbythegovernmenttolanderosionthatwascarriedbythewaterbody.ThemanymeasurementofTSSsurpassinglimitintheMartapuraarefoundtobeduetoinputsfromriverswherecoalminingpersistsandthateventuallyflowintotheMartapura.Thegovernmentthushighlights

Coal Mines Polluting South Kalimantan’s Water
44 | Greenpeace Southeast Asia – Indonesia
coalminingasacontributortotheunusuallyandunacceptablyhighTSSinthisriver.WaterwithhighTSShaslowerclarityandlesssunlight,aningredientimportantforvegetationtoconductphotosynthesis,whichsupportstheentireaquaticecosystem.
• Fe(Iron):Allmeasurementstakenin2013,measured5timesat5controlstations,surpassedtheallowedlimitof0.3mg/linaccordancewiththeGovernor’sdecreeNo.05Year2007.FelevelsintheMartapurariverevenreached45timesthelimit,duetothepeatandminingsectorsupstream.
• Manganese(Mn):ThepresenceofManganeseintheMartapuramaybeduetotheminingsector.MeasurementsinAprilandMarchsurpassedthewaterqualitylimitbecauseoftherainyseason,whentheacidminedrainagecannotbemanaged,andenterstheMartapura.
• Thereportfocusesonaresidentialarea,6000haoffarmland,aswellastheaforementionedindustries.
b) Government Acknowledgment in Other Regions of IndonesiaVariousgovernmentdocumentationhasbeenobtainedbyGreenpeaceinvestigators,confirmingthattheofficialgovernmentacknowledgementsthatcoalisalsoasourceofwaterpollutioninotherregionsofIndonesia.Excerptsandsummariesofsomeofthesereportsareincludedbelow,inordertohighlightthepossiblescopeandseverityoftheproblemnationwide.Thesereportsalsounderscorethatgovernmentalacknowledgmentofcoal’sroleinwaterpollutionisnotanisolatedphenomenon,limitedtoonesinglereport,butratherrepeatedacknowledgmentsbydifferentagenciesatdifferenttimes.
The East Kalimantan Environmental Status Reports prepared by the provincial government88showthattheMahakamriverinEastKalimantanhasbeen“heavilypolluted”foraslongassampleshavebeentaken,since2003.Totalsuspendedsolids,BOD(biochemicaloxygendemand)andCOD(chemicaloxygendemand)havebeenhigh
throughout,buttowards2012therewasasignificantincreaseinCOD.Overallwaterqualitydegradedsignificantlyfrom2011to2012,andriverbottom(benthic)faunadownstreamofSamarindadiedentirely.TheEnvironmental Status report by the provincial governmentattributestheworseningofwaterpollutionandthedie-offtowaterpollutionfromsludgeorwastewaterdischargesintotheriver,andtowatertransport.Bothimpactsaredominatedbycoalmining,andtheincreaseinCODwithoutcorrespondingincreaseinBODwould be consistent with coal dust or other inorganicpollution,ratherthanorganicmatterfromlanderosion.Landerosionisalsoamajorfactorinthepollutionoftheriverandcoalminingisoneofthemaindrivers.
InMarch2013,theheadoftheparliamentoftheEastKutairegencyLegislativeCouncilheavilycriticizedKPCfordischargingcoalminingwastewaterintotheSangattariver.Thedischargeshavedestroyedandpollutedtheriverthat10,000peoplerelyonastheirsourceofwater.89
In2009,theSouthKalimantanenvironmentalauthorities told the local people downstream ofAdaro’sTutupancoalminenottoconsumethewaterintheBalanganriver,becauseofdischargesofpollutedwaterfromthesettlingpondofthemine.Theyorderedthecompanytodistributecleanwatertotheaffectedcommunities.90
AccordingtotheEastKalimantanEnvironmentalStatus Report 2012 by the East Kalimantan EnvironmentalAgency(BLHKaltim),floodingincreasedinSamarindafrom2009through2012.Samarindahasbecomeknownasthe“FloodCity”(“KotaBanjir”).Thereisalsoasayinghighlightinghowflood-pronethecityhasbecome:“ifitrainswithoutflooding,thenameofthecitycannotbeSamarinda”(“kalauhujantidakbanjir,itubukanSamarindanamanya”).Thegovernmentreportsaysthat(coal)miningcontributestofloodingbydestroyingthewaterretentioncapacitythroughlandclearance,andbycloggingthewaterwaysanddrainagesystemsthroughsedimentation.
AcademicstudiesofotherriversregardingtheimpactofcoalpollutiononIndonesia’s

Greenpeace Southeast Asia - Indonesia | 45
Coal Mines Polluting South Kalimantan’s Water
rivers,havefindingsquitesimilartogovernmentreports.Asurveyandanalysisofwaterqualitywascarried out in several rivers to assesstheeffectofcoalminesinthedistrictofSingingi,inKuantanSingingiRegency,RiauProvince.Thisisanareanationallyrenownedforitscoalminingactivity.TheresultsofwaterqualitycomparedwiththeGovernmentRegulationNo.82/2001andrefersto the Ministerial Decree No.115/2003onGuidanceofWaterQualityStatus,
layingoutawaterqualityindex,show“thatGeringgingriverandKeruhriverwereheavilypolluted.Whileothertributariesaremoderatelypolluted,thesetworiversshowhighlevelsofTSS,pH,BOD5,COD,anddissolvedoxygen(DO)comparedtostandards.CoalmininginKuantanSingingiRegencyisopencastmining,apracticethatremovesthesurfacelandorsoiltotapintocoalresources…,[which]eventuallycreatesacidminedrainage…Opencastminingremovestheupperlayeroflandtoanother place and creates hills and valley that aredeepenoughtocreatesmallcreeksinthesurroundingareas,whicheventuallycarrywastetothemainriver.”91
@Gr
eenp
eace
/erik
wira
wan
Coalmine,TanahLaut,SouthKalimantan

Coal Mines Polluting South Kalimantan’s Water
46 | Greenpeace Southeast Asia – Indonesia
Conclusion
Greenpeace’sinvestigationinSouthKalimantanhasfoundthatthecoalminingsectorposesaseriousandlong-termthreattotheprovince’swaterresources.
Hazardous Wastewater from Coal Mining
Sampleswerecollectedfrompondsassociatedwithminingactivitieswithinfivecoalconcessions.Incomparisontothenationalstandardforcoalwastewaterdischarge,resultsfromthe29samplesanalysedshowed:• 22sampleshadpHbelow6,withlowestpH 2.32.• 17samplesexceedManganeselimit; 7samplesexceedIronlimit,withthehighest concentrationupto40timesthelimit.
Theinvestigationuncoveredminedischargeabovestandardsinformof,seepageandleakagefromsettlingpondsandabandonedcoalminepits.Someofthestoragesiteswilllikelyfloodduringtherainyseason,releasinghighlytoxicminingwastewaterintotheenvironment.Satelliteimageanalysisalsorevealedthatsomeminesplacedtheirtailingpondsincloseproximitytowaterways,furtherincreasingtheriskofchronicseepageoftoxicsubstances,andriskoflargewastewaterspills.
ThecoalminingcompanyArutminwasfoundtohaveamongtheworstresults–allwastewatersamplesshowedlowpHandlevelsofmetalsthatisabovetheregulatedlimits;samplescontainingthehighestconcentrationofiron(40timesthelimit)andManganese(10timesthelimit)arefromArutminmines.Combinedwith
on-siteobservations,theinvestigationclearlyshowsArutmin’spoormanagementofon-siteandoffsiteenvironmentaleffectsincludingfailuretopreventtheformationofacidminedrainageandsubsequentpollutionofwaterwaysandfailuretopreventerosionoftopsoil.
Serious Risk of Acid Mine Drainage (AMD) in the Long-Term
The most serious threat to water resources is the formation of acid mine drainage, which will continue to impact the rivers decades after mine closure and are notoriously difficult and expensive to manage. IntheinvestigationwehaveuncoveredevidencethatshowssomeoftheminesalreadyshowssignsofAMD.
Recommendations:
TothegovernmentofSouthKalimantan,in particular the Provincial Environmental ProtectionAgency(BadanLingkunganHidupDaerah)ofSouthKalimantan:And,totheMinistryofEnvironmentofIndonesia:
1. Immediate public investigation of coal mines’ water pollution in South Kalimantan
Inlightofthefindingsandthethreattowaterqualityandpublichealth,GreenpeacecallsontheProvincialEnvironmentalProtectionAgency(BadanLingkunganHidupDaerah)ofSouthKalimantanandtheMinistryofEnvironment
8 CONCLUSION AND DEMANDS

Greenpeace Southeast Asia - Indonesia | 47
Coal Mines Polluting South Kalimantan’s Water
Anacidpond(pH2.34)fromCoalMiningactivities,rightbesidethemainroadusedby
villagersofSalaman,SouthKalimantan.@Gr
eenp
eace
/rich
i rai
mba

Coal Mines Polluting South Kalimantan’s Water
48 | Greenpeace Southeast Asia – Indonesia
(MoE)ofIndonesiatoconductanimmediateandthoroughenvironmentalinvestigationofcoalminesoperatinginSouthKalimantan.Theinvestigationshouldcoveron-siteandoffsiteenvironmentaleffectsincludingwaterpollution,wastewatertreatment,siteselectionofminewasteponds,preservationoftopsoilandstepstakentopreventtheformationofacidminedrainage.TheMoEshouldpubliclyreleasetheinvestigationfindings,aswellasrecordsofthemandatoryenvironmentalauditsundertakenbyallcoalminingcompaniessince2012.
UnderIndonesianlawsandregulation,theMinistryoftheEnvironmentholdsresponsibilityforenvironmentalpolicyanditsimplementationisconductedbyBAPEDAL,theprovincialenvironmentaloffices.Accordingtotheenvironmentallicense(GovernmentRegulation27/2012)92companiesarerequiredto conduct mandatory environmental audits periodically,andifacompanyfailstocarryoutanenvironmentalaudit,theMinisterforthe Environment is authorised to carry out orappointathirdpartytoundertaketheaudit.Theregulationalsosetsoutthat,“iftheenvironmentallicenseisrevoked,therelevantbusinessandoractivitiespermits,whichallowthebusinesstooperate,willalsoberevoked.”
Greenpeace calls on the MoE to publish theenvironmentalauditsofallcoalminingcompaniessince2012(whentheregulationscameintoforce)andrevealifanyregulatoryactionshavebeentakenwhereviolationswerefound.LocalandorCentralGovernmentmustrevokeminingpermitsofviolators.
2. Ensure strong environmental accountability in the mining licenses allocation process
Greenpeace recommends that the mine license allocationprocessincludesamuchstrongerconsiderationofcompanytrackrecordsonenvironmentalperformance,tostrengthenenvironmentalaccountabilityoftheprocessandpenalisecompaniesthatarerepeatoffenders.
Toprotectthewaterqualityandpublichealth,thefollowingneedtobeassessedaspartofthelicensingprocessandaudit,withclearconditions:
• Licensingagencyshouldassesstheproximitytoconservationforestsandheadwaters.Thesitingofminewastewaterponds:awidebufferzonefromriversmustbesetinordertoreducefloodingandspillingrisks.

Greenpeace Southeast Asia - Indonesia | 49
Coal Mines Polluting South Kalimantan’s Water
• Theconditionsshouldbethatthereisno overlap between mine development and conservationzone,nomininginheadwaterregionsandallpossibleeffortstoavoidanyreleasesfromwastewaterponds,includingthroughsiting,design(e.g.lining),maintenance,monitoringandrestrictionofaccesstosuchponds.
• Licensesofcoalconcessionsoverlapping withconservationforestsmustberevoked.
3. Security fund for long term AMD management and liability
GR 27/2012 also mandates the environmental licenseholdertosetasidefunds(anenvironmentalbond)thatwillbeusedforenvironmentalrehabilitationandrecovery.GreenpeacecallsfortheMoEtodisclosedetailsofthesecurityfundsetupforSouthKalimantan,andwhetherthisissetatthesufficientratetopreventlong-termpublicliabilityfromacidminedrainageaftermineclosure.
4. Greater transparency and public information
TheProvincialEnvironmentalProtectionAgency(BadanLingkunganHidupDaerah)ofSouthKalimantanandtheMinistryofEnvironmentof
Indonesiatopublishwaterdischargeviolationsonaregularbasis.Thishelpsinvestors,centralgovernmentminingpermittingbodyandNGOstotrackcompanyperformanceandprovidesastrongincentiveforcompaniestoimprovetheirpractice.Thisshouldbepublishedonaregularbasis.
TheProvincialEnvironmentalProtectionAgency(BadanLingkunganHidupDaerah)ofSouthKalimantanandtheMinistryofEnvironmentofIndonesiatomakeriverqualityreportspubliclyavailable–theGreenpeaceinvestigationcouldonlysourcethereportaftermakingseveralpersonal visits to the MoE and the local EPA; andonlythemostrecentyearisavailable.
The new government of Indonesia can and must do better in terms
of monitoring, enforcing the existing laws, holding polluters accountable, and protecting its
people and environment.
Greenpeace looks forward to working with the Central and
South Kalimantan governments to seriously tackle these problems
and find real solutions.
FloatingMarketCommunity sells their product at the floatingmarketintheMartapurariverinBanjarmasin,SouthKalimantan,Indonesia.TheSouthKalimantanEnvironmentAgency(BLHD)intheir
2013annualreportacknowledgesthatalongwiththeBaritoriver,Martapurahastowithstandtheimpactofcoalminingactivities,asidefromother
riverineindustries.
©UletIfansasti/greenpeace/2012
Coal Mines Polluting South Kalimantan’s Water
50 | Greenpeace Southeast Asia – Indonesia
8 END NOTES
Appendix 1i MinistryofEnergyandMineralResourcesRepublicIndonesia,DirectorateGeneralofMineralandCoal,DirectorateofMineral andCoalProgramSupervision.2012.“IndonesiaMineralandCoalStatistics2012”.http://www.minerba.esdm.go.id/library/ content/file/28935-Publikasi/bea3977b3c2b241a421c7640955ebf682013-03-12-12-28-12.pdf1 Bankwatch,15November2013,Bankingoncoal-Underminingourclimate.p.33.http://bankwatch.org/sites/default/files banking-on-coal.pdf2 Gresswell,‘AsianThermalCoalMarketsin2013–TrendsandThemes’,p.13.HDRSalva,corporatecommunication(Salvais aglobalexploration,miningandcommoditiesconsultant)https://salvareport.com/wp-content/uploads/2013/07/Thermal-Market Presentation-180613.pdf3 GreenpeaceInternational,PointofNoReturn:Themassiveclimatethreatswemustavoid,p.45.http://www.greenpeace.org/ international/point-of-no-return/4 Ibid.5 LucarelliB.,July2010.TheHistoryandFutureofIndonesia’sCoalIndustry:ImpactofPoliticsandRegulatoryFrameworkon IndustryStructureandPerformance’,ProgramonEnergyandSustainableDevelopment.StanfordWorkingPaper#93.p.25. http://iis-db.stanford.edu/pubs/22953/WP_93_Lucarelli_revised_Oct_2010.pdf6 Devi,B.&Proyogo,D.(2013)“MiningandDevelopmentinIndonesia:AnOverviewoftheRegulatoryFrameworkandPolicies,” March2013.P.42. http://im4dc.org/wp-content/uploads/2013/09/Mining-and-Development-in-Indonesia.pdf7 LucarelliB.(2010).8 Tempomagazine,14June,2010,‘PerangMafiaEmasHitam(MafiaWars;BlackGold).(subscription).9 Tempomagazine(English),4March2012,p.59“MineWars”.NotinTemparchivebutreproducedhere.Accessed22Nov.2014. http://www.churchillmining.com/library/file/Tempo-Mine%20Wars-Mar2012.pdf10 LuthfiFatah,2008.TheImpactsofCoalMiningontheEconomyandEnvironmentofSouthKalimantanProvince,Indonesia. ASEANEconomicBulletinVol.25,No.1,pp.85–98..11 GaryMcMahon,EllyRasdianiSubdibjo,JeanAden,AzizBouzaher,GiovannaDoreRamanieKunanayagam.November2000. MiningAndTheEnvironmentInIndonesia:Long-TermTrendsAndRepercussionsOfTheAsianEconomicCrisis.EASES DiscussionPaperSeries.21438.12 LucarelliB.(2010).13 KP3EIKomitePercepatandanPerluasanPembangunanEkonomiIndonesia(TheIndonesianCommitteeforaccelerationand expansionofEconomicalDevelopment),“KalimantanPerkembangandanKemajuanKEKalimantan,” http://kp3ei.go.id/in/main_ind/content2/114/11714 MinistryofEnergyandMineralResourcesoftheRepublicofIndonesia,“Berita,Coal,SouthKalimantanCoalProductionExpected toIncrease,”RABU,07January2009,http://www.esdm.go.id/news-archives/coals/52-coal/2206-south-kalimantan-coal- production-expected-to-increase.html?tmpl=component&print=1&page=15 Fornationalcoaloutputpost2011,seetheBPstatisticalreviewofworldenergy http://www.bp.com/en/global/corporate/about-bp/energy-economics/statistical-review-of-world-energy.html16 “Indonesiancoal”DonaldL.Ewart,Jr.,andRobertVaughn,Marstonne&MarstonneInc.US,reviewtheIndonesianthermalcoal industry.ReprintedfromMay2009WorldCoalAsiaSpecial.www.WorldCoal.com17 LuthfiFatah(2008):The“majorityofthelarge-scalecoalindustriesoperatedwithapermitcalledtheCoalMiningExploration ProjectAgreement(CMEPA),whichisinIndonesianiscalledaPKP2B(PerjanjianKaryaPengusahaanPertambanganBatubara) permit.Thesmall-scalecoalindustriesincludedsmallfirmsaswellasindividualsandcooperatives.TheseoperatedwithMining Authorization(MA)permits,whichinIndonesiaarecalledKP(KuasaPertambangan)permits.”18 2013mapofSouthKalimantanCoalConsessionsfromtheIndonesianCoalAssociationissuedbyPetromindo–onfilewith Greenpeace19 TheWorldEnergyCouncildeclaredin2011thatIndonesia’scoalreserveswereover5.5billiontonnes,or0.6%oftheworld’stotal coalreserves.[See,ICRAIndonesiaRatingFeatureSeptember2012.RatingMethodologyforCoalMiningCompanies*Overview] Thefiguresfor2011areasubstantialincreasefromthe2010BPStatisticalEnergySurvey,whichfoundthatin2009,Indonesia had“coalreservesof4,328milliontonnes,0.52%oftheworldtotal[and]coalproductionof252.47milliontonnes,4.55%ofthe worldtotal.”[See,Sourcewatch,CoalMininginIndonesia-Overview,“Indonesiaandcoal”.http://www.sourcewatch.org/index. php/Indonesia_and_coal]20 Zacksinvestmentresearchhasestimatedthatover90%oftheestimatedcoaldemandgrowthinAsia,whichis3.5billionmetric tonnes,isexpectedtocomefromIndonesiaoverthenext20years:ZacksInvestmentResearch,“Peabody’sNewCoalBackup,” 21December2010.http://www.zacks.com/stock/news/44950/peabodys-new-coal-backup21 IndonesiaMineralandCoalStatistics2012,DirectorateofMineralandCoalProgram,MinistryofEnergyandMineralResources. http://www.minerba.esdm.go.id/library/content/file/28935-Publikasi/ bea3977b3c2b241a421c7640955ebf682013-03-12-12-28-12.pdf22 DetermineAppropriatePostMiningLandUseinIndonesiaCoalMiningUsingLandSuitabilityEvaluation.(2011).SriMaryatietal. TechnicalPaperforKyushuUniversity. http://ncrs.cm.kyushu-u.ac.jp/assets/files/JNCRS/JNCRS_Vol5_33-38.pdf

Greenpeace Southeast Asia - Indonesia | 51
Coal Mines Polluting South Kalimantan’s Water
23 Jatam(2010),DeadlyCoal:CoalExtractionandBorneoDarkGeneration.(Originaltitle:MautnyaBatubara,PengerukanBatubara danGenerasiSuramKalimantan.Coal,DiggingIndonesia’sgrave,p.12.24 EarthworksFactSheet,2002.AcidMineDrainage.2002.http://www.earthworksaction.org/files/publications/FS_AMD.pdf [hereinafterEarthworks,AMD];SeealsoU.S.DepartmentofAgriculture,ForestService,1993.AcidMineDrainagefromImpactof HardrockMiningontheNationalForests:AManagementChallenge.ProgramAid1505.p.12.and,USEPA,’AbandonedMine SiteCharacterizationCleanupHandbook’August2000,Chapter3:EnvironmentalImpactsfromMining,p30: http://www.epa.gov/superfund/policy/remedy/pdfs/amscch.pdf25 GhinwaM.NajaandBohumilVolesky,2009.ToxicityandSourcesofPb,Cd,Hg,Cr,As,andRadionuclidesinthe Environment.2.3.1AcidMineDraingae,p.35:http://biosorption.mcgill.ca/publication/HandB-Ch2.pdf26 JamesWilliamson,HaleThurston,MatthewHeberling,2008.ValuingacidminedrainageremediationinWestVirginia:ahedonic modelingapproach.TheAnnalsofRegionalScience.02/2008;42(4):987-999.http://www.researchgate.net/ publication/23545340_Valuing_acid_mine_drainage_remediation_in_West_Virginia_a_hedonic_modeling_approach27 Ibid.28 Katoria,D.Sehgal,D.&Kumar,S.2013.EnvironmentImpactAssessmentofCoalMining.InternationalJournalofEnvironmental EngineeringandManagement.4(3):245-250.http://www.ripublication.com/ijeem_spl/ijeemv4n3_14.pdf29 Munnik,V.,Hochmann,G.Hiabane,M.&S.Law.2010.ThesocialandenvironmentalconsequencesofCoalMininginSouth Africa:Acasestudy.EnvironmentalMonitoringGroup.January2010,CapeTown,SouthAfricaandAmsterdam,The Netherlands.http://www.bothends.org/uploaded_files/uploadlibraryitem/1case_study_South_Africa_updated.pdf30 McQuaid,J.2009.MountaintopMiningLegacy:DestroyingAppalachianStreams.360Yale.20July2009.http://e360.yale.edu/ feature/mountaintop_mining_legacy_destroying_appalachian_streams/2172/31 Earthworks,AMD.Foramentionofthepersistentnatureofcoal-relatedwaterpollution,seealso:Anderson,R.M.,Beer,K.M., Buckwalter,T.F.,Clark,M.E.,McAuley,S.D.,Sams,J.I.III,andWilliams,D.R.,2000,WaterQualityintheAlleghenyand MonongahelaRiverBasinsPennsylvania,WestVirginia,NewYork,andMaryland,1996-98:U.S.GeologicalSurveyCircular 1202,32p.,on-lineathttp://pubs.water.usgs.gov/circ1202/orpubs.usgs.gov/circ/circ1202/major_findings.htm:“Mine-related influenceshavelongbeenrecognizedasamongthemostseriousandpersistentwater-qualityproblemsinPennsylvania (PennsylvaniaDepartmentofEnvironmentalProtection,1996)andWestVirginia(WestVirginiaDepartmentofEnvironmental Protection,1998),aswellasthroughoutAppalachia,extendingfromNewYorktoAlabama(BieseckerandGeorge,1966).”32 DepartmentofWaterandSanitationofSouthAfrica,briefingtotheNationalAssemblyCommitteeonWaterandSanitationon AcidMineDrainage(AMD)anditsimplicationstogroundwater,riversanddams,5November,2014.Summaryofthehearingand thebriefingpaperscanbeaccessedat:http://www.pmg.org.za/node/4802733 B.P.Simarmata,T.ListyaniR.A.,Sukartono,2011.Simarmata,AcidMineDrainageIdentificationAtBinuangArea,South Kalimantan,andItsAlternativeTreatment.AtlasResourcesGeologicalDepartment,CollegeofTechnology“STTNASYogyakarta.” JurnalTeknologi,Volume4Number2,December2011,113-119.34 Ibid.35 AbfertiawanM.S.andGautamaR.S.2011.DevelopmentofCatchmentAreaApproachinManagementofAcidMineDrainage, presentationfortheInternationalMineWaterAssociationCongress2011,9September2011,Aachen,Germanyhttps://www. imwa.info/imwa-meetings/proceedings/176-proceedings-2011.htmlorhttps://www.imwa.info/docs/imwa_2011/IMWA2011_ Abfertiawan_325.pdf36 M.SonnyAbfertiawan,RudySayogaGautama,GintingJaluKusuma,AriefWiedhartono,FirmanGunawan,“TheChallengesin AcidMineDrainageManagementinLatiCoalMineOperation,EastKalimantan”(authorsbasedatPTBerauCoal,andthe IndonesiaandDepartmentofMiningEngineering,FacultyofMiningandPetroleumEngineering,InstitutTeknologi,Bandung, Indonesia)http://www.academia.edu/6968715/The_Challenges_in_Acid_Mine_Drainage_Management_in_Lati_Coal_Mine_ Operation_East_Kalimantan37 Riza,N.,Thamrin,Siregar,SH,2012.AnalysisofwaterqualityofSingingirivertributariesaroundtheKuantanSingingicoalmine. JurnalIlmuUngkuan,2012:6(2)(AnalisisStatusKualitasAirAnak-AnakSungaiSingingiSekitarTambangBatubaraDiKuantan Singingi)ISSN1978-5283.©2012ProgramStudiIlmuLingkunganPPSUniversitasRiau. http://download.portalgaruda.org/article.php?article=31887&val=227738 WorldHealthOrganization.2007.HydrogenSulfideinDrinking-water,BackgrounddocumentfordevelopmentofWHOGuidelines forDrinking-waterQuality,WHO/SDE/WSH/03.04/07http://www.who.int/water_sanitation_health/dwq/chemicals/en/ hydrogensulfide.pdf(OriginallypublishedinGuidelinesfordrinking-waterquality,2nded.Vol.2.Healthcriteriaandother supportinginformation.WorldHealthOrganization,Geneva,1996.)39 QianLia,JackR.LancasterJr.2013.Chemicalfoundationsofhydrogensulfidebiology,NitricOxideVolume35,30November 2013,Pages21–34(DOI:10.1016/j.niox.2013.07.001)http://www.sciencedirect.com/science/article/pii/S108986031300275940 WorldHealthOrganization.2008.BackgrounddocumentfordevelopmentofWHOGuidelinesforDrinking-waterQuality.WHO/ SDE/WSH/03.04/08(OriginallypublishedinGuidelinesfordrinking-waterquality,2nded.Vol.2.Healthcriteriaandother supportinginformation.WorldHealthOrganization,Geneva,1996.):http://www.who.int/water_sanitation_health/dwq/chemicals/i ron.pdf41 CarlosDeRosa&JamesLyon,1997.GoldenDreams,PoisonedStreams.MineralPolicyCenter,WashingtonDC,1997.
Coal Mines Polluting South Kalimantan’s Water
52 | Greenpeace Southeast Asia – Indonesia
42 ImpactsofpHonfishspecieswereextractedfromtheUSEPAAcidRainstudy,otherchemicalcomponentsofacidrainwere excluded.UnitedStatesEnvironmentalProtectionAgency,“EffectsofAcidRain-SurfaceWatersandAquaticAnimals”website. http://www.epa.gov/acidrain/effects/surface_water.html43 Ibid.44 Ibid.45 Hermiati&Sukmawardani.2011.ResilienceandGrowthinsomeTilapia(fish)strainsinAcidMedia.BogorInstituteofAgriculture, IPBIndonesia.http://repository.ipb.ac.id/handle/123456789/5220846 AstriaJ.,Marsi,FitraniM.2013.Survivalrateandgrowthofsnakeheadfish(Channastriata)onvariouspHmodificationofswamp watermixedwithsoilsubstrate.UniversityofSriwijaya,Indonesia.JurnalAkuakulturRawaIndonesia,1(1):66-75.47 PescodinRudiyanti,S.&Ekasari,A.D.2009.GrowthAndSurvivalRateOfCyprinusCarpioLinnJuvenileOnDifferent ConcentrationofRegent0.3gPesticide.UniversityofDiponegoro,Indonesia.JurnalSaintekPerikananVol.5,No.1,39–47. http://core.kmi.open.ac.uk/download/pdf/11718503.pdf48 Ahmadi,H.Iskandar&Kurniawati,N.2012.AdditionofProbioticinCommercialFeedtoGrowthofSangkuriangCatfish(Clarias gariepinus)onNurseryII.UniversityofPadjadjaran,Indonesia.JurnalPerikanandanKelautanVol.3No.4.ReferingtoIndonesian SNI.49 UnitedStatesEnvironmentalProtectionAgency.EffectsofAcidRain-SurfaceWatersandAquaticAnimals.http://www.epa.gov/
acidrain/effects/surface_water.html.Forfurtherexamplesoffishkills,wherestudiesclearlylinkedfishdyingwithsuddenonslaughtsoflowpH,pleaserefertoHohls,B.C.andKuhn,A.L.(2001).FieldGuidetoFishKillAssessments.InstituteforWaterQualityStudies,DepartmentofWaterAffairsandForestry,Pretoria,SouthAfrica.http://www.dwaf.gov.za/iwqs/reports/fishkill/FieldGuidetoFishKills.pdforFishKillsinNSW,FrequentlyAskedQuestions,DepartmentofPrimaryIndustries,NewSouthWalesgovernmenthttp://www.dpi.nsw.gov.au/__data/assets/pdf_file/0004/402790/Fish-Kills-FAQ-August-2011.pdf
50 ConciseInternationalChemicalAssessmentDocument63,ManganeseAndItsCompounds:EnvironmentalAspects(FirstdraftpreparedbyHowe,P.D.,Malcolm,H.M.,andDrDobson,S.,CentreforEcology&Hydrology,MonksWood,UnitedKingdom)WorldHealthOrganization,Geneva,2004http://www.who.int/ipcs/publications/cicad/cicad63_rev_1.pdfandhttp://www.inchem.org/documents/cicads/cicads/cicad63.htm#1.0
51 ATSDR(2004)ToxicologicalProfileforcopper.UnitedStatesPublicHealthService,AgencyforToxicSubstancesandDisease Registry,September2004.SeealsoAdams&Chapman200652 Sandahl,J.F.,Baldwin,D.H.,Jenkins,J.J.,Scholz,N.(2007)Asensorysystemattheinterfacebetweenurbanstormwaterrunoff andsalmonsurvival.EnvironmentalScience&Technology,41(8):2998-3004.53 ATSDR(2004)ToxicologicalProfileforcopper.UnitedStatesPublicHealthService,AgencyforToxicSubstancesandDisease
Registry,September2004.SeealsoComber,S.D.W.,Merrington,G.,Sturdy,L.,Delbeke,K.,vanAssche,F.(2008)CopperandzincwaterqualitystandardsundertheEUWaterFrameworkDirective:Theuseofatieredapproachtoestimatethelevelsoffailure.ScienceofTheTotalEnvironment403(1-3):12-22.
54 U.S.EnvironmentalProtectionAgency.2011.TheEffectofMountaintopMinesandValleyFillsonAquaticEcosystemsofthe CentralAppalachianCoalfields.EPA/600/R-09/138F.WashingtonDChttp://cfpub.epa.gov/ncea/cfm/recordisplay. cfm?deid=22574355 Munnik,V.,Hochmann,G.Hiabane,M.&S.Law.2010.ThesocialandenvironmentalconsequencesofCoalMininginSouth Africa:Acasestudy.EnvironmentalMonitoringGroup.January2010,CapeTown,SouthAfricaandAmsterdam,The Netherlands.http://www.bothends.org/uploaded_files/uploadlibraryitem/1case_study_South_Africa_updated.pdf56 OakRidgeNationalLaboratory,U.S.DepartmentofEnergy.2003.EcologicalRiskAnalysis.http://www.esd.ornl.gov/programs/ ecorisk/documents/m5520ata.pdf57 WorldHealthOrganization.2004.ManganeseanditsCompounds:EnvironmentalAspects.http://www.who.int/ipcs/publications/ cicad/cicad63_rev_1.pdf58 WaterStewardshipDivision,MinistryofEnvironment,ProvinceofBritishColumbia.March2008.AmbientAquaticLifeGuidelines
forIron:OverviewReport.http://www.env.gov.bc.ca/wat/wq/BCguidelines/iron/iron_overview.pdfandIowaDepartmentofNaturalResources.2005.IronCriteriaandImplementationForIowaSurfaceWaters.11/28/2005CD,12/05/2005CD,http://www.iowadnr.gov/portals/idnr/uploads/water/standards/iron_issue.pdf,referencing
1. Gerhardt,A.1995.JointandSingletoxicityofCdandFerelatedtometaluptakeinthemayflyLeptophlebiamarginata(L.) (Insecta).Hydrobiologia,306:229-240.2. Brandt,H.H.,1948.Intensifiedinjuriouseffectsonfish,especiallytheincreasedtoxiceffectproducedbyacombinationof sewagepoisons.Beitr.Wass.Abwass.Fischerei-chemi.15.3. Doudoroff,P.andM.Katz.1953.Criticalreviewofliteratureonthetoxicityofindustrialwastesandtheircomponentstofish.II. Themetals,assalts.Sew.Ind.Wastes,25:802.4. U.S.EnvironmentalProtectionAgency.July1976.QualityCriteriaForWater.Washington,D.C.20460.5. Warnick,S.L.,andH.L.Bell,1969.Theacutetoxicityofsomeheavymetalstodifferentspeciesofaquaticinsects.Jour.Water Poll.Cont.Fed.41(2):280.59 U.S.EPA2000:NickelCompounds.HazardSummary.http://www.epa.gov/ttnatw01/hlthef/nickel.html60 IyakaY.A.2011.Nickelinsoils:Areviewofitsdistributionandimpacts.ScientificResearchandEssays.Vol.6(33),pp.6774- 6777.29December2011SpecialReviewhttp://academicjournals.org/article/article1380729502_Iyaka.pdf61 FoodandAgricultureOrganizationoftheUnitedNations.1984.WaterqualitycriteriaforEuropeanfreshwaterfish.http://www.fao. org/docrep/017/ap673e/ap673e.pdf62 EislerR.1998.NickelHazardstoFish,Wildlife,andInvertebrates:ASynopticReview.PatuxentWildlifeResearchCenter,U.S. GeologicalSurvey.http://137.227.245.168/eisler/CHR_34_Nickel.PDF63 BritishColumbiaMinistryofWater,LandandAirProtection.2004.TechnicalReport-WaterQualityGuidelinesForCobalt.http:// www.env.gov.bc.ca/wat/wq/BCguidelines/cobalt/cobalt_tech.pdf64 U.S.AgencyforToxicSubstancesandDiseaseRegistry.2011.ChromiumToxicity.http://www.atsdr.cdc.gov/csem/csem. asp?csem=10&po=1065 WorldHealthOrganization.2003.Chromiumindrinking-water;VelmaVetal2009.66 EcotoxicologyofHexavalentChromiuminFreshwaterFish:ACriticalReview.RevEnvironHealth.2009Apr–Jun;24(2):129–145. http://www.ncbi.nlm.nih.gov/pmc/articles/PMC2860883/67 U.S.EnvironmentalProtectionAgency.2013.BasicInformationaboutChromiuminDrinkingWater.http://water.epa.gov/drink/ contaminants/basicinformation/chromium.cfm

Greenpeace Southeast Asia - Indonesia | 53
Coal Mines Polluting South Kalimantan’s Water
68 Kompas.2012.PointspronetofloodinginSouthKalimantan.http://regional.kompas.com/read/2012/11/19/171034/993.Titik. Rawan.Banjir.di.Kalsel69 Characteristicpostmininglandhaslostitsrichtopsoil,limitingre-vegetationoptions. Sengon(Paraserianthesfalcataria)and
Acacia(Acaciamangium),aretypicallyusedinpost-coalminingreclamationplantationsintheregion.Theyarechosenduetotheirresilience. [EnvironmentProtectionAgency(BadanLingkunganHidupDaerah)SouthKalimantanProvince.AnnualReport:RegionalEnvironmentStatusSouthKalimantanProvince2013.]Theycanliveinvarioustypesofland,includingdrylandwithminimalnutrients,withgoodorbaddrainageandevenlandwithsalinityproblems[AristaTH,B.2012.CarbonpredictioninAcaciamangiumandParaserianthesfalcatariainpostreclamationareaofPTArutminBatulicinKalimantanSelatan,Originaltitle:PendugaankandungankarbonpadategakanAkasia(Acaciamangium)dantegakanSengon(Paraserianthesfalcataria)dilahanreklamasipascatambangbatubaraPTArutminBatulicinKalimantanSelatan.Thesis,BogorInstituteofAgriculture,Indonesia]. However,Acaciaisalsoassociatedwithallelophathythatinhibitsotherplantsfromgrowing.[Noumi,Z.&Chaieb,M.2011. AllelopathicEffectsofAcaciaTortilis(Forssk.)Haynesubsp. Raddiana(Savi)BrenaninNorthAfrica.Pak.J.Bot.,43(6):2801-2805,2011].
70 Holl,K.D.2002.Long-termvegetationrecoveryonreclaimedcoalsurfaceminesintheeasternUSA.Departementof EnvironmentalStudies,UniversityofCalifornia,SantaCruz.JournalofAppliedEcology39:960–970.http://people.ucsc. edu/~kholl/mining.pdf71 Setiawan,D.2004.TheChangeofsoilcharacteristicatcoalminereclamationareawhichisrevegetatedinone,two,threeand
fouryearswithSengonandAcaciaPlant.(Originaltitle:Perubahankaraktertanahpadakawasanreklamasibekastambangbatubarayangdirevegatisselamsatu,dua,tigadanempattahundengansengondanakasia.Thesis.BogorInsituteofAgriculture.
72 Ibid 73 AristaTH,B.2012.Originaltitle:PendugaankandungankarbonpadategakanAkasia(Acaciamangium)dantegakanSengon
(Paraserianthesfalcataria)dilahanreklamasipascatambangbatubaraPTArutminBatulicinKalimantanSelatan.(PredictionofresidualcarboncontentofAcacia(Acaciamangium)andSengon(Paraserianthesfalcataria)inlandreclamationaftercoalminingbyPTArutminBatulicininSouthKalimantan)Thesis,BogorInstituteofAgriculture.
74 TheMinistryofForestry,RepublicofIndonesia“DaftarJenis-JenisPohonYangDilindungi” http://www.dephut.go.id/Halaman/PDF/kalbar04/tabel-46.pdf.75 EnvironmentProtectionAgency(BadanLingkunganHidupDaerah)SouthKalimantanProvince.AnnualReport:Regional EnvironmentStatusSouthKalimantanProvince2013.76 IndonesiaMinistryofEnvironment(MoE).2003.DecreeNo.113onWastewaterQualityLimitforCoalMiningAcivities(BakuMutu AirLimbahBagiUsahadanatauKegiatanPertambanganBatuBara).77 Ibid 78 ThemonthlylimitsintheU.S.aremorestringentthantheIndonesianlimits.CornellUniversityLegalInformationInstitute,“40CFR 434.35-Newsourceperformancestandards(NSPS).”http://www.law.cornell.edu/cfr/text/40/434.3579 InternationalFinanceCorporation,“Environmental,HealthandSafetyGuidelinesforMining,”2007.http://www.ifc.org/wps/wcm/ connect/1f4dc28048855af4879cd76a6515bb18/Final%2B-%2BMining.pdf?MOD=AJPERES&id=132315326415780 MinistryofHealth,RepublicofIndonesia(2010).IndonesianMinistryofHealthDecreeNo.492/MENKES/PER/IV/2010 onRequirementofDrinkingWater.http://www.hukor.depkes.go.id/up_prod_permenkes/PMK%20No.%20492%20ttg%20 Persyaratan%20Kualitas%20Air%20Minum.pdf81 BusrinTreerapongpichit,2010.Banpumineclosedoverencroachment:Indonesianrulesneedclarification.BangkokPost,12 February2010ftp://202.60.207.28/BP/2010/02_BP_Feb/12022010/BK120210B10.pdf82 RepublikaOnline.2009.“MenteriLHAncamPidanakanLimaPerusahaan”(EnvironmentMinisterThreatenstosanction5 Companies),27November2009.http://www.republika.co.id/berita/shortlink/9210283 Kompas.2012.“993TitikRawanBanjirdiKalsel”(993Flood-proneLocationsinSouthKalimantan),19November2012.http:// regional.kompas.com/read/2012/11/19/1710346/993.Titik.Rawan.Banjir.di.Kalsel84 TheIndonesianCoalMiningAssociation,IndonesianCoalBook2012/2013,June2012.85 FokusBatulicin.2011.River’sWaterQualityinSouthKalimantanisdeclining(KualitasAirSungaidiKalimantanSelatanMenurun). 11April2011.http://www.fokusbatulicin.com/2011/04/kualitas-air-sungai-di-kalimantan.html86 TheIndonesianCoalMiningAssociationReport,,IndonesianCoalBook2012/2013,June2012.TanjungAlamJayaentryshowing thattheconcessionwillendin2013-2014,page427.87 EnvironmentProtectionAgency(BadanLingkunganHidupDaerahorBLDH)forSouthKalimantanProvince,‘AnnualReport: RegionalEnvironmentStatusSouthKalimantanProvince2013.’88 ResearchandDevelopmentAgencyEastKalimantanProvince(2003).ResearchReport:StudyonWaterConcentrationin
MahakamRiver,EastKalimantanProvinceBLH(BadanLingkunganHidup)EastKalimantanEnvironmentalStatusReport2009BLH(BadanLingkunganHidup)EastKalimantanEnvironmentalStatusReport2010BLH(BadanLingkunganHidup)EastKalimantanEnvironmentalStatusReport2011BLH(BadanLingkunganHidup)EastKalimantanEnvironmentalStatusReport2012
89 “DPRD:KPCbertanggungjawabataspencemaranSungaiSangatta”(ParliamentholdsKPCresponsibleforpollutionoftheRiverSengata)18March2013.http://www.antaranews.com/berita/363941/dprd-kpc-tanggung-jawab-atas-pencemaran-sungai-sangatta(Accordingtothisarticle,theChairmanofCommissionIIIDPRDinEastKutaiinEastKalimantan,memberofparliamentKasmidiBulang,assertedthatPTKaltimPrimaCoal(KPC)wasresponsibleforthepollutionanddamagetotheSengataRiverasaresultofcoalminewastedisposalintotheriver.Moreover,locallegislatorPalinggiPitersaidthatKPCmusttakeresponsibilityforthewastestreamflowingfromthecoalmineintotheSengataRiverandflowingintoresidentialareas;andaddedthatKPCshouldberesponsibleforcleanupoperations.Officialsreportedhavingtakenwatersamplesatdifferentpoints,anddocumentingvaryinglevelsofturbidityandquality,withatestinglaboratoryinSamarindarevealingveryhighturbidity,i.e.above200NTU.)
90 Kompas.2009.“LimbahPertambanganBatuBaraCemariSungaiBalangan”(CoalMineWastepollutesBalanganriver),27 October2009.http://regional.kompas.com/read/2009/10/27/19211180/limbah.pertambangan.batu.bara.cemari.sungai.balangan91 Riza,N.,Thamrin,Siregar,SH.2012.AnalysisofwaterqualityofSingingirivertributariesaroundthecoalmineatKuantan Singingi.Jurnallingkungan6(2).EnvironmentalstudiesPPS,UniversityofRiau,Indonesia.http://download.portalgaruda.org/ article.php?article=31887&val=227792 GR27/2012ontheEnvironmentalLicense.AsdiscussedinDevi,B.&Proyogo,D.(2013)“MiningandDevelopmentinIndonesia: AnOverviewoftheRegulatoryFrameworkandPolicies,”March2013.p.42. http://im4dc.org/wp-content/uploads/2013/09/Mining-and-Development-in-Indonesia.pdf

Coal Mines Polluting South Kalimantan’s Water
1 | Greenpeace Research Laboratories Analytical Report 04-2014
8 APPENDIX 1
MetalsinCoalMining&ProcessingWastewatersfromIndonesia,September2014
Kevin Brigden, David Santillo & Paul JohnstonGreenpeace Research Laboratories Analytical Report 04-2014
Contents
1. Introduction 2 2. Materialsandmethods 3 3. ResultsandDiscussion 3 References 5 Appendix1.a:Detailsofmethodologies 6
Greenpeace Research LaboratoriesSchoolofBiosciencesInnovation Centre Phase 2Rennes DriveUniversityofExeterExeterEX44RN,UK
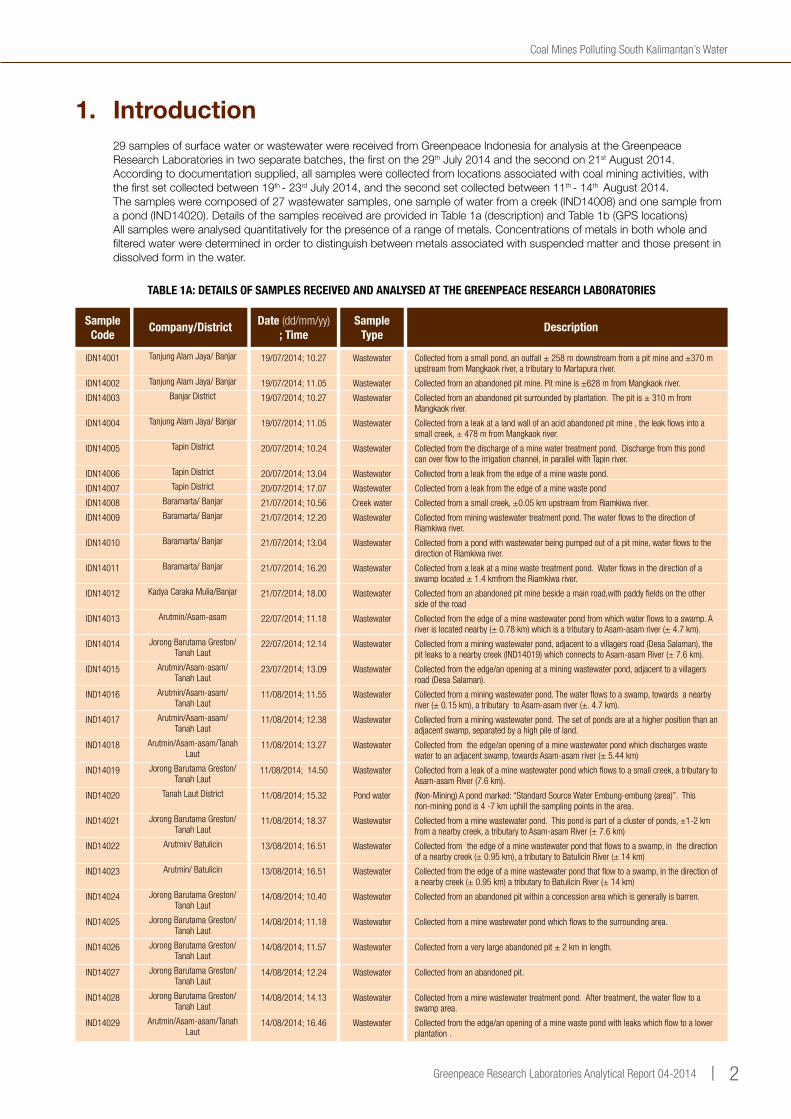
Greenpeace Research Laboratories Analytical Report 04-2014 | 2
Coal Mines Polluting South Kalimantan’s Water
1. Introduction29samplesofsurfacewaterorwastewaterwerereceivedfromGreenpeaceIndonesiaforanalysisattheGreenpeaceResearchLaboratoriesintwoseparatebatches,thefirstonthe29thJuly2014andthesecondon21stAugust2014.Accordingtodocumentationsupplied,allsampleswerecollectedfromlocationsassociatedwithcoalminingactivities,withthefirstsetcollectedbetween19th -23rdJuly2014,andthesecondsetcollectedbetween11th - 14th August2014.Thesampleswerecomposedof27wastewatersamples,onesampleofwaterfromacreek(IND14008)andonesamplefromapond(IND14020).DetailsofthesamplesreceivedareprovidedinTable1a(description)andTable1b(GPSlocations)Allsampleswereanalysedquantitativelyforthepresenceofarangeofmetals.Concentrationsofmetalsinbothwholeandfilteredwaterweredeterminedinordertodistinguishbetweenmetalsassociatedwithsuspendedmatterandthosepresentindissolvedforminthewater.
Sample Code
IDN14001
IDN14002
IDN14003
IDN14004
IDN14005
IDN14006
IDN14007
IDN14008
IDN14009
IDN14010
IDN14011
IDN14012
IDN14013
IDN14014
IDN14015
IND14016
IND14017
IND14018
IND14019
IND14020
IND14021
IND14022
IND14023
IND14024
IND14025
IND14026
IND14027
IND14028
IND14029
Date (dd/mm/yy) ; Time
19/07/2014; 10.27
19/07/2014; 11.05
19/07/2014; 10.27
19/07/2014; 11.05
20/07/2014; 10.24
20/07/2014; 13.04
20/07/2014; 17.07
21/07/2014; 10.56
21/07/2014; 12.20
21/07/2014; 13.04
21/07/2014; 16.20
21/07/2014; 18.00
22/07/2014; 11.18
22/07/2014; 12.14
23/07/2014; 13.09
11/08/2014; 11.55
11/08/2014; 12.38
11/08/2014; 13.27
11/08/2014; 14.50
11/08/2014; 15.32
11/08/2014; 18.37
13/08/2014; 16.51
13/08/2014; 16.51
14/08/2014; 10.40
14/08/2014; 11.18
14/08/2014; 11.57
14/08/2014; 12.24
14/08/2014; 14.13
14/08/2014; 16.46
Sample Type
Wastewater
Wastewater
Wastewater
Wastewater
Wastewater
Wastewater
Wastewater
Creek water
Wastewater
Wastewater
Wastewater
Wastewater
Wastewater
Wastewater
Wastewater
Wastewater
Wastewater
Wastewater
Wastewater
Pond water
Wastewater
Wastewater
Wastewater
Wastewater
Wastewater
Wastewater
Wastewater
Wastewater
Wastewater
Company/District
Tanjung Alam Jaya/ Banjar
Tanjung Alam Jaya/ Banjar
Banjar District
Tanjung Alam Jaya/ Banjar
Tapin District
Tapin District
Tapin District
Baramarta/ Banjar
Baramarta/ Banjar
Baramarta/ Banjar
Baramarta/ Banjar
Kadya Caraka Mulia/Banjar
Arutmin/Asam-asam
Jorong Barutama Greston/Tanah Laut
Arutmin/Asam-asam/Tanah Laut
Arutmin/Asam-asam/Tanah Laut
Arutmin/Asam-asam/Tanah Laut
Arutmin/Asam-asam/Tanah Laut
Jorong Barutama Greston/Tanah Laut
Tanah Laut District
Jorong Barutama Greston/Tanah Laut
Arutmin/ Batulicin
Arutmin/ Batulicin
Jorong Barutama Greston/Tanah Laut
Jorong Barutama Greston/Tanah Laut
Jorong Barutama Greston/Tanah Laut
Jorong Barutama Greston/Tanah Laut
Jorong Barutama Greston/Tanah Laut
Arutmin/Asam-asam/Tanah Laut
Description
Collected from a small pond, an outfall ± 258 m downstream from a pit mine and ±370 m upstream from Mangkaok river, a tributary to Martapura river.
Collected from an abandoned pit mine. Pit mine is ±628 m from Mangkaok river.
Collected from an abandoned pit surrounded by plantation. The pit is ± 310 m from Mangkaok river.
Collected from a leak at a land wall of an acid abandoned pit mine , the leak flows into a small creek, ± 478 m from Mangkaok river.
Collected from the discharge of a mine water treatment pond. Discharge from this pond can over flow to the irrigation channel, in parallel with Tapin river.
Collected from a leak from the edge of a mine waste pond.
Collected from a leak from the edge of a mine waste pond
Collected from a small creek, ±0.05 km upstream from Riamkiwa river.
Collected from mining wastewater treatment pond. The water flows to the direction of Riamkiwa river.
Collected from a pond with wastewater being pumped out of a pit mine, water flows to the direction of Riamkiwa river.
Collected from a leak at a mine waste treatment pond. Water flows in the direction of a swamp located ± 1.4 kmfrom the Riamkiwa river.
Collected from an abandoned pit mine beside a main road,with paddy fields on the other side of the road
Collected from the edge of a mine wastewater pond from which water flows to a swamp. A river is located nearby (± 0.78 km) which is a tributary to Asam-asam river (± 4.7 km).
Collected from a mining wastewater pond, adjacent to a villagers road (Desa Salaman), the pit leaks to a nearby creek (IND14019) which connects to Asam-asam River (± 7.6 km).
Collected from the edge/an opening at a mining wastewater pond, adjacent to a villagers road (Desa Salaman).
Collected from a mining wastewater pond. The water flows to a swamp, towards a nearby river (± 0.15 km), a tributary to Asam-asam river (±. 4.7 km).
Collected from a mining wastewater pond. The set of ponds are at a higher position than an adjacent swamp, separated by a high pile of land.
Collected from the edge/an opening of a mine wastewater pond which discharges waste water to an adjacent swamp, towards Asam-asam river (± 5.44 km)
Collected from a leak of a mine wastewater pond which flows to a small creek, a tributary to Asam-asam River (7.6 km).
(Non-Mining) A pond marked: “Standard Source Water Embung-embung (area)”. This non-mining pond is 4 -7 km uphill the sampling points in the area.
Collected from a mine wastewater pond. This pond is part of a cluster of ponds, ±1-2 km from a nearby creek, a tributary to Asam-asam River (± 7.6 km)
Collected from the edge of a mine wastewater pond that flows to a swamp, in the direction of a nearby creek (± 0.95 km), a tributary to Batulicin River (± 14 km)
Collected from the edge of a mine wastewater pond that flow to a swamp, in the direction of a nearby creek (± 0.95 km) a tributary to Batulicin River (± 14 km)
Collected from an abandoned pit within a concession area which is generally is barren.
Collected from a mine wastewater pond which flows to the surrounding area.
Collected from a very large abandoned pit ± 2 km in length.
Collected from an abandoned pit.
Collected from a mine wastewater treatment pond. After treatment, the water flow to a swamp area.
Collected from the edge/an opening of a mine waste pond with leaks which flow to a lower plantation .
TABLE 1A: DETAILS OF SAMPLES RECEIVED AND ANALYSED AT THE GREENPEACE RESEARCH LABORATORIES

Coal Mines Polluting South Kalimantan’s Water
3 | Greenpeace Research Laboratories Analytical Report 04-2014
TABLE 1B: GPS LOCATIONS FOR SAMPLES RECEIVED AND ANALYSED AT THE GREENPEACE RESEARCH LABORATORIES
SAMPLE CODE SAMPLE CODE
IDN14001
IDN14002
IDN14003
IDN14004
IDN14005
IDN14006
IDN14007
IDN14008
IDN14009
IDN14010
IDN14011
IDN14012
IDN14013
IDN14014
IDN14015
IND14016
IND14017
IND14018
IND14019
IND14020
IND14021
IND14022
IND14023
IND14024
IND14025
IND14026
IND14027
IND14028
IND14029
03º12’24.3”
03º12’23.6”
03º13’18.3”
03º13’14.5”
03º00’15.0”
02º58’33.1”
03º01’40.6”
03º12’57.2”
03º11’54.0”
03º11’58.2”
03º12’33.0”
03º15’13.5”
03º53’27.1”
03º51’51.4”
03º50’53.8”
03º53’11.8”
03º53’15.0”
03º52’47.2”
03º51’53.7”
03º50’03.7”
03º51’56.8”
03º15’53.4”
03º15’54.5”
03º54’30.1”
03º54’35.3”
03º54’23.2”
03º54’38.4”
03º54’38.0”
03º51’15.5”
115º09’36.7”
115º09’45.4”
115º09’19.5”
115º09’20.4”
115º12’02.2”
115º16’11.8”
115º10’12.2”
115º13’26.4”
115º16’04.9”
115º16’11.5”
115º15’17.4”
115º04’30.5”
115º05’35.9”
115º05’37.9”
115º07’01.1”
115º05’24.1”
115º05’22.4”
115º05’24.0”
115º05’35.0”
115º07’04.0”
115º05’37.1”
115º55’18.3”
115º55’17.5”
115º59’41.3”
114º59’52.8”
115º00’58.4”
115º01’11.4”
115º01’23.6”
115º06’59.1”
DEGREE MINUTE SECOND DEGREE MINUTE SECOND
S SE E
2. Materials and Methods
Allsampleswerecollectedinpre-cleanedglass,screw-cappedbottlesandkeptcoldanddarkbeforeshipmenttoourlaboratoryintheUKforanalysis.Sampleswereanalysedquantitativelyformetals.ThepHofeachwastewaterwasmeasuredbothinthefieldusinganumberofcalibratedhand-helddevicesforcross-checkingandalsouponreceiptofthesamplesatthelaboratory.
MetalconcentrationsweredeterminedforallsamplesbyICPatomicemissionspectrometry(AES)followingaciddigestionandusingappropriateintra-laboratorystandards.Boththetotalconcentrationsinthewhole(unfiltered)sampleandtheconcentrationsofdissolvedformsinafilteredsampleweredeterminedseparatelyforeachsample.Moredetaileddescriptionsofthesamplepreparationandanalyticalprocedures,includingpHmeasurements,arepresentedintheAppendix1.a.
3. Results and Discussion
Theconcentrationsofmetalsandmetalloidsinfiltered(dissolvedmetals)andinwholewaters(dissolvedandsuspendedmetals)arereportedinTable2,togetherwithpHmeasurementsrecordedinthefield.ThepHmeasurementsfromthefieldwereinclosecorrelationwithpHmeasurementsofsamplesreceivedatthelaboratory.
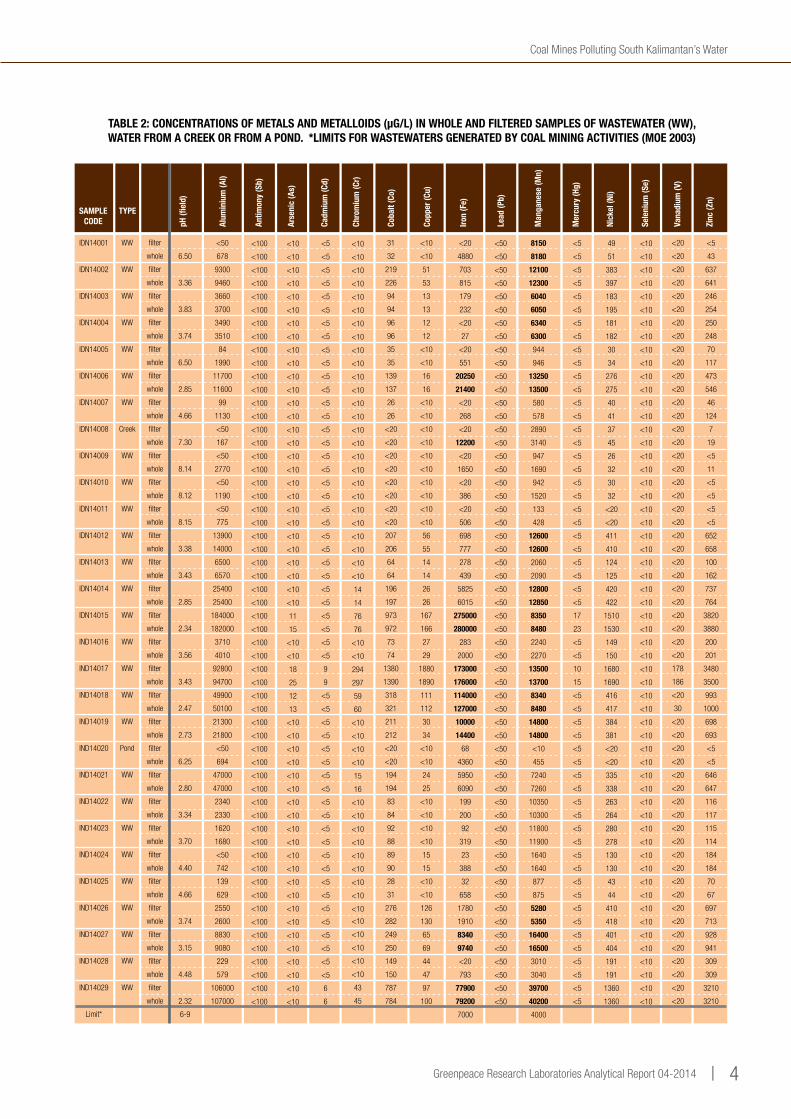
Greenpeace Research Laboratories Analytical Report 04-2014 | 4
Coal Mines Polluting South Kalimantan’s Water
TABLE 2: CONCENTRATIONS OF METALS AND METALLOIDS (µG/L) IN WHOLE AND FILTERED SAMPLES OF WASTEWATER (WW), WATER FROM A CREEK OR FROM A POND. *LIMITS FOR WASTEWATERS GENERATED BY COAL MINING ACTIVITIES (MOE 2003)
IDN14001
IDN14002
IDN14003
IDN14004
IDN14005
IDN14006
IDN14007
IDN14008
IDN14009
IDN14010
IDN14011
IDN14012
IDN14013
IDN14014
IDN14015
IND14016
IND14017
IND14018
IND14019
IND14020
IND14021
IND14022
IND14023
IND14024
IND14025
IND14026
IND14027
IND14028
IND14029
Limit*
WW
WW
WW
WW
WW
WW
WW
Creek
WW
WW
WW
WW
WW
WW
WW
WW
WW
WW
WW
Pond
WW
WW
WW
WW
WW
WW
WW
WW
WW
filter
whole
filter
whole
filter
whole
filter
whole
filter
whole
filter
whole
filter
whole
filter
whole
filter
whole
filter
whole
filter
whole
filter
whole
filter
whole
filter
whole
filter
whole
filter
whole
filter
whole
filter
whole
filter
whole
filter
whole
filter
whole
filter
whole
filter
whole
filter
whole
filter
whole
filter
whole
filter
whole
filter
whole
filter
whole
6.50
3.36
3.83
3.74
6.50
2.85
4.66
7.30
8.14
8.12
8.15
3.38
3.43
2.85
2.34
3.56
3.43
2.47
2.73
6.25
2.80
3.34
3.70
4.40
4.66
3.74
3.15
4.48
2.32
6-9
<50
678
9300
9460
3660
3700
3490
3510
84
1990
11700
11600
99
1130
<50
167
<50
2770
<50
1190
<50
775
13900
14000
6500
6570
25400
25400
184000
182000
3710
4010
92800
94700
49900
50100
21300
21800
<50
694
47000
47000
2340
2330
1620
1680
<50
742
139
629
2550
2600
8830
9080
229
579
106000
107000
<20
4880
703
815
179
232
<20
27
<20
551
20250
21400
<20
268
<20
12200
<20
1650
<20
386
<20
506
698
777
278
439
5825
6015
275000
280000
283
2000
173000
176000
114000
127000
10000
14400
68
4360
5950
6090
199
200
92
319
23
388
32
658
1780
1910
8340
9740
<20
793
77900
79200
7000
49
51
383
397
183
195
181
182
30
34
276
275
40
41
37
45
26
32
30
32
<20
<20
411
410
124
125
420
422
1510
1530
149
150
1680
1690
416
417
384
381
<20
<20
335
338
263
264
280
278
130
130
43
44
410
418
401
404
191
191
1360
1360
<10
<10
<10
<10
<10
<10
<10
<10
<10
<10
<10
<10
<10
<10
<10
<10
<10
<10
<10
<10
<10
<10
<10
<10
<10
<10
<10
<10
<10
<10
<10
<10
<10
<10
<10
<10
<10
<10
<10
<10
<10
<10
<10
<10
<10
<10
<10
<10
<10
<10
<10
<10
<10
<10
<10
<10
<10
<10
<20
<20
<20
<20
<20
<20
<20
<20
<20
<20
<20
<20
<20
<20
<20
<20
<20
<20
<20
<20
<20
<20
<20
<20
<20
<20
<20
<20
<20
<20
<20
<20
178
186
<20
30
<20
<20
<20
<20
<20
<20
<20
<20
<20
<20
<20
<20
<20
<20
<20
<20
<20
<20
<20
<20
<20
<20
<5
43
637
641
246
254
250
248
70
117
473
546
46
124
7
19
<5
11
<5
<5
<5
<5
652
658
100
162
737
764
3820
3880
200
201
3480
3500
993
1000
698
693
<5
<5
646
647
116
117
115
114
184
184
70
67
697
713
928
941
309
309
3210
3210
8150
8180
12100
12300
6040
6050
6340
6300
944
946
13250
13500
580
578
2890
3140
947
1690
942
1520
133
428
12600
12600
2060
2090
12800
12850
8350
8480
2240
2270
13500
13700
8340
8480
14800
14800
<10
455
7240
7260
10350
10300
11800
11900
1640
1640
877
875
5280
5350
16400
16500
3010
3040
39700
40200
4000
<50
<50
<50
<50
<50
<50
<50
<50
<50
<50
<50
<50
<50
<50
<50
<50
<50
<50
<50
<50
<50
<50
<50
<50
<50
<50
<50
<50
<50
<50
<50
<50
<50
<50
<50
<50
<50
<50
<50
<50
<50
<50
<50
<50
<50
<50
<50
<50
<50
<50
<50
<50
<50
<50
<50
<50
<50
<50
<100
<100
<100
<100
<100
<100
<100
<100
<100
<100
<100
<100
<100
<100
<100
<100
<100
<100
<100
<100
<100
<100
<100
<100
<100
<100
<100
<100
<100
<100
<100
<100
<100
<100
<100
<100
<100
<100
<100
<100
<100
<100
<100
<100
<100
<100
<100
<100
<100
<100
<100
<100
<100
<100
<100
<100
<100
<100
<10
<10
<10
<10
<10
<10
<10
<10
<10
<10
<10
<10
<10
<10
<10
<10
<10
<10
<10
<10
<10
<10
<10
<10
<10
<10
<10
<10
11
15
<10
<10
18
25
12
13
<10
<10
<10
<10
<10
<10
<10
<10
<10
<10
<10
<10
<10
<10
<10
<10
<10
<10
<10
<10
<10
<10
<10
<10
<10
<10
<10
<10
<10
<10
<10
<10
<10
<10
<10
<10
<10
<10
<10
<10
<10
<10
<10
<10
<10
<10
<10
<10
14
14
76
76
<10
<10
294
297
59
60
<10
<10
<10
<10
15
16
<10
<10
<10
<10
<10
<10
<10
<10
<10
<10
<10
<10
<10
<10
43
45
31
32
219
226
94
94
96
96
35
35
139
137
26
26
<20
<20
<20
<20
<20
<20
<20
<20
207
206
64
64
196
197
973
972
73
74
1380
1390
318
321
211
212
<20
<20
194
194
83
84
92
88
89
90
28
31
276
282
249
250
149
150
787
784
<10
<10
51
53
13
13
12
12
<10
<10
16
16
<10
<10
<10
<10
<10
<10
<10
<10
<10
<10
56
55
14
14
26
26
167
166
27
29
1880
1890
111
112
30
34
<10
<10
24
25
<10
<10
<10
<10
15
15
<10
<10
126
130
65
69
44
47
97
100
<5
<5
<5
<5
<5
<5
<5
<5
<5
<5
<5
<5
<5
<5
<5
<5
<5
<5
<5
<5
<5
<5
<5
<5
<5
<5
<5
<5
17
23
<5
<5
10
15
<5
<5
<5
<5
<5
<5
<5
<5
<5
<5
<5
<5
<5
<5
<5
<5
<5
<5
<5
<5
<5
<5
<5
<5
<5
<5
<5
<5
<5
<5
<5
<5
<5
<5
<5
<5
<5
<5
<5
<5
<5
<5
<5
<5
<5
<5
<5
<5
<5
<5
<5
<5
<5
<5
<5
<5
9
9
<5
<5
<5
<5
<5
<5
<5
<5
<5
<5
<5
<5
<5
<5
<5
<5
<5
<5
<5
<5
<5
<5
6
6
SAMPLE CODE
TYPE
pH (fi
eld)
Alum
iniu
m (A
l)
Antim
ony
(Sb)
Arse
nic
(As)
Cadm
ium
(Cd)
Chro
miu
m (C
r)
Coba
lt (C
o)
Copp
er (C
u)
Iron
(Fe)
Lead
(Pb)
Man
gane
se (M
n)
Mer
cury
(Hg)
Nick
el (N
i)
Sele
nium
(Se)
Vana
dium
(V)
Zinc
(Zn)

Coal Mines Polluting South Kalimantan’s Water
5 | Greenpeace Research Laboratories Analytical Report 04-2014
Forthemajorityofsamples,themetalconcentrationsinthefilteredsamplewereverysimilartothoseinthewhole(unfiltered)sample,indicatingthatthesemetalswerepresentinthesesamplesalmostexclusivelyindissolvedformsratherthanboundtosuspendedparticleswithinthewater.
Theexceptions,forwhichthewhole(unfiltered)samplecontainedanotablyhigherconcentrationofoneormoremetalcomparedtotheequivalentfilteredsample,werepredominantlythosesamplesofwastewater(IND14001,IND14005,IND14009,IND14010,IND14011),creekwater(IND14008)andpondwater(IND14020)whichhadpHabove6.
WastewatersgeneratedbycoalminingactivitiesaresubjecttoregulationinIndonesiawhichsetsmaximumpermissiblelimitsforcertainparameters,includingiron(7mg/l=7000μg/l),manganese(4mg/l=4000μg/l)andpH(between6-9)(MOE2003)1.
Wastewatersfrommanyofthelocationssampledinthisstudydidnotcomplywiththeseregulationsatthetimeofsampling,eitherduetoelevatedconcentrationsofmanganeseandiron,orduetohighacidity(pHbelow6).
For22ofthe29samples(76%),allofwhichwerewastewatersamples,thepHwasbelow6.Inthecaseofthese22samples,pHvaluesrangedfrompH4.66(IDN14007)topH2.32(IND14029),with7sampleshavingapHbelow3.
Theconcentrationsofmanganeseexceededthepermissiblelimitfor17ofthe27wastewatersamples(63%),inboththefilteredandwholesampleinallcases,withconcentrationsinthewholesamplerangingfrom5350μg/l(5.35mg/l)to40200μg/l(40.2mg/l).Thehighestconcentration,insampleIND14029,exceededthelimitby10times.Forallbutone(IND14001)ofthese17samples,thepHwasalsooutsidetheallowedrange(pH6-9),andthehighestmanganeseconcentration(40.2mg/l)wasfoundinsampleIND14029,whichhadthelowestpH(2.32).
Ofthese17samples,7alsohadconcentrationsofironthatexceededthemaximumpermissiblelevel,withsimilarlevelsinboththefilteredandwholesampleinallcases.Concentrationsoftotalironinwholesampleswereintherange9740μg/l(9.74mg/l)to280000μg/l(280mg/l),withthehighestconcentrationexceedingthelimitby40times.ThehighestironconcentrationwasalsofoundinasamplewithoneofthelowestpHvalues(IND14015,pH2.34).Thesefindingsareconsistentwiththehighacidityofmanysamplessolubilisingironandmanganesefrommineralsinthelocalenvironment.
Thecreekwater(IND14008)alsohadaconcentrationofironinthewholesamplewhichexceededthelimitforwastewaters(12200μg/l,or12.2mg/l),thoughtheconcentrationinthefilteredsamplewasfarlower(belowdetectionlimitof20μg/l),indicatingthatironinthissamplewaspredominantlypresentinformsboundtosuspendedparticleswithinthewaterratherthanindissolvedform.
Nomaximumpermissibleconcentrationsaresetforothermetalswithinsuchwastewaters.However,itisnoteworthythatanumberofothermetalswerepresentatrelativelyhighconcentrationsinmanysamples,considerablyaboveconcentrationstypicallyfoundinuncontaminatedsurfacewaters,especiallyaluminium(upto184000μg/l,or184mg/l),andalsonickel(upto1690μg/l,IND14017),zinc(upto3880μg/l,IND14015)andcopper(upto1890μg/l,IND14017).
Threesamples(IND14015,IND14017andIND14029)hadnotablyhigherconcentrationsofaluminium(94700-184000μg/l,or94.7-184mg/l),nickel(1360-1690μg/l),zinc(3210-3880μg/l)andcopper(100-1890μg/l)comparedtootherwastewaters.Twoofthesesamples(IND14015&IND14029)hadthelowestpHofallwastewatersamplesandalsocontainedthehighestconcentrationofeitheriron(IND14015)ormanganese(IND14029).Toalesserextent,concentrationsofchromium,cobalt,mercuryandvanadiumwereelevatedinsomewastewatersamples,particularlyforIND14015andIND14017.Theseadditionalmetalsmayalsobepresentinthesamplesatelevatedconcentrationsasaresultofhavingbeensolubilisedfrommineralsinthelocalenvironment.
Overall,thedataindicateastronglinkbetweenhighacidity(lowpH)inwastewaters(particularlyforthosebelowpH4)andelevatedconcentrationsofmetals(especiallyiron,manganeseandaluminium),predominantlyinsolubleforms(see Figure 1 below).Thedataalsoindicatethatthereiscommonlyalinkbetweenhighconcentrationsofironand/ormanganeseinwastewatersandhigherconcentrationsofothermetals.
TherelevantregulationsetparametersonlyforpH,twometals(ironandmanganese),andtotaldissolvedsolids.Theremaybeotherlocationsequivalenttothoseinvestigatedinthisstudyforwhichdataareavailableforwastewatersfromcoalminingfromotherstudieswhicharelimitedtothesefourparameters.ThedatafromthisstudyindicatethatitislikelythatwastewatersatotherequivalentlocationswithlowpHmayalsohavehighconcentrationsofmetals,particularlyironandmanganese,andalsothathighconcentrationsofironandmanganeseinwastewatersmayalsoindicatehighconcentrationsofothermetals.
1 MOE(2003)IndonesiaMinistryofEnvironment(MOE)DecreeNo.113onWastewaterQualityLimitforCoalMiningActivities(BakuMutuAirLimbahBagiUsahadanatauKegiatanPertambanganBatuBara).http://jdih.menlh.go.id/

Greenpeace Research Laboratories Analytical Report 04-2014 | 6
Coal Mines Polluting South Kalimantan’s Water
Appendix 1.a: Details of methodologies
Preparation
Toobtaintotalmetalconcentrations,arepresentativeportionofeachwholewatersamplewasacidifiedbytheadditionofconcentratednitricacidtogiveafinalconcentrationof10%v/v.Separately,aportionofeachwholesamplewasfilteredthrougha0.45micronfilterandthenacidifiedinthesamewaytoenabledeterminationofdissolvedmetalconcentrations.50mlofeachacidifiedsamplewasdigestedfirstlyovernightatroomtemperature,thenusingmicrowave-assisteddigestionwithaCEMMARSXpresssystem,withatemperaturerampto180ºCover15minutesfollowedbyholdingat180ºCforafurther15minutes.Cooleddigestswerefilteredandmadeupto50mlwithdeionisedwater.
Analysis
PreparedsampledigestswereanalysedbyInductivelyCoupledPlasmaAtomicEmissionSpectrometry(ICP-AES)usingaVarianMPXSimultaneousSpectrometer.Multi-elementstandardsatconcentrationsof0.5,1.0,2.5and5.0mg/lrespectively,andmatrixmatchedtothesamples,wereusedforinstrumentcalibration.Anysampleexceedingthecalibrationrangewasdilutedaccordingly,induplicate,andre-analysed.Analysisofthearsenic,mercuryandseleniumcontentinthesampleswascarriedoutseparatelyusingcoldvapourgenerationICP-AESthroughreactionofthesamplewithsodiumborohydride(0.6%w/v),sodiumhydroxide(0.5%w/v)andhydrochloricacid(10molar)withtheresultingvapourcarriedinastreamofargonintothespectrometer.Twocalibrationstandardswereprepared,at10μg/land100μg/l(mercury)andat100μg/land500μg/l(arsenic&selenium),matrixmatchedtothesamples.
Quality Control
ThreesampleswerepreparedforICPanalysisinduplicateandanalysedtoverifymethodreproducibility,alongwithablanksample(10%v/vnitricacidindeionisedwater),andtwomixedmetalqualitycontrolsolutions(4mg/land0.4mg/lforeachmetalrespectively,otherthanmercuryat0.8mg/land0.2mg/l).Allcontrolsampleswerepreparedinanidenticalmanortothesamples.
CalibrationoftheICP-AESwasvalidatedbytheuseofqualitycontrolstandardsat4mg/land0.4mg/lpreparedinanidenticalmannerbutfromdifferentreagentstockstotheinstrumentcalibrationstandards.Forcoldvapourgenerationarsenic,mercuryandseleniumanalysis,thecalibrationwasvalidatedusingqualitycontrolstandardat80μg/l(mercury)and400μg/l(arsenicandselenium),preparedinternallyfromdifferentreagentstock.
pH Measurement
ThepHofeachwatersamplewasdeterminedinthefieldatthetimeofsamplecollection.Inaddition,thepHofeachwastewaterwasmeasureduponreceiptofthesamplesatthelaboratory.InbothcasesthemeasurementwasrecordedusingaHannaInstrumentsHI98129pHmetercalibratedusingpH4.01andpH7.01Hannabuffersolutions,rinsingwellwithdeionisedwaterbetweensamples.
FIGURE 1: RELATIONSHIPS BETWEEN PH AND THE DISSOLVED CONCENTRATIONS OF THREE METALS IN SAMPLES OF WATER
AND WASTEWATER COLLECTED IN THE VICINITY OF COAL MINING OPERATIONS IN INDONESIA
300000
250000
200000
150000
100000
50000
00 1 2 3 4 5 6 7 8 9
Iron (Fe)
pH
Concentration(ug/l)
200000
180000
160000
140000
120000
100000
80000
60000
40000
20000
0
0 1 2 3 4 5 6 7 8 9
Aluminium (Al)
pH
Concentration(ug/l)
45000
40000
35000
30000
25000
20000
15000
10000
5000
0
0 1 2 3 4 5 6 7 8 9
Manganese (Mn)
pH
Concentration(ug/l)
Coal Mines Polluting South Kalimantan’s Water
7 | Greenpeace Southeast Asia – Indonesia
Cover Photo:
©greenpeace/YudhiMahatma
Acidpondleftbycoalminingactivities,Asam-Asam,
South Kalimantan
Acknowledgment:
AbdulAziz,ArifFiyanto,HildaMeutia,HindunMulaika,
RiezkyRamadani,SaptaAnandaProklamasi.
Image:
ErikWirawan,RichiRaimba,UletIfansasti,YudhiMahatma.
Design:
Babul Royani
Contact:
Greenpeace Southeast Asia
Greenpeaceisaglobalorganisationthatusesnon-violent
directactiontotacklethemostcrucialthreatstoour
planet’sbiodiversityandenvironment.Greenpeaceisa
non-profitorganisation,presentin40countriesacross
Europe,theAmericas,Africa,AsiaandthePacific.
Greenpeace Southeast Asia - INDONESIA
MegaplazaLt.5,HR.RasunaSaidKav.C3,
Jakarta12920
greenpeace.org/seasia/id