Embed Size (px)
Citation preview
GEOLOGICAL SURVEY CIRCULAR 94
Deeember 1950
COAL RESOURCES OF THE UNITED STATES
A progress report, November 1, 1950
By
Paul Averitt and Louise R Berryhill
UNITED STATES DEPARTMENT OF THE INTERIOR Oscar L. Chapman, Secretary
GEOLOGICAL SURVEY W. E. Wrather, Director
Washington, D. C.
Free on a lication to the Geololrical_S_Ul"Yl .__Washi ton..25 --L----------

CONTENTS
Introduction ............................................................................... " . Preparation of coal-reserve estimates ......................................................... .
Rank of coal ................................................. .' .......................... . Original, remaining, and recoverable reserves ............................................ . Percentage of coal recovered in mining ......... · .......................................... . Procedures used in estimating reserves .................................................. .
Thickness of beds ................................................................. . Areal extent of beds ................................................................ . Overburden ........................................................................ . Measured, indicated, and inferred reserves .......................................... . Weight of coal ............................... ~ ..................................... .
Distribution of coal in the United States ........................................................ . illinois ................................................................................. . Indiana ................................................................................. . Kansas ................................................................................. . Maryland ............................................................................... . Michigan ............................................................................... . Missouri. .............................................................................. . Montana ................................................................................ . New Mexico .............................................................. , ............. . North Carolina ......................................................................... . Ohio ................................................................................... . Pennsylvania .........................................................................•.. West Virginia .......................................................................... . Wyoming ............................................................................... . Other states ............................................................................. . Alaska ................................................................................. .
Coking-coal reserves ............. ~ ......................................................... . World coal reserves ....................................... · ................................. . Relation of coal in the United States to other sources of energy ................................... . Life expectancy of United States fuel reserves ............. ~ ........................... : .. · ..... . Conclusions ................................................................................ . References ................................................................................. .
ILLUSTRATIONS
Paqe 1 3 3 3 8 8 9 9 9
11 11 11 12 12 12 13 14 15 15 16 18 19 19 21 21 28 23 23 25 27 29 32 32
Figure 1. Coal fields of the United States. . . . . . . . .. . . . . . . . . . . . . . . . . . . . . . . . . . . . . . . . . . . . . . . . . . . . . ii 2. 3. 4.
5.
Table 1. 2. 3.
4.
5.
Remaining coal reserves of the United States, January 1, 1950........................ 2 Heat value of coal of different ranks comtJared to proximate analyses. . . . . . . . . . . . . . . . . . . 6 Remaining coal reserves of the ·united States, January 1, 1950, by states accordirg to
tonnage and heat value ............................. , . . . . . . . . . . . . . . . . . . . . . . . . . . . . . 10 Percentage of total energy supplied by mineral fuels and water power, 1900-1949........ 28
TABLES
Coal reserves of the United States, January 1, 1950, by rank......................... 4 Coal reserves of the United States, January 1, 1950, by states .................. I • • • • • 5 Estimated original coal reserves of the world by continents and principal
coal-producing counties. o 0 I I I o I o I I I o 0 o o 0 0 0 0 I I o o o I o o o o o I 0 I I I 0 0 0 0 0 0 0 0 0 0 o o I I I 0 0 0 0 0 26 Total ultimately recoverable mineral-fuel reserves of the United States, January 1,
1950 .•..... 0 •••••••••••••• 0 ••••••••••••••••••• 0 •••••••••••••••••••••••••••••• '30 Total assured recoverable mineral-fuel reserves of the United States, January 1,
1950. I I I o 0 0 0 0 0 0 0 o o o o o I 0 0 0 0 o o I 0 o 0 o 0 0 0 o 0 0 o 0 0 0 0 0 o 0 0 o 0 0 0 0 o 0 0 0 0 o 0 0 o o 0 0 0 0 0 0 o 0 0 o 0 o 0 I 31
-~ -~ Anthracite
and semionthrocite
Low-volatile bituminous cool
Medium- and high-volatile bituminous cool
Subbituminous cool
§gg~~~ Lignite
,-:7-'-- ' ,/ "' --""\.. wq- I ;---~-t.--r',..--,--
'
• .,...._.~, : • r I . ., ·, ., • I I I '
A• '- I , ',/ I ', ~ • ___ , cP ~ r .. "" .. ';;, ~ . . \ .:. ~ \ \ • ,: • ' I. . ' , .~ •. - ) I I ~ • I I ---( I ..-----\
)
t\~ ____ ,
. ~-r . . I
I
\' r--'\.. '~ '~ ""! ,,
0 200 400 600 Miles :?"';..-
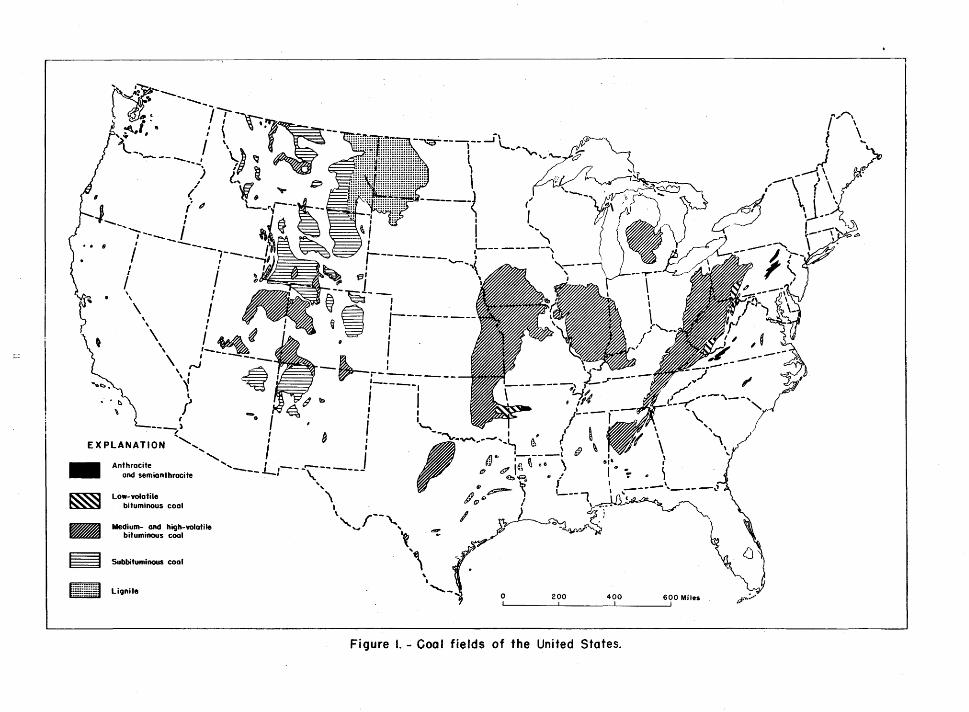
Figure I.- Coal fields of the United States.
COAL RESOURCES. OF THE UNITED STATES
By
Paul Averitt and Louiae R. Berryhill
INTROD.UCTION
Interest in the quantity and quality of the coal reserves of the United State:;; has increased greatly since the end of World War II, principally because of the growing realization that the ultimate reserves of petroleum and natural gas, although largely undefined, still. have finite limits. With the greatly increased use of petroleum and natural gas, it has become further apparent that the reserves of these two fuels, whatever their ultimate limits may prove to be, are being consumed at a rate far surpassing that anticipated a few years ago. At some time in the future, therefore, the contribution of coal to the total production of energy in this country must inevitably be enlarged to include some of the needs now served by petroleum and natural gas.
Although coal-bearing rocks cover 14 percent of the total area of the United States {fig. 1) and contain enormous reserves, it is equally apparent that reserves of coal also have limits. In the extensively mined sections in the East it is already increasingly difficult to locate new areas containing thick beds of high-rank and high-quality coal to replace areas that have been mined out. Furthermore, a considerable part of the total reserves of the United States consists of coal of lignite and subbituminous ranks and coal contained in thin beds that can be mined only with great difficulty
and expense. At the present time, therefore, the depletion of reserves of high-rank and high-quality· coal, particularly the Eastern coal that is suitable for the manufacture of metallurgical coke, is a more serious problem than the percentage depletion of the total coal reserves.
Recog:p.izing the need for more detailed estimates of ·coal reserves than those that have been available in the past, the U. S. Geological Survey is now preparing a reappraisal of the coal reserves of the United States
'in which primary emphasis is placed on the amounts of coal in separate categories according to rank,thickness of coal, and thickness of overburden. Many of the state geological surveys in coal-producing areas are also preparing new appraisals of coal reserves. The increasing volume of geologic data available on the occurrence of coal and the detailed and careful methods now employed in calculating reserves should ultimately provide a more reliable estimate for the coal reserves of the United States than has been obtainable previously, although much additional work remains to be done.
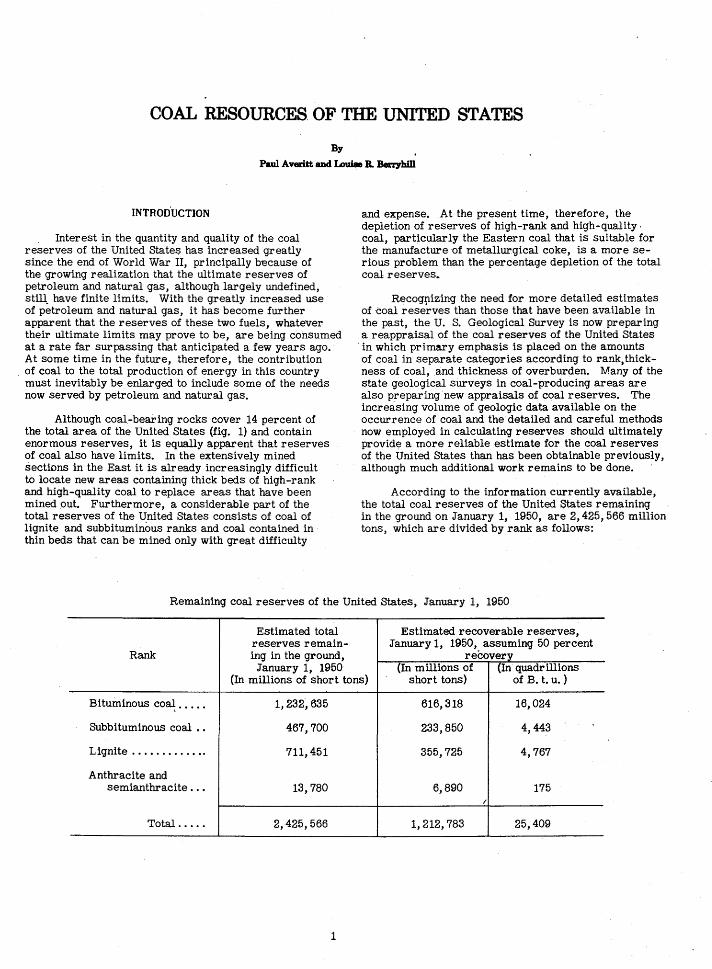
According to the information currently available, the total coal reserves of the United States remaining in the ground on January 1, 1950, are 2, 425,566 million tons, which are divided by rank as follows:
Remaining coal reserves of the United States, January 1, 1950
Estimated total Estimated recoverable reserves, reserves remain- January 1, 1950, assuming 50 percent
Rank ing in the ground, recovery January 1, 1950 (In millions of (In quadrillions
(In millions of short tons) short tons) of B. t. u.)
Bituminous coal ..... 1, 232,635 616,318 16,024
Subbituminous coal .. 467,700 233,850 4,443
Lignite ............. 711,451 355,725 4,767
Anthracite and semianthracite ... 13,780 6,890 175
I
Total ..... 2,425,566 1, 212,783 25,409
1

I Anthracite ond semionthrocite
A
I I
I s
Bituminous cool
Sobbl-o <OOI . rn 00 bUUoo lono
IJ Lignite
L
L.lt.C.
Figure 2. - Remaining cool reserves of the United States, January I, 1950
These totals, which are somewhat less than the previous, widely quoted estimates of M. R. Campbell of the U. S. Geological Survey, are based on new appraisals of coal reserves in Michigan, Montana, New Mexico, North Carolina, and Wyoming, prepared since 1948 by the U. S. Geological Survey; on appraisals of reserves in illinois, Kansas, Missouri, Pennsylvania, and West Virginia, prepared by the geological surveys of those States;and on the older estimates of Campbell for the remaining states. Both for past and for estimated future losses in mining, the more realistic figure of 50 percent has been used, instead of the figure of 34. 7 percent derived in 1923 by the U. S. Bureau of Mines for the U. S. Coal Commission (Rice and Paul, '1923) and used in preparing most of of the previous estimates of the U. S. Geological Survey. ·
PREPARATION OF COAL-RESERVE ESTIMATES
All estimates of coal reserves are based largely on detailed geologic maps showing the outcrops and correlations of the individual coal beds and on accompanying geologic reports giving detailed measurements of the coal thickness. This information is augmented locally by data from exploratory and development drilling. Unfortunately, many coal-bearing areas in the United States have not been mapped geologically; many others have been mapped only in reconnaissance; and few have been prospected other than along the outcrops of the beds. Progress toward full knowledge of the coal reserves of the United States depends, therefore, upon an active program of detailed geologic mapping and exploratory drilling. Such detailed work is in progress on a modest scale by the U. S. Geological Survey and several State agencies.
The U. S. Geological Survey is also preparing summary appraisals of coal reserves by states. All the published information on the thickness and extent of coal beds, together with unpublished data contained in the files of the U. S. Geological Survey and State surveys and data from mining and drilling companies, is used as a basis for these summary estimates. The reserve figures are classified according to rank and thickness of coal, thickness of overburden, and abundance of reliable information concerning the presence of coal at a distance from mines, drill holes, or outcrops. The· reserve estimates for Michigan, Montana, New Mexico, North Carolina, and Wyoming have been presented previously in separate detailed publications.. These studies, together with available reserve estimates published by the State geological surveys of illinois, Kansas, Missouri, Pennsylvania, and West Virginia, provide the basis for the provisional tables included in this circular. (See table_s 1 and 2 and fig. 2. ) For other states, where little or no detailed summary work on coal reserves has been carried on, the estimates used in the new provisional tables are those of M. R. · Campbell as reprinted by Hendricks and others. (Hendricks, 1939; Buch, Hendricks, and Toenges, 1947). It should be noted that the Campbell estimates were made on a more generous basis than the recent estimates and, although appearing in the same tables, are not directly comparable. To alter these figures arbitrarily by some purely mathematical method for use in this progress report would be unnecessarily confusing, however, particularly in view of the fact that the revision of certain of these state estimates is now in progress by the Geological Survey.
3
Estimates ·of coal reserves based on information currently available are inevitably only provisional estimates and are subject to change as mapping, prospecting, and development are continued.
At the present stage of knowledge, therefore, estimates of coal reserves must be based on many assumptions as to the thickness, extent, and correlation of the coal beds and other pertinent factors. These factors are described in the following paragraphs as a basis for explaining the points of similarity and difference between the estimates of reserves in different states presented in the accompanying tables.
RANK OF COAL
Coal is classified by rank according to percentage of fixed carbon and B. t. u. content. As shown in figure 3, the percentage of fixed carbon and the B. t. u. content, except in anthracite, increase from the lowest to the highest rank of coal as the percentages of volatile matter and moisture decrease. The reduction of volatile matter and moisture and the accompanying increase in fixed carbon took place progressively during the process by which plant material deposited in swamps and marshes in the geologic past was transformed into coal. The lower layers of plant material in the swamps were first compacted under successive layers of vegetation. Later, as the sea covered the coal swamps, the accumulated weight of sediments deposited on the sea floor further compressed the plant material and caused successive reductions in the amounts of volatile matter and moisture. Locally, deformation of the coal-bearing sediments by movements of the earth's crust also aided in the process of coalification. The ranks of coal--lignite, subbituminous coal, bituminous coal, and anthracite--represiO!nt successive stages in the formation of coal.
The standard classification of coal by rank in use in the United States is that established by the American Society for Testing Materials (1939). This classification, which is reproduced on page 7, is used uniformly in classifying all coal-reserve estimates. As coals of different rank are adaptable to different uses, rank is the major basis of differentiation shown in figures 1 and ~ and in tables 1 and 2.
ORIGINAL, REMAINING, AND RECOVERABlE ~mVES
The coal reserves shown in tables 1 and 2 are further classified as original reserves, remaining reserves, and recoverable reserves. Original reserves are reserves of coal in the ground before the beginning of mining operations. In the calculation of original reserves no allowance is made for past production· and losses in mining or for future losses. Remaining reserves are reserves in the ground as of the date · of appraisal and are obtained by subtracting past production and losses f'i-om original reserves. Recoverable reserves are reserves of coal in the ground as of the date of appraisal that can actually be produced in the future and are obtained by subtracting estimated future losses in mining from the remaining reserves.
The preparation of an estimate of original reserves is essential to the successful determination of remaining and recoverable reserves because it provides a base figure from which other figures can be derived. An estimate of original reserves, although subject to
State
Table 1.--Coal reserves of the United States, January 1, 1950, by rank (In thousands of short tons)
Reserves depleted to January 1, 1950
Produced and Estimated lost in mining, Remaining original Produced ];/ assuming past reserves, reserves losses equal January 1, 1950
production
BITUMINOUS COAL
Recoverable reserves,
January l, 1950 assuming
50-percent recovery
Alabama •••••••••• 67,570,000 821,590 1,6h3,180 65,926,820 32,963,410 Arkansas • • • • • • • • • 1,396,000 82,785 165;570 . 1,230,430 615,215 Colorado ••••••••• 213,071,000 357,719 715,~38 212,355,562 1o6,177,781 Georgia • • • • • • • • •• . 933,000 11,533 23,066 m,9Jl&. lJ5l.L,967 Illinois ••••••••• 171,905,000 3,131,997 6,263,99~ 165, ,006 82,826,503 Indiana •••••••••• 53,051,000 984,137 1,968,27~ 51, ,726 2i,541,363 Iowa ••••••••••••• 29,160,000 ~3,162 686,3~ 28,473,676 1 ,2)6,838 Kansas ••••••••••• £/ 17,574,000 Jl 9,800 Jl 19,600 17,554,400 ,777,200 Kentucky ••••••••• 123,327,000 1,951,803 3,903,606 119,423,39~ 59,711,697 Maryland ••••••••• 8,043,000 I./ 2$9 1,92~~30 519,886 7,523,11~ 3,761,557 Michigan ••••••••• 296,900 ~ 46 2/ 11,000 219,900 109,950 Missouri ••••••••• 79,362,016 · 257,7 7 5
615,574 78,846,4h2 39,423,221
Montana •••••••••• 2,362,610 31,491 2,982 2,299,628 · 1,149,614 New Mexico ••••••• 10,947,700 88,169 176,378 10,771,322 5,385,661 North Carolina ••• .110,462 1,054 2,108 108,)54 5~,177 Ohio ••••••••~•••• 86,497,000 1,694,259 3,388,518 8),108,462 41,55[,?41 Oklahoma ••••••••• 54,951,000 158,846 317,692 54,633,308 27,316,6$4 Pennsylvania ••••• 75,093,459 7,416,9$6 14,~)3,912 60,259,5~ 30,129,774 Tennessee •••••••• 25,665,000 324,718 049,436 25,015,5 12,507,782 Texas •••••••••••• 8,000,000 10,7o6 21,412 71 978,58 3,989,294 Utah ••••••••••••• 88,184,000 195,833 391,666 87,792,3Jh 43,896,167 Virginia ••••••••• 21,149,000 538,867 1,077,774 20,071,226 10,035,613 Washington ••••••• 11,413,000 123,8~ 247•608 11,165,392 5,582,696 West Virginia •••• 116,618,447 4,979,385 9,958,770 106,659,677 53,329,838 Wyoming •••••••••• 13,234,950 230,272 460,544 12,774,4o6 6,)87,29) Other states §I •• 820,000 4,956 9,9i2 810,088 405,044
~------~--~------~~-4~----~~--+-------~---+----~~~~
Total •••••• 1,280,735,544 24,057,852 48,100,224 1,232,635,320 616,317,660
SUBBITUMINOUS COAL·
Colorado ••••••••• 104,175,000 107,5o6 215,012 103,959.986 ll,979.96i Montana •••••••••• 132,151,o60 124,~ ~,088 131,901,972 5.9l0,9 New Mexico ••••••• 50,801,200 32,22 ·i52 50,736,748 25,3 8,3l~ Utah •••••••••••• • 5,156,000 2,832 5, 64 5,150,336 2,575,1 Washington ••••••• 52,41J2,ooo 19,100 le.,200 52,40~,800 26,201,900 Wyomingy ••••••••• 108,318,900 132,103 2 ,2o6 108,05 ,69~ 54,027,3~7 Other states 1/ .• 15,500,000 3,832 7,664 15,492,33 7.746,1 8
Total •••••• 468,544,160 422,143 844,286 467,699,874 233,849.937
LIGNITE
Arkansas ••••••••• 90,000 0 0 90,000 i5,000 Montana •••••••••• 87,533,270 1,21i 2,426 87,5~,8~ 43.7 5,422 North Dakota ••••• 6oo,ooo,ooo 67,85 135,712 599,8 ,2 299.932,144 South Dakota ••••• 1,020,000 921 1,8rz 1,01 ,158 ~,,079 Texas •••••••••••• 23,000,000 51,341 102,6 2 22,897,318 11, ,659 Wyoming Y ••••••• --- --- --- --- ---Other states 3/ •• 49.963 1 2 49.961 24,981
Total •••••• 711,693,233 121,332 242,664 711,450,569 355,725,285
ANTHRACITE AND SEMIANTHRACITE
Arkansas ••••••••• 230,000 9,109 18,218 211,782 1~,891 Colorado ••••••••• 100,000 5,921 11,8~ 88,158 ,073 New Mexico ••••••• 5,700 1,092 2,1 ~ 3,516 1,75 Pennsylvania ••••• 22,805,000 4,916,oo6 9,832,01 12,972,388 6,486,~9% Virginia ••••••••• 500,000 9.592 19,184 480, 16 2lj.o,ij.o Washington ••••••• 23,000 0 0 23,000 11,500
Total •••••• 23,663,700 4.941.720 9,883,440 13,780,260 6,890,130
Total, all ranks • 2,484,636,637 29,543,047 59,070,614 2,425,566,023 1,212,783,012
!/ Production, 1800 through 1885, from The first century and a quarter of American coal induatry, by H. N. Eavenson, privately printed, Pittsburgh, 1942; production, 1886 through 1949, from u. s. Bureau of Mines Minerals Yearbooks, unless otherwise indicated.
~ Remaining reserves, Januar1 1, 1946. 11 Production, January 1, 1946; to January 1, 1950. ~ Michigan Geological Survey Division, as cited in U. s. Geological Survey Circular 77,
Po 56, 1950o 5/ Past losses assumed to be 40 percent of coal originally in the ground. 2/. Includes Arizona, California, Idaho, and Oregon. 7/ Includes Arizona, Calif'ornia, and Oregon.· ~ Small reserves and production of' lignite included under subbituminous coal. 2/ Includes Calif'ornia and Louisiana.
c:J1
State Bituminous coal
Alabama ••••••••• 67,570,000 Arkansas •••••••• 1,396,000 Colorado •••••••• 213,071,000 Georgia ••••••••• 933,000 Illinois •••••••• 171,905,000
Indiana ••••••••• 53,051,000 Iowa •••••••••••• 29,160,000 Kansas •••••••••• y 17,574,000 Kentucky •• ~ ••••• 123,327,000 Maryland •••••••• 8,043,000
Michigan •••••••• 266,900 Missouri •••••••• 79.3 2,016 Montana ••••••••• 2,362,610 New Mexico •••••• 10,947.700 North Carolina •• .110,462
North Dakota •••• Ohio •••••••••••• 86,497,000 Oklahoma •• •••••• 5~.951,000 Pennsylvania •••• 7 ,093.459 South Dakota •••• ---Tennessee ••••••• 25,665,000 Texas ••••••••••• 8,000,000 Utah •••••••••••• 88,184,000 Virginia •••••••• 21,149,000 Washington •••••• 11,413,000
West Virginia ••• 116,61e,447 Wyoming ••••••••• 13,234,950 Other states •••• 11 820,000
Total ••••• 1;280,735,544
Table 2.--Coal reserves of the United States, January 1, 1950, by states (In thousands of short tons)
Estimated original reserves Reserves depleted to January 1, 1950
Produced and
Produced 11 lost in mining,
Subbituminous Lignite Anthracite Total assuming past coal and losses equal
semianthraci te production
--- --- --- 67,570,000 821,590 1,6~3,180 90,000 230,000 1,716,000 91,89~ 1 3,788
104,175,000 --- 100,000 317,346,000 471,14 942,262 --- --- --- 933,000 11,533 23,0 6 --- --- --- 171,905,000 3,131,997 6,263,994
--- --- --- 53,0$1,000 984,137 l,t8,274 --- --- --- 29,160,000 343,162 86,~24 --- -·- --- y 17,.574,000 ll 9,800 ll 19, 00 --- --- --- 123,327,000 1,951,803 3,903,606 --- --- --- 8,043,000 2.59.943 519,886
--- --- --- 2t,900 1!1 46,2~0 il 77,000 --- --- 79.3 2,016 257,7 7 515,57~ 132,151,060 87,533,270 --- 222,04,6,640 157,248 314,49 50,801,200 --- 5,700 61,754. 00 121,507 243,01~ --- --- --- 110,462 1,054 2,10
--- 6oo,ooo,ooo --- 6oo,ooo,ooo 67,856 135.712 --- --- --- 86,497,000 1,69~,2~6 3,388,~18 --- --- --- 54,A51,ooo 15 ,8 ~17, 92 --- --- 22,805,000 97. 98.459 12,332,9 2 24, 65,~2i --- 1,020,000 --- 1,020,000 921 1, 4
--- --- --- 25,665,000 324,718 649.436 23,000,000 --- 31,000,000 62,0~7 124,094
5,156,000 --- --- 93.l40,000 198,6 5 396.330 --- 500,000 21, 4.~,000 548,479 1,0~ ,~58 52,442,000 --- 23,000 63,87 ,000 lj.i.2,904 2 5, 08
--- --- 116,618,~7 4.979,385 9.958, 770 ~108,318,900 ~ --- 121,553, 50 362,375 724,750 y 15,500,000 49.963 --- 16,369.963 8,799 17,578
468,544,160 711,693~233 23,663,700 2,484,636,637 29,543,047 59,070,614
Recoverable reserves,
Remaining January 1, 1950, reserves, assuming
January 1, 1950 50-percent recovery
65,926,820 32,96l,410 1,532,212 76 ,106
316,403,708 1$8,201,854 609,93~ ~54.967
165, 41,00 82, 20,503
51,082,626 25,541,363 29,4,7~. 76 1~,2.36,838 17.,5 ,400 ,777,200
119, 23,394 59.711,697 7,523,114 3,761,557
216,900 109,950 78,34 ,442 39.~23,221 221,732,~ 110, 66,222
61,511,5 30,755.793 108,354 54,177
599,86%,298 299.932,144 8~,10 ,482 41,55~,241 5 ,633,308 2l·~l ,65~ 73,232,535 3 ' 16,26 1,018,158 • 509,079
25,015,56~ 12,507,782 30,875.60 15,437.953 92,942, 70 46.47~,335 20,552,042 10,27 ,021 63,592,192 31,796,096
106,659,677 53,329,838 120,1329,100 60,41~,550 16,352,385 8,17 ,193
2,425,566,023 1,212,783,012
1886 11 Production, 1800 through 1885, from The first century and a quarter of American coal industry, by H. N. Eavenson, privately printed, 1942; production,
through 1949, from u. s. Bureau of Mines Minerals Yearbooks, unless otherwise indicated.
~ Remaining reserves, January 1, 1946. Production, January 1, 1946, to January 1, 1950. Michigan Geological Survey Division, as cited in u. S. Geological Survey Circular 77, p. 56, 1950. Past losses assumed to be 40 percent of coal originally in the ground.
~ Small reserves of lignite included under subbituminous coal. 71 Includes Arizona, California, Idaho, and Orego.n. ]V Includes Arizona, California, and Oregon. ~ Includes California and Louisiana.
B. t.u. 14,000
10,000
8,000
6,000
4,000
2,000
0
Percent 100
80
60
40
20
0
17:.------ r;7;
/ ~ / ~
B 0 N
Figure 3.- Heat value of coal of different ronks compared to proximate analyses. Upper diagram: Comparative heat value of typical samples of the several ranks of coal, computed on
samples as received, on the ash-free basis. Lower diagram: Variation in the fixed ·carbon, volatile matter, and moisture of samples used in upper diagram, computed on samples as received, on the ash-free basis.
6
CLASSIFICATION OF COALS BY RANK." Legend: F.C. -Fixed Carbon. V.M.- Volatile Matter. Btu. - British thermal units.
Class Group i
1. Meta-anthracite ..............•..
2. Anthracite ...................•..
I. Anthracitic
3. Semianthracite ..................
1. Low volatile bituminous coal. ...
2. Medium volatile bituminous coal.
II. Bituminousd 3. High volatile A bituminous coal.
4. High volatile B bituminous coal.
5. High volatile C bituminous coal.
1. Subbituminous A coal. ..........
III. Subbituminous 2. Subbituminous B coal. ..........
3. Subbituminous C coal. ..........
IV. Lignitic I 1. Lignite ......................... 2. Brown coal .....................
Limits of Fixed Carbon or Btu. Mineral-Matter-Free
B . asts
Dry F .c .. 98 per cent or more (Dry V.M., 2 per ce.nt or less)
Dry F .C., 92 per cent or more and less than 98 per cent (Dry V.M., 8 percent or less and more than 2 per cent)
Dry F .c., 86 per cent or more and less than 92 per cent (Dry V .M., 14 per cent or less and more than 8 per cent)
DryF.C., 78percentor.more and less tlian 86 per cent (Dry V .M., 22 per cent or less and more than 14 per cent)
Dry F.C., 69 per cent or more and less tlian 78 per cent (Dry V.M., 31 per cent or less and more than 22 per cent)
Dry F .c., less than 69 per ceni1 (Dry V.M., more than 31 per
cent); and moistc Btu., 14,()()C11 or more
.Moistc Btu., 13,000 or more and less than 14,()()()8
Moist Btu., 11,000 or more and less than 13,~
Moist Btu., 11,000 or more and less than 13,()()()8
Moist Btu., 9500 or more and less than 11,()()C11
Moist Btu., 8300 or more and less than 95()08
Moist Btu., less than 8300 Moist Btu., less than 8300
Requisite Physical Properties
N onagglomerating b
Either agglomerating or nonweath~ring/
Both weathering and nonagglom_erating
Consolidated Unconsolidated
This classification does not include a few coals which have unusual physical and chemical properties and which come within the limits of fixed carbon or Btu. of the high-vola.tile bituminous and subbituminous ·ranks. All of these coals either contain less than 48 per cent dry, mineral-matter-free fixed carbon or have more than 15,500 moist, mineral-matter-free Btu. •
b If agglomerating, classify in low-volatile group of the bituminous class. c Moist Btu. refers to coal containing its natural bed moisture but not including visible water on the surface of the
coal. d It is recognized that the-:-e may be noncaking varieties in each group of the bituminous class. • Coals having 69 per cent or more fixed carbon on the dry, mineral-matter-free basis shall be classified according to
fixed carbon, regardless of Btu. I There are three varieties of coal in the.high-volatile C bituminous coal group, namely, Variety 1, agglomerating
and nonweathering; Variety 2. agglomerating and weathering; Variety 3, nonagglomerating and nonweathering.
7
change with new mapping and exploration, is essentially a constant, needing no date nor explanation to make it understandable. From this estimate the figures for remaining and recoverable reserves, which must be dated, can be determined annually, if desired, from -available information on production and losses or from surveys of mined-out areas.
The only instance in which coal reserves can be calculated successfully without reference to original reserves is in virtually mined-out areas where remaining reserves are small and clearly defined. -In rn,ost coal areas in the United States, however, the remaining reserves still closely approximate the original reserves. This is particularly true in the West, where relatively little mining has been done.
PERCENTAGE OF COAL RECOVERED IN MINING
For calculating remaining and recoverable reserves, reasonably accurate figures for_ the past production of coal can be obtained from statistics on annual production. The figures for past and estimated future losses of coal in mining, also needed in. these calculations, are not so easily obtained. In localities covered by detailed mine maps, past losses in mining can be determined by a comparison of production figures with measurements of areas known to be mined out. The necessary detailed maps are not available, however, for many of the coal-mining areas in the United States, and the estimates of individuals familiar with local mining operations provide,in general, the only indication of the relative tonnages of coal that are recovered and lost in mining.
The percentage of the total coal recovered in mining varies to a considerable extent, depending upon such factors as the structure of the coal beds and the methods used in mining. In calculating remaining and recoveral:lle reserves on a regional or national scale, therefore, an average figure for the estimated percentage of recovery in the past and in the future must be derived from a consideration of the relatively few detailed studies available. Most studies of recoverability involve consideration of individual mines or small areas and typically indicate a higher recoverability than studies of larger areas. In some individual mines, for example, as much as 80 or 90 percent of the coal in the block actually being mined may be recovered. From the total-resource point of view, however, recoverability appears to be only about 50 percent of the coal in the ground. This marked difference is due to the fact that studies of recoveral>ility in larger areas include consideration of coal that is left in barrier pillars, in restricted areas around oil and gas wells, under towns, raib;oads, roads, and streams, in rider beds, in thin and impure beds, and in areas of faulting and folding, as well as the more conspicuous losses in the block · or blocks of coal actually being mined.
The results of an investigation by Cady {1949) of the coal resources of Franklin County, Ill., for example, have shown a recovery of less than 50 percent of the coal originally present in the No. 6 bect in that county. A similar study by Flint (1949) has indicated that the recovery of coal in Perry County, Ohio, betweeri 1838 and 1948 was only 43 percent of the amount originally present. In Michigan the recovery of coal has averaged about 60 percent of the total ·coal in the ground, according to the estimates of Frank Pardee, Mining Engineer,
8
Michigan Geological Survey Division, and Louis Gabrick, Mine Inspector, Michigan Department of Labor (Cohee and others, 1950, p. 5). B. W. Dyer· has stated in a personal communication that in his opinion mining operations in Utah have not been able to recover more than 50 percent of the total coal in the ground. ·
Eavenson (1946) has estimated that the actual recovery from the Pittsburgh bed in Pennsylvania is not more than 50 to 60 percent because of the large amount of coal that is left in the barriers, in reservations for oil and gas wells, under buildings, and in the rider above the main bed. In calculating the remaining reserves of bituminous coal in Pennsylvania, Ashley (1944) assumed a recovery of 50 percent for all coal in the State with the exception of that in the Pittsburgh ped.'; , for which he assumed a recovery of 66 2/3 percent~ Ashley's figures were based on the percentage recovery of coal in Fayette County, · Pa. , as determined by Moyer {Hickok and Moyer, 1940). The weighted average recovery of bituminous coal in Cambria County, Pa., was determined by Dowd and others (1950) to be 48. 77 percent.
As the results of these recently completed studies seem to be in accord, the estimated Temaining and recoverable reserves of coal shown in tables 1 and 2 are based on the assumption that past mining operations have recovered only 50 percent of the coal in the ground and that this rate will be maintained in the future. Many individual operations recover more than 50 percent of the coal in the ground, however, and it is to be hoped that the general introduction of more efficient mining methods will result in a higher average recoverability in the future than the 50-percent factor assumed in the preparation of tables 1 and 2.
As production statistics generally include only the output of the larger mines, the total recorded production figures used in tables 1 and 2 are some-what less than actual production. Thus the past losses in mining, which are assumed in tables 1 and 2 to be equal to past production, are also somewhat less than actual losses. Therefore, the remaining and recoverable reserves as reported in tables 1 and 2 are somewhat higher than they would be if full and complete data were available for the amounts of coal mined and lost in mining.
PROCEDURES USED IN CALCULATING COAL RESERVES
Estimates of. coal reserves, like those of :other mineral resources, are based on a series of assumptions in addition to the facts available from geologic observations, mining, and drilling. No uniform method .has been adopted for calculating coal reserves, and estimates of the tonnage of coal within individual areas tend to vary greatly, depending upon the assumptions and procedures used in preparing the estimates. An estimate of coal reserves has meaning, therefore, only when consider.ed in relation to the procedure followed in obtaining it_.
For practical purposes, two cut-off points are required in calculating coal reserves--one at the minimum thickness of coal included in the estimate and another at the maximum thickness of overburden allowed above the coal. To date, however, no opinion is generally accepted as to what figures represent the practical limits to be used for the thickness of coal
beds and of overburden. A very conservative estimate may include only the original reserves in thick beds and under slight overburden--in other words, reserves that could be recovered profitably under current mining conditions. A more inclusive estimate, on the other hand, may consider thinner, mor~ impure, and more deeply buried coal as recoverable by improved methods when more easily mined deposits have been exhausted.
Other standards, in addition to those involving thickness of coal beds and of overburden, are employed in calculating coal-reserve estimates. The weight or specific gravity of the coal is determL."led or assumed, and the method of determining the extent of coal underground at a distance from an outcrop, mine, or drill hole is s.elected. Again, these standards vary with individual estimates, and the tonnages of coal in the estimates vary accordingly.
The U. S. Geological Survey, in order to produce uniformity of thinking and procedure on the part of Survey coal geologists, has adopted a set of procedures to be used in the calculation of coal reserves. Estimates of coal reserves thus obtained can easily be combined in county, state, and nr>.tional totals of comparable value.
These procedures, which were prepared jointly by members of the Geological Survey and the Bureau of Mines and include recommendations of the National Bituminous Coal Advisory Council, are discussed in the following paragraphs.
THICKNESS OF BEllS
In areas where coal beds are oi varymg thick-nesses, the average thickness of each bed is determined for use in calculations of reserves. No standard procedure for determining such thickness is in use, but generally an average thickness or weighted average thickness is obtained from the observed thicknesses of the coal bed at various locations within the area. Occasionally, in older coal-reserve estimates, the "modulus of irregularity" has been used to determine the probable minimum thickness of a coal bed. According to this formula, the probable minimum thickness is obtained by multiplying the average of the measurements of the thickness of the coal bed by ( 1 • Y), in which S is the sum of all measurements and SD is the sum of the numbers obtained by subtracting from the average each measurement below it or subtracting the average from each measurement above it.
The modulus of irregularity was originally adopted by the U. S. Geological Survey as a mechanism in establishing the value of coal lands, (Smith, HH3) but it is no longer used for this purpose. As described in U. S. Geological Survey Bulletin 537, it was devised as a safeguard for the buyer of coal lands in areas where the coal beds vary in thickness within wide limits. Computation of the thickness of the coal by using the modulus of irregularity permitted the "thickness of the coal under any tract of land to be considered as less than the average of the measurements. For while the coal is as likely to be just above the average as just below, and mathematically, is more likely to be just the average thickness than any other, yet a cautious buyer bargaining for coal would always want to discount the probability a little as a matter of safety." The·modulus of irregularity is cumbersome and inappropriate for use in the appraisal of coal reserves.
9
According to the procedures of the U. S. Geological Survey, coal reserves are calculated and reported by beds in categories of thickness as follows:
Anthracite, semianthracite, and bituminous coal More than 42 inches 28 to 42 inches 14 to 28 inches
Subbituminous coal and lignite More than 10 feet 5 to 10 feet 2! to 5 feet
The thickness of a coal bed is evaluated wherever. possible by the use of isopach lines. Generally, however, the data are insufficient for this purpose, and average figu.res, which are weighted according to the approximate area of bed represented by each observation, are used. If the points of observation are not evenly spaced, the weighting is accomplished by assigning intermediate values for the thickness at places where data are needed to fill out a system of evenly spaced points. Where this procedure is followed to obtain the weighted' average thickness along the outcrop of a . persistent bed, the two end points of minimum thickness are also included in the average. Where the points of observation are fairly evenly spaced, as in an exploratory or development drilling program, a simple average is deemed sufficient. ·
Partings more than three-eighths of an iuch thick are omitted in determining the thickness of individual · beds. Beds and parts of beds made up of alternating layers of thin coal and partings are omitted if the parting3 make up more than one-half the total thickness or if the ash content exceeds 33 percent. Benches of coal of·less than the minimum thicknesses stated, which lie above or below thick partings and which normally would be left in mining, are also omitted.
AREAL EXTENT OF BEDS
The areal extent of coal beds included in U. S. Geological Survey reserve estimates may be determined in several ways. Where the continuity. of the bed is well known from maps of the outcrop, rriine workings, and drill holes, the entire area of the known occurrence of the bed is taken, even though points of observation are widely spaced. Persistent beds that have been traced around a basin or spur are considered to underlie the area enclosed by the outcrop. Otherwise, the length of outcrop within the thickness limits listed is considered to determine the presence of coal. in a semicircular area having a radius equal to one-h~ the length of the outcrop. The total area of coal is considered to extend beyond such a semicircle if mine workings or drill holes so indicate, in which case coal is considered to e~tend only 1 mile beyond the limits of the mine workings. An isolated drill hole too far removed to be incorporated in the area thus defined is considered to determine the area of coal extending for a maximum radius of half a mile around the hole.
OVERBURDEN
Wherever possible, reserve data are reported by the U. S. Geological Survey in three classes, according to thickness of overburden, as follows:
Billions of tons
Quadrillions of B. t. u.
North Dakota
Colorado
Montana
Illinois
Wyoming
Kentucky
West Virginia
. Utah
Ohio
Missouri
Pennsylvania
Alabama
Washington
New Mexico
Oklahoma
Indiana
Texas
Iowa
Tennessee
Virginia
Kansas
Maryland
Arkansas
South Dakota
Georgia
Michigan
North Carolina
Other states ll
0
0
100 300
7,800
-r1'1//m
E::::::::::J -
400
10,400
500
13,000
Bituminous coal
Subbituminous coal
Lignite Anthracite and
sem i(:mthraclte
Figure 4 .. - Remaining coat reserves of the United States, January I, 1950, by states according to tonnage and heat value
[Upper bar for each state shows coal reserves by tons; lower bar shows cool reserves by B. t. u.l
!I Includes Arizona, California, Idaho, Louisana, and Oregon.
10
600
15,600

0 to 1, 000 feet 1, 000 to 2, 000 feet 2, 000 to 3, 000 feet
MEASURED, INDICATED, AND INFERRF.D RESERVES
On the basis of the relative abundance of reliable data on which the calculations are based, coal reserves are reported by the U. S. Geological Survey in three classes, known as measured, indicated, and inferred.
Measured coal is coal for which tonnage is compu:eJ. from dimensions revealed in outcrops, trenches, mine workings, and drill holes. The points of observation and measurement are so closely spaced, and the thickness and extent of the coal are so well defined that the computed tonnage is judged to be accurate within 20 percent or less of the true tonnage. Although the spacing of the points of observation necessary to demonstrate continuity of coal varies in different regions according to the character of the coal beds, the points of observation are, in general, about half a mile apart.
Indicated coal is coal for which tonnage is computed partly from specific measurements and partly from projection of visible d:ita for a reasonable distance on geologic evidence. In general, the points of observation are approximately 1 mile apart, but they may be as much as 1i miles apart for beds of known geologic continuity.
Inferred coal is coal for which quantitative estimates are based largely on broad knowledge of the geologic character of the bed or region and for which there are few, if any, measurements. The estimates are based on an assumed continuity for which there is geologic evidence. In general, inferred coal lies more than 2 miles from the outcrop.
WEIGHT OF COAL
Where precise data are not available, the following values are assigned as the weight of coal in all U. S. Geological Survey calculations of coal reserves:
Tons per acre-foot Anthracite and semianthracite ------- 2, 666 Bituminous coal--------------------- 1, 800 Subbituminous coal------------------ 1, 770 Lignite------------------ ... ---------- 1, 750
DISTRIBUTION OF COAL IN THE UNITED STATES
Coal deposits are widely distributed throughout the United States, as shown in figure 1, which also shows the very unequal distribution of coal according to rank. Only 30 percent of the total coal reserves of the United States occur east of the Mississippi River, yet this area contains 60 percent of the total reserves of bituminous coal and anthracite. The coal-bearing states west of the Mississippi River contain 70 percent of the total reserves of the Nation, but most of the coal is of lignite, subbi}uminous, or high-volatile bituminous rank. '
This variation in :¢ank of coal according to geographic distribution~is principally the result of differences in age. In he East, and in Kansas, Iowa, Oklahoma, and Arkans s, the coal is of Pennsylvanian
I 11
age; in the West, on the other hand, the coal is of Cretaceous or Tertiary age. The younger Western coal attains high rank only locally, in relatively small areas,where it has been deformed and.altered by the forces that accompanied mountain building and intrusions of igneous rock.
The best grades of coke are manufactured from medium-volatile bituminous coal or from blends of high-volatile and low-volatile bituminous coal. Most of the deposits of coal suitable for the manufacture of metallurgical coke, therefore, are east of the Mississippi River, in areas where mining has been carried on extensively. Some areas in the West, of which the most important are the Raton Mesa region, Colorado-New Mexico, the Sunnyside field, Utah, and the Cre~ted Butte field, Colorado, contain deposits of coal that are used in coke production. These areas stand out prominently in plans for the industrial development of the West.
The far larger reserves of lignite and subbituminous coal in the West have only local value at present, though it seems· certain that they will have greater usefulness in the future. Coal of these ranks tends to crumble during transportation and to ignite by spontaneous combustion if stored without special precautions for too long a period. It also has a lower hea:t value than other coal. On the other hand, the low-rank coal is well suited for the synthetic production of gas and liquid fuels, and, as this coal lies under very light overburden in many parts of the West, it is also well suited for strip-mining, which is being carried on locally in the West with great efficiency.
Most of the tables and illustrations in this report show reserves of all ranks of coal in short tons as computed. In terms of Ultimate usefulness, however, comparison of the reserves of lignite and subbituminous coal, which have relatively low heat values, with reserves of bituminous coal and anthracite, which have higher heat values, can best be made on a uniform B. t. u. basis. Such a comparison is presented in figure 4, which shows the remaining reserves in each state as of January 1, 1950, on both a tonnage and a B. t. u. basis. The B. t. u. content of typical coal in each rank and subdivision is given in figure 3.
As somewhat differem. assumptions and procedures were used to prepare many of the state reserve estimates presented in this report, comparison of the reserves in different states is further facilitated by a consideration of the methods by which each estimate was obtained. Even in the recent appraisals of coal reserves in Michigan, Montana, New Mexico, North Carolina, and, Wyoming, which were prepared by the U. S. Geological Survey according to the basic outline al-ready discussed, minor differences in procedures were necessary becauS'e of differences in the occurrence of the coal and in the amount of information available. Even greater differences in assumptions and procedure exist between estimates prepared by the·State geological surveys of illinois, Kansas, Pennsylvania, and West Virginia. The following summaries, arranged in alphabetical order according to the name of the state, describe and evaluate the various methods followed in preparing the individual state estimates. Wherever possible, the reserve figures for each state are further classified according to thickness of
coal beds, amount of overburden, and abundance of reliable information, in order to give the estimates additional significance and usefulness. States for which no recent estimates are available, and for which the older estimates of M. R. Campbell are used, are included under the heading "Other states."
Although the methods employed in preparing appraisals of reserves in a few states are markedly different from those used in the majority of states, no attempt has been made in any of the tables or illustrations used throughout this report to introduce arbitrary mathematical adjustment in the published figures. It was felt that the differences represent studied decisions by the appraisers and are due probably to .differences in the occurrence of the coal, amount of information available for making an appraisal, and other local factors not susceptible to simple mathematical adjustment. The different methods employed have given results of somewhat different magnitude, however, and deserve careful consideration.
IUJN01S
The original reserves of coal in illinois, as estimated by Cady, ( 1946) totaled 171, 905, 000, 000 tons, all of bituminous rank. Cady based his reserve figure for the most part upon a consideration of the previously published estimates of the coal reserves of various mining districts in illinois (Cady, 1915, 1916, 1917, 1919, 1921; Culver, 1925; Kay, 1915; Kay and White, 1915), and also upon more recently acquired data about the coal beds in the State. (Cady, 1944, p. 44}.
All coal beds averaging 2 feet or more in thickness were included in the estimate. In the calculation of the reserves a specific gravity of 1. 3, or a weight per acre-foot of 1, 770 tons, was assumed.
Tables were prepared to show the distribution of the total coal reserves of illinois by counties and by mining districts. As most of the coal in illinois lies under a moderate overburden, no attempt was made to classify the reserves according to thickness of overburden, nor were attempts made to classify the reserves according to bed thickness or abundance of reliable information used in making the reserve estimate.
INDIANA
The estimated original reserves of coal in Indiana, according to Campbell, totaled 53,051,000,000 tons, all of bituminous rank. This figure is based upon detailed estimates by Ashley (1898 and 1908).
In the 1898 report Ashley estimated the original coal reserves of Indiana to be 39,618,240,000 tons but later, in 1908, increased the figure to 46,864,000,000 tons. The original publication shows the total coal reserves of Indiana classified by coal beds and by cou.-·1ties; the supplementary publication shows reserves by counties only. In both estimates, Ashley included all coal beds 1 foot or more in thickness and assumed a specific gravity of 1. 15, or a weight of 1, 560 tons per acre-foot, for the coal. In the actual calculations of reserves, however,· Ashley rounded off the figure for the weight of the coal and used a factor of 1, 500.
Ashley estimated the recoverable coal reserves of Indiana as of January 1, 1908, to be 13,621, 600,000
12
tons. In obtaining this figure, he included all beds 2! · feet or more in thickness and assumed a recovery of 60 percent for the coal. On this basis, the recoverable reserves of the State in beds 2! feet or more thick are 29. 2 percent of the original reserves.
Campbell accepted Ashley's 1908 estimate for the total coal reserves of Indiana but recalculated the estimate to the selected specific gravity of 1. 3,or a weight of 1; 770 tons per acre-foot, for the coal. In making the recalculation Campbell apparently compared Ashley's stated figure of 1, 560 tons per acrefoot to his own preferred figure of 1, 770 tons per acrefoot and thereby obtained a total of 53,051,000,000 tons.
KANSAS
The estimated potential bituminous coal reserves of Kansas remaining in the ground on January 1, 1946, totaled 17, 574, 000,000 tons, of which 949,323,000 tons is classified as proved reserves. The proved reserves include .60, 000,000 tons of coal which can be produced by strip-mining methods under present conditions. These estimates were made in 1945 and 1946 by Abernathy, Jewett, and Schoewe (1947) on the basis of geologic data collected by the State Geological Survey of Kansas and drilling records obtained from coal-mining companies·. Tables were prepared to show the distribution of proved and potential reserves by co~ties and by coal beds.
In calculating the proved reserves, with the exception of that part classified as strippable coal, the following table was used to indicate the minimum thick-· ness of coal considered minable at various depths:
Maximum depth to coal (In feet)
Minimum thickness of co"'l (In inches)
100 w 150 18 200 22 600 32
1,200 36 The minimum thickness of coal beds included in proved strippable reserves and in potential reserves was 10 inches. Strippable coal considered in the reserve estimate had a maximum depth of 60 feet or an overburden of not more than 35 cubic yards per ton of coal. The maximum overburden used in determining proved coal reserves was 1 200 feet and the maximum overburden for potential r~serves ~as 3, 000 feet, the maximum generally used in estimating coal reserves in the United States.·
The proved reserves of coal, as defined in the report of the State Geological Survey of Kansas, wet'~ those lying within a reasonable distance from a. known occurrence of coal based on the experience of the coal industry and on geofogical observations of the continuity of coal beds in Kansas. The limits of potential reserves, on the other hand, were based on the general regional stratigraphic continuity of the coal-bearing rocks. In calculating the area underlain by proved reserves, a measured thickness of coal at an outcrop, at a drill hole, or in a mine was considered to prove the presence of coal of the same thickness under 1 square mile. Two or more known occurrences of the same coal bed ·within a distance of 4 miles along the line of strike were considered to prove the bed to be continuous between these points. In calculating the potential
reserves, a measured thickness of coal at an outcrop, at a drill hole, or in a mine indicated the oresence of coal of the same thickness under 400 square miles. The areas of both classes of coal reserves were greatly reduced in many places because of additional information .about the location of poor coal, thin coal, or the absence of coal.
In computing the tonnages of coal in the Kansas report, a specific gravity of 1. 1, or a weight per acre-foot of 1, 500 tons, was assumed. This is a very low specific gravity for average bituminous coal in the ground, which more generally is assumed to have a specific gravity of 1. 3'2, or a weiqht of 1, 800 tons per acre-foot. Had the average weight of the coal in Kansas been assumed to be 1, 800 tons per acre-foot, the estimate of reserves remaining in the ground on January 1, 1946, would have been increased 20 per cent, to 1, 139, 187,600 tons for the proved reserves and 21, 086, 800, 000 tons for potential reserves. The more conservative figures, based on a weight of 1, 500 tons per acre-foot, are preferred by the members of the Kansas Geological Survey, however, and these figures are used in tables l and 2.
MARYLAND
The original reserves of coal in Maryland, all of bituminous rank, totaled 8, 043,000,000 tons as estimated by Campbell in 1928. The coal-bearing rocks _occur in three parallel structural troughs that extend northeastward across Garrett and Allegany Counties in the western part of the State. Within these three troughs, five separate coal fields, or coal basins, are recognized. The easternmost trough is divided by the Potomac and Savage Rivers into the Georges Creek basin to the north and the Upper Potomac basin to the south. The central trough is divided into the Castleman basin to the north and the Upper Youghiogheny basin to the south. The westernmost trough is known as the Lower Youghiogheny basin. According to Campbell, the original reserves of coal in each of these basins were as follows:
Campbell included in his estimate coal 14 inches or more thick lying under as much as 3; 000 feet of overburden. He assumed a specific gravity for the coal of 1. 3 or a weight of 1, 770 tons per acre-foot In estimating the coal reserves of Maryland, Campbell had only a small amount of data available on the thickness and continuity of the beds, and, in the tight of more recent mapping and exploratory drilling, his estimate now appears to be considerably larger than
·the actual amount of coal in the State that can be mined under present economic conditions .. Campbell's estimate serves, however, to show the approximate relative distribution of reserves in the five basins.
In 1949, the results of a cooperative program of drilling and geologic investigations by the U. S. Bureau of Mines and the U. S. Geological Survey in the Georg~s Creek basin and the northern part of the Upper Potomac basin in Maryland were published by the Bureau of Mines. (Toenges and others, 1949} This study showed that on January 1, 1947, remaining measured and indicated reserves of 399,214,000 tons were present in beds 18 inches or more thick lying below the Pittsburgh bed. Of this total, 56, 118,000 tons was in beds 18 to 24 inches thick, 220,059,000 tons in beds 24 to 36 inches thick, and 123,037,000 tons in beds more than 36 inches thick. Because of the depth at which much of the coal· occurs in the Georges Creek and Upper-Potomac basins, however, few of the beds· under 36 inches thick can be mined profitably.
The Georges Creek basin and the northern part of the Upper Potomac basin covered by the cooperative study include approximately 60 percent of the coal reserves in Maryland according to Campbell's figures on the relative distribution of reserves in the five basins. On this basis, the total remaining measured and indicated reserves of the State as of January 1, 1947~ in beds 18 inches or more thick were about 665 million ' tons.
Original coal reserves of Maryland by basins as estimated by M. R. Campbell
Original reserves (In short tons) Percent of total
Georges Creek basin ......... 4,373,000,000 50
Upper Potomac basin ......•.. 1,664,000,000 20
Castleman basin ............. 229,000,000 5
Upper Youghiogheny basin .... 1,035,000,000 15
Lower Youghiogheny basin .... 742,000,000 10
Total ........ 8,043,000,000 100
13
MICmGAN
As estimated by Cohee and others (1950) the original coal reserves of Michigan totaled 296, 900,000 tons. This figure includes remaining reserves as of January 1, 1950, totaling 219, 900,000 tons plus an estimate for coal mined and lost in mining to January 1, 1950, totaling 77,000,000 tons. The reserves remaining on January 1, 1950, include 124,870, 000 tons of measured reserves, 28, 980,000 tons of indicated reserves, and 66,050,000 tons of inferred reserves. The estimate of 77, 000,000 tons for coal mined and lost in mining to January 1, 1950, includes the recorded production of 46,.239, 607. tons, plus an allowance for coal lost in mining estimated by Pardee and Gabrick (see page 8 . ) to be equal to about 40 percent of the coal originally in the ground. To prepare the estimate, which is classified to show the distribution of total reserves by counties and by townships, data were assembled from published and unpublished reports in the files of the Michigan Geological Survey Division, and more than 2, 500 logs of coal test wells and several hundred sets of drill cuttings from exploratory wells for oil and gas were examined. ·
As coal in Michigan occurs sporadically in isolated beds that vary greatly in thickness and generally pinch out in relatively short distances, satisfactory estimates of extent and average thickness were possible only for relatively small areas. In preparing the estimate of Michigan coal reserves, therefore, · o'nl.y those areas having adequate test-hole information were considered, and no estimate was attempted for a large part of the Michigan coal basin where coal should be present but where specific information was lacking. The part of the coal basin for which the necessary information was available was confined to the-Saginaw Valley, south and southeast of Saginaw Bay, and included 33 townships in Bay, Tuscola, Midland, Saginaw, Huron, Shiawassee, and Genesee Counties.
The measured coal reserves in Michigan were divided into the following categories according to the thickness of the coal beds:
More than '42 inches 28 to 42 inches 14 to 28 inches
The measured reserves were also divided into
14
the followinc] categories according to the· thickness of overburden:
50 to 100 feet 100 to 200 feet 200 to 300 feet 300 to 400 feet
No attempt was made to break down the indicated and inferred reserves into thickness and depth categories because of the small amount of information available on these reserves. The indicated and inferred reserves· are contained in beds 14 inches or more thick, however, and are less than 400 feet below the surface.
In classifying the reserves according to the relative abundance and reliability of the information on which the estimate was based, the usual U. S. Geological Survey standards were modified slightly to accord with the geologic nature of the coal beds in Michigan. Measured coal was defined as coal blocked out by closely spaced drilling, and the outer limit of a block of measured coal was drawn within a few hundred feet of the outermost points of positive information. This conservative assumption was necessary to define measured coal in Michigan because of the known lack of continuity of the beds. Indicated coal was defined as coal for which tonnage estimates were based prim~ily on thickness measurements in isolated drill holes. It was assumed that the thickness of coal observed in the drill holes was representative of the area covered by a circle having a radius of one-eighth mile with the drill hole as its_ center. Inferred coal was defined as coal for which tonnage estimates were based on the isolated drill holes that were also used in computing indicated reserves. The. general rule was to limit inferred coal to the area lying outside the one-eighth mile circle containing indicated reserves, and inside a circle with a radius of one;;. -fourth mile. In some areas, however, where drill holes were more than half a mile but less than 1 mile apart, and where the evidence indicated that the coal was fairly persistent, some reserves were inferred to be present between the holes. In calculating the reserve figures, the coal in Michigan was assumed to have a specific gravity of 1. 32, or a weight of 1, 800 tons per acre-foot.
The accompanying table shows the estimated remaining coal reserves of Michigan as of January . 1, 1950, classified ac;.cording to thickness of bed, thickness of overburden, and abundance of reliable information.
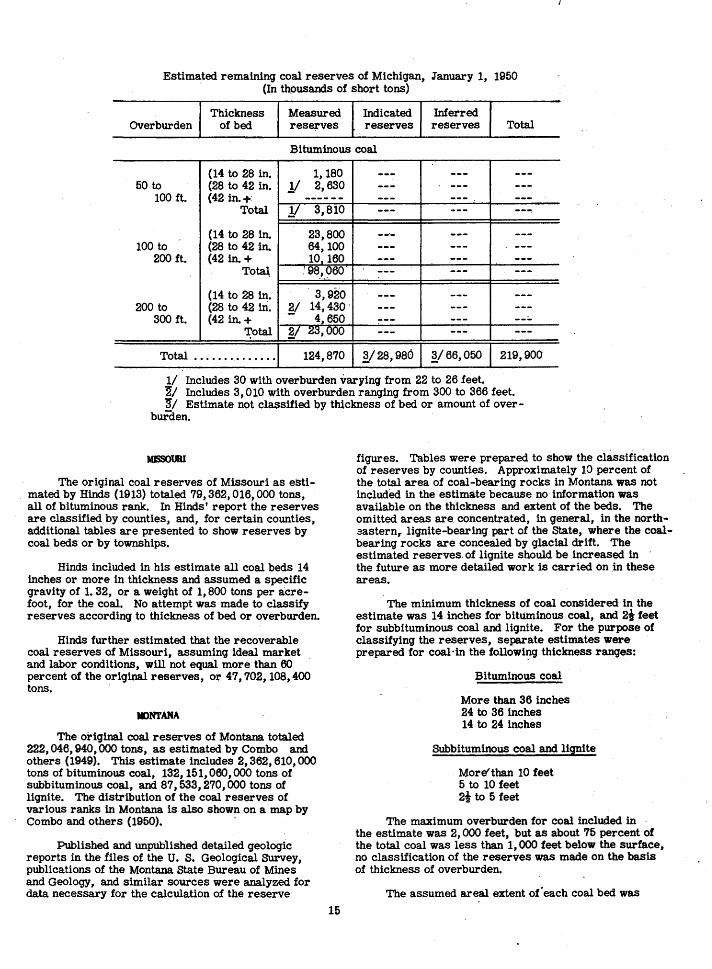
Estimated remaining coal reserves of Michigan, January 1, 1950 · (In thousands of short tons)
Thickness Overburden ofbed
Measured reserves Total
Bituminous coal
(14 to 28 in. 1,180 --- --- ---50 to (28 to 42 in. 11 2,630 --- --- ---
100ft. (42 in.-t-: ------ --- --- ---Total !I 3,810 --- ---
(14 to 28 in. 23,800 --·- --- ---100 to (28 to 42 in. 64,100 --- --- ---
200ft. (42 in.+ 10.160 --- --- ---Total, '98_,_960 --- --- ---
(14 to 28 in. 3,920 --- --- ---200 to (28 to 42 iri. y 14,430' --- --- ---
300ft. (42 in.+ 4.650 --- ---~otal W' G;:i, 000 --- --- ---
Total .............. J 124,870 1 y 28,980 1 _y 66,050 1 219, ooo 1/ Includes 30 with overburden varying from 22 to 26 feet. ~/ Includes 3, 010 with overburden ranging from 300 to 366 feet. '!! Estimate not cl8$sified by thickness of bed or amount of over-
burden.
MISSOURI
The original coal reserves of Missouri as estimated by Hinds (1913) totaled 79,362,016,000 tons, all of bituminous rank. In Hinds' report the reserves are classified by counties, and, for certain counties, additional tables are presented to show reserves by coal beds or by townships.
Hinds included in his estimate all coal beds 14 inches or more in thickness and assumed a specific qravity of 1. 32, or a weight of 1, 800 tons per acrefoot, for the coal. No attempt was made to classify reserves according to thickness of bed or overburden.
Hinds further estimated that the recoverable coal reserves of Missouri, assuming ideal market and labor conditions, will not equal more than 60 percent of the original reserves, or 47, 702, 108,400 tons.
II>NTANA
The original coal reserves of Montana totaled 222, 046, 940,000 tons, as estimated by Combo and others (1949). This estimate includes 2, 362, 610,000 tons of bituminous coal, 132, 151,060,000 tons of subbituminous coal, and 87, 533,270,000 tons of lignite. The distribution of the coal reserves of various ranks in Montana is also shown on a map by Combo and others (1950). ·
Published and unpublished detailed geoloqic reports in the files of the U. S. Geoloqical Survey, publications of the Montana State Bureau of Mines and Geology, and similar sources were analyzed for data necessary for the calculation of the reserve
15
figures. Tables were prepared to show the classification of reserves by counties. Approximately 10 percent of the total area of coal-bearing rocks in Montana was not included in the estimate because no information was available on the thickness and extent ot the beds. The omitted areas are. concentrated, in general, in the northaastern,. lignite-bearing part of the State, where the coalbearing rocks are concealed by glacial drift. The estimated reserves. of lignite should be increased in · the future as more detailed work is carried on in these areas.
The minimum thickness of coal considered in the estimate was 14 inches for bituminous coal, and 2i feet for subbituminous coal and lignite. For the purpose of classifying the reserves, separate estimates were prepared for coal·in the followi~g thickness ranqes:
Bituminous coal
More than 36 inches 24 to 36 inches 14 to 24 inches
Subbituminous coal and lignite
More" than 10 feet 5 to 10 feet 2t to 5 feet
The maximum overburden for coal included in the estimate was 2, 000 feet, but as about 75 percent of the total coal was less than 1, 000 feet below the surface, no classification of the reserves was made on the basis of thickness of overburden.
The assumed areal extent of each coal bed was
Estimated original coal reserves of Montana (In thousands of short tons)
Overburden Thickness Measured and Inferred Unclassified. Total of bed indicated reserves reserves
reserves
Bituminous coal
(14 to 24 in. 278,780 167,080 --- 445,860 0 to (24 to 36 in. 347,690 143,740 --- 491,430
2, 000 ft. (36 in.+ 1,036,330 . 388,990 --- 1 425 320 Total 1,662,800 699,810 --- 2,362,610
Subbituminous coal !
(2-! to 5 ft. 5, 392,110 2,326,150 --- 7,718,260 0 to (5 to 10ft. 15,485,620 9,245,940 --- 24,731,560
2,000 ft. (10ft.+ 26,370,190 15,974,920 --- 42,3~5, 110 (Unclassified --- --- 57,356 130 57,356,130
Total 47,247,920 27,547,010 57,356,130 132, 151,,060
Lignite
(2! to 5 ft. 4,876,170 0 to (5 to 10ft. 6,613,070
2, 000 ft. (10ft.+ 2,566,030 (Unclassified ---
Total 14,055,270
Total, all ranks .............. 62,965,990
determined according to the standard U. S. Geological Survey methods. Coal in the narrow weathered zone at the outcrop was included in the assumed areas of coal occurrence, as was also coal under roads, railroads, and the like. All known areas of burned coal, however, were excluded.
Two classes of coal based on the quantity of reliable information available for making reserve estimates were established, as follows: Measured and indicated reserves include coal for which positive information about thickness and extent was available from surveys of the outcrop, mine workings, and drill records. The extent of such coal underground was limited everywhere, however, by a line drawn 2 miles from the outcrop, so that all coal classed as measured and indicated was less than 2 miles from the outcrop and more than 50 percent was less than 1 mile from the outcrop. Inferred reserves include .. in general, coal lying more than 2 miles from the outcrop.
On the basis of about 20 specific-gravity determinations of coal from various parts of Montana, a specific gravity of 1. 3, or a weight of_ 1, 770 tons per acre-foot, was selected as being representative of lignite and subbituminous coal. A specific gravity of 1. 32, or a weight of 1, 800 tons per acre-foot, was selested as being representative of all the bituminous coal except that in the Red Lodge field, Carbon County, which was assigned a specific gravity of 1. 39, or a weight of 1, 890 tons per acre-foot.
16
10,177,750 --- 15,053,920 13,135,880 --- 19,748,950
435,000 --- 3,001,030 --- 49,729,370 49,729,370
23,748,630 49,729,370 _87' 533, 270
. 51, 995,450 107,085,500 222,046,940
The accompanying table shows the estimated original coal reserves of Montana classified according to rank, thickness of bed, and abundance of reliable information.
NEW.MEXJCO
The original coal reserves of New Mexico totaled 61, 754, 600, 000 tons, as estimated by Read and others (1950). This figure includes 50,801, 200,000 tons of subbituminous coal, 10,947,700,000 tons of bituminous coal, and 5, 700, 000 tons of anthracite. The estimate of the total coal reserves of New Mexico, which is classified to show reserves by counties and coal fields, was based on published and unpublished geologic and mining data ,concerning the coal fields. Drilling data were used where . available, but exploratory drilling for coal has been carried on only in a few areas in the State.
The minimum thickness of coal considered in the estimate was 2! fee~ for subbituminous ·coal and 14 inches for bituminous coal and anthracite. Reserve figures for the different ranks of coal were classified by thickness of bed as follows:
Subbituminous coal
More than 10 feet 5 to 10 feet 2! to 5 feet
Estima.ted oriqinal coal reserves of New Mexico (In thousands of short tons)
Overburden Thickness Measured Indica.ted Inferred Reserves Total of bed reserves reserves reserves inferred
by zones
Bituminous coal
(14 in.+ --- ---- --- 2,377,900 2,377,900 0 to (14 to 28 in. 72,800 359,100 334,300 --- 766,200
1, 000 ft. (28 to 42 in. 151,900 334,200 27,100 --- 513,200 (42 in.+ 429~500 611,600 360, 100 --- 1,401,200
Total 654,200 1,304,900 721,b00 2,377,900 b,Ob8,b00
(14 in.+ --- --- __ ... 1,763,600 1,763,600 1, ooo·to (14 to 28 in. 400 7,100 694,300 --- 701,800
2,000 ft. (28 to 42 in. --- 39,400 355,400 --- 394,800 (42 in.+ --- 69,40Q 715,300 --- 784~700
Total 400 115,900 1,765,000 1,7~3,600 3,644,900
(14 in.+ --- --- --- 1,838,900 1,838,900 2,000 to (14. to 28 in. --- 2,600 25,300 --- 27,900
3,00? ft. (28 to 42 in. --- 600 --- --- 60o· (42 in.+ --- --- 376,900 --- 376,900
Total --- 3,200 402,200 1,838,900 2,244,300
Total ••.••...•.•••• 654,600 1,424,000 2,888,700 5,980,400 10,947,700
Subbituminous coal
(2! ft.+ --- --- --- 16,363,500 16,363,500 Oto (2! to 5 ft. 446,800 1, 021,300 1,227,000 --- 2,695,100
1, 000 ft. (5 to 10ft. 228,100 348,400 997,.600 --- 1,574,100 (10ft.+ . 151, 600 160,900 --- --- 312.500
Total 826,500 1,530,600 2,224,600 16,363.500 20,945,200
(2! ft.+ --- --- --- 13,154,700 13,154,700 1,000 to (2! to 5 ft. --- 60,900 165,300 --- 226,200
2,000 ft. (5 to 10 ft. --- 39,100 743,800 --- 782,900 (10ft.+ --- 121,300 537,800 --- 659,100
Total · --- 221,300 1,446,900 13,154,700 14,822,900
(2! ft.+ --- --- --- 13,288,000" 13,288,000 2,000 to (2t to 5 ft. --- 3,600 502,000 --- 505,600
3,000 ft. (5 to 10ft. --- 12, 100 448,600 --- 460,700 (10ft.+ --- --- 778,800 --- 778_J800
Total --- 15,700 1,729,400 13,288,000 15,033,100
Total ••.••........• 826,500 1,767,600 5,400,900 42,806,200 50,801,200
Anthracite
(14 in.+ --- --- --- --- ---0 to (14 to 28 in. 900 2,500 --- --- 3,400
1, 000 ft. (28 to 42 in. 1,400 300 --- --- 1,700 (42 in.+ 500 100 --- ./--- 60()-
Total 2,800 2,900 --- _,__ 5,700
Total •••.•.•••••..• 2,800 2,900 ~,709
Total, all ranks . ; ........ . 1,483,900 a, 194,500 18,289, ooo 148,786,600 161,754, 60o
17
Bituminous coal and anthracite More than 42 mcfies 28 to 42 inches 14 to 28 inches
In areas where information about thickness of coal beds was reasonably adequate because of drilling and mining development, isopach lines were drawn on the coal beds and were used to determine variations in thickness and to establish boundaries between coal in the several thickness categories. In many districts, however, where the data were restricted to outcrop measurements, it was possible only to determine approximate thicknesses at critical points by interpolation.
Coal lying more than 3, 000 feet below the surface was not included in the estimate. For coal less than 3, 000 feet in depth the following categories of reserves were established according to thickness of overburden:
0 to 1, 000 feet 1, 000 to 2, 000 feet 2, 000 to 3, 000 feet
The coal reserves of New Mexico were further classified according "to the relative abundance and :-eliability of the information on which calculations were based. The categories of measured, indicated, and inferred reserves were established according to the U. S. Geological Survey standards already described. One further category was added, however, to provide for reserves which, because of the geologic nature of the coal beds and the· topography and structure of the larger coal-bearing areas, would not fit into any of the thr~e categories generally used. In New Mexico the coal beds commonly occur in zones as a series of lenticular deposits interbedded with other sedimentary rocks. Although single coal beds in New Mexico are limited in extent, the coal-bearing zones are very persistent and may be regional in occurrence. In consequence, the usual analysis of reserves by beds would not indicate the total reserves of the interior parts of the Sari· Juan Basin or the Raton Mesa field. The coal zones were therefore subjected to further examination as zones instead of individual beds, and the additional reserves thus derived were included in a category ter:med "Inferred by ~one."
The methods used for coal-zone calculations were similar to those used for coal beds, and the same minimum thicknesses for coal of different ranks and the same ranges in overburden thickness were established.
In calculating the reserves of New Mexico, the bituqainous coal was assumed to have a specific gravity of 1. 32, or a weight of 1, 800 tons per acrefoot; the subbituminous coal was assumed to have a specific gravity of 1. 3, or a weight of 1, 770 tons
18
per acre-foot; and ttle anthracite was assumed to have a specific gravity of 1. 47, or a w~ight of 2, 000 tons per acre-foot.
The estimated original reserves of New Mexico, classified according to rank of coal, thicknes~ of bed, amount of overburden, and abundance of reliable information, are shown in the accompanying table.
NOR111 CAROUNA
All the coal of commercial quality in :r...rorth Carolina is containeid in the Deep River field in Chatham, Lee, and Moore Counties. The original reserves of this field, as estimated by Reinemund (1949} totaled 110,462,000 tons . The reserve estimate includes
·only coal in the main bench of the ·Cumnock coal bed and in the Gulf coal bed; it does not 1ncluoe coal in the lower benches of the Cumnock bed, which, in general, are too high in ash, too thin, and too far below the main bed for profitable mining. In addition to bituminous ccal, the estimate includes small amounts of semianthracite and anthracite where the coal bas been altered locally by igneous intrusions.
The reserves were divided into three classes according to the thickness of the coal, and separate estimates were prepareq for reserves in beds 14 to 24 inches thick, beds 24 to 36 inches thick, and beds more than 36 inches thick.
The reserves were also classified on the basis of overburden, and separate estimates were made for coal less than 2, 000 feet in depth and for coal lying between 2, 000 and 3, 000 feet in depth. No coal more. than 3, 000 feet below the surface was inclu~ed in the estimate. ·
A further classification of the reserve figures was made according to the relative abundance of reli8.ble information regarding the continuity and thickness of the coal beds. Reserves were classed as measured where the tonnages were computed from thi · knesses shown in closely spaced drill holes, mine workings, and outcrops; as indicated where the tonnages were computed partly from s~ific measurements and partly from projections of visible data; and as inferred where computations were based entirely on geologic evidence without benefit of actual measurements.
In calculating the reserves of the Deep River field, a s:Pecific gravity of 1. 32,or a weight of 1, 800 tons per acre-foot, was used for all coal except that metamorphosed by contact with the. intrusive igneous rocks. A specific gravity of 1. 47, or a weight of 2, 000 tons per acre-foot, was assumed for this metamorphosed coal.
The accompanyinj table shows the estimated original coal reserves of North Carolina classified acco_rding to thickness of bed, amount of overburden, and relative abundance of reliable information.
Estimated oriqinal coal reserves of North Carolina (In thousands of short tons)
Overburden Thickness of bed
Measured reserves
Total
Bituminous coal
(14 to 24 in. 8,423 Oto (24'to 36 in. 8,027
2,000 ft. (36 in.+ 15.635 Total 32,085
(14 to 24 in. ---2,000 to (24 to 36 in. 1,063
3,000 ft. (36 in.+ ---Total 1,063
Total ..••....... · .•• 33,148
omo
According to combined estimates of Clark (1929) and Flint (1949), the oriqinal coal reserves of Ohio totaled 86, 497,000,000 tons, all of bituminous rank. In 1929 Clark estimated the oriqinal reserves of Ohio to be 87,638,000, OOOtons, of which 2, 141,000,000 tons was estimated to be in Perry County. On the basis of new geologic work in 1949 Flint recalculated the reserves of Perry County and estimated the original reserves to be only 1, 000,000,000 tons. This new figure has been added to Clark's estimate for the remainder of the State to give the present total reserve estimate. ·
·clark based his estimate, which includes a table showing reserves by counties and by coal beds, upon data assembled for the most part from reports of the Geological Survey of Ohio. All coal in beds 14 inches or more thick to a depth of 3, 000 feet below the surfac~ was included in the estimate. Average thicknesses for each bed by counties were obtained.
The areal extent of the coal underground was determined by various methods depending upon the amount of information available to Clark on each coal bed. Higher beds, whose outcrops encircle upland areas, were assumed to underlie the area enclosed by the outcrop. Except where positive evidence indicated the absence of coal, each of the lower beds was assumed to extend below drainage toward the center of the coal . basin at right angles to the strike for a distance eqwil to the distance that the bed was known to extend above drainS.ge. Where the coal bed was believed to be persistent along its outcrop and r~asonably constant in thickriess~ it was assumed to have the same average thickness below drainage as observed above drainage.
Several of the coal beds in Ohio were not shown on the maps available to Clark. The probable area of these beds had to be determined from maps showing the outcrop of the base of the coal measures, the outcrops of the more important coal beds, and the locations of coal sections; from the records of deep borings; and from references in toe texts of the State reports.
In the calculation of the reserves a specific
19
18,612 23, 561· 50,596 17,943 --- 25,970 3,851 - 19,486
40,406 2;:$,561 96,052
--- --- ---13,347 --- 14,410 --- --- ---
.13,347 --- 14,410
53,753 1 23,561 1 110,462
gravity of 1. 32, or a weight of 1, 800 tons per acrefoot, was ·assumed for the coal.
In the more recent work in Perry County, Flint also used 14 inches as the minimum thickness of coal included in his estimate. Of the seven coal beds that Clark recognized in Perry County, however, four beds were excluded by Flint from his estimate, because detailed mapping showed that m this county these beds generally· are less than a foot thick or are completely missing. In calculating the reserves, Flint assumed the coal to have a specific gravity of 1. 32, or a weight of 1, 800 tons per acre-foot.
Of the total 1, 000,000, 000 tons of coal estimated to have been originally present in Perry County, 208,000,000 tons have been mined out or lost in mining. The remaining reserves as of January 1, 1949, there~ fore total 792, 000, 000 tons.
Flint conducted a study of the recovery of coal in mining operations in Perry County from 1838 to 1948 which showed that during this period only 43 percent of the coal was recovered. This figure was based upon measurements of mined-out areas in the county as compared to production stat~stics. On this basis, the recoverable reserves of coal in Perry County total 340,000,000 tons.
According to an estimate by Ray (1929, p. 330), approximately one-sixth of the total original reserves of coal in Ohio, or 14, 399, 296,000 tons, can be' classi- . fied as reserves of thick, reasonably accessible coal. For his estimate Ray included only coal 2. 7 feet or more thick in 10 specified beds, and he used an assumf!d specific gravity of 1. 1, or a weight of 1, 50Q tons per acre-foot, for the coal. 1 This weight is very low for bituminous coal in the ground, however., and a more accurate, though conservative, figure can be obtained by a recalculation of Ray's estimate using,a specific gravity of 1. 32, or a weight of 1, 800 tons per acre-foot. The estimated original reserves of thick coal in Ohio would thereby be increased 20 percent, to a total of 17, 279, 155, 800 ~ns. ·
PENNSYLvANIA ·
~e original bituminous coal reserves of
Pennsylvania, as estimated by Reese and Sisler (1928), totaled 75,093,459,000 tons. This figure was determined by plotting on county base maps all the information about the area and thickness of the coal beds in the State that could be obtained from the reports of the U. S. Geoloqic;U Survey and the Pennsylvania Geologic and Topographic Survey, and from drill records, mine maps, and personal interyiews with mine operators and others familiar with the coal fields of Pennsylvania.
All coal beds having a minimum thickness of 18 inches were included in the estimate.
An assumed specific gravity of 1. 24, or a weight of 1, 688 tons per acre-foot, was used in calculating the coal reserves of all the counties in Pennsylvania with the exception of Clarion and Jefferson. A. specific gravity of 1. 34, or a weight of 1, 820 tons per acre-foot, was used in computing the coal reserves of these two counties. The specific gravity of 1. 34 not only represents the average weight of the coal in two counties in Pennsylvania as determined by a large number of tests, but it also closely approximates the specific gravity of samples of typical bituminous coal in the ground. The assumed specific gravity ·of 1. 24 used in calculating the coal reserves of most of the counties is low for typical bituminous coal, and therefore, yields a very conservative figure for the coal reserves of Pennsylvania. Had a specific gravity of 1. 34 been used in the· calculations for all the counties, the estimated bituminous coal reserves of Pennsylvania would have ::,een increased by 8 percent to a total of 80,545, 185,000 ~ons.-
Several additional estimates of the coal reserves af small areas in Pennsylvania have been calculated :lnQ can be used as a partial check on the Reese and Sfsler estimate for the entire State. These estimates are di.l?cussed in the following paragraphs.
The coal reserves of two adjoining quadrangles, Punxsutawney and Curwensville, were estimated by S. H. Ashley (1928 and 1940). As Reese and Sisler used counties, townships, and coal beds as a basis for their estimate, Ashley's complete estimate for· two quadrangles cannot be compared with the estimate by Reese and Sisler. It is possible, however, to compare the two estimates of coal r.eserves for those townships which lie entirely within the Punxsutawney and Curwensville quadrangles. For the 14 townships thus situated, Reese and Sisler estimated that the original coal reserves totaled 2, 347,800,000 tons, whereas Ashley estimated that the original coal reserves totaled 2, 785, 375,000 tons. Ashley's estimate, therefore, represents an increase of nearly 18 percent over the estimate of Reese and Sisler.
In calculating the reserves of the Curwensville quadrangle, Ashley included only coal having an average net thickness of at least 18 iQ.ches. In calculating the reserves of the Punxsutawney quadrangle, he included only coal having an average net thickness of at least 1 foot. Ashley defined the net thickness of coal bed as "the thickness left after rejecting any minor benches separated from the main bench by a parting of greater thickness than the coal bench. In the case of a parting thinner than the coal bench, only
20
. ··the difference -in thickness between the minor bench and the parting was added to the thickness of the major bench. 11 For both quadrangles, Ashley assumed a specific gravity of 1. 32, or a we-ight of 1, 800 tons per acre-foot, for the coal.
The coal reserves of the Smicksburg quadrangle were estimated by M. N. Shaffner (1948), but again a comparison with the Reese and Sisler estimate can be made only for the townships lying completely within the quadrangle. For six townships, therefore, Shaffner estimated that the original coal reserves totaled 525,771,000 tons, and Reese and Sisler estimated that . the original reserves totaled 931,300,000 tons. Shaffner's estimate is only 56 percent of· that made by Reese and Sisler. ·
Much o{ the difference between the two estimates is probably accounted for, however, by the fact that Shaffner determined the thickness of the coal beds used in his calculations by the modulus of irregularity. As already discussed, this fortnula results in a figure for the thic)mess of the coal that is less than the average thickness, and an estimate based on the use of the formula tends to be extremely conservative. This is the only known published use of the modulus of irregularity in recent calculations of coal reserves.
Shaffner assumed a specific gravity of 1. 35, or a weight of 1, 840 tons per acre-foot, for the coal in the Smicksburg quadrangle.
F. T. Moyer estimated that the original coal reserves of Fayette County, Pa., totaled 7, 570,000,000 tons (Hickok and Moyer, 1940). For the same area Reese and Sif!ler estimated that the oriqinal coal reserves totaled 5, 230,000,000 tons. Moyer's estimate represents an increase of 45 percent over the estimate of Reese and Sisler. ·
The townships in Fayette County were divided by Moyer into areas in which the coal ~bowed the same characteristics and for which an averaqe section could be determined. The area ~der lain by coal was obtained by planimeter measurements. Minable thicknesses of the averaqe sections were used in all calculations. The minable thickness· of a coal bed, as defined by Moyer, was the thickness of the coal after subtractinq partinqs, bone, and bony coal from the total thickness of the bed. Thin benches separated by a thick partinq from the principal bench of a coal bed were also excluded in considerinq minable thickness. No coal havinq an averaqe minable thickness of less than 28 inches was included in the estimate. Moyer assumed a s~cific gravity of 1. 37, or a weight of 1, 880 tons per acre-foot, for the coal in Fayette County.
The original coal reserves in seven beds in Cambria County, Pa. , '-ere estimated by Dowd and others (1950) to total 2, 406, 887,000 tons. This fiqure represents the measured and ind.icated coal in beds at least 14 inches thick. Because the estimate does not include inferred reserves, it cannot be compared in its original form to the estimate of Reese and Sisler.
All calculations for the Dowd estimate were based upon an assumed specific gravity of 1. 32, or a weight of 1, 800 tons per acre-foot.
In the strictest sense none of the reserves fiqures
just discussed can be compared with the Reese and Sisler estimate because of the different standards applied, particularly for minimum thickness of coal beds and weight of coal. For practical purposes, however, the several recent estimates serve to show the conservative q~ity of the older Reese and Sisler estimate.
Ashley (1944) recognized the conservative nature of the Reese and Sisler estimate and, on the basis of the other estimates just described, added 10 percent to the Reese and Sisler coal reserve figures for every county in Pennsylvania except Fayette County, for which he used the new estimate by Moyer.
As has already been mentioned, the low estimate by Reese and Sisler is partly the result of the use of a lower-than-average specific gravity for the coal in Pei)IlSylvania. Recalculation of the estimate using a somewhat higher specific gravity for the coal, however, still results in a smaller figure for the coal reserves of Pennsylvania than is indicated by the other estimates included in this discussion. Considering the conservative nature of the Reese and Sisler estimate and the fact that no new complete estimate for the coal reserves of Pennsylvania is available, the continued use of their estimate without revision in the present tables seems justified at this time.
The original reserves of anthracite in Pennsylvania totaled 22,805,000,000 short tons, according to the most recent estimate, which was made by Ashley (1945). This estimate was based directly upon a previous one by Ashmead (1926), with the exception of the reserve figures for two counties, Dauphin and Lebanon, which Ashley reduced on the basis of later mining reports.
Ashmead based his reserve estimate on careful measurements of coal bed areas as shown on mine maps, but he listed no standards for the thickness or ~eight of ~he coal included. Presumably, therefore, m compuhng the anthracite reserves of Pennsylvania, Ashmead, and subsequently Ashley, used the same limits of thickness and the same figures for specific gravity that were adopted by Smith (1893; see also Lesley and others, 1895), who made the first careful estimate of the anthracite reserves.
The minimum thickness of coal included in Smith's estimate was 2. 5 feet for the Northern anthracite field and 2 feet for the other fields.
In calculating his figure for the anthracite reserves, Smith used different values for the specific gravity of the coal in different localities within the anthracite fields, as determined by numerous tests. The coal in the Eastern Middle field, Western Middle field, and part of the Southern field was assigned a specific gravity of 1. 61, or a weight of 2, 190 tons per acre-foot. The remainder of the coal in the Southern field was assigned a specific gravity of 1. 5, or a weight of 2, 040 tons per acre-foot, and the coal in the Northern field was assigned a specific gravity of 1. 55, or a weight of 2·, 110 tons per acre-foot. Smith estimated that the original reserves of anthracite in Pennsylvania totaled 21,848,800,000 short tons.
The several estimates of Pennsylvania anthracite reserves all were based upon assumed accordion folds in the coal-bearing rocks of the anthracite fields.
21
On the basis of recent work by Rothrock (1950), however, it now appears that some of these structures may be more correctly interpreted as thrust faults, in which case the reseryes of anthracite may be l"educed in future estimates. Smith's original estimate of 21,848,800,000 short tons may therefore prove to be more accurate than the later estimates which have tended to increase the reserve figures.
WEST VIRGINIA
The original coal reserves of West Virginia totaled 116,618,446,894 tons, according· to an estim~e by Headlee and Nolting (1940). This figure represents the sum of the original coal reserves of each county as estimated in county reports published by the West Virginia Geological Survey. The Headlee-Nolting summary report includes tables showing the distribution of reserves by minable coal beds as well as by counties. All coal beds averaging 2 feet or more in thickness were in~uded in the estimate. A minimum cut-off point was established, however, and ·presumably no coal thinner than 18 inches was considered in calculating the reserves.
Price and others (1938) state that approximately 75,500,000,000 tons of coal in West Virginia is in beds that average 3 feet or more in thickness. The remainder of the original reserves, or approximately 41,000,000,000 tons of coal, is in the thinner beds.
In computing the reserves of West Virginia, the coal was assumed to have a sJ)ecific gravity of 1. 28, or a weight of 1, 742 tons per acre-foot. A specific gravity of 1. 28 is somewhat low, however, for typical bituminous coal in the ground. By assuming a specific gravity of 1. 32, or a weight of 1, 800 tons per acre-foot, which is more generally accepted as the average weight of typical bituminous coal in the ground, the West Virginia estimate would be increased 3 percent.
WYOMING
The original coal reserves of Wyoming, as estimated by Berryhill and others (Berryhill, Brown, Brown, ·and Taylor, 1950), totaled 121,553,850,000 tons, of which 13,234,950,000 tons is bituminous coal and 108,318,900,000 tons is subbituminous coal. According to the few available analyses, a large tonnage of coal on the eastern side of the Powder River Basin is close to the dividing line between subbituminous coal and lignite, but it is included in this estimate with reserves of subbituminous coal. The areal distribution of coal in Wyoming is shown on a map by Berryhill and others (Berryhill, Brown, Burns, and Combo, 1950).
The estimate, which shows the coal res~rves of Wyoming classified by counties and by townships, was based on published and unpublished reports of the U. S. Geological Survey, on pt}blications of the Geological Survey of Wyoming, and on records made available to the U. S. Geological Survey by mining companies, oil companies, and private individuals. Approximately ~53 percent of the total area of coal-bearing rocks in Wyoming was not included in the estimate because little or no information on the coal beds in these areas was available. As more mapping and exploratory drilling programs are carried on.in the coal-bearing areas in Wyoming, therefore, the estimate of reserves should be substantially increased. .
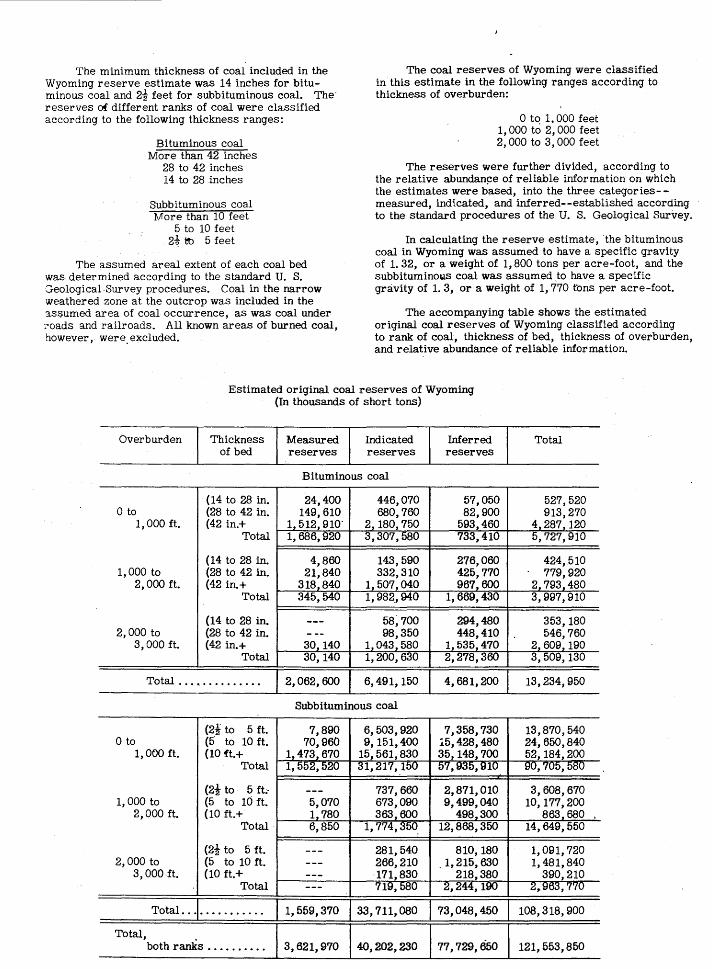
'The minimum thickness of coal included in the Wyoming reserve estimate was 14 inches for bituminous coal and 2! feet for subbituminous coal. The· reserves of different ranks of coal were classified according to the following thickness ranges:
Bituminous coal More than 42 inches
28 to 42 inches 14 to 28 inches
Subbituminous coal More than 10 feet
5 to 10 feet 2-! l't> 5 feet
The assumed areal extent of each coal bed was determined according to the standard U. S. Geological .Survey procedures. Coal in the narrow weathered zone at the outcrop was included in the ::tS$umed area of coal occurrence, as was coal under ~·oads and railroads. All known areas of burned coal, however, were. excluded.
The coal reserves of Wyoming were classified in this estimate in the following ranges according to thickness of overburden:
0 to 1, 000 feet 1, ooo to 2, ooo feet 2, 000 to 3, 000 feet
The reserves were further divided, according to the relative abundan~e of reliable information on which the estimates were based, into the three categories-measured, indicated, and inferred--established according to the standard procedures of the U. S. Geological Survey.
In calculating the reserve estimate, "the bituminous coal in Wyoming was assumed to have a specific gravity of 1. 32, or a weight of 1, 800 tons per acre-foot, and the subbituminot.ls coal was assumed ,to have a specific gravity of 1. 3, or a weight of 1, 770 tons per acre-foot.
The accompanying table shows the estimated original coal reserves of Wyoming classified according to rank of coal, thickness of bed, thickness of overburden, and relative abundance of reliable information.
Estimated original coal reserves of Wyoming (In thousands of short tons)
Overburden
0 to 1, 000 ft.
1,000 to 2, 000 ft.
2, 000 to 3, 000 ft.
Thickness of bed
(14 to 28 in. (28 to 42 in. (42 in.+
Total
(14 to 28 in. (28 to 42 in. (42 in.+
Total
(14 to 28 in. (28 to 42 in. (42 in.+
Total
Total ..............
(2f to 5 ft. 0 to (5 to 10ft.
1, 000 ft. (10ft.+ Total
(2! to 5 ft: 1, 000 to (5 to 10 ft.
2, 000 ft. (10ft.+ Total
(2! to 5 ft. 2, 000 to (5 to 10ft.
3, 000-ft. (10ft.+ Total
Total ... ........... Total,
both ranks .....•.•..
Indicated reserves
Bituminous coal
24,400 446,070 149,610 680,760
1, 512 910" 2,180,750 1,686,920 3,307,580
4,860 143,590 21,840 332,310
318,840 1,507,040 345,540 1, 982_, 940
--- 58~700 --- 98,350 30,140 1,043,580 30, 140 1,200,630
2,062,600 6,491,150
Subbituminous coal
7,890 6,503,920 70,960 9,151,400
1,473,670 15,561,830 1,552,520 31,217,150
--- 737,660 5,070 673,090 1. 780 363.600 6,850 1, 774,350_
--- 281,540 --- 266,210 --- -171,830 --- 719,580
1,559,370 33,711,080
3,621,970 40,202,230
Inferred reserves
57,050 82,900
593,460 733,410
276,060 425,770 967,600
1,669,430
294,480 448,410
1,535,470 2,278,360
4,681,200
7,358,730 i5,428,480 35,148,700 57,935,910
2,871,010 9,499,040
498.300 12,868,350
810,180 . 1, 215,630
218,380 2,244,190
73,048,450
77,729,650
Total
527,520 913,270
4 287,120 5,727,910
424,510 779,920
2,793,480 3,997,910
353, 180 546,760
2,609,190 3,509,130
13,234,950
13,870,540 24,650,840 52,184,200 90,705,580
3,608,670 10,177,200
863 680 14,649,550
1,091,720 1,481,840
390,210 2,963,770
108,318,900
121,553,850
OO'BER STA n::s ·• In this progress report of the U. S. Geological
Survey's program for the reappraisal of the coal reserves of the United States, it has not been possible to include new appraisals for all: states. For states not previously discussed, therefore, the only estimates available are those prepared by Campbell in the years prior to 1928. These have been included in tables 1 and 2 for the sake of completeness.
In calculating his estimates of original reserves, Campbell used the following minimum thicknesses for the different ranks of coal: ·
Bituminous coal and anthracite~--- 14 inches Subbituminous coal-------------- 2 feet Lignite------------------------- 3 feet
Otherwise, he included in a single category all coal to. a depth 3, 000 feet below the surface. Campbell based his estimates on an assumed specific gravity of 1. 3, or a weight of 1, 770 tons per acrefoot, for coal of all ranks.
Campbell's estimates of coal reserves were carefully prepared, but for many areas he had very little information with which to work, and in an attempt to provide a comprehensive estimate of all possible coal in the United States he made statistical allowance for the continuity of coal beds over large unmapped ·areas and areas concealed by glaCial drift or younger rocks. In states where the coal beds have been demonstrated to be discontinuous the Campbell estimates are conspicuously high. In states where very little information on coal is available for certain areas, or where the coal-bearing rocks are concealed, the more rigid methods of calculating coal reserves now employed by the Geological Survey will also tend to reduce the Campbell estimates by excluding such areas from consideration.
Although it is recognized that, in general, the Campbell estimates are high and are subject to revision, they are included in tables 1 and 2 as originally prepared. With an active program of work in progress
· toward the revision of these estimates, arbitrary changes at the present time would not result in valid figures and would tend to be confusing. It is hoped that a complete, documented revision of the Campbell estimates can be completed in the near future.
ALASU
Coal is known to occur in substan~ quantities ·at numerous places in Alaska. Very little detailed mapping or exploration has been carried on in the coal-bearing areas, however, and only a generalized appraisal of the total coal reserves in the Territory can be made at the present time. According to· an appraisal prepared in 1944 by Clyde Wahrhaftig of the Geological Survey, the total original coal reserves of Alaska were inferred to be 107, 394, 000, 000 tons (Buch, Hendricks, and Toenges, 1947,' p. 235), of which 23,800,000,000 tons is bituminous coal; 82,594,000,000 tons, subDituminous coal and lignite; and 1, 000,000,000 tons, anthracite.
The coal reserves of Alaska cannot be classified by thickness of bed or overburden because of the scarcity
23
of detailed "information. Access to transpbrtation facilities is the chief factor affecting coal-miriing development in Alaska, and the reserve figures presented in the accompanying table are· therefore classified by region and by accessibility to present railroads.
By January 1, 1950, the total recorded production of coal in Alaska totaled 5~ 621., 000 tons, most of which came from the Matanuska Valley and Nenana fields on the Alaska Railroad. High costs of mining and shipping limit Alaskan coal at present to use within the Territory.
COKING-COAL RESERVES
Coke is a manufactured product, and in spite of the frequent use of the term"coking coal," there is actually little. coal that can be used alone to produce coke satisfactory for metallurgical proc;:esses. Coal of medium-volatile bituminous rank is best for use in coke production, but reserv_es of coal of this rank are small and are rapidly being depleted. Coke that is equally satisfactory, however, can often be produced by blending together two different ranks of coal. Generally, 15 to 30 percent low-volatile coal is used in a blend with high-volatile coal that alone produces only an inferior coke. Poorly coking coal is sometimes improved by blending with s_uch noncoking ingredients as anthracite fines, petroleum coke, or low-temperature char.
In ·addition to rank the ba?it plant constituents of a coal also seem to be important in determining the suitability of a coal for manufacturing coke, and such deleterious constituents as ash and sulfur must not be present in excessive quan~ities.
Most of the reserves of high-rank and high-quality coal best suited for coke production are found in the East, principally in West Virginia, Pennsylvania, Kentucky, and Virginia. ln a few areas .in the West, principally in Colorado, Utah, New Mex1co, Oklahoma, and Arkansas, coal is produced that is satisfactory for the manufacture of coke when used in blends. The available information· about reserves of such coal in the West is summarized in another report (Berryhill and Averitt, in preparation).
Because of the almost limitless possibilities of blending coals and other hydrocarbons in the manufactUJ!e of coke, and because of the certainty that the acceptable amounts of impurities in coke will be allowed to increase
··and coking properties to decrease as the higher-rank and higher-grade coals are depleted, it is impossible to define coking coal in precise terms. It may be possible, however, to establish certain categories of coal based on coking properties, grade, and sulfur content, conforming to ranges now regarded as acceptable for use in mak~ coke, and to report coal reserves in these categor.ies, but this has not as yet be,en done.
· As low-volatile bituminous coal is_a blending agent that makes possible the use of vastly, larger r~- . serves of high-volatile bituminous coal for coke.pr6ductlon, the reserves of low-volatile coal are important in regard to present and future supplies of coking coal. The original reserves of low-volatile bituminous coal in the United States are shown in the following table, as estimated on the basis of information prepared by the Pennsylvania and West Virginia Geological Surveys and information presented by M. R. Campbell in aU. S. Geological
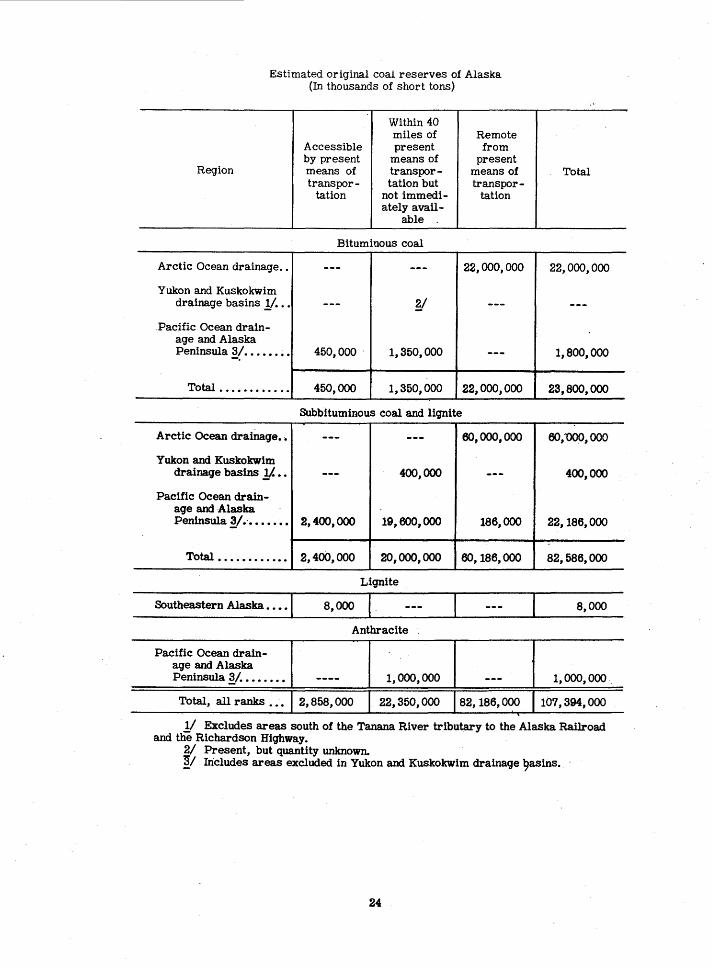
Estimated original coal reserves of Alaska (In thousands of short tons)
Within 40 miles of Remote
Accessible present from by present means of present
Region means of transpor- means of transpor- tation but transpor-
tation not immedi- tation ately avail-
able
Bituminous coal
Arctic Ocean drainage •• --- --- 22,000,000
Yukon and Kuskokwim drainage basins .!/ ... --- y ---
.Pacific Ocean drain-age and Alaska Peninsula 3/ •••••••• 450,000 . 1,350,000 ----.
Total •.•••.••.••. 450,000 1,350,000 22,000,000
Subbituminous coal and liqnite
Arctic Ocean draiitaqe •.• --- --- 60,000,000
Yukon and Kuskokwim drainaqe basins ,!/. •• --- 400,000 ---
Pacific Ocean drain-aqe and Alaska Peninsula Y ......... 2,400,000 19,600,000 186,000
Total •.•••.•••.•• 2,400,000 20,000,000 60,186,000
Liqnite
Southeastern Alaska •••• J 8,000 f. Anthracite .
Pacific Ocean drain-aqe and Alaska Peninsula 3/ •••••••• ---- 1,000,000 ---Total, all ranks ••• 2,858,000 22,350,000 82,186,000
Total
22,000,000
---
1,800,000
23,800,000
60, -ooo, 000
400,000
22,186,000
82,586,000
8,000
1,000,000 ..
107,394,000
Y Excludes areas south of the Tanana River tr.ibu~y to the Alaska Railroad and the Richardson Hiqhway.
2/ Present, but quantity unknown. !/ Iricludes areas excluded in Yukon and Kuskokwim drainaqe l)asins.
24
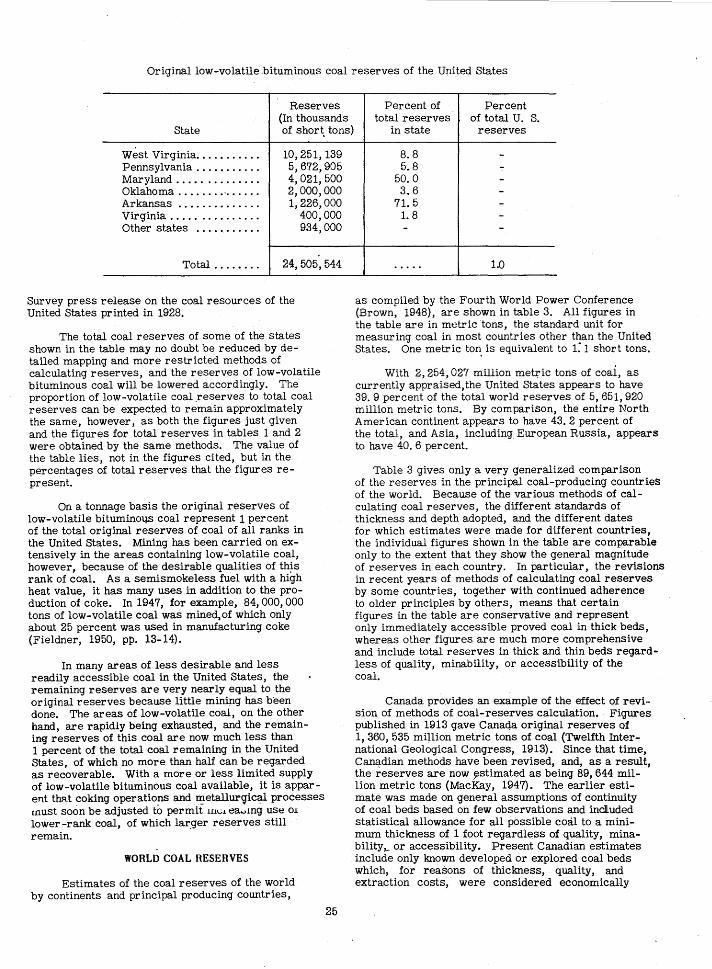
Original low-volatile bituminous coal reserves of the United States
Reserves (In thousands
State of shor~ tons)
West Virginia ........... 10,251,139 Pennsylvania ........... 5,672,905 Maryland .............. 4,021,500 Oklahoma ............... 2,000,000 Arkansas .............. 1,226,000 Virginia ............... 400,000 Other states ........... 934,000
Total ........ 24,505,544
Survey press release on the coal resources of the United States printed in 1928.
The total coal reserves of some of the states shown in the table may no doubt be reduced by detailed mapping and more restricted methods of calculating reserves, and the reserves of low-volatile bituminous coal will be lowered accordingly. The proportion of low-volatile coal_reserves to total coal reserves can be expected to remain approximately the same, however, as both the figures just given and the figures for total reserves in tables 1 and 2 were obtained by the same methods. The value of the table lies, not in the figures cited, but in the percentages of total reserves that the figures represent.
On a tonnage basis the original reserves of low-volatile bitumino'Q.s coal represent 1 percent of the total original reserves of coal of all ranks in the United States. Mining has been carried on extensively in the areas containing low-volatile coal, however, because of the desirable qualities of t~s rank of coal. As a semismokeless fuel with a high heat value, it has many uses in addition to the production of coke. In 1947, for example, 84,000,000 tons of low-volatile coal was mined,of which only about 25 percent was used in manufacturing coke (Fieldner, 1950, pp. 13-14).
In many areas of less desirable and less readily accessible coal in the United States, the remaining reserves are very nearly equal to the original reserves because little mining has been done. The areas of low-volatile coal, on the other hand, are rapidly being exhausted, and the remainin~ reserves of this coal are now much less than 1 percent of the total coal remaining in the United States, of which no more than half can be regarded as recoverable. With a more or less limited supply of low-volatile bituminous coal available, it is apparent tllil.t coking operations and ~etallur<]iCal processes rnust soon be adjusted to permit l!l~J.·ea..,mg use 0!
lower -rank coal, of which lar_ger reserves still remain.
WORLD COAL RESERVES
Estimates of the coal reserves of the world by continents and principal producing countries,
25
Percent of Percent total reserves of total U. s.
in state reserves
8.8 -5. 8 -
50.0 -3. 6 -
71.5 -1.8 -- -
..... 1.0
as compiled by the Fourth World Power Conference (Brown, 1948), are shown in table 3. All figures in the table are in metric tons, the standard unit for measuring coal in most countries other than the United States. One metric ton. is equivalent to 1: 1 short tons.
With 2, 254,027 million metric tons of coai, as currently appraised,the United States appears to have 39. 9 percent of the total world reserves of 5, 651, 920 million metric tons. By comparison, the entire North American continent appears to have 43. 2 percent of the total, and Asia, including European Russia, appears to have 40. 6 percent.
Table 3 gives only a very generalized comparison of the reserves in the principal coal-producing countrieS of the world. Because of the various methods of calculating coal reserves, the different standards of thickness and depth adopted, and the different dates for which estimates were made for different countries, the individual figures shown in the table are comparable only to the extent that they show the general magnitude of reserves in each country. In particular, the revisions in recent years of methods of calculating coal reserves by some countries, together with continued adherence to older principles by others, means that certain figures in the table are conservative and represent only immediately accessible proved coal in thick beds, whereas other figures are much more comprehensive and include total reserves in thick and thin beds regardless of quality, minability, or accessibility of the coal.
Canada provides an example of the effect of revision of methods of coal-reserves calculation. Figures published in 1913 gave Canaqa original reserves of 1, 360, 535 mitlion metric tons of coal (Twelfth International Geological Congress, 1913). Since that time, CanC)..dian methods have been revised, and, as a result, the reserves are now ~stimated as being 89,644 million metric tons (MacKay, 1947). The earlier estimate was made on general assumptions of continuity of coal beds based on few observations and inclluded statistical allowance for all possible coal to a minimum thickness of 1 foot reqardless of quality, minability, .. or accessibility. Present Canadian estimates include only known developed or explored coal beds which, for reasons of thickness, quality, and extraction costs, were considered economically
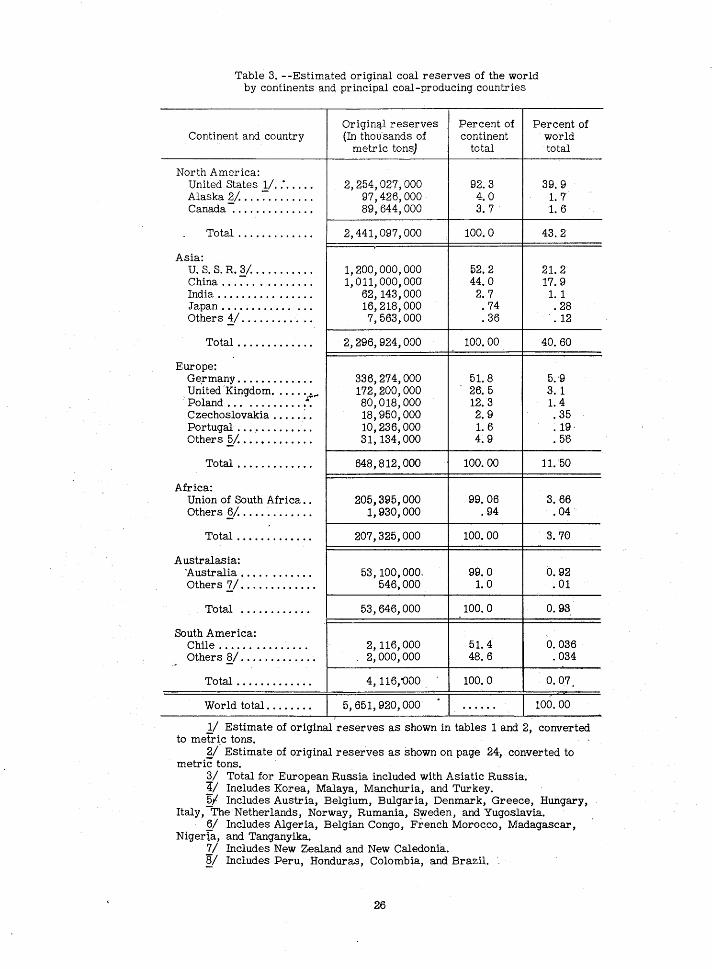
Table 3. --Estimated original coal reserves of the world by continents and principal coal-producing countries
Originql reserves Percent of Percent of Continent and country (In thou·sands of continent world
metric tons) total total
North America: United States 1/. : . .... 2,254,027,000 92.3 39.9 Alaska 2/. ... ~ ........ 97,426,000 4.0 1.7 Canada~ ............. 89,644,000 3.7 1.6
Total ............. 2,441,097,000 100.0 43.2
Asia: U. S. S. R. 3/ ........... 1,200,000,000 52.2 21.2 China ... ~ ........... 1, 011,000,000 44.0 17.9 India ................ 62, 143,000 2.7 1.1 Japan ............ 16,218,000 . 74 . 28 Others .!f ............ 7,563,000 . 36 . 12
Total ............. 2,296,924,000 100.00 40.60
Europe: Ge.rmany ............. 336,274,000 51.8 5.9 United "Kingdom ......... 172,200,000 26.5 3. 1 Poland ............ • "": 80,018,000 12.3 1.4 Czechoslovakia ..... :. 18,950,000 2.9 . 35 Portugal ............ · .. 10,236,000 1.6 . 19· Others.£!. ...•........ 31,134,000 4.9 . 56
Total •............ 648,812,000 100.00 11. 50
Africa: Union of South Africa .. 205,395,000 99.06 3.66 Others §f. ............ 1,930,000 . 94 . 04
Total ............. 207,325,000 100.00 3.70
Australasia: 'Australia . . . . . . ...... 53,100,000. 99.0 0.92 Others V ............. 546,000 1.0 . 01
Total ............ 53,646,000 100.0 0.93
South America: Chile ............... 2, 116,000 51.4 0.036 Others y ............. 2,000,000 48.6 . 034
.~
Total ............. 4, 116,"000 100.0 0.07
World total ........ 5,651,920,000 . ..... 100.00
]) Estimate of original reserves as shown in tables 1 and 2, converted to metric tons.
~/ Estimate of original reserves as shown on page 24:, converted to metric tons.
3/ Total for European Russia included with Asiatic Russia. !/ Includes Korea, Malaya, Manchuria, and Turkey. 5/ Includes Austria, Belgium, Bulgaria, Denmark, Greece, Hungary,
Italy, -The Netherlands, Norway, Rumania, Sweden, and Yugoslavia. ~ Includes Algeria, Belgian Congo, French Morocco, Madagascar,
Nigerta, and Tanganyika. 7 I Includes New Zealand and New Caledonia. Y Includes Peru, Honduras, Colombia, and Brazil.
26

minable in 1946. Reserves for most other countries shown in table 3 relate to all coal in the ground, irrespective of quality, minability, or accessibility, and many of these figures will no doubt be reduced in the future as more detailed information becomes available and more restricted methods of calculating reserves are adopted.
RELATJON OF COAL IN THE UNITED STATES TO OTHER FORMS OF ENERGY
Coal supplied 39. 3 percent of the energy produced for heat, light. and power in the United States in 1949. During the same year, petroleum and natural gas together contributed 53. 0 percent of the energy produced (U.S. Bureau of Mines, 1950). As shown in figure 5, the percentage of total energy supplied by coal has decreased steadily since 1900, when, prior to the general use of petroleum· and natural gas, 90 percent of the energy used in the United States was supplied by coat Since that time, an increase in the use of the other two fuels, because of their availability and convenience, has been accompanied by a decrease in the percentage of energy produced by coal. · This trend is not expected to continue indefinitely. As the Nation's reserves of petroleum and natural gas diminish, coal will become increasingly important by filling many of the energy requirements now supplied by o~er fuels. Even assuming future competition from atomic sources, coal is an important factor in the national fuel economy and is likely to remain so for many years.
The decrease in the percentage contribution of coal to the total consumption of mineral fuels in the United States has not been accompanied by a comparable decrease in the actual production of coal. On the contrary, an all-time record was established in 1947 when 630, 623,722 tons of coal was produced. The trend of high production of coal during World War II and the years immediately following is similar, however, to the trend that took place during and after World War I, when the previous record was set in 1918 with a production of 579,385,820 tons of coal. The fact that the 1947 fig1.u-es for record production is so close to the 1918 figure seems to suggest that the maximum figure for annual coal production i_n the United States will be about 600,000,000 tons as long as petroleum and natural gas are available in quantity as sources of energy. No sharp rise from this established figure can be expected until coal is draW!! upon as a source of liquid as well as solid fuels.
Estimates of coal reserves cannot readily be compared with estimates of petroleum and natural gas :reserves, because the differences in the mode of occurrence of these fuels necessitate different methods of calculating reserves. Coal occurs in stratified deposits in sedimentary rocks, and the beds maintain a fairly uniform thickness over relatively large areas. From geologic observations made at the outcrops of coal beds, in mines and prospect pits, and from evidence supplied by drilling operations, the total quantity of coal in the ground can be estimated with reasonable accuracy. In the same way, estimates of total reserves of bituminous sandstone and oil shale can be obtained because these substances also occur in stratified deposits of measurable thickness and lateral extent.
27
Liquid petroleum and natural gas, on the other hand, are mobile substances that move through minute openings in the rocks and accumulate only where geologic relations provide traps that prevent further migration. As a great variety of structurql and stratigraphic relations create such traps, the total number of traps existing in the widespread thick sequences of sedimentary rocks cannot be predicted accurately, nor can the ultimate amount of recoverable oil or gas contained in these traps be ascertained. Only proved reserves, or reserves in developed areas, can be estimated with any certainty for petroleum and natural gas, and consequently the estimates must be changed annually to accord with new discoveries and with production.
Despite the recognized difficulty of comparing reserve estimates for various types of mineral fuels, it is desirable, nevertheless, to indicate the relation of coal reserves to the total mineral-fuel reserves of the United States.- In order to show reserves of the several different fuels on a.s;.J)f:arly similar bases as possible, two separate tables (tables 4 and 5) are presented, e.ach representing a major point of view in regard to reserve estimates.
Table 4 shows the total ultimately recoverable mineral-fuel reserves of the United States as of January 1, 1950. The coal reserve estimate of 1, 212. 79 billion tons shown in this table was obtained from tables 1 and 2. It includes measured, indicated, and inferred reserves of coal in both thick and thin beds, under light and heavy overburden.
Several attempts have been made to obtain comparable figures for petroleum and natural gas reserves. These attempts have been based on the assumption that the total volume of marine sedimentary rock in the United States within range of exploration by drilling will yield petroleum and natural gas in amounts proportional to the yields obtained from the volume of rock explored thus far. Although no special accuracy is claimed for figures derived by these methods, the estimates based on currently available data are in good agreement. Weeks (1948, p. 1094) estimated the original, potentially recoverable reserves of petroleul!l in the United States, excluding the continental shelves, to be 110 billion barrels, and Pratt (Fanning, 1950, · p. 151) estimated the amount to be 100 billion barrels. Using the same methods, Terry (Fanning, 1948, p. 149) ootimated the original, potentially recoverable, reserves of natural gas in the United States to be 400 trillion cubic feet. Considering the additional quantities of oil present in the continental shelves, and the ever ·present possibility of future additions to petroleum and natural gas reserves beyond those allowed for by a statistical analysis of currently available data, it is likely that the figures are too small rather than too la:r;ge. They are, however, of the oraer of magnitude required for a proper comparison of oil and gas reserves with total coal reserves.
The figures derived by Weeks, Pratt, and Terry are, of course, intended to represent total ultimately recoverable original reserves; that is to say, past production, present proved reserves, and assumed future discoveries. To make them comparable With ~he figure for total ultimately recoverable coal reserves as of January 1, 1950, they must be reduced to allow
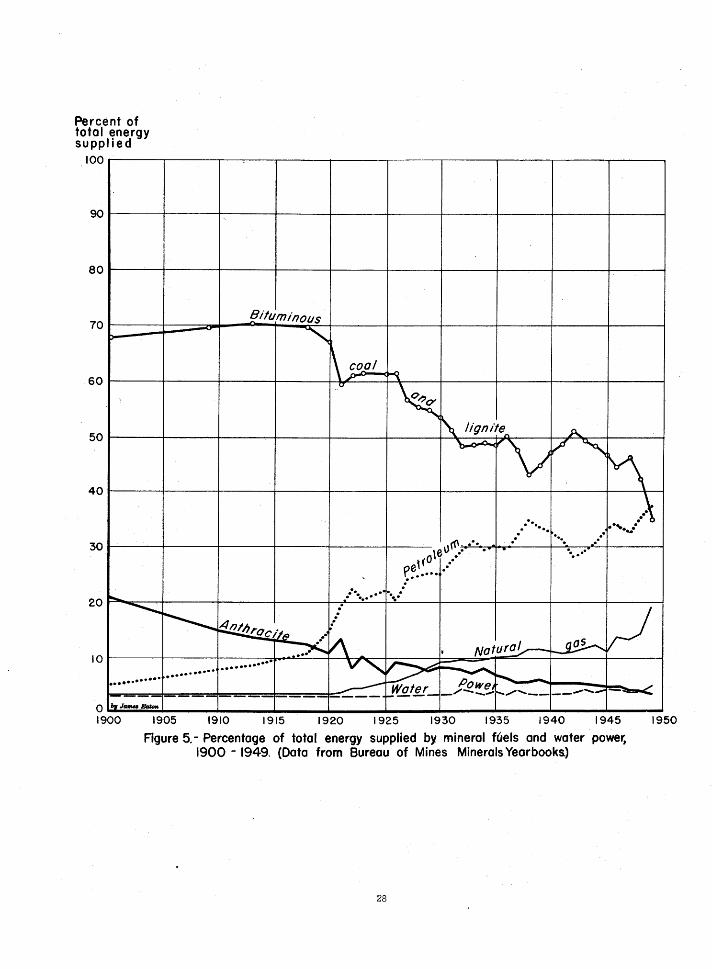
Percent of total energy supplied
100
90
80
70 J-
60
50
40
30
,...., -............ 20
10
············ 0 iliwJ-Eolo!o
~
······ ·····
Bituminous
~
\;_opt .. c:r
. ·.. .. . . ... . . ~OCilto .•
~ V\_ ············ v"
-----·- ......
I
'l.
~ 1\ ligniten A. '- -.JI..
~\; v ~ U'
h .···· ... .. \ .. , ... ··
o\e\.l~.~ •• •• . ··· . . .·· ..
·. . . .. pe '~ •••• ·· .··.
~-......
I Natura_!,--~ lJ ~ ~ r--.... -_,f.£.'!_'!;. "-Water_ i-,...... ___ -----
1900 1905 1910 1915 1920 1925 1930 1935 1940 1945 1950
Figure 5.- Percentage of total energy supplied by mineral fuels and water power, 1900 - 1949. (Data from Bureau of Mines Minerals Yearbooks.)
28
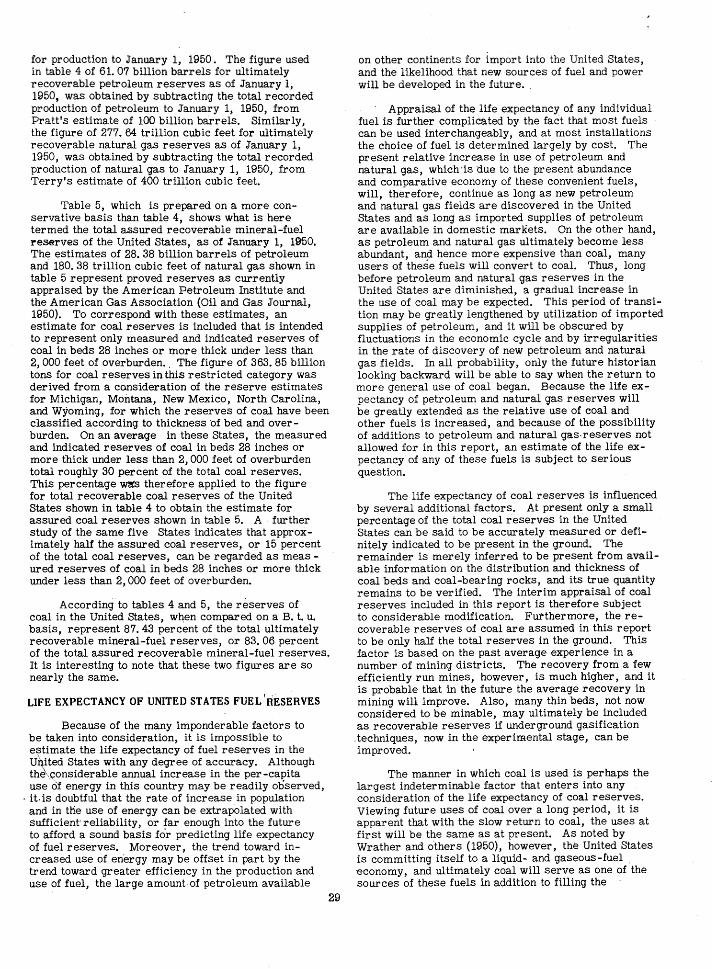
for production to January 1, 1950. The figure used in table 4 of 61. 07 billion barrels for ultimately recoverable petroleum reserves as of January l, 1950, was obtained by subtracting the total recorded production of petroleum to January 1, 1950, from Pratt's estimate of 100 billion barrels. Similarly, the figure of 277. 64 trillion cubic feet for ultimately recoverable natural gas reserves as of January 1, 1950, was obtained by subtracting the total recorded production of natural gas to January 1, 1950, from Terry's estimate of 400 trillion cubic feet.
Table 5, which is prepared on a more conservative basis than table 4, shows what is here termed the total assured recoverable mineral-fuel reserves of the United States, as of January 1, 1950. The estimates of 28. 38 billion barrels of petroleum and 180. 38 trillion cubic feet of natural gas shown in table 5 represent proved reserves as currently appraised by the American Petroleum Institute and the American Gas Association (Oil and Gas Journal, 1950). To correspond with these estimates, an estimate for coal reserves is included that is intended to represent only measured and indicated reserves of coal in beds 28 inches or more thick under less than 2, 000 feet of overburden. . The figure of 363. 85 billion tons for coal reserves in this restricted category was derived from a consideration of the reserve estimates for Michigan, Montana, New Mexico, North Carolina, and Wyoming, for which the reserves of coal have been classified according to thickness of bed and over -burden. On an average in these States, the measured and indicated reserves of coal in beds 28 inches or more thick under less than 2, 000 feet of overburden total roughly 30 percent of the total coal reserves. This percentage wl!'s therefore applied to the figure for total recoverable coal reserves of the United States shown in table 4 to obtain the estimate for assured coal reserves shown in table 5. A further study of the same five States indicates that approximately half the assured coal reserves, or 15 percent of the total coal reserves, can be regarded as meas -ured reserves of coal in beds 28 inches or more thick under less than 2, 000 feet of overburden.
According to tables 4 and 5, the reserves of coal in the United States, wh,en compared on a B. t. u. basis, represent 87. 43 percent of the total ultimately recoverable mineral-fuel reserves, or 83. 06 percent of the total assured recoverable mineral-fuel reserves. It is interesting to note that these two figures are so nearly the same.
LIFE EXPECTANCY OF UNITED STATES FUEL'RESERVES
Because of the many imponderable factors to be taken into consideration, it is impossible to e~timate the life expectancy of fuel reserves in the U~ted States with any degree of accuracy. Although the \considerable annual increase in the per -capita use of energy in this country may be readily observed,
· it. is doubtful that the rate of increase in population and in tlie use of energy can be extrapolated with sufficient reliability, or far enough into the future to afford a sound basis for predicting life expectancy of fuel reserves. Moreover, the trend toward increased use of energy may be offset in part by the trend toward greater efficiency in the production and use of fuel, the large amount of petroleum available
29
on other continents for import into the United States, and the likelihood that new sources of fuel and power will be developed in the future ..
Appraisal of the life expectancy of any individual fuel is further complicated by the fact that most fuels can be used interchangeably, and at most installations the choice of fuel is determined largely by cost. The present relative increase in use of petroleum and natural gas, which ·is due to the present abundance and comparative economy of these convenient fuels, will, therefore, continue as long as new petroleum and natural gas fields are discovered in the United States and as long as imported supplies of petroleum are available in domestic mar:Kets. On the other hand, as petroleum and natural gas ultimately become less abundant, and hence more expensive than coal, many users of these fuels will convert to coal. Thus, long before petroleum and natural gas reserves in the United States are diminished, a gradual increase in the use of coal may be expected. This period of transition may be greatly lengthened by utilization of imported supplies of petroleum, and it will be obscured by fluctuations in the economic cycle and by irregularities in the rate of discovery of new petroleum and natural gas fields. In all probability, only the future historian looking backward will be able to say when the return to more general use of coal began. Because the life expectancy of petroleum and natural 'Jas reserves will be greatly extended as the relative use of coal and other fuels is increased, and because of the possibility of additions to petroleum and natural gas.reserves not allowed for in this report, an estimate of the life expectancy of any of these fuels is subject to serious question.
The life expectancy of coal reserves is influenced by several additional factors. At present only a small percentage of the total coal reserves in the United States can be said to be accurately measured or definitely indicated to be present in the ground. The remainder is merely inferred to be present from available information on the distribution and thickness of coal beds and coal-bearing rocks, and its true quantity remains to be verified. The interim appraisal of coal reserves included in this report is therefore subject to considerable modification. Furthermore, the recoverable reserves of coal are assumed in this report to be only half the total reserves in the ground. This factor is based on the past average experience in a number of mining districts. The recovery from a few efficiently run mines, however, is much higher, and it is probable that in the future the average recovery in mining will improve. Also, many thin beds, not now considered to be minable, may ultimately be included as recoverable reserves if underground gasification
.techniques, now in the experimental stage, can be improved.
The manner in which coal is used is per haps the largest indeterminable factor that enters into any consideration of the life expectancy of coal reserves. Viewing future uses of coal over a long period, it is apparent that with the slow return to coal, the uses at first will be the same as at present. As noted by Wrather and o·thers (1950), however, the United States is committing itself to a liquid- and gaseous-fuel economy, and ultimately coal will serve as one of the sources of these fuels in addition to filling the
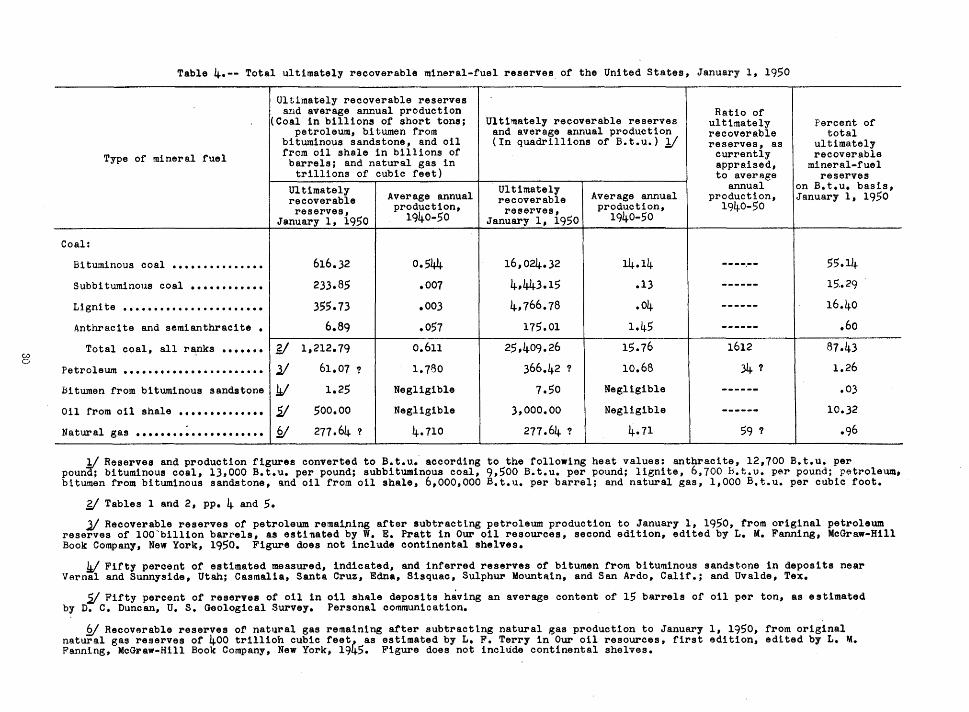
c.o 0
Table 4.-- Total ultimately recoverable mineral-fuel reserve.s. of the United States, January 1, 1950
Type of mineral fuel
Coal:
Bituminous coal •••••••••••••oo
Subbituminous coal •••••oooo•o•
Lignite •••••••••••••••••••••••
Anthracite and semianthracite •
Total coal, all ranks •••••••
Petroleum
Bitumen from bituminous sandstone
Ultimately recoverable reserves and average annual production
(Coal in billions of short tons; petroleum, b.itumen from
bituminous sandstone, and oil from oil shale in billions of barrels; and natural gas in trillions of cubic feet)
Ultimately recoverable reserves,
January 1, 1950
y
J! lV
616.32
233.85
355.73
6.89
Average annual production,
1940-50
0.544
.007
.003
.057
Oil from oil shale •••• o •• o o o •••• I 21
1,212.79
61.07 ?
1.25
500.00
277o64 ?
0.611
1.780
Negligible
Negligible
4.710 Natural gas ••••••••• o •••••••• o •• I 2/
Ultimately recoverable reserves and average annual production (In quadrillions of B.t.u.) !/
Ultimately recoverable I Average annual reserves, production,
January 1, 1950 1940-50
16,024.32 14.14
4,443.15 .13
4,766.78 .04
175.01 1.45
25,409.26 15.76
366.42 ? 10.68
7.50 Negligible
3,000.00 Negligible
277.64 ? 4· 71
Ratio of ultimately recoverable reserves, as
currently appraised, to average
annual production,
1940-50
------------------
1612
34 ?
------------
59 ?
I
I
Percent of total
ultimately recoverable
mineral-fuel reserves
on B.t.u. basis, January 1, 1950
55.14
15 .• 29
16.40
.6o
87.43
1.26
.03
I 10.32
·96
1/ Reserves and production figures converted to B.t.u.· according to the following heat values: anthracite, 12,700 B.tou. per pound; bituminous coal, 13,000 B.t.u. per pound; subbituminous coal, 9,500 B.t.u. per pound; lignite, 6,700 B.t.u. p~r pound; petroleum, bitumen from bituminous sandstone, and oil from oil shale, 6,000,000 B.t.,l. per barrel; and natural gas, 1,000 B.tou. per cubic foot.
y Tables 1 and 2, PP• 4 and 5. J! Recoverable reserves of petroleum remaining after subtracting petroleum production to January 1, 1950, from original petroleum
reserves of lOO'billion barrels, as esti~ated by w. E. Pratt in Our oil resources, second edition, edited by L. M. Fanning, McGraw-Hill Book Company, New York, 1950. Figure does not include continental shelves.
lV Fifty percent of estimated measured, indicated, and inferred reserves of bitumen from bituminous sandstone in deposits near Vernal and Sunnyside, Utah; Casmalia, Santa Cruz, Edna, Sisquac, Sulphur Mountain, and San Ardo, Calif.; and Uvalde, Tex.
21 Fifty percent of reserves of oil in oil shale deposits having an average content of 15 barrels of oil per ton, as estimated by D. c. Duncan, u. s. Geological Survey. Personal communication. .
2/ Recoverable reserves or nat~ral gas remaining after subtracting natural gas production to January 1, 1950, from original natural gas reserves of 400 trillion cubic feet, as estimated by L. F. Terry in Our oil resources, first edition, edited by L. M. Fanning, McGraw-Hill Book Company, New York, 19~5. Figure does not include continental shelves.
"' ........
Table 5.--Total assured recoverable mineral-fuel reserves of the United States, January 1, 1950
Assured recoverable reserves and average annual production Ratio of
(Coal in billions of short tons; Assured recoverable reserves assured Percent of petroleum, bitumen from and average annual produotion recoverable total
bituminous sandstone, and oil (In quadrillions of B.t.u.) !/ reserves, as assured
Type of mineral fuel from oil shale in billions of currently recoverable barrels; and natural gas in appraised, mineral-fuel trillioQs of cubic feet) to average reserves Assured Assured annual on B.t.u. basis,
recoverable Average annual recoverable Average annual production January 1, 1950 production, production, 1940-50 reserves, 1940-50 reserves, 1940-50 January l, 1950 Jan~ary 1, 1950
Coal:
Bituminous coal ••••••••••••••• y 184.90 0.544 4,807.40 14.14 ------- 52.38
Subbituminous coal •••••••••••• y 70.16 .001 1,333.04 .13 ------ 14.53
Lignite ••••••••••••••••••••••• y 106.72. .003 1,430.05 .04 ______ ,
15.58
Anthracite and semianthracite • y 2.07 .057 52.58 1.45 ------ .57
Total coal, all ranks ••••••• 363.85 o.611 7,623.07 15.76 484 8.).06
Petroleum ••••••••••••••••••••••• .l.1ll 28.38 1.780 170.28 10.68 16 1.86
Bitumen from bituminous sandstone 21 .65 Negligible 3.90 Negligible ------ ·04
Oil from oil shale •••••••••••••• y 200.00 Negligible 1,200.00 Negligible ------ 13.08
Natural gas ••••••••••••••••••••• v 180.38 4· 710' 180.38 4.71 38 1.96
1/ Reserves and produc~ion figures converted to B.t.u. according to the following heat values: -anthracite, 12,700 B.t.u. per pound; bituminous coal, 13,000 B.t.u. per pound; subbituminous coal, 9,500 B.t.u. per pound; lignite, 6,700 B.t.u. per pound; petroleum, bitumen from bituminous sandstone, and oil from oil shale, 6,000,000 B.t.u. per barrel; and natural gas, 1,000 B.t.u. per cubic foot.
£1 Thirty percent of reserves as shown in table 1, determined by a consideration of five states for which reserve estimates have been classified by t~ickness of bed and overburden. The estimate is intended to show reserves of measured and indicated coal in beds at least 28 inches thick under no more than 2,000 feet of overburden.
Jl Includes 3.73 billion barrels of natural gas liquids •
• ~Estimate by the ~erican Petroleum Institute, as reported in the Oil and Gas Journal, vol. 49, no. 45, pp. 56-57, March 16, 1950.
S/ Fifty percent of measured and indicated reserves of bitumen from bituminous sandstone in deposits near Vernal and Sunnyside, Utah; ~asmalia, Santa Cruz, and Edna, Calif.; and Uvalde, Tex.
2/ Sixty p$rcent of measured reserves of oil shale containing 15 barrels of oil per ton, as estimated by Carl Belser in Oil shale resources of Colorado, Utah, and Wyoming, American Institute of Mining and Metallurgical Engineers Technical Publication 2358, 1948.
V Estimate by the American Gas Association, as reported in the Oil and Gas Journal, vol. 48, no. 45, pp. 56-57, March 16, 1950.
re4.u.lrements for solid fuel. If such conversion of :!oal becomes general, the needs for coal will be enormous, for 50 percent of the potential energy in coal is lost in the conversion to liquid fuel.
Although it is thus impossible to predict the life expectancy of the several mineral fuels, the ratios between the currently estimated recoverable reserves of each fuel and the present annual rates )f production provide figures that are somewhat more meaningful for comparative purposes than the reserve figures alone. As shown in table 4, the ultimately recoverable reserves of coal in the United States are 1, 612 times the average annual production during the period 1940 to 1950; the ultimately recoverable reserves of petroleum are 34 times the average annual production; and the ultimately recoverable reserves of natural gas are 59 times the average annual production.
Table 5, which is identical in arrangement with table 4, but based more conservatively on appraisals of proved or definitely assured reserves, shows that the assured recoverable reserves of coal in the United States are 484 times the recent average annual production; the assured reserves of petroleum are 16 times the average annual production; and the assured reserves of natural gas are 38 limes the average annual production.
From a consideration of the probable trends in the use of these fuels it is apparent that their probable life expectancy is quite different from the simple ratios <Jf present production as compared to reserves. Petroleum and natural gas reserves certainly have a much longer life expectancy than the ratios indicate, and coal reserves, conversely, have a shorter life exoectancy.
CONCLUSIONS
As appraised in this interim report, the coal reserves of the United States remaining in the ground on January 1, 1950, total 2, 425, 566 million tons, half of which can be regarded as ultimately recoverable. This total is made up of a number of individual state estimates, some of which were prepared as long ago as 1908, others of which were prepared in 1949. The older estimates were prepared on a highly generalized basis and were intended to represent total possible reserves in both thick and thin beds and under light 'lnd heavy overburden. These older estimates are useful only for the purpose of comparing the total reserves of one state with another. The more recent estimates have been prepared on a more conservative basis· than the older estimates and tend to be considerably smaller. A reduction of the total reserve figure reported is therefore in prospect, though the reserves still will appear abundant.
The newer state estimates prepared by the U. S. Geological Survey, five of which are presented in this report, provide additional data on coal reserves in individual counties and smalier geographic units and in categories for each rank of coal according to the thickness of the beds, their depth below the surface, and the abundance of reliable information on which the appraisals were made. The newer state estimates thus have considerable usefulness in planning for the development of the coal and the coalb....:.aring regions.
32
Extrapolating from the small amount of detailed coal reserve data now available, it appears that roughly 15 percent of the total estimated reserves given in tables 1 and 2 can be regarded as measured reserves in beds 28 inches or more thick under less than 2, 000 feet of overburden; that an additional 15 percent can be regarded as indicated reserves within the same limits of thickness and depth below the surface; and that the remaining 70 percent is inferred reserves, reserves i:q thin beds, or reserves 2, 000 to 3, 000 feet below the surface. The large percentage of inferred reserves obviously includes some coal in thick beds, ·which for lack of detailed information cannot be appraised quantitatively. These percentages are at best only rough approximations bas~d on msufficient data and are subject to change as new work is completed. Nevertheless, they serve to indicate the present state of knowledge of the NationJs coal reserves and· point to the need for additional geologic mapping, exploration, and appraisal.
On a B. t. u. basis, the total ultimately recoverable reserves of coal as appraised on January 1, 1950, represent 87 percent of the total ultimately recover able fuel resources of the United States. By comparison, the assured recoverable reserves of coal represent 83 percent of the total assured recoverable reserves of all fuels. Although petroleum and natural gas now contribute more to the national fuel needs than coal, this trend eventually will be reversed as the smaller reserves of petroleum and natural gas become depleted. The total ultimately recoverable reserves of coal as of January 1, 1950, are 1, 612 times the average annual production during the period 1940 to 1950. Assuming a great increase in coal production, these reserves still will last many generations. On any basis of analysis the coal reserves of the United States are very large by comparison with all other known available sources of heat, light, and power and give comfortable assurance that the future fuel needs of the Nation can be met in any contingency.
REFERENCES
Abernathy, G. E., Jewett, J. M., and Schoewe, W. H., 1947, Coal reserves in Kansas: State Geol. Survey Kansas Bull. 70, pt. 1.
A·merican Society for Testing Materials, 1939, Standard specifications for classification of coals by rank (A. S. T. M. Designation: D388-38): 1939 Book of A. S. T. M. Standards, pt. 3, pp. 1-6.
Ashley, G. H., 1898, The coal deposits of Indiana: Indiana Dept. Geology and Natural Resources 23d Ann. Rept.
-------------, 1908, Supplementary report (to report of 1898) on the coal deposits of Indiana: Indiana Dept. Geology and Natural Resources 33d Ann. Rept.
-------------, 1926, Topographic and geologic atlas of Pennsylvania, no. ;65, Punxsutawney quadrangle: Pennsylvania Geol. Survey, 4th ser.
-------------, 1940, Topographic and geologic atlas of Pennsylvania, no. 75, Curwensville quadrangle: Pennsylvania Geol. Survey, 4th ser.
-------------, 1944, Pennsylvania's mineral heritage, pt. 2, Mineral resources, Pennsylvania Dept. Internal Affairs, Harrisburg.
-------------, 1945, Anthracite reserves: Pennsylvania Topog. and Geol. Survey Progress Rept. 130.
Ashmead, D. C. , 1926, Anthracite losses and reserves in Pennsylvania: Pennsylvania Topog. and Geol. Survey Bull. M8.

Berryhill, H. L., Jr., Brown, D. M., Brown.Andrew, and Taylor, D. A., 1{:}50, Coal resources ofWyoming: U. S. Geol. Survey Circ. 81.
Berryhill, H. L., Jr., Brown, D. M., Burns, R. N., and Combo, J. X., Coal resources map of Wyoming: U. S. Geol. Survey Coal Inv. Map C 6 (in preparation).
Berryhill, L. R., and Averitt, Paul, Coking-coal deposits of the western United States: U. S. Geol. Survey Circ. 90 (in preparation).
Brown, Frederick, 1948, Statistical year-book of the World Power Conference, no. 4, Central office, World Power Conference, London.
Buch, J. W., Hendricks, T. A., and Toenges, A. L., 1947, Coal, in Mineral position of the United States: Hearings before a subcommittee of the Committee on Public Lands, U. S. Senate, 80th Cong., 1st sess. , pp. 231-235, May 15, 16, and 20.
Cady, G. H., 1915, Coal resources of District I [Illinois): lllirlois Min. Inv. Bull. 10.
-----------, 1916, Coal resources of District VI [Illinois]: illinois Min. Inv. Bull. 15.
-----------, 1917, Coal resources of District II [Illinois]: Illinois Min. Inv. Bull. 16.
-----------, '1919, Coal resources of District V [Illinois]: Illinois Min. Inv. Bull. 19.
-----------, 1921, Coal resources of District IV [Illinois]: Illinois 1\dn. Inv. Bull. 26.
-----------, 1944, Coal resources based on information obtained from rotary drilling: Illinois Geol. Survey Rept. Inv. 93.
-----------, 1946, Content, conduct, and results of Illinois coal resources inventories: Paper delivered at Illinois Coal Research Conference, Oct. 23-24.
-----------, 1949, Coal resources of Franklin County, Ill.: Illinois Geol. Survey Circ. 151, pp. 65-76.
Clark, F. R.., 1929, Original coal content of the fields, in Bownocker, J. A., The coal fields of Ohio: U. S. Geol. Survey Prof. Paper 100, pp. 88-96.
Cohee, G. V., Burns, R. N., Brown, Andrew, Brant, R. A., and Wright, Dorothy, 1950, Coal resources of Michigan: U. S. Geol. Survey Circ. 77.
Combo, J. X., Brown, D. M., Pulver, H. F., and Taylor, D. A., 1949, Coal resources of Montana: U. S. Geol. Survey Circ. 53.
Combo, J. X., Holmes, C. N., and Christner, H. R., 1950, Map showing coal resources of Montana: U. S. Geol. Survey Coal Inv. Miip C 2.
Culver, H. E. , 1925, Coal resources of District III [Illinois]: Illinois Min. Inv. Bull. 29.
Dowd, J. J., Turnbull, L. A., Toenges, A. L. , Cooper, H.· M., Abernethy, R. F., Reynolds, D. A., and Fraser, Thomas, 1950, Estimate of known recoverable. reserves of coking coal in Cambria County, Pa.: U. S. Bur. Mines Rept. Inv. 4734.
Eavenson, H. N. , 1946, Wasting a valuable national resource (bituminous coal): Am. In~t. Min. Met. Eng. Trans., vol. 168, pp. 11-14.
Fanning, L. M., 1945, Our oil resources, 1st ed. , McGraw-Hill Book Co. , New York.
--------------, 1950, Our oil resources, 2d ed., McGraw-Hill Book Co., New York.
Fieldner, A. C., 1950, Coal for coke production: U. S. Bur. Mines In!. Circ. 7559.
Flint, N. K., 1949, The coal reserves of Perry County, Ohio: Paper presented at Columbus meetinq of Am. Inst, Min. Met. Eng., September.
Headlee, A. J •• and Nolting, J. P., 1940, Characteristics of minable coals of West Virq1n1a: West Virginia Geol, Survey, vol. 13,
33
Hickok, W. 0., IV, and Moyer, F. T., 1940, Geology and mineral resources of Fayette County, Pa.: Pennsylvania Geol. Survey, 4th ser. , Bull. C 26.
Hendricks, T. A., 1939, Energy resources and national policy: Rept. of Energy Resources Committee to National Resources Committee, 76th Cong., 1st. sess., H. Doc. 160, pp. 281-286, January.
Hinds, Henry, 1913, The coal deposits of Missouri: Missouri Bur. Geology and Mines, 2d ser., vol. 11.
Kay, F. H., 1915, Coa,l resources of District VII I Illinois l : Illinois Min. Inv. Bull. 11.
Kay, F. H., and White, K. D., 1915, Coal resources of District VIII [Illinois): Illinois Min. Inv. Bull. 14.
Lesley, J. P., D'Invilliers, E. V., and Smith, A. D. W., 1895, Pennsylvania Geol. Survey, 2d ser., Summary, Final report, vol. 3, pt. 1, pp. 2147-2152.
MacKay, B. R. , 1947, Coal reserves of Canada: Rept. of Royal Commission on Coal, 1946.
Oil and Gas Journal, 1950, val. 48, no. 45, pp. 56-57, March 16.
Price, P. H. , Tucker, R. C. , and Haught, 0. L. , 1938, Geology and natural resources of West Virginia: West Virginia Geol. Survey, vol. 10.
Ray, F. A~, 1929, The Ohio coal supply and its exhaustion, in Bownocker, J. A. , and Dean, E. S. , Analyses of the coal of Ohio: Ohio Geol. Survey, 4th ser. , Bull. 34. .
Read, C. B., Duffner, R. T. , Wood, G. H., and Zapp, A. D.·, 1950, Coal resources of New Mexico: U. S. Geol. Survey Circ. 89r .
Reese, J. F., and Sisler, J. D., 1928, Bituminous coal fields of Pennsylvania: Pennsylvania Topog. and Geol. Survey Bull. M6, Coal resources, pp. 1-9.
Reinemund, J. A., 1949, Deep Riyer coal field, Chatham, Lee, and Moore Counties, 1\r. C.: U. S. Geol. Survey Preliminary Map.
Rice, G. S., and Paul, J. W. , 1923, Amount and nature of losses in mining bituminous coal in eastern United States: U. S. Coal Commission Rept. , pt. 3, pp. 1841-1876.
Rothrock, H. E. , 1950, Geology of anthracite in the westcentral part of the Mount Carmel quadrangle: U. S. Geol. Survey Coal Inv. Map C 3.
Shaffner, M. N. , 1946, Topographic and geologic atlas of Pennsylvania, no. 55, Smicksburg quadrangle: · Pennsylvania Geol. Survey, 4th ser.
Smith, A. D. W., 1893, Report of Pennsylvania Coal Waste Commission.
Smith, G. 0., and others, 1913, The classification of public lands: U. S. Geol. Survey Bull. 537.
Toenges, A. L., Turnbull, L. A. , Williams, Lloyd, Smith, H. L., O'Donnell, H. J., Cooper, H. M., Abernethy, R. F., and Waage, Karl, 1949, Investigations of the lower coal beds in Georges Creek and north part of Upper Potomac basins, Allegany and Garrett Counties, Md.: U. S. Bur. Mines Tech. Paper 725.
Twelfth International Geological Congress, J.913, The coal resources of the world: Inquiry made on initiative of executive committee, Morang and Go. Ltd., Toronto.
U. S. Bureau of Mines, 1950, Production of bituminous coal and lignite: U. S. Bur. Mines Mine!al Industry Surveys, Weekly Coal Rept., March 31.
Weeks, L. G., 1948, Highlights on 1947 developments ln fore1qn petroleum fields: Am. Assoc. Petroleum Geoloqists Bull. , vol. 32, no. e. . ·
Wrather, W. E., Boyd, James, Smith, N. L., and Ayres, Euqene, 1950, Enerqy resources of the United States, Fourth Wo,rld Power Conference, London.