Embed Size (px)
Citation preview
Coal Seam, Shale and Tight Gas in Australia: Resources Assessment and Operation Overview
2015
Upstream Petroleum Resources Working Group Report to COAG Energy Council
November 2015
Contents Introduction 2 Key points 3 Unconventional Gas Reserves/Resources 4 Scope and assumptions 4 Definitions 4 SPE PRMS 5 Resource potential by jurisdiction 6 References 6 Summaries: Queensland 7 New South Wales 16 Victoria 20 Tasmania 22 South Australia 23 Western Australia 27 Northern Territory 30 Introduction This report updates the 2014 report produced for the COAG Energy Council. The significant changes from the 2014 report are:
• Increase in Queensland’s 2C resources from 0 PJ to 24 841 PJ. • Increase in New South Wales’ 2P reserves from 2 619 PJ to 3 082 PJ and
2C resources from 4 128 PJ to 10 492 PJ, • Increase in South Australia’s 2C resources from 5 395 PJ to 8 034 PJ.
Page 2
Key points
• Current booked coal seam gas reserves exceed current LNG contract requirements
Current Queensland coal seam gas reserves allocated to LNG projects total 31.3 Tcf (33 178 PJ) while contracted volumes total 26.2 Tcf (27 772 PJ) of gas. Arrow Energy has an additional 10.8 Tcf (11 448 PJ) of currently uncommitted gas.
• Current drilling rates meet estimated required drilling rates for coal seam gas wells
Current drilling rates are similar to projected required drilling rates so should be sustainable in the longer term (see Figure 2.4).
• There is a risk of shortfall in the rate of gas supply due to production capacity that is dependent on actual well production rates. The data required to estimate the magnitude of the risk is not currently available to Geoscience Australia
The contracted gas volumes and projected drilling rates set a critical period from late 2015 through early 2019 where the required production rate per well will be at an average of between 400 000 and 500 000 cubic feet per day per well (if only gas resources allocated to the projects are considered). It is not clear to Geoscience Australia that production will be able to be sustained at this level for that duration and we do not currently have access to the data required to assess the risk. However, the analysis of historical CSG production rates in Queensland (Table 2.5) seems to provide evidence for a positive outcome.
Page 3
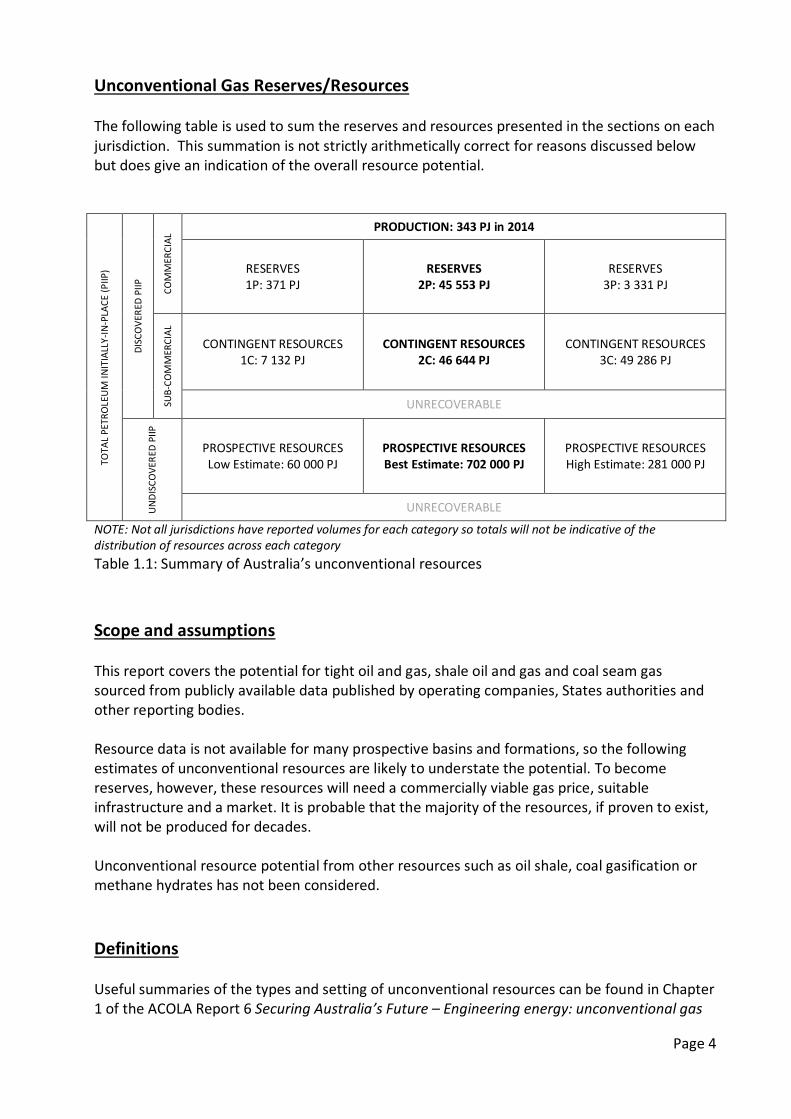
Unconventional Gas Reserves/Resources The following table is used to sum the reserves and resources presented in the sections on each jurisdiction. This summation is not strictly arithmetically correct for reasons discussed below but does give an indication of the overall resource potential.
TOTA
L PE
TRO
LEU
M IN
ITIA
LLY-
IN-P
LACE
(PIIP
)
DISC
OVE
RED
PIIP
COM
MER
CIAL
PRODUCTION: 343 PJ in 2014
RESERVES 1P: 371 PJ
RESERVES 2P: 45 553 PJ
RESERVES 3P: 3 331 PJ
SUB-
COM
MER
CIAL
CONTINGENT RESOURCES 1C: 7 132 PJ
CONTINGENT RESOURCES 2C: 46 644 PJ
CONTINGENT RESOURCES 3C: 49 286 PJ
UNRECOVERABLE
UN
DIS
COVE
RED
PIIP
PROSPECTIVE RESOURCES Low Estimate: 60 000 PJ
PROSPECTIVE RESOURCES Best Estimate: 702 000 PJ
PROSPECTIVE RESOURCES High Estimate: 281 000 PJ
UNRECOVERABLE
NOTE: Not all jurisdictions have reported volumes for each category so totals will not be indicative of the distribution of resources across each category Table 1.1: Summary of Australia’s unconventional resources Scope and assumptions This report covers the potential for tight oil and gas, shale oil and gas and coal seam gas sourced from publicly available data published by operating companies, States authorities and other reporting bodies. Resource data is not available for many prospective basins and formations, so the following estimates of unconventional resources are likely to understate the potential. To become reserves, however, these resources will need a commercially viable gas price, suitable infrastructure and a market. It is probable that the majority of the resources, if proven to exist, will not be produced for decades. Unconventional resource potential from other resources such as oil shale, coal gasification or methane hydrates has not been considered. Definitions Useful summaries of the types and setting of unconventional resources can be found in Chapter 1 of the ACOLA Report 6 Securing Australia’s Future – Engineering energy: unconventional gas
Page 4
production (see link in References) and in the Roadmap for Unconventional Gas Projects in South Australia (see link in References) which also includes a brief description of the SPE PRMS resource reporting system in Chapter 1. The following definitions have been adopted in listing the prospective formations in each jurisdiction:
Inactive – The formation may contain a resource but there is no current activity Preliminary exploration – The formation is being actively explored Under assessment – The formation is being tested for its ability to produce commercially Producing – The formation is currently producing
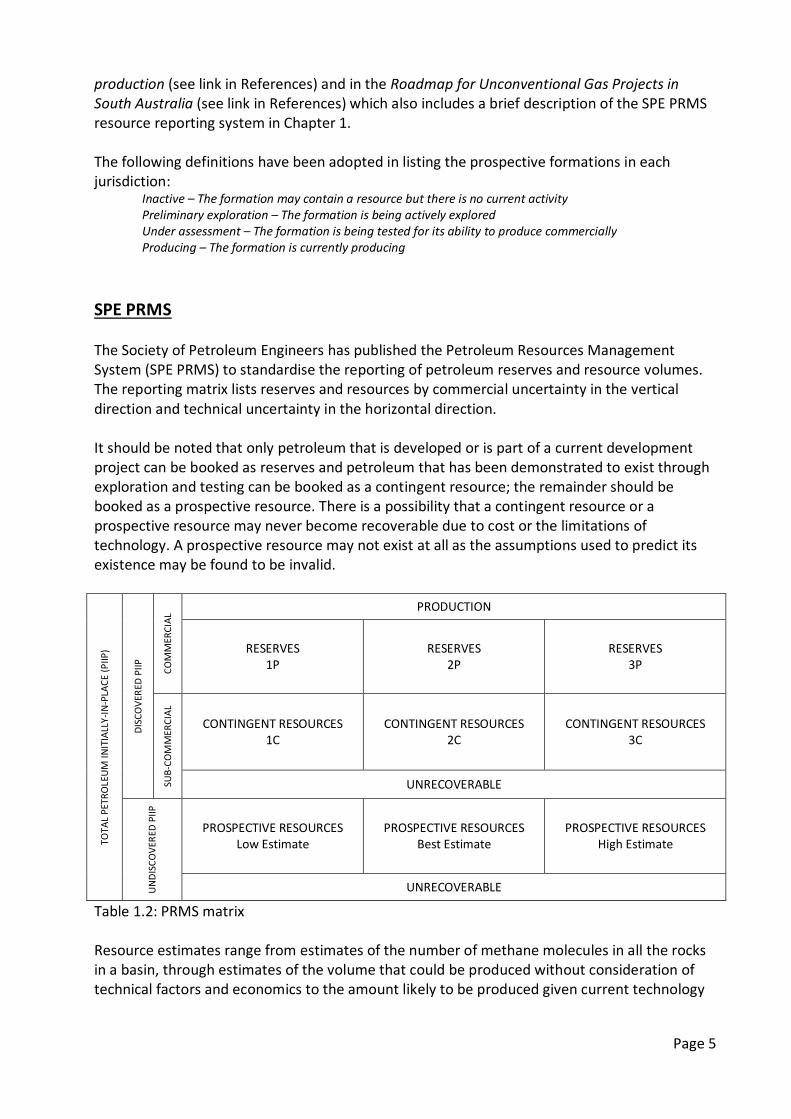
SPE PRMS The Society of Petroleum Engineers has published the Petroleum Resources Management System (SPE PRMS) to standardise the reporting of petroleum reserves and resource volumes. The reporting matrix lists reserves and resources by commercial uncertainty in the vertical direction and technical uncertainty in the horizontal direction. It should be noted that only petroleum that is developed or is part of a current development project can be booked as reserves and petroleum that has been demonstrated to exist through exploration and testing can be booked as a contingent resource; the remainder should be booked as a prospective resource. There is a possibility that a contingent resource or a prospective resource may never become recoverable due to cost or the limitations of technology. A prospective resource may not exist at all as the assumptions used to predict its existence may be found to be invalid.
TOTA
L PE
TRO
LEU
M IN
ITIA
LLY-
IN-P
LACE
(PIIP
)
DISC
OVE
RED
PIIP
COM
MER
CIAL
PRODUCTION
RESERVES 1P
RESERVES 2P
RESERVES 3P
SUB-
COM
MER
CIAL
CONTINGENT RESOURCES 1C
CONTINGENT RESOURCES 2C
CONTINGENT RESOURCES 3C
UNRECOVERABLE
UN
DIS
COVE
RED
PIIP
PROSPECTIVE RESOURCES Low Estimate
PROSPECTIVE RESOURCES Best Estimate
PROSPECTIVE RESOURCES High Estimate
UNRECOVERABLE
Table 1.2: PRMS matrix Resource estimates range from estimates of the number of methane molecules in all the rocks in a basin, through estimates of the volume that could be produced without consideration of technical factors and economics to the amount likely to be produced given current technology
Page 5
and commercial considerations. It is important to consider the nature of these different types of estimates when looking at resources in the PRMS matrix. A description of the definitions used in the system is on the SPE website (see link in References). A non-technical guideline and the full guideline, including sections on estimation of different types of unconventional resource are also available (see links in References). Resource potential by jurisdiction The body of the report presents data on unconventional resources in each onshore jurisdiction. The unconventional resource potential section includes listings of the basins and formations that are currently thought to be prospective, including the type(s) of resource thought to be present and the current exploration and development status of the formation. The reserves/resources section is a compilation of the reserves and resources, which are listed according to Geoscience Australia’s best estimate of where they should be placed in the SPE PRMS matrix. The totals are a summation of each of the categories of reserve or resource but it should be noted that in many instances only data in the 2P Reserves, 2C Contingent Resources and Best Estimate Prospective Resources categories have been provided. The unconventional resource drilling activity section tabulates drilling activity. The commentary section includes Geoscience Australia’s and States/NT’s observations on the status of unconventional resources in the jurisdiction and any caveats that should be applied in interpreting the data. References ACOLA Report 6 Securing Australia’s Future – Engineering energy: unconventional gas
Production http://www.acola.org.au/PDF/SAF06FINAL/Final%20Report%20Engineering%20Energy%20June%202013.pdf
DMITRE South Australia http://www.petroleum.dmitre.sa.gov.au/__data/assets/pdf_file/0008/179621/Roadmap_Unconventional_Gas_Projects_SA_12-12-12_web.pdf
EIA/ARI World Shale Gas and Shale Oil Resource Assessment http://www.eia.gov/analysis/studies/worldshalegas/
SPE Guidelines for Application of the Petroleum Resources Management System http://www.spe.org/industry/docs/PRMS_Guidelines_Nov2011.pdf
SPE Petroleum Resources Management System http://www.spe.org/industry/docs/Petroleum_Resources_Management_System_2007.pdf
SPE Petroleum Resources Management System Guide for Non-Technical Users http://www.spe.org/industry/docs/PRMS_guide_non_tech.pdf
Page 6
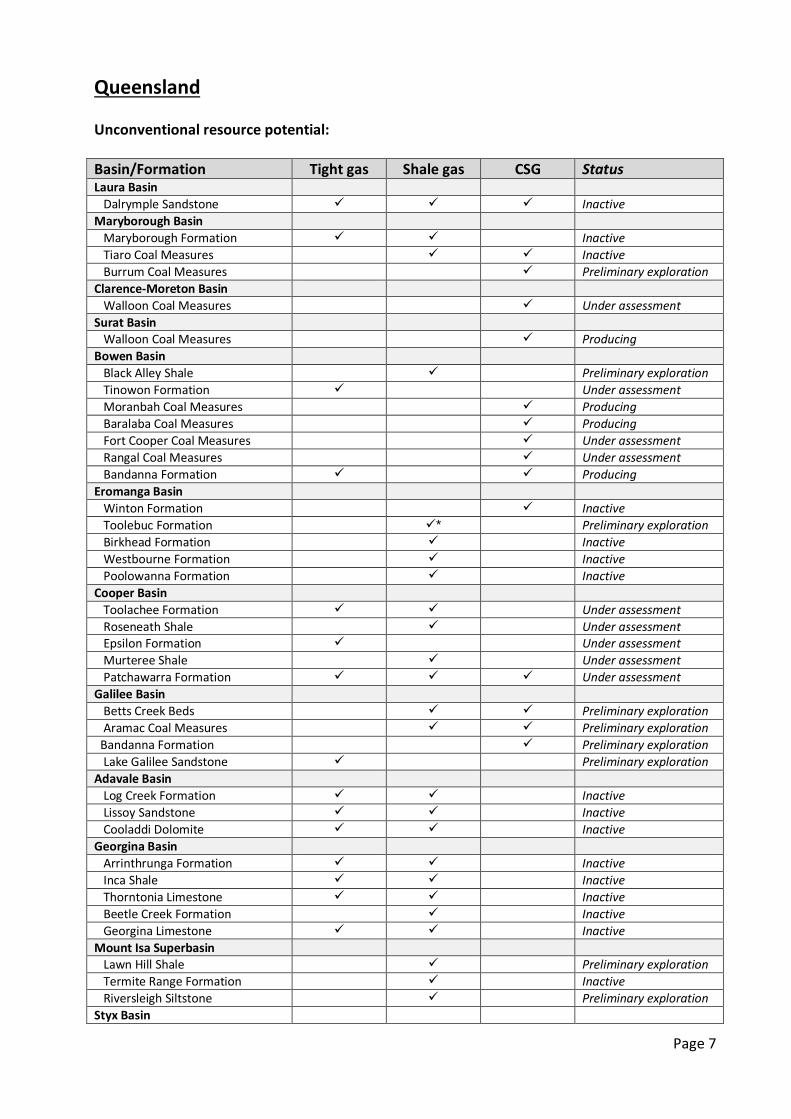
Queensland Unconventional resource potential: Basin/Formation Tight gas Shale gas CSG Status Laura Basin Dalrymple Sandstone Inactive Maryborough Basin Maryborough Formation Inactive Tiaro Coal Measures Inactive Burrum Coal Measures Preliminary exploration Clarence-Moreton Basin Walloon Coal Measures Under assessment Surat Basin Walloon Coal Measures Producing Bowen Basin Black Alley Shale Preliminary exploration Tinowon Formation Under assessment Moranbah Coal Measures Producing Baralaba Coal Measures Producing Fort Cooper Coal Measures Under assessment Rangal Coal Measures Under assessment Bandanna Formation Producing Eromanga Basin Winton Formation Inactive Toolebuc Formation * Preliminary exploration Birkhead Formation Inactive Westbourne Formation Inactive Poolowanna Formation Inactive Cooper Basin Toolachee Formation Under assessment Roseneath Shale Under assessment Epsilon Formation Under assessment Murteree Shale Under assessment Patchawarra Formation Under assessment Galilee Basin Betts Creek Beds Preliminary exploration Aramac Coal Measures Preliminary exploration Bandanna Formation Preliminary exploration Lake Galilee Sandstone Preliminary exploration Adavale Basin Log Creek Formation Inactive Lissoy Sandstone Inactive Cooladdi Dolomite Inactive Georgina Basin Arrinthrunga Formation Inactive Inca Shale Inactive Thorntonia Limestone Inactive Beetle Creek Formation Inactive Georgina Limestone Inactive Mount Isa Superbasin Lawn Hill Shale Preliminary exploration Termite Range Formation Inactive Riversleigh Siltstone Preliminary exploration Styx Basin
Page 7
Styx Coal Measures Preliminary exploration Ipswich Basin Tivoli Formation Preliminary exploration *Unconventional oil and gas potential Table 2.1: Queensland unconventional resource potential Reserves/Resources:
TOTA
L PE
TRO
LEU
M IN
ITIA
LLY-
IN-P
LACE
(PIIP
)
DISC
OVE
RED
PIIP
COM
MER
CIAL
PRODUCTION: 336.5 PJ in 2014*
RESERVES 1P
RESERVES 2P: 42 434 PJ*
RESERVES 3P
SUB-
COM
MER
CIAL
CONTINGENT RESOURCES 1C: 936 PJ
CONTINGENT RESOURCES 2C: 24 841 PJ**
CONTINGENT RESOURCES 3C: 13 768 PJ
UNRECOVERABLE
UN
DIS
COVE
RED
PIIP
PROSPECTIVE RESOURCES Low Estimate: 5 554 PJ
PROSPECTIVE RESOURCES Best Estimate: 174 719 PJ***
PROSPECTIVE RESOURCES High Estimate: 22 068 PJ
UNRECOVERABLE
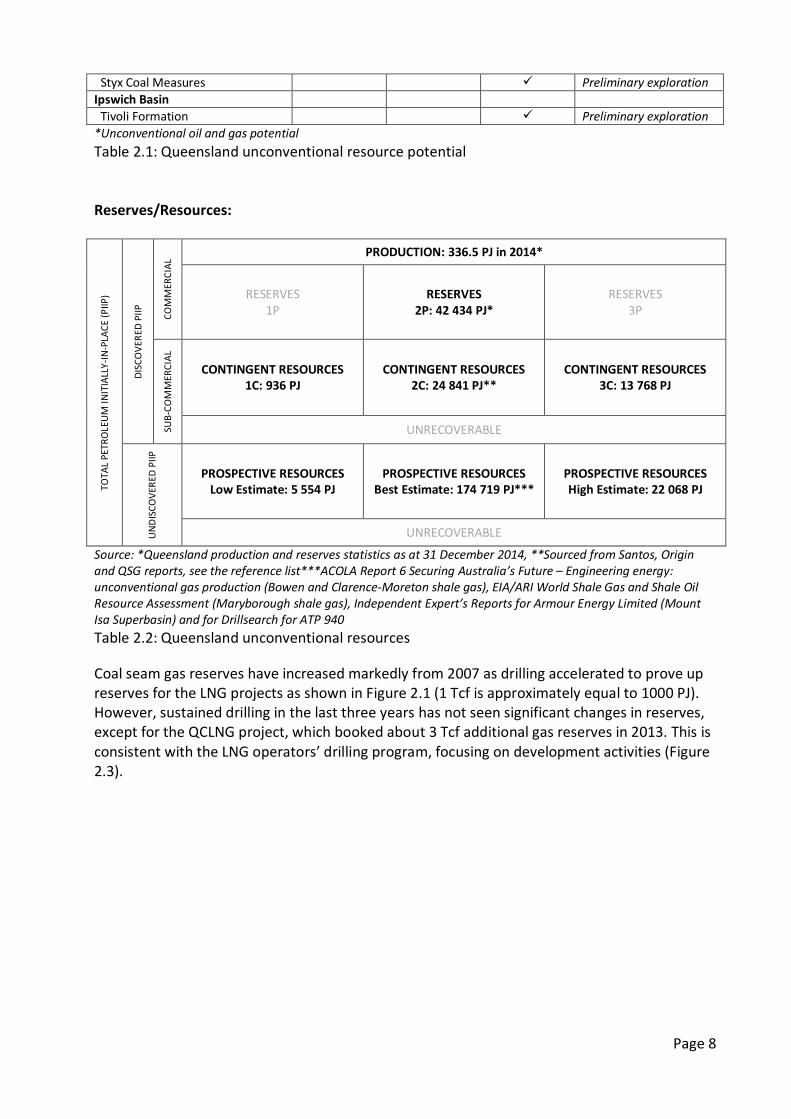
Source: *Queensland production and reserves statistics as at 31 December 2014, **Sourced from Santos, Origin and QSG reports, see the reference list***ACOLA Report 6 Securing Australia’s Future – Engineering energy: unconventional gas production (Bowen and Clarence-Moreton shale gas), EIA/ARI World Shale Gas and Shale Oil Resource Assessment (Maryborough shale gas), Independent Expert’s Reports for Armour Energy Limited (Mount Isa Superbasin) and for Drillsearch for ATP 940 Table 2.2: Queensland unconventional resources Coal seam gas reserves have increased markedly from 2007 as drilling accelerated to prove up reserves for the LNG projects as shown in Figure 2.1 (1 Tcf is approximately equal to 1000 PJ). However, sustained drilling in the last three years has not seen significant changes in reserves, except for the QCLNG project, which booked about 3 Tcf additional gas reserves in 2013. This is consistent with the LNG operators’ drilling program, focusing on development activities (Figure 2.3).
Page 8
Figure 2.1: Queensland reserves growth in coal seam gas for LNG projects Production/Forecasts: The total annual gas production for the State was about 377 PJ in 2014 (40 PJ of conventional gas and 337 PJ of coal seam gas, the equivalent of about 6 MT LNG). In contrast, the forecast gas demand to supply the CSG LNG projects will be about 25 MT/a or almost 1400 PJ/a for a total of 18.5 Tcf (19 400 PJ) of gas over the current contracts. This is shown by contract in Figure 2.2, compiled from published LNG export volumes.
0
2
4
6
8
10
12
14
1/01/2005 1/01/2007 1/01/2009 1/01/2011 1/01/2013 1/01/2015
Rese
rves
(Tcf
)
GLNG QCLNG APLNG Arrow
Page 9
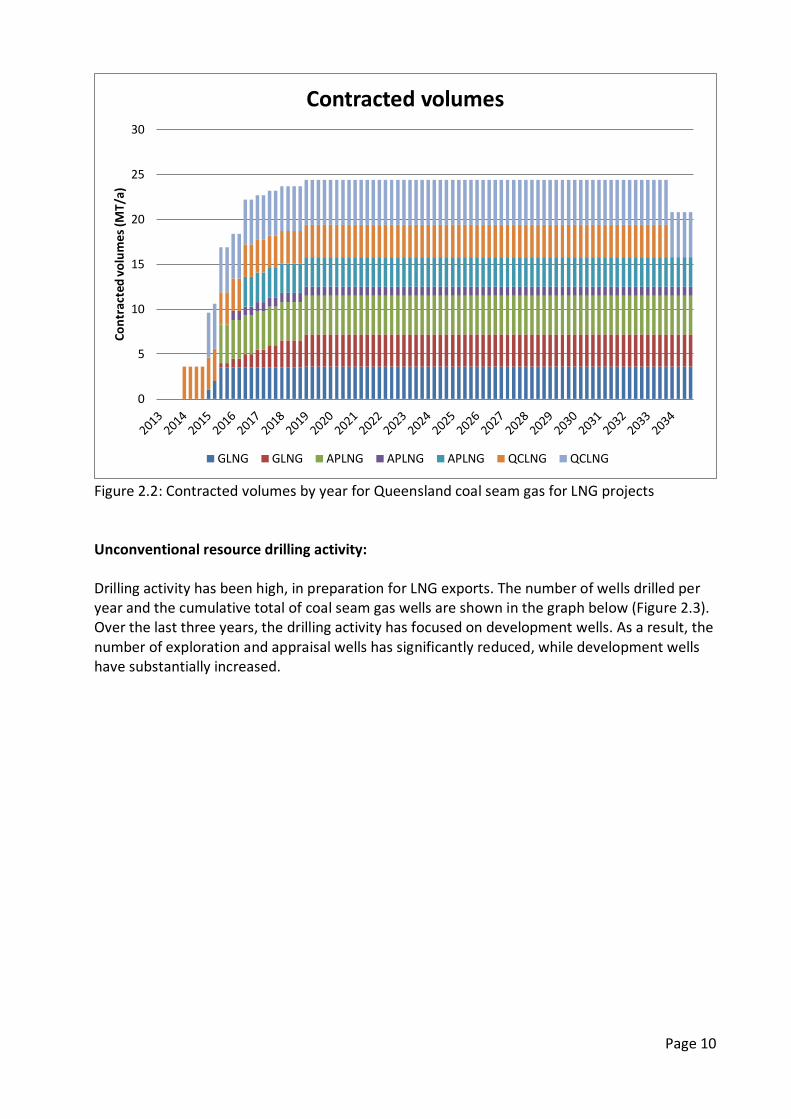
Figure 2.2: Contracted volumes by year for Queensland coal seam gas for LNG projects Unconventional resource drilling activity: Drilling activity has been high, in preparation for LNG exports. The number of wells drilled per year and the cumulative total of coal seam gas wells are shown in the graph below (Figure 2.3). Over the last three years, the drilling activity has focused on development wells. As a result, the number of exploration and appraisal wells has significantly reduced, while development wells have substantially increased.
0
5
10
15
20
25
30Co
ntra
cted
volu
mes
(MT/
a)
Contracted volumes
GLNG GLNG APLNG APLNG APLNG QCLNG QCLNG
Page 10
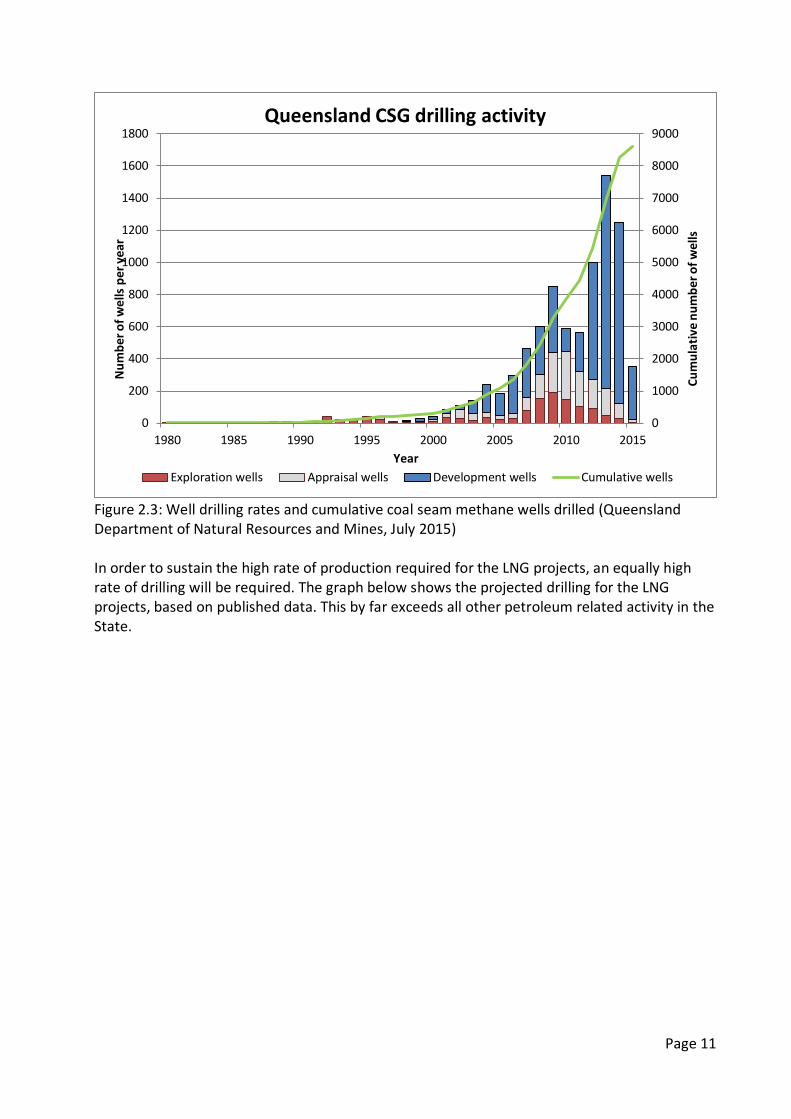
Figure 2.3: Well drilling rates and cumulative coal seam methane wells drilled (Queensland Department of Natural Resources and Mines, July 2015) In order to sustain the high rate of production required for the LNG projects, an equally high rate of drilling will be required. The graph below shows the projected drilling for the LNG projects, based on published data. This by far exceeds all other petroleum related activity in the State.
0
1000
2000
3000
4000
5000
6000
7000
8000
9000
0
200
400
600
800
1000
1200
1400
1600
1800
1980 1985 1990 1995 2000 2005 2010 2015
Cum
ulat
ive
num
ber o
f wel
ls
Num
ber o
f wel
ls p
er y
ear
Year
Queensland CSG drilling activity
Exploration wells Appraisal wells Development wells Cumulative wells
Page 11
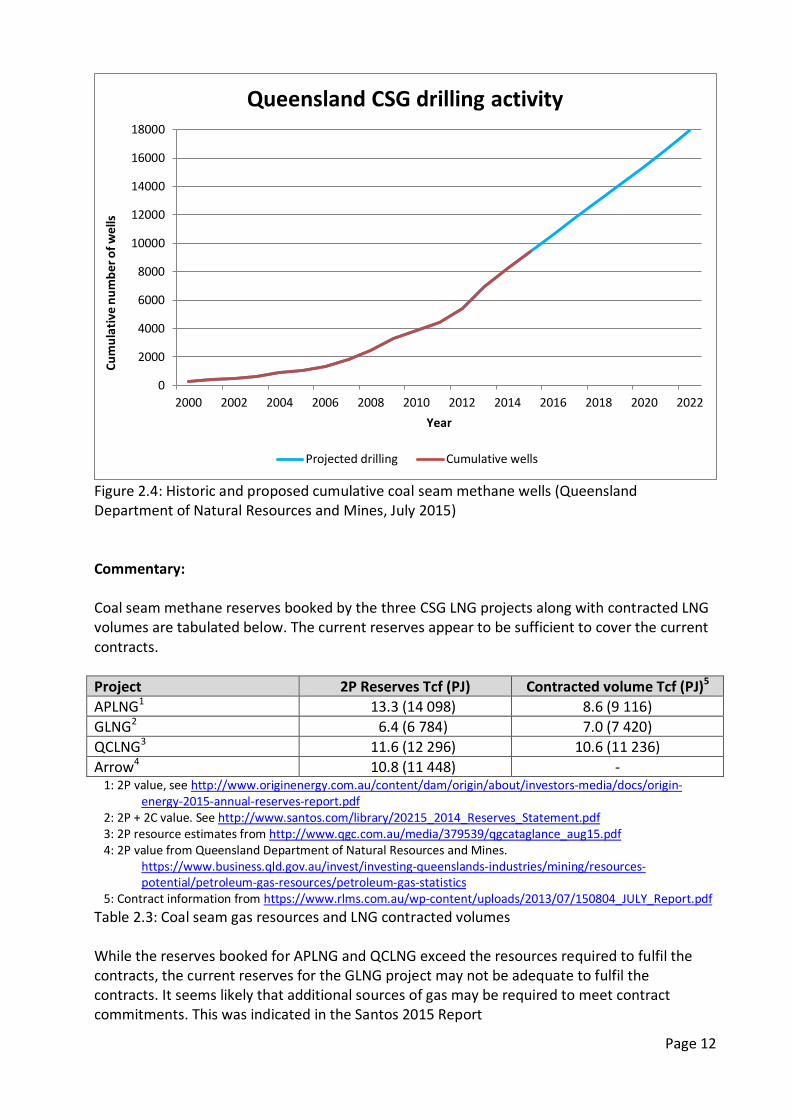
Figure 2.4: Historic and proposed cumulative coal seam methane wells (Queensland Department of Natural Resources and Mines, July 2015) Commentary: Coal seam methane reserves booked by the three CSG LNG projects along with contracted LNG volumes are tabulated below. The current reserves appear to be sufficient to cover the current contracts. Project 2P Reserves Tcf (PJ) Contracted volume Tcf (PJ)5 APLNG1 13.3 (14 098) 8.6 (9 116) GLNG2 6.4 (6 784) 7.0 (7 420) QCLNG3 11.6 (12 296) 10.6 (11 236) Arrow4 10.8 (11 448) -
1: 2P value, see http://www.originenergy.com.au/content/dam/origin/about/investors-media/docs/origin-energy-2015-annual-reserves-report.pdf
2: 2P + 2C value. See http://www.santos.com/library/20215_2014_Reserves_Statement.pdf 3: 2P resource estimates from http://www.qgc.com.au/media/379539/qgcataglance_aug15.pdf 4: 2P value from Queensland Department of Natural Resources and Mines.
https://www.business.qld.gov.au/invest/investing-queenslands-industries/mining/resources-potential/petroleum-gas-resources/petroleum-gas-statistics
5: Contract information from https://www.rlms.com.au/wp-content/uploads/2013/07/150804_JULY_Report.pdf Table 2.3: Coal seam gas resources and LNG contracted volumes While the reserves booked for APLNG and QCLNG exceed the resources required to fulfil the contracts, the current reserves for the GLNG project may not be adequate to fulfil the contracts. It seems likely that additional sources of gas may be required to meet contract commitments. This was indicated in the Santos 2015 Report
0
2000
4000
6000
8000
10000
12000
14000
16000
18000
2000 2002 2004 2006 2008 2010 2012 2014 2016 2018 2020 2022
Cum
ulat
ive
num
ber o
f wel
ls
Year
Queensland CSG drilling activity
Projected drilling Cumulative wells
Page 12
(http://www.santos.com/library/070515_Macquarie%20Australia_Conference_Presentation.pdf ). The report stated (p14)
• GLNG has an integrated gas supply portfolio of indigenous gas, Santos portfolio gas, third party supply and gas storage
• GLNG proved reserves grew by 22% and proved and probable reserves by 4% in 2014, primarily due to positive re-assessments in the Fairview, Roma and Scotia fields
• GLNG has secured up to 2,228 PJ of Santos portfolio and third party gas supply agreements • GLNG also has 1,202 PJ of 2C resources
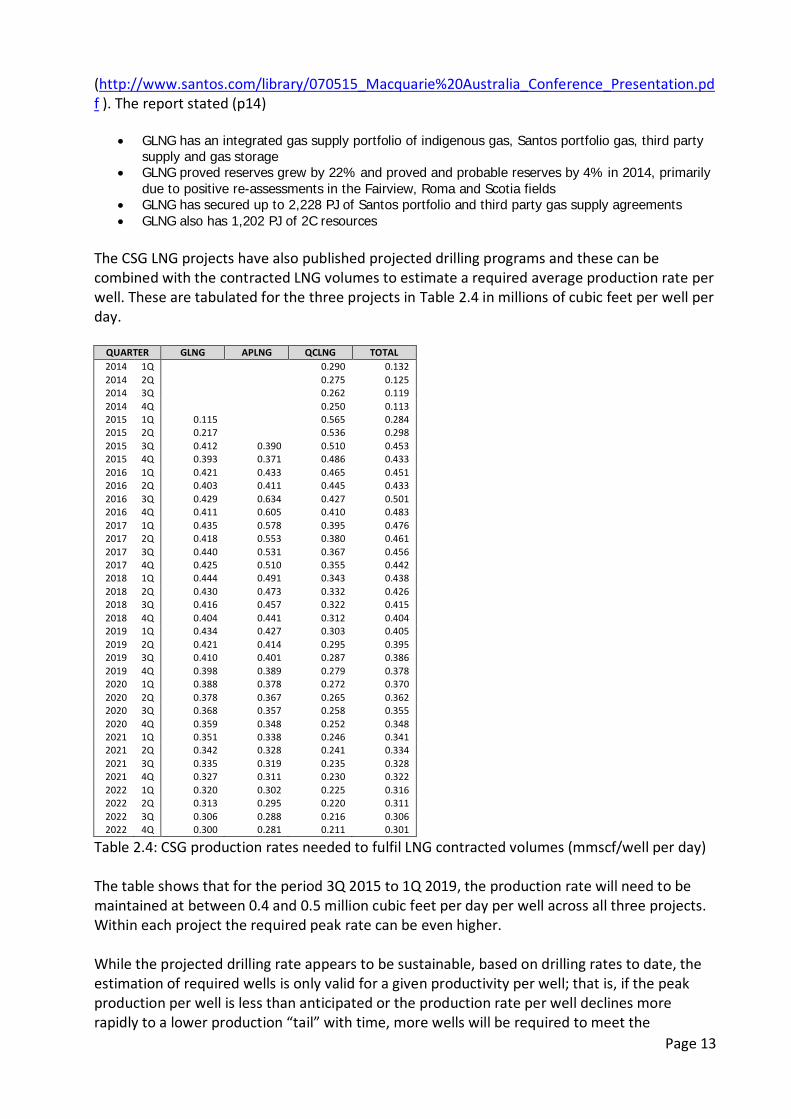
The CSG LNG projects have also published projected drilling programs and these can be combined with the contracted LNG volumes to estimate a required average production rate per well. These are tabulated for the three projects in Table 2.4 in millions of cubic feet per well per day.
QUARTER GLNG APLNG QCLNG TOTAL 2014 1Q 0.290 0.132 2014 2Q
0.275 0.125
2014 3Q
0.262 0.119 2014 4Q
0.250 0.113
2015 1Q 0.115
0.565 0.284 2015 2Q 0.217
0.536 0.298
2015 3Q 0.412 0.390 0.510 0.453 2015 4Q 0.393 0.371 0.486 0.433 2016 1Q 0.421 0.433 0.465 0.451 2016 2Q 0.403 0.411 0.445 0.433 2016 3Q 0.429 0.634 0.427 0.501 2016 4Q 0.411 0.605 0.410 0.483 2017 1Q 0.435 0.578 0.395 0.476 2017 2Q 0.418 0.553 0.380 0.461 2017 3Q 0.440 0.531 0.367 0.456 2017 4Q 0.425 0.510 0.355 0.442 2018 1Q 0.444 0.491 0.343 0.438 2018 2Q 0.430 0.473 0.332 0.426 2018 3Q 0.416 0.457 0.322 0.415 2018 4Q 0.404 0.441 0.312 0.404 2019 1Q 0.434 0.427 0.303 0.405 2019 2Q 0.421 0.414 0.295 0.395 2019 3Q 0.410 0.401 0.287 0.386 2019 4Q 0.398 0.389 0.279 0.378 2020 1Q 0.388 0.378 0.272 0.370 2020 2Q 0.378 0.367 0.265 0.362 2020 3Q 0.368 0.357 0.258 0.355 2020 4Q 0.359 0.348 0.252 0.348 2021 1Q 0.351 0.338 0.246 0.341 2021 2Q 0.342 0.328 0.241 0.334 2021 3Q 0.335 0.319 0.235 0.328 2021 4Q 0.327 0.311 0.230 0.322 2022 1Q 0.320 0.302 0.225 0.316 2022 2Q 0.313 0.295 0.220 0.311 2022 3Q 0.306 0.288 0.216 0.306 2022 4Q 0.300 0.281 0.211 0.301
Table 2.4: CSG production rates needed to fulfil LNG contracted volumes (mmscf/well per day) The table shows that for the period 3Q 2015 to 1Q 2019, the production rate will need to be maintained at between 0.4 and 0.5 million cubic feet per day per well across all three projects. Within each project the required peak rate can be even higher. While the projected drilling rate appears to be sustainable, based on drilling rates to date, the estimation of required wells is only valid for a given productivity per well; that is, if the peak production per well is less than anticipated or the production rate per well declines more rapidly to a lower production “tail” with time, more wells will be required to meet the
Page 13
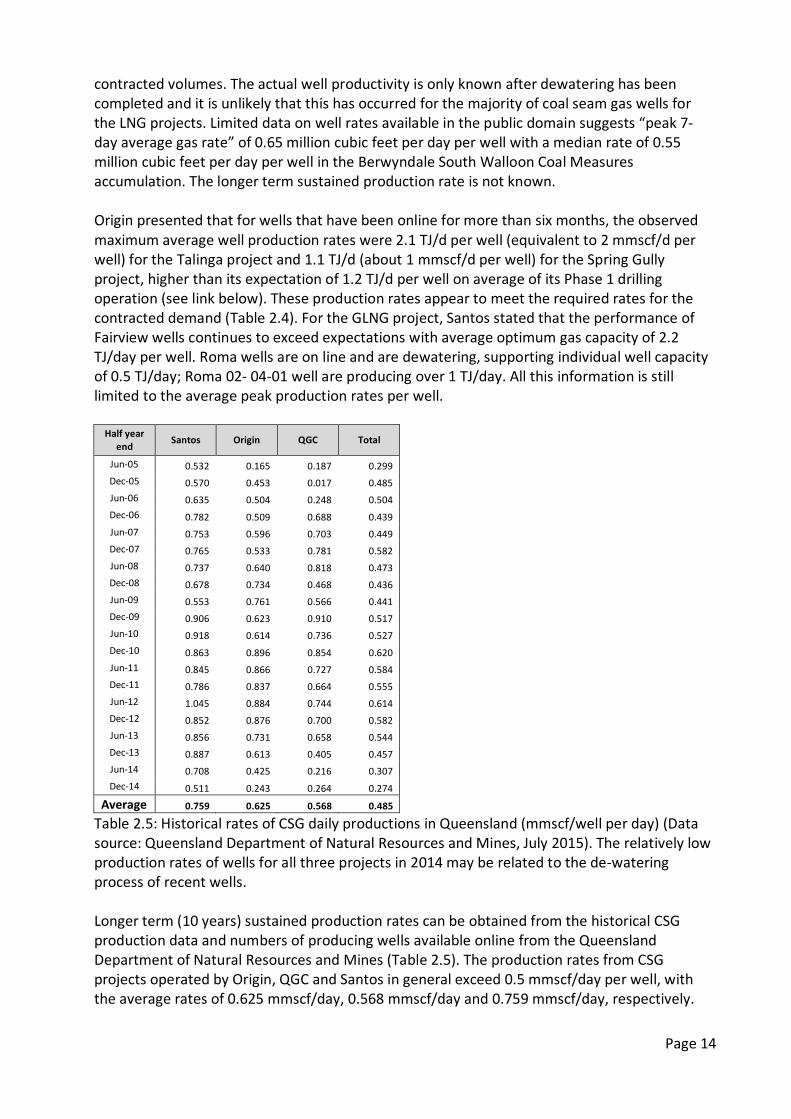
contracted volumes. The actual well productivity is only known after dewatering has been completed and it is unlikely that this has occurred for the majority of coal seam gas wells for the LNG projects. Limited data on well rates available in the public domain suggests “peak 7-day average gas rate” of 0.65 million cubic feet per day per well with a median rate of 0.55 million cubic feet per day per well in the Berwyndale South Walloon Coal Measures accumulation. The longer term sustained production rate is not known. Origin presented that for wells that have been online for more than six months, the observed maximum average well production rates were 2.1 TJ/d per well (equivalent to 2 mmscf/d per well) for the Talinga project and 1.1 TJ/d (about 1 mmscf/d per well) for the Spring Gully project, higher than its expectation of 1.2 TJ/d per well on average of its Phase 1 drilling operation (see link below). These production rates appear to meet the required rates for the contracted demand (Table 2.4). For the GLNG project, Santos stated that the performance of Fairview wells continues to exceed expectations with average optimum gas capacity of 2.2 TJ/day per well. Roma wells are on line and are dewatering, supporting individual well capacity of 0.5 TJ/day; Roma 02- 04-01 well are producing over 1 TJ/day. All this information is still limited to the average peak production rates per well.
Half year end
Santos Origin QGC Total
Jun-05 0.532 0.165 0.187 0.299 Dec-05 0.570 0.453 0.017 0.485 Jun-06 0.635 0.504 0.248 0.504 Dec-06 0.782 0.509 0.688 0.439 Jun-07 0.753 0.596 0.703 0.449 Dec-07 0.765 0.533 0.781 0.582 Jun-08 0.737 0.640 0.818 0.473 Dec-08 0.678 0.734 0.468 0.436 Jun-09 0.553 0.761 0.566 0.441 Dec-09 0.906 0.623 0.910 0.517 Jun-10 0.918 0.614 0.736 0.527 Dec-10 0.863 0.896 0.854 0.620 Jun-11 0.845 0.866 0.727 0.584 Dec-11 0.786 0.837 0.664 0.555 Jun-12 1.045 0.884 0.744 0.614 Dec-12 0.852 0.876 0.700 0.582 Jun-13 0.856 0.731 0.658 0.544 Dec-13 0.887 0.613 0.405 0.457 Jun-14 0.708 0.425 0.216 0.307 Dec-14 0.511 0.243 0.264 0.274
Average 0.759 0.625 0.568 0.485
Table 2.5: Historical rates of CSG daily productions in Queensland (mmscf/well per day) (Data source: Queensland Department of Natural Resources and Mines, July 2015). The relatively low production rates of wells for all three projects in 2014 may be related to the de-watering process of recent wells. Longer term (10 years) sustained production rates can be obtained from the historical CSG production data and numbers of producing wells available online from the Queensland Department of Natural Resources and Mines (Table 2.5). The production rates from CSG projects operated by Origin, QGC and Santos in general exceed 0.5 mmscf/day per well, with the average rates of 0.625 mmscf/day, 0.568 mmscf/day and 0.759 mmscf/day, respectively.
Page 14
From these long term production rates, it seems that the CSG production rates would be adequate for fulfilling the committed contracts (Table 2.4). References: Armour Energy
http://www.armourenergy.com.au/investors/investment-research (7-August-2013) Beach Energy for ATP 588
http://www.beachenergy.com.au/IRM/Company/ShowPage.aspx/PDFs/3985-10000000/NTNGContingentResources
Independent Expert’s Report for Armour Energy Limited http://www.empireenergy.com/pdf/McArthur%20Basin%20Armour%20Co%20Ltd%20Ind.%20Geo's%20Report.pdf
Origin APLNG Operational Review and Asset Visit (May 2014) https://www.originenergy.com.au/content/dam/origin/about/investors-media/docs/june-2015-quarterly-production-report-consolidated-31072015.pdf
BG Group’s LNG business: http://www.qgc.com.au/media/379539/qgcataglance_aug15.pdf
Queensland production and reserves statistics December 2014 https://www.business.qld.gov.au/invest/investing-queenslands-industries/mining/resources-
potential/petroleum-gas-resources/petroleum-gas-statistics Resource and Land Management Services, Eastern Australia Upstream Gas Report July 2015
https://www.rlms.com.au/wp-content/uploads/2013/07/150804_JULY_Report.pdf Santos 2014 Reserves Statement
http://www.santos.com/library/20215_2014_Reserves_Statement.pdf Santos GLNG contracted resources and well production rates
http://www.santos.com/library/2014_09_15_%20CLSA%20presentation.pdf (pages 113-14)
Page 15
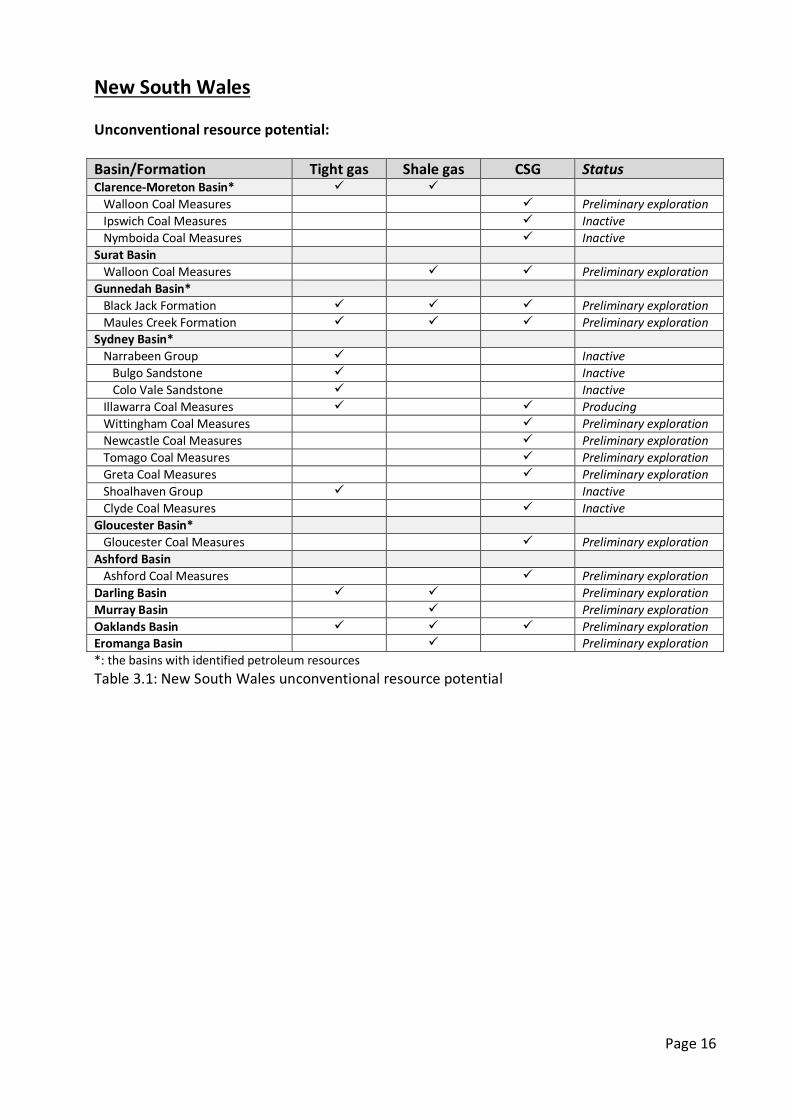
New South Wales Unconventional resource potential: Basin/Formation Tight gas Shale gas CSG Status Clarence-Moreton Basin* Walloon Coal Measures Preliminary exploration Ipswich Coal Measures Inactive Nymboida Coal Measures Inactive Surat Basin Walloon Coal Measures Preliminary exploration Gunnedah Basin* Black Jack Formation Preliminary exploration Maules Creek Formation Preliminary exploration Sydney Basin* Narrabeen Group Inactive Bulgo Sandstone Inactive Colo Vale Sandstone Inactive Illawarra Coal Measures Producing Wittingham Coal Measures Preliminary exploration Newcastle Coal Measures Preliminary exploration Tomago Coal Measures Preliminary exploration Greta Coal Measures Preliminary exploration Shoalhaven Group Inactive Clyde Coal Measures Inactive Gloucester Basin* Gloucester Coal Measures Preliminary exploration Ashford Basin Ashford Coal Measures Preliminary exploration Darling Basin Preliminary exploration Murray Basin Preliminary exploration Oaklands Basin Preliminary exploration Eromanga Basin Preliminary exploration *: the basins with identified petroleum resources Table 3.1: New South Wales unconventional resource potential
Page 16
Reserves/Resources:
TOTA
L PE
TRO
LEU
M IN
ITIA
LLY-
IN-P
LACE
(PIIP
)
DISC
OVE
RED
PIIP
COM
MER
CIAL
PRODUCTION: 6.2 PJ/a
RESERVES 1P: 371 PJ
RESERVES 2P: 3 082 PJ
RESERVES 3P: 3 331 PJ
SUB-
COM
MER
CIAL
CONTINGENT RESOURCES 1C: 2 422 PJ
CONTINGENT RESOURCES 2C: 10 656 PJ
CONTINGENT RESOURCES 3C: 16 913 PJ
UNRECOVERABLE
UN
DIS
COVE
RED
PIIP
PROSPECTIVE RESOURCES Low Estimate
PROSPECTIVE RESOURCES Best Estimate
PROSPECTIVE RESOURCES High Estimate
UNRECOVERABLE
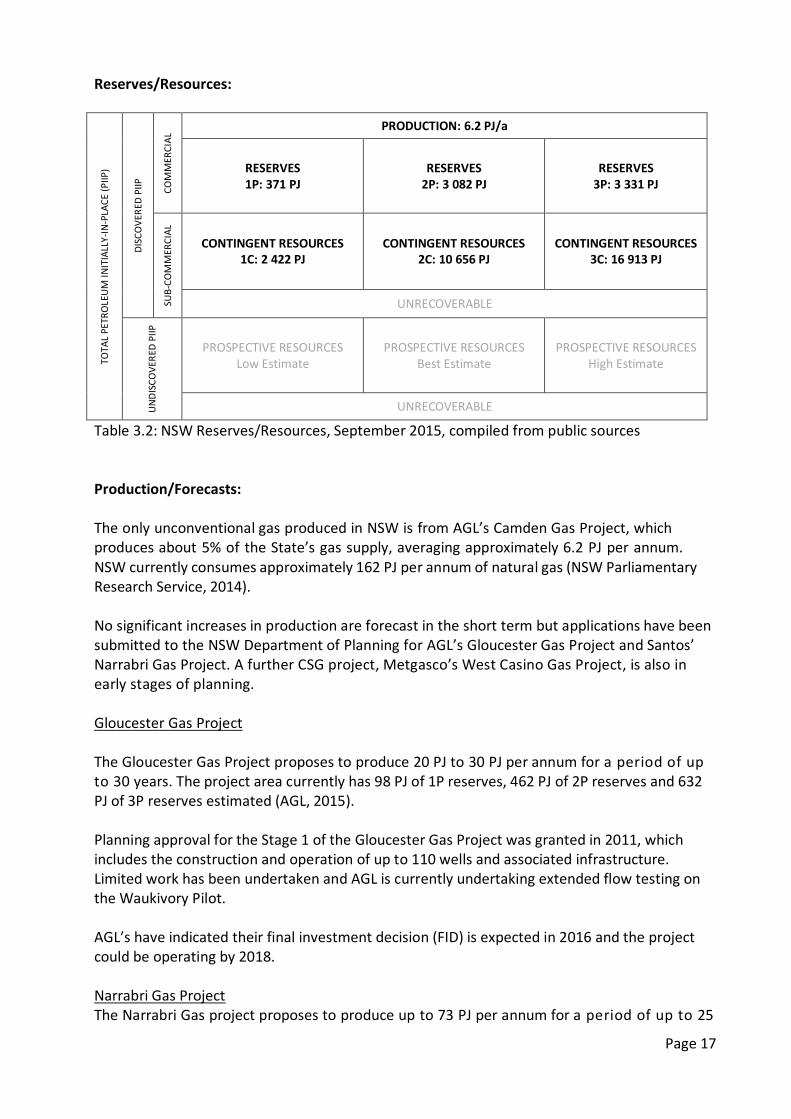
Table 3.2: NSW Reserves/Resources, September 2015, compiled from public sources Production/Forecasts: The only unconventional gas produced in NSW is from AGL’s Camden Gas Project, which produces about 5% of the State’s gas supply, averaging approximately 6.2 PJ per annum. NSW currently consumes approximately 162 PJ per annum of natural gas (NSW Parliamentary Research Service, 2014). No significant increases in production are forecast in the short term but applications have been submitted to the NSW Department of Planning for AGL’s Gloucester Gas Project and Santos’ Narrabri Gas Project. A further CSG project, Metgasco’s West Casino Gas Project, is also in early stages of planning. Gloucester Gas Project The Gloucester Gas Project proposes to produce 20 PJ to 30 PJ per annum for a period of up to 30 years. The project area currently has 98 PJ of 1P reserves, 462 PJ of 2P reserves and 632 PJ of 3P reserves estimated (AGL, 2015). Planning approval for the Stage 1 of the Gloucester Gas Project was granted in 2011, which includes the construction and operation of up to 110 wells and associated infrastructure. Limited work has been undertaken and AGL is currently undertaking extended flow testing on the Waukivory Pilot. AGL’s have indicated their final investment decision (FID) is expected in 2016 and the project could be operating by 2018. Narrabri Gas Project The Narrabri Gas project proposes to produce up to 73 PJ per annum for a period of up to 25
Page 17
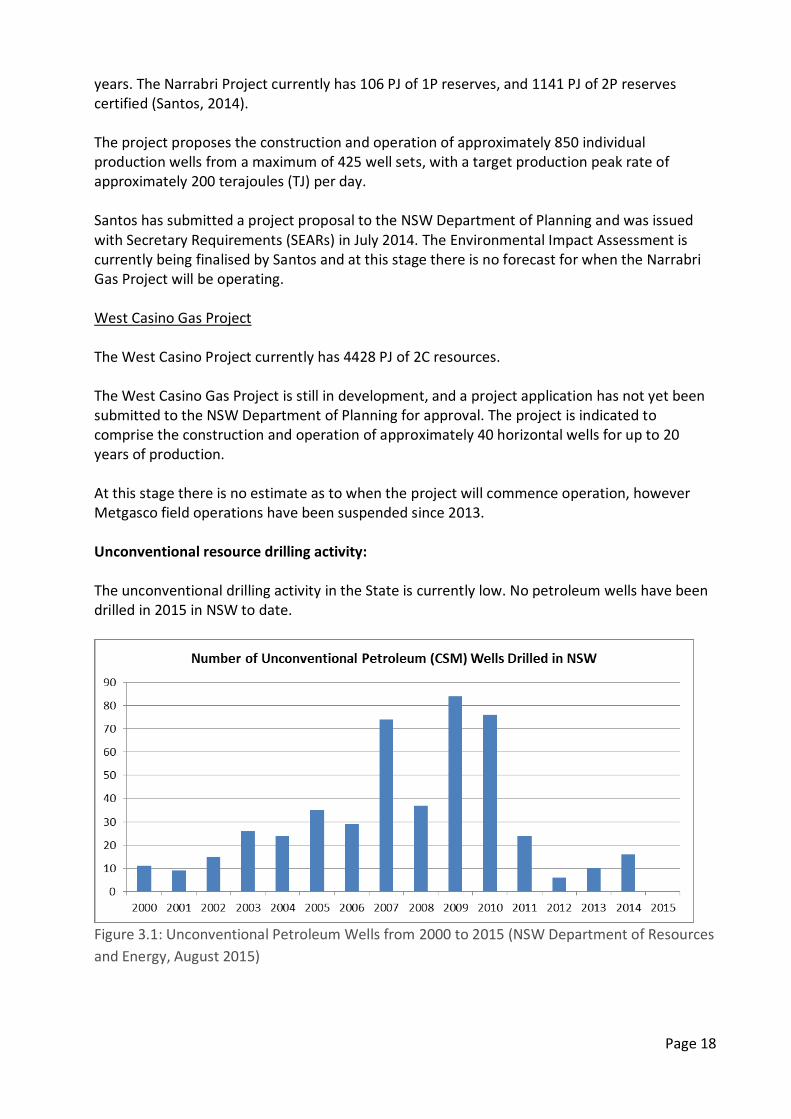
years. The Narrabri Project currently has 106 PJ of 1P reserves, and 1141 PJ of 2P reserves certified (Santos, 2014). The project proposes the construction and operation of approximately 850 individual production wells from a maximum of 425 well sets, with a target production peak rate of approximately 200 terajoules (TJ) per day. Santos has submitted a project proposal to the NSW Department of Planning and was issued with Secretary Requirements (SEARs) in July 2014. The Environmental Impact Assessment is currently being finalised by Santos and at this stage there is no forecast for when the Narrabri Gas Project will be operating. West Casino Gas Project The West Casino Project currently has 4428 PJ of 2C resources. The West Casino Gas Project is still in development, and a project application has not yet been submitted to the NSW Department of Planning for approval. The project is indicated to comprise the construction and operation of approximately 40 horizontal wells for up to 20 years of production. At this stage there is no estimate as to when the project will commence operation, however Metgasco field operations have been suspended since 2013. Unconventional resource drilling activity: The unconventional drilling activity in the State is currently low. No petroleum wells have been drilled in 2015 in NSW to date.
Figure 3.1: Unconventional Petroleum Wells from 2000 to 2015 (NSW Department of Resources and Energy, August 2015)
Page 18
Commentary: In addition to the coal seam gas resources identified to date, conventional, tight gas and shale gas resources may also be present. It is difficult to confidently delineate the extent of most of the potential petroleum resources in the State due to sparse exploration data. Conventional petroleum exploration in NSW is limited, and currently only covers some areas in the Clarence-Moreton Basin. References: AGL, 2015, ASX annual reserves assessment 12/8/15.
http://www.asx.com.au/asxpdf/20150812/pdf/430g0dtq7yl7pj.pdf Metgasco, 2015, Metgasco 2014 Annual Report,
http://www.metgasco.com.au/asx-announcements/2014-annual-report NSW Parliamentary Research Service, 2014, A tightening gas market: supply, demand and price outlook for NSW. Briefing Paper No 4/2014 by Andrew Haylen.
http://www.parliament.nsw.gov.au/prod/parlment/publications.nsf/key/Atighteninggasmarket:supply,demandandpriceoutlookforNSW
Santos, 2014, December 2014 Annual Report to ASX, www.santos.com/library/2014_Annual_Report.pdf
Page 19
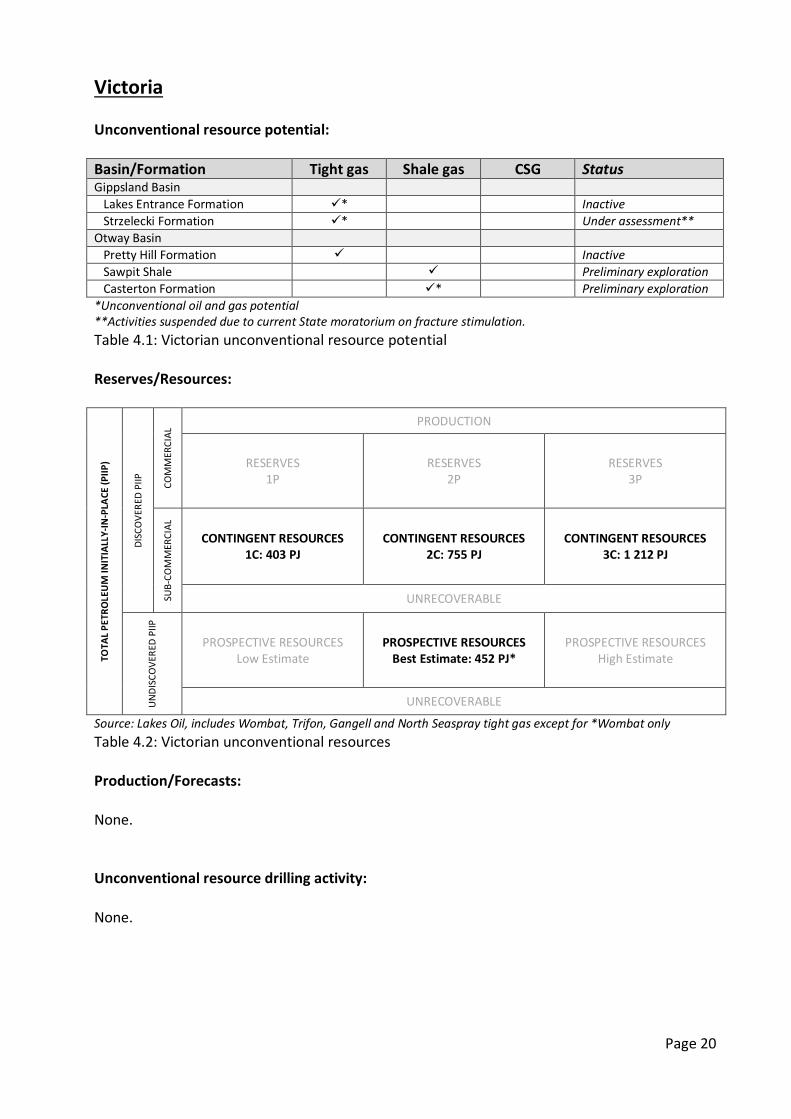
Victoria Unconventional resource potential: Basin/Formation Tight gas Shale gas CSG Status Gippsland Basin Lakes Entrance Formation * Inactive Strzelecki Formation * Under assessment** Otway Basin Pretty Hill Formation Inactive Sawpit Shale Preliminary exploration Casterton Formation * Preliminary exploration *Unconventional oil and gas potential **Activities suspended due to current State moratorium on fracture stimulation. Table 4.1: Victorian unconventional resource potential Reserves/Resources:
TOTA
L PE
TRO
LEU
M IN
ITIA
LLY-
IN-P
LACE
(PIIP
)
DISC
OVE
RED
PIIP
COM
MER
CIAL
PRODUCTION
RESERVES 1P
RESERVES 2P
RESERVES 3P
SUB-
COM
MER
CIAL
CONTINGENT RESOURCES 1C: 403 PJ
CONTINGENT RESOURCES 2C: 755 PJ
CONTINGENT RESOURCES 3C: 1 212 PJ
UNRECOVERABLE
UN
DIS
COVE
RED
PIIP
PROSPECTIVE RESOURCES Low Estimate
PROSPECTIVE RESOURCES Best Estimate: 452 PJ*
PROSPECTIVE RESOURCES High Estimate
UNRECOVERABLE
Source: Lakes Oil, includes Wombat, Trifon, Gangell and North Seaspray tight gas except for *Wombat only Table 4.2: Victorian unconventional resources Production/Forecasts: None. Unconventional resource drilling activity: None.
Page 20

Commentary: The difficulties of developing the tight gas resource in proximity to ample supplies of conventional gas offshore have been compounded by the recent moratorium on fracture stimulation which will be required to prove the commercial viability of these reservoirs. This has provided little incentive to explore further in the region. References: Lakes Oil website
http://www.lakesoil.com.au/index.php/reports-and-announcements/category/announcements-2010 10-August-2010 http://www.lakesoil.com.au/index.php/reports-and-announcements/category/announcements-2009 1-July-2009
Page 21
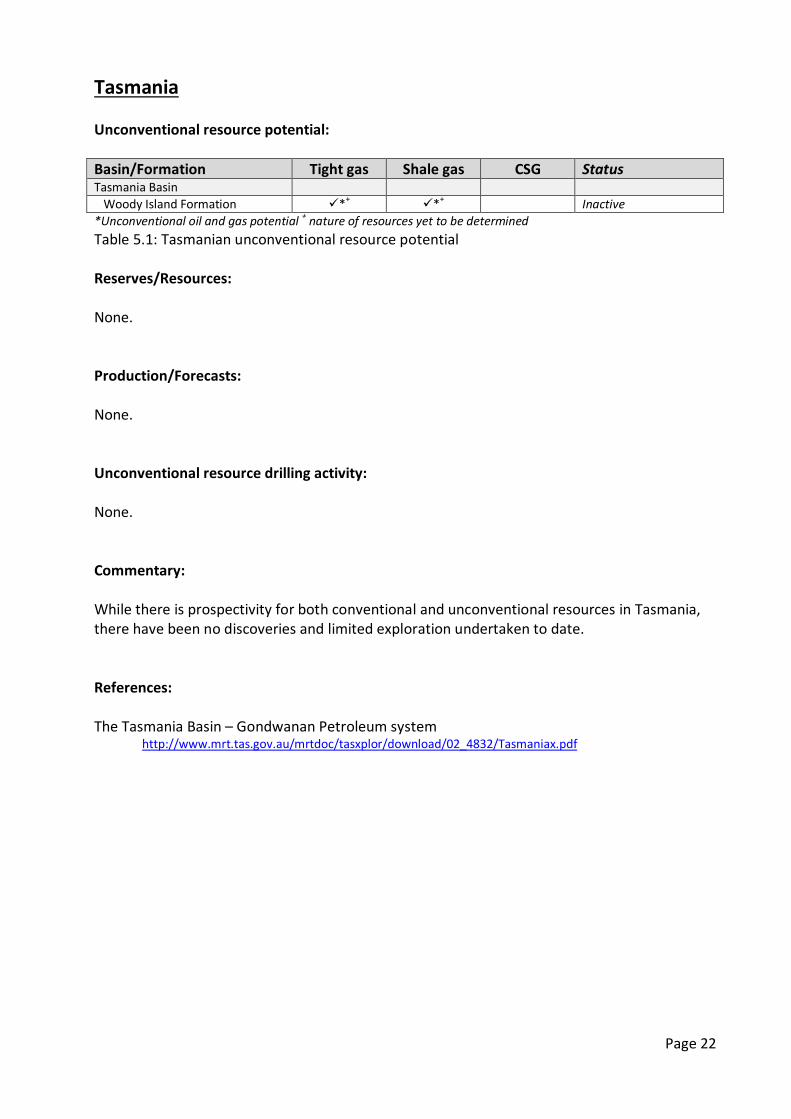
Tasmania Unconventional resource potential: Basin/Formation Tight gas Shale gas CSG Status Tasmania Basin Woody Island Formation *+ *+ Inactive *Unconventional oil and gas potential + nature of resources yet to be determined Table 5.1: Tasmanian unconventional resource potential Reserves/Resources: None. Production/Forecasts: None. Unconventional resource drilling activity: None. Commentary: While there is prospectivity for both conventional and unconventional resources in Tasmania, there have been no discoveries and limited exploration undertaken to date. References: The Tasmania Basin – Gondwanan Petroleum system
http://www.mrt.tas.gov.au/mrtdoc/tasxplor/download/02_4832/Tasmaniax.pdf
Page 22
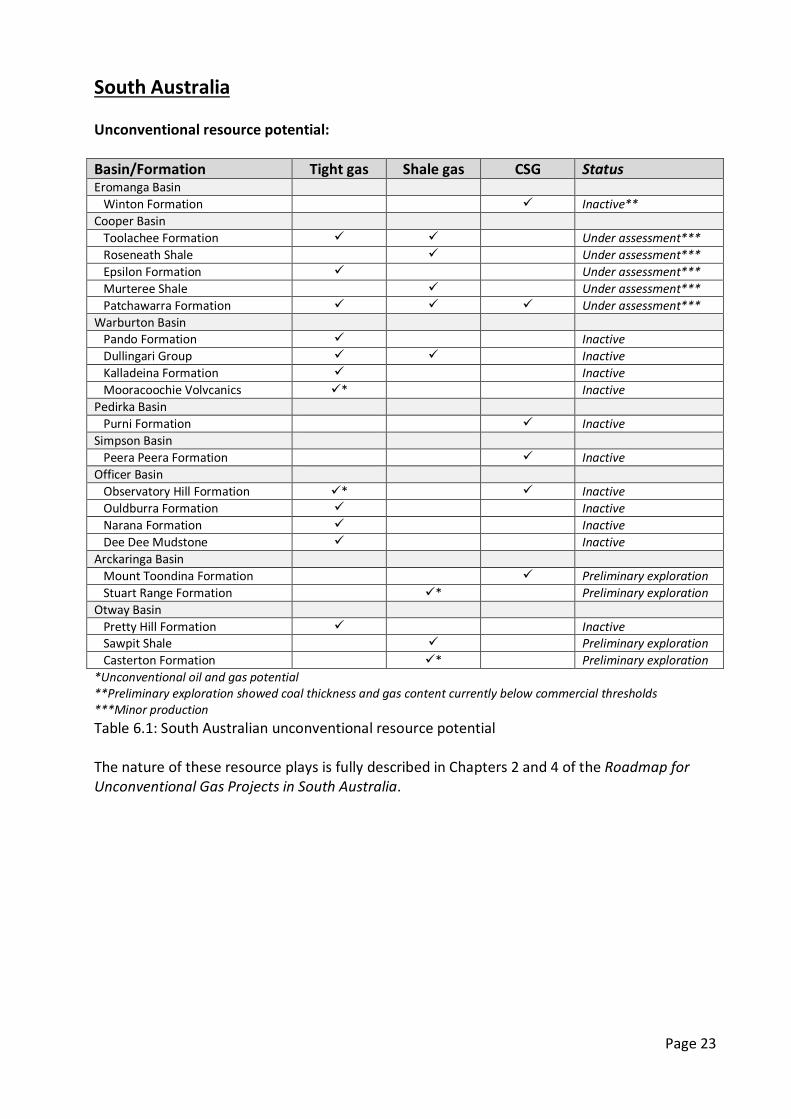
South Australia Unconventional resource potential: Basin/Formation Tight gas Shale gas CSG Status Eromanga Basin Winton Formation Inactive** Cooper Basin Toolachee Formation Under assessment*** Roseneath Shale Under assessment*** Epsilon Formation Under assessment*** Murteree Shale Under assessment*** Patchawarra Formation Under assessment*** Warburton Basin Pando Formation Inactive Dullingari Group Inactive Kalladeina Formation Inactive Mooracoochie Volvcanics * Inactive Pedirka Basin Purni Formation Inactive Simpson Basin Peera Peera Formation Inactive Officer Basin Observatory Hill Formation * Inactive Ouldburra Formation Inactive Narana Formation Inactive Dee Dee Mudstone Inactive Arckaringa Basin Mount Toondina Formation Preliminary exploration Stuart Range Formation * Preliminary exploration Otway Basin Pretty Hill Formation Inactive Sawpit Shale Preliminary exploration Casterton Formation * Preliminary exploration *Unconventional oil and gas potential **Preliminary exploration showed coal thickness and gas content currently below commercial thresholds ***Minor production Table 6.1: South Australian unconventional resource potential The nature of these resource plays is fully described in Chapters 2 and 4 of the Roadmap for Unconventional Gas Projects in South Australia.
Page 23
Reserves/Resources:
TOTA
L PE
TRO
LEU
M IN
ITIA
LLY-
IN-P
LACE
(PIIP
)
DISC
OVE
RED
PIIP
COM
MER
CIAL
PRODUCTION
RESERVES 1P
RESERVES 2P
RESERVES 3P
SUB-
COM
MER
CIAL
CONTINGENT RESOURCES 1C: 3 371 PJ*
CONTINGENT RESOURCES 2C: 8 034 PJ*
CONTINGENT RESOURCES 3C: 17 393 PJ*
UNRECOVERABLE
UN
DIS
COVE
RED
PIIP
PROSPECTIVE RESOURCES Low Estimate: 54 024 PJ**
PROSPECTIVE RESOURCES Best Estimate: 123 034 PJ**
PROSPECTIVE RESOURCES High Estimate: 259 211 PJ**
UNRECOVERABLE
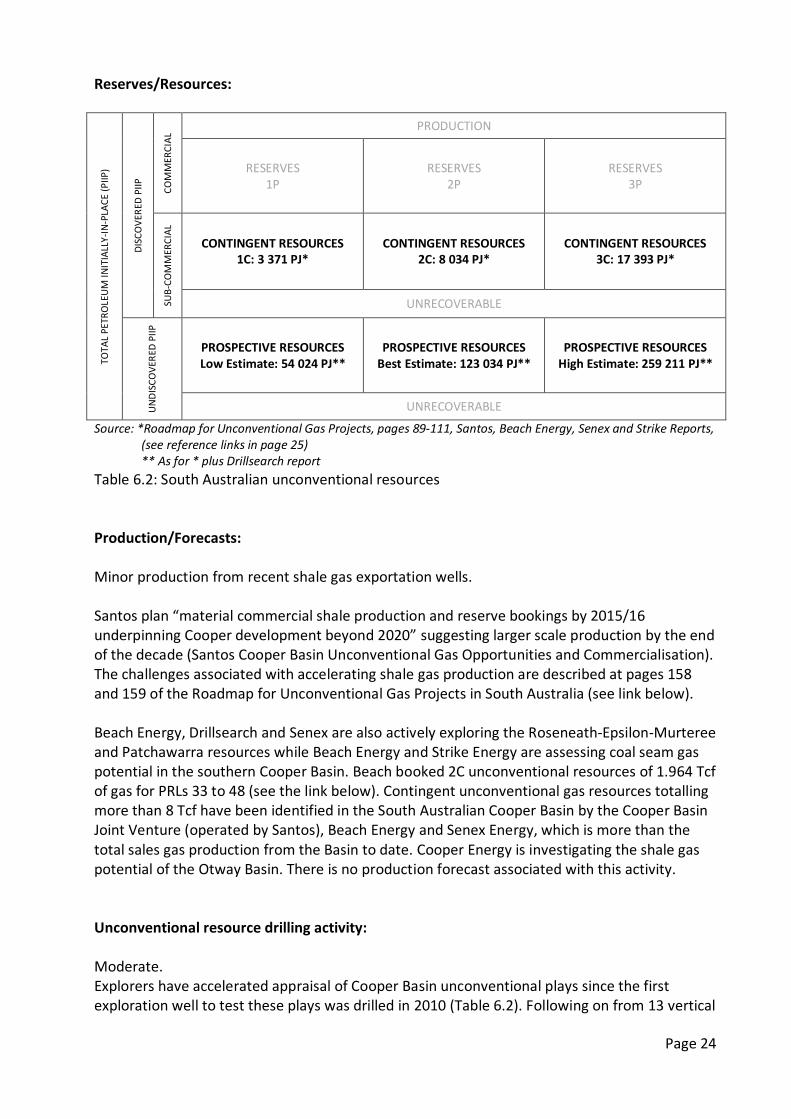
Source: *Roadmap for Unconventional Gas Projects, pages 89-111, Santos, Beach Energy, Senex and Strike Reports, (see reference links in page 25) ** As for * plus Drillsearch report
Table 6.2: South Australian unconventional resources Production/Forecasts: Minor production from recent shale gas exportation wells. Santos plan “material commercial shale production and reserve bookings by 2015/16 underpinning Cooper development beyond 2020” suggesting larger scale production by the end of the decade (Santos Cooper Basin Unconventional Gas Opportunities and Commercialisation). The challenges associated with accelerating shale gas production are described at pages 158 and 159 of the Roadmap for Unconventional Gas Projects in South Australia (see link below). Beach Energy, Drillsearch and Senex are also actively exploring the Roseneath-Epsilon-Murteree and Patchawarra resources while Beach Energy and Strike Energy are assessing coal seam gas potential in the southern Cooper Basin. Beach booked 2C unconventional resources of 1.964 Tcf of gas for PRLs 33 to 48 (see the link below). Contingent unconventional gas resources totalling more than 8 Tcf have been identified in the South Australian Cooper Basin by the Cooper Basin Joint Venture (operated by Santos), Beach Energy and Senex Energy, which is more than the total sales gas production from the Basin to date. Cooper Energy is investigating the shale gas potential of the Otway Basin. There is no production forecast associated with this activity. Unconventional resource drilling activity: Moderate. Explorers have accelerated appraisal of Cooper Basin unconventional plays since the first exploration well to test these plays was drilled in 2010 (Table 6.2). Following on from 13 vertical
Page 24
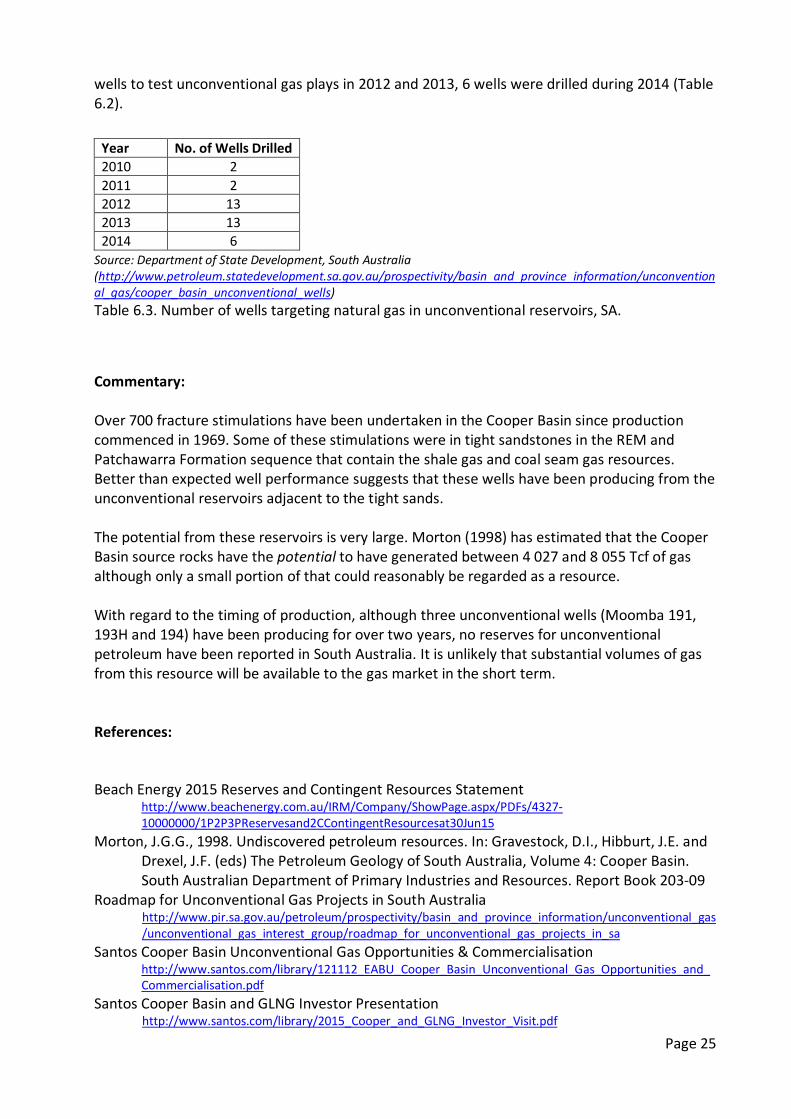
wells to test unconventional gas plays in 2012 and 2013, 6 wells were drilled during 2014 (Table 6.2).
Source: Department of State Development, South Australia (http://www.petroleum.statedevelopment.sa.gov.au/prospectivity/basin_and_province_information/unconventional_gas/cooper_basin_unconventional_wells) Table 6.3. Number of wells targeting natural gas in unconventional reservoirs, SA.
Commentary: Over 700 fracture stimulations have been undertaken in the Cooper Basin since production commenced in 1969. Some of these stimulations were in tight sandstones in the REM and Patchawarra Formation sequence that contain the shale gas and coal seam gas resources. Better than expected well performance suggests that these wells have been producing from the unconventional reservoirs adjacent to the tight sands. The potential from these reservoirs is very large. Morton (1998) has estimated that the Cooper Basin source rocks have the potential to have generated between 4 027 and 8 055 Tcf of gas although only a small portion of that could reasonably be regarded as a resource. With regard to the timing of production, although three unconventional wells (Moomba 191, 193H and 194) have been producing for over two years, no reserves for unconventional petroleum have been reported in South Australia. It is unlikely that substantial volumes of gas from this resource will be available to the gas market in the short term. References: Beach Energy 2015 Reserves and Contingent Resources Statement
http://www.beachenergy.com.au/IRM/Company/ShowPage.aspx/PDFs/4327-10000000/1P2P3PReservesand2CContingentResourcesat30Jun15
Morton, J.G.G., 1998. Undiscovered petroleum resources. In: Gravestock, D.I., Hibburt, J.E. and Drexel, J.F. (eds) The Petroleum Geology of South Australia, Volume 4: Cooper Basin. South Australian Department of Primary Industries and Resources. Report Book 203-09
Roadmap for Unconventional Gas Projects in South Australia http://www.pir.sa.gov.au/petroleum/prospectivity/basin_and_province_information/unconventional_gas/unconventional_gas_interest_group/roadmap_for_unconventional_gas_projects_in_sa
Santos Cooper Basin Unconventional Gas Opportunities & Commercialisation http://www.santos.com/library/121112_EABU_Cooper_Basin_Unconventional_Gas_Opportunities_and_Commercialisation.pdf
Santos Cooper Basin and GLNG Investor Presentation http://www.santos.com/library/2015_Cooper_and_GLNG_Investor_Visit.pdf
Year No. of Wells Drilled 2010 2 2011 2 2012 13 2013 13 2014 6
Page 25

Senex Energy http://www.senexenergy.com.au/files/682/Major-contingent-gas-resource-upgrade-to-55-Tcf.pdf
Strike Energy http://www.strikeenergy.com.au/wp-content/uploads/2015/07/20150729-DUG-July-2015-Presentation.pdf
Page 26
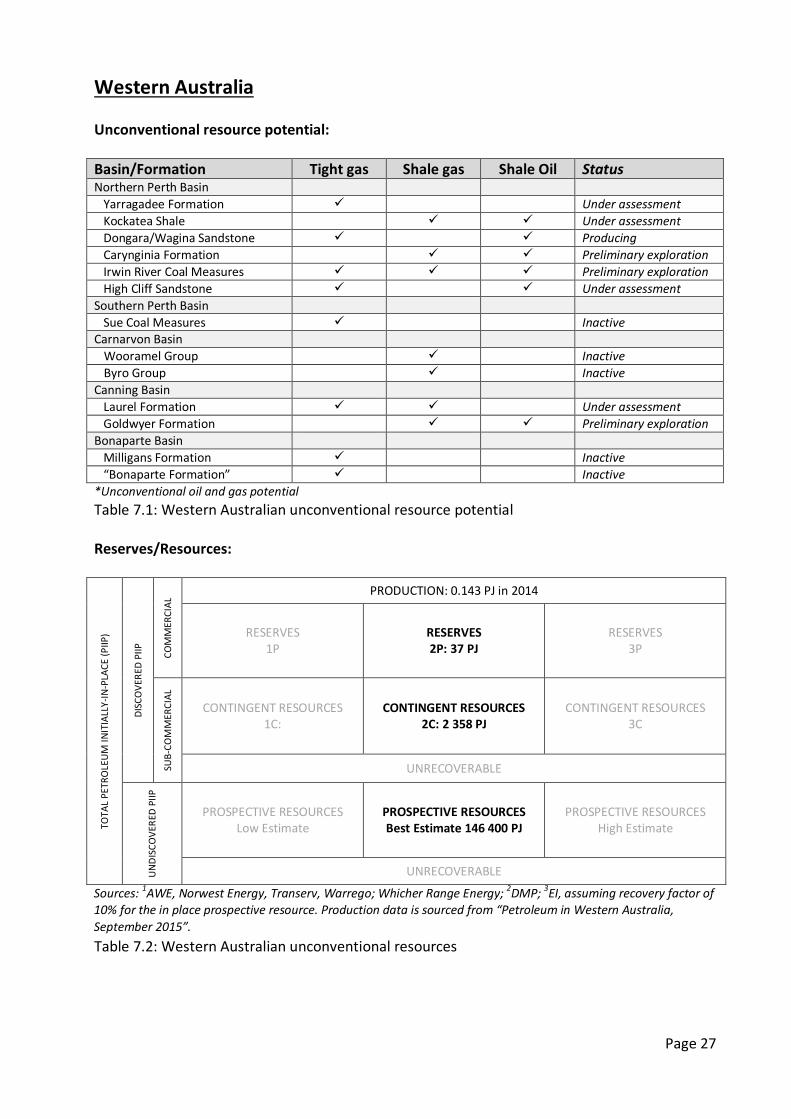
Western Australia Unconventional resource potential: Basin/Formation Tight gas Shale gas Shale Oil Status Northern Perth Basin Yarragadee Formation Under assessment Kockatea Shale Under assessment Dongara/Wagina Sandstone Producing Carynginia Formation Preliminary exploration Irwin River Coal Measures Preliminary exploration High Cliff Sandstone Under assessment Southern Perth Basin Sue Coal Measures Inactive Carnarvon Basin
Wooramel Group Inactive Byro Group Inactive
Canning Basin Laurel Formation Under assessment Goldwyer Formation Preliminary exploration Bonaparte Basin Milligans Formation Inactive “Bonaparte Formation” Inactive *Unconventional oil and gas potential Table 7.1: Western Australian unconventional resource potential Reserves/Resources:
TOTA
L PE
TRO
LEU
M IN
ITIA
LLY-
IN-P
LACE
(PIIP
)
DISC
OVE
RED
PIIP
COM
MER
CIAL
PRODUCTION: 0.143 PJ in 2014
RESERVES 1P
RESERVES 2P: 37 PJ
RESERVES 3P
SUB-
COM
MER
CIAL
CONTINGENT RESOURCES 1C:
CONTINGENT RESOURCES 2C: 2 358 PJ
CONTINGENT RESOURCES 3C
UNRECOVERABLE
UN
DIS
COVE
RED
PIIP
PROSPECTIVE RESOURCES Low Estimate
PROSPECTIVE RESOURCES Best Estimate 146 400 PJ
PROSPECTIVE RESOURCES High Estimate
UNRECOVERABLE
Sources: 1AWE, Norwest Energy, Transerv, Warrego; Whicher Range Energy; 2DMP; 3EI, assuming recovery factor of 10% for the in place prospective resource. Production data is sourced from “Petroleum in Western Australia, September 2015”. Table 7.2: Western Australian unconventional resources
Page 27
Production/Forecasts: Currently the only unconventional play producing is the Corybas tight gas field. Unconventional resource drilling activity: Moderate. Since 2005 towards end 2015, 17 exploration wells have been drilled to search for shale and tight gas resources in Western Australia. Seven of these involved hydraulic fracturing to test the capacity of the reservoir to generate commercial gas flows Commentary: Western Australia is considered to hold significant shale and tight gas resources in the Kimberley, East Pilbara and Midwest regions. Department of Mines and Petroleum, Western Australia, has shown that the state potentially contains an estimated 1 380 Tcf in place resources of shale and tight gas. Of this, approximately 980 Tcf are in the Canning Basin (Kimberley and East Pilbara regions); 220 Tcf are in the north Perth Basin (Midwest region); and 95 Tcf are in the Northern Carnarvon Basin (onshore). The US EIA estimated shale oil volumes on the Perth and Canning basins, while tight gas estimates have been made by various explorers of their discoveries. The Canning Basin is recognised as having great potential, if only for the vast size of the basin. Prospective formations have great areal extent although the extent of unconventional resources within them is currently unknown. Resource estimates assessing the whole of a formation across the basin should, therefore, be suitably discounted for this uncertainty. Due to the remoteness of the basin, transport and infrastructure will also be a significant issue in any unconventional resource development. The Northern Perth Basin, however, is however better placed near markets, infrastructure and pipelines and is more likely to see unconventional gas reach market first. It also holds the only tight gas fields currently progressed to the contingent stage of exploration. If exploration in Western Australia proves successful, significant commercial production is anticipated to be five to 10 years away. References: AWE, 2015 FY Results
http://www.asx.com.au/asxpdf/20150824/pdf/430qsl14xdf35p.pdf AWE, Corybas update
http://www.asx.com.au/asxpdf/20110504/pdf/41yg4fjlsn4lyh.pdf DMP, 2014 Natural Gas from Shale and Tight Rocks
http://www.dmp.wa.gov.au/documents/Natural_Gas_from_Shale_and_Tight_Rocks_-An_overview_of_Western_Australia_regulatory_framework.pdf
Page 28
DMP, Western Australian Atlas of Petroleum Fields, Vol. 1, Onshore Perth Basin, Owad-Jones, D. and Ellis, G., 2000
DMP, Western Australia Atlas of Petroleum Fields, Volume 2, Part 1, Onshore Canning Basin, Jonasson, K.E., 2001
DMP, Western Australia Atlas of Petroleum Fields, Volume 2, Part 2, Onshore Carnarvon Basin, Ellis, G.K. and Jonasson, K.E., 2001
DMP, Petroleum in Western Australia, September 2015, Western Australian Gas Reserves and Resources, Triche, N.E and Middleton, M., 2015
EIA, Technically Recoverable Shale Oil and Shale Gas Resources: an Assessment of 137 Shale Formations in 41 Countries Outside the United States, U.S. Energy Information Administration, 2013
Norwest, Arrowsmith update http://www.norwestenergy.com.au/home/project-arrowsmith/duplicate-of-australia/ep413/
Triche NE and Middleton M, 2015, Western Australian Gas Reserves and Resources, PWA Sept 2015
Warrego, West Erregulla update http://www.warregoenergy.com/news/index.cfm?id=5
Transerv, Warro update http://www.transerv.com.au/wp-content/uploads/2015/07/StockAnalysis-Special-Edition-on-TSV-30-July-2015.pdf
Whicher Range Energy, Whicher Range update http://www.whicherenergy.com/index.php?option=com_content&view=article&id=60:developmentconcept&catid=37:ep408&Itemid=69
Page 29
Northern Territory
Unconventional resource potential:
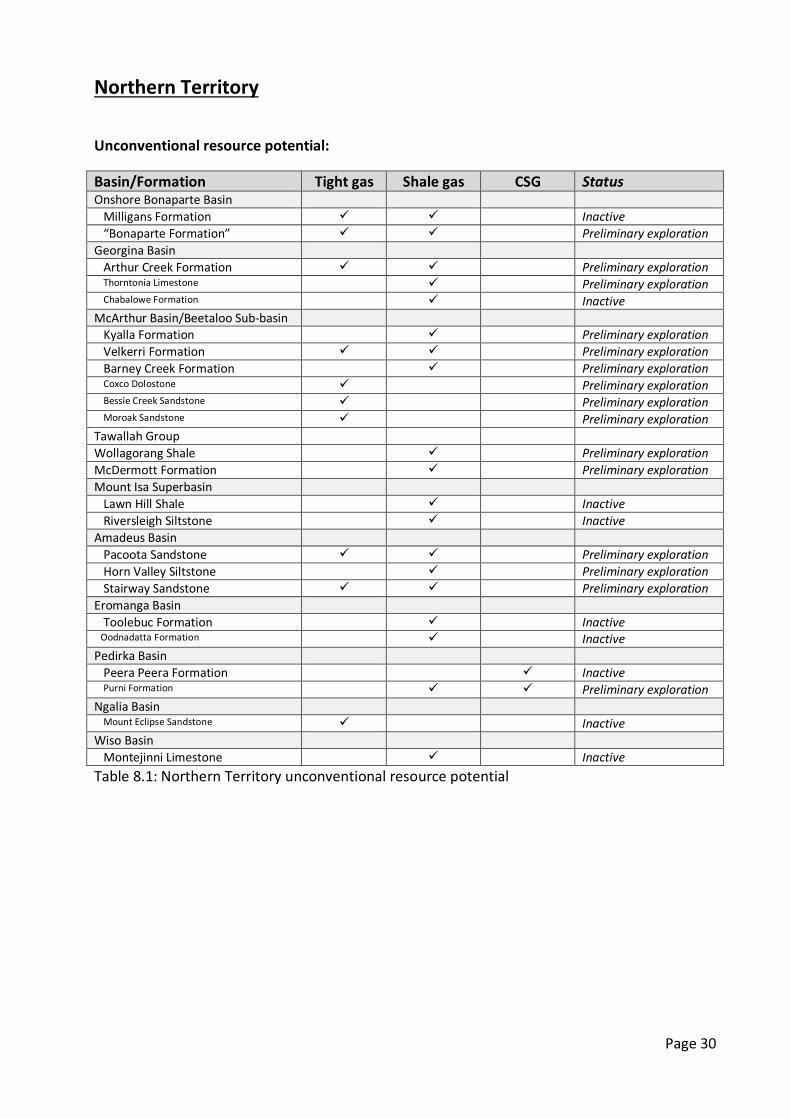
Basin/Formation Tight gas Shale gas CSG Status Onshore Bonaparte Basin Milligans Formation Inactive “Bonaparte Formation” Preliminary exploration Georgina Basin Arthur Creek Formation Preliminary exploration Thorntonia Limestone Preliminary exploration Chabalowe Formation Inactive McArthur Basin/Beetaloo Sub-basin Kyalla Formation Preliminary exploration Velkerri Formation Preliminary exploration Barney Creek Formation Preliminary exploration Coxco Dolostone Preliminary exploration Bessie Creek Sandstone Preliminary exploration Moroak Sandstone Preliminary exploration Tawallah Group Wollagorang Shale Preliminary exploration McDermott Formation Preliminary exploration Mount Isa Superbasin Lawn Hill Shale Inactive Riversleigh Siltstone Inactive Amadeus Basin Pacoota Sandstone Preliminary exploration Horn Valley Siltstone Preliminary exploration Stairway Sandstone Preliminary exploration Eromanga Basin Toolebuc Formation Inactive Oodnadatta Formation Inactive Pedirka Basin Peera Peera Formation Inactive Purni Formation Preliminary exploration Ngalia Basin Mount Eclipse Sandstone Inactive Wiso Basin Montejinni Limestone Inactive Table 8.1: Northern Territory unconventional resource potential
Page 30
Reserves/Resources:
TOTA
L PE
TRO
LEU
M IN
ITIA
LLY-
IN-P
LACE
(PIIP
)
DISC
OVE
RED
PIIP
COM
MER
CIAL
PRODUCTION
RESERVES 1P
RESERVES 2P
RESERVES 3P
SUB-
COM
MER
CIAL
CONTINGENT RESOURCES 1C
CONTINGENT RESOURCES 2C
CONTINGENT RESOURCES 3C
UNRECOVERABLE
UN
DIS
COVE
RED
PIIP
PROSPECTIVE RESOURCES Low Estimate
PROSPECTIVE RESOURCES Best Estimate: 257 276 PJ
PROSPECTIVE RESOURCES High Estimate
UNRECOVERABLE
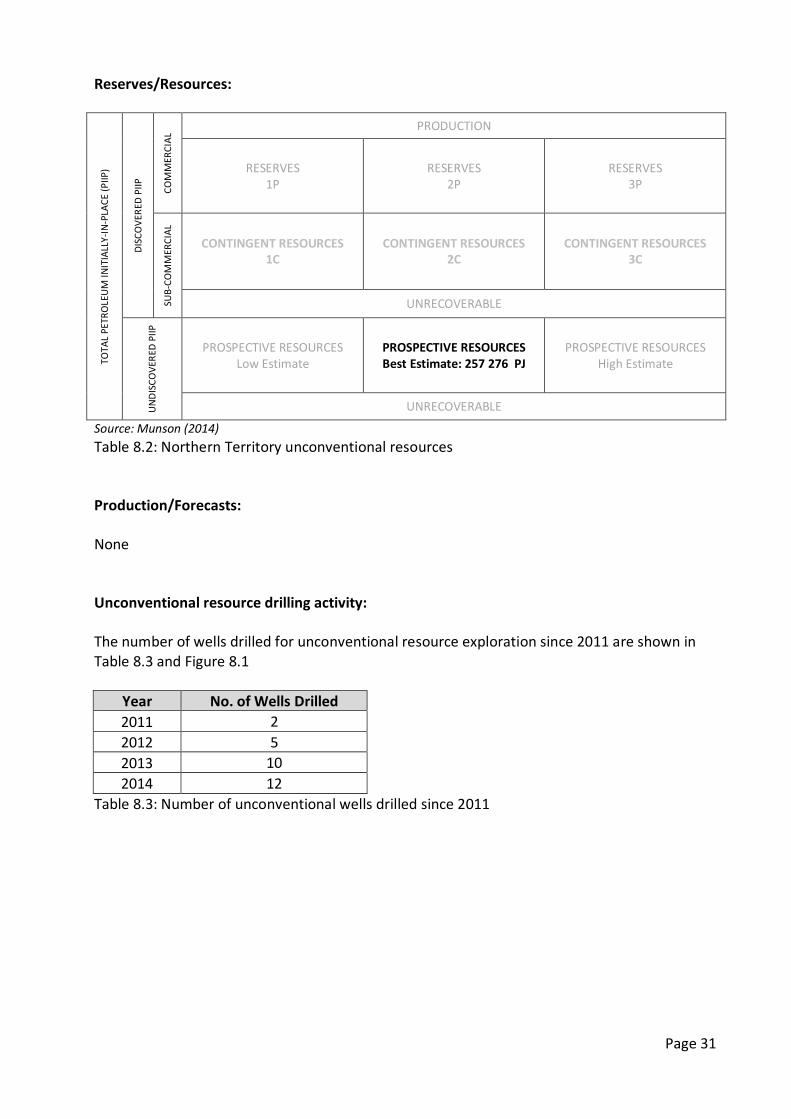
Source: Munson (2014) Table 8.2: Northern Territory unconventional resources Production/Forecasts: None Unconventional resource drilling activity: The number of wells drilled for unconventional resource exploration since 2011 are shown in Table 8.3 and Figure 8.1
Year No. of Wells Drilled 2011 2 2012 5 2013 10 2014 12
Table 8.3: Number of unconventional wells drilled since 2011
Page 31
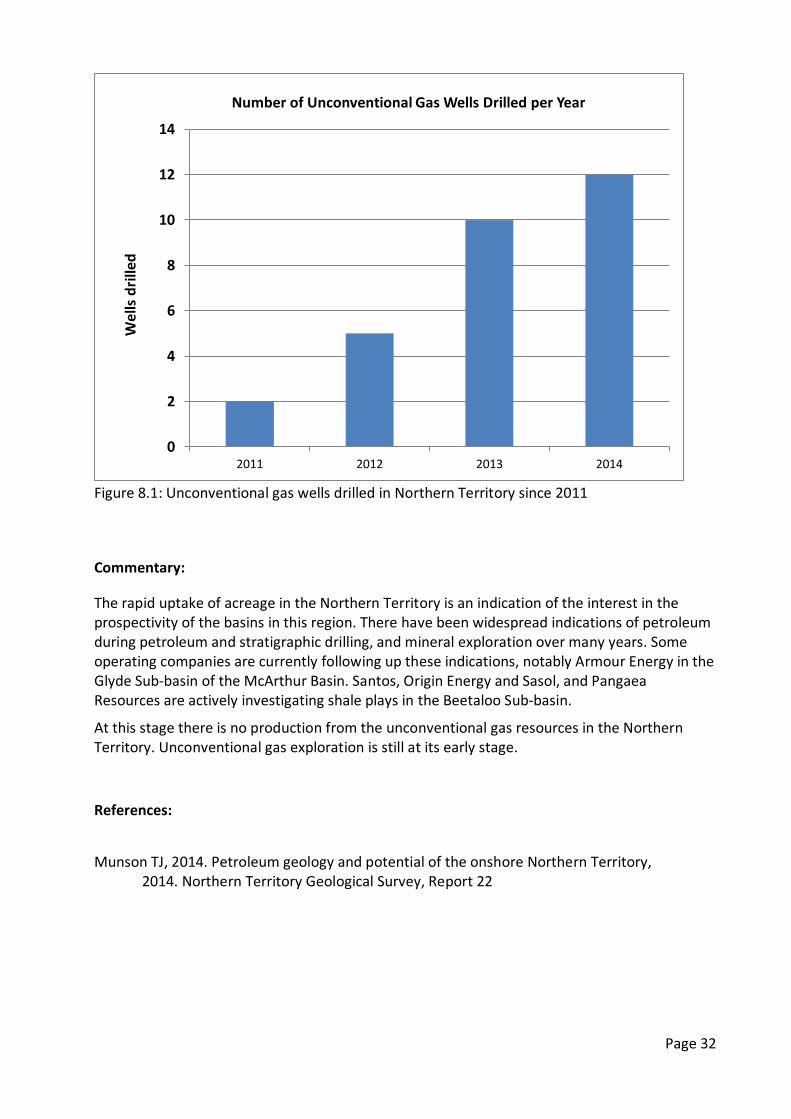
Figure 8.1: Unconventional gas wells drilled in Northern Territory since 2011
Commentary:
The rapid uptake of acreage in the Northern Territory is an indication of the interest in the prospectivity of the basins in this region. There have been widespread indications of petroleum during petroleum and stratigraphic drilling, and mineral exploration over many years. Some operating companies are currently following up these indications, notably Armour Energy in the Glyde Sub-basin of the McArthur Basin. Santos, Origin Energy and Sasol, and Pangaea Resources are actively investigating shale plays in the Beetaloo Sub-basin.
At this stage there is no production from the unconventional gas resources in the Northern Territory. Unconventional gas exploration is still at its early stage.
References:
Munson TJ, 2014. Petroleum geology and potential of the onshore Northern Territory,
2014. Northern Territory Geological Survey, Report 22
0
2
4
6
8
10
12
14
2011 2012 2013 2014
Number of Unconventional Gas Wells Drilled per Year
Wel
ls d
rille
d
Page 32