Embed Size (px)
Citation preview
Coastal Resilience, Climate Adaptation, and Sustainability Study
Outcomes Report
December 10, 2018
Prepared for: Town of East Lyme, CT Prepared by: Stantec’s Urban Places with Ecopolitan Design
Acknowledgements
The Town of East Lyme engaged Stantec’s Urban Places and Ecopolitan Design to prepare a Coastal Resilience, Climate
Adaptation, and Sustainability Study (CRCASS) funded by a University of Connecticut Institute for Resilience & Climate
Adaptation (CIRCA) Municipal Resilience Grant. CIRCA’s mission is to increase the resilience and sustainability of
vulnerable communities along Connecticut’s coast and inland waterways to the growing impacts of climate change on the
natural, built, and human environment. More information about CIRCA can be found at circa.uconn.edu.
Authors
Nels Nelson, Stantec’s Urban Places
Larissa Brown, Stantec’s Urban Places
Alexander J. Felson, Ecopolitan Design
Contributors
Hillary King, Stantec
Gary Sorge, Stantec
Thanks to
Gary Goeschel, Town of East Lyme
Victor Benni, Town of East Lyme
Bill Mulholland, Town of East Lyme
Katie Lund, CIRCA
Joseph MacDougald, UConn School of Law
Wayne Blaire, Crescent Beach
East Lyme Board of Selectmen
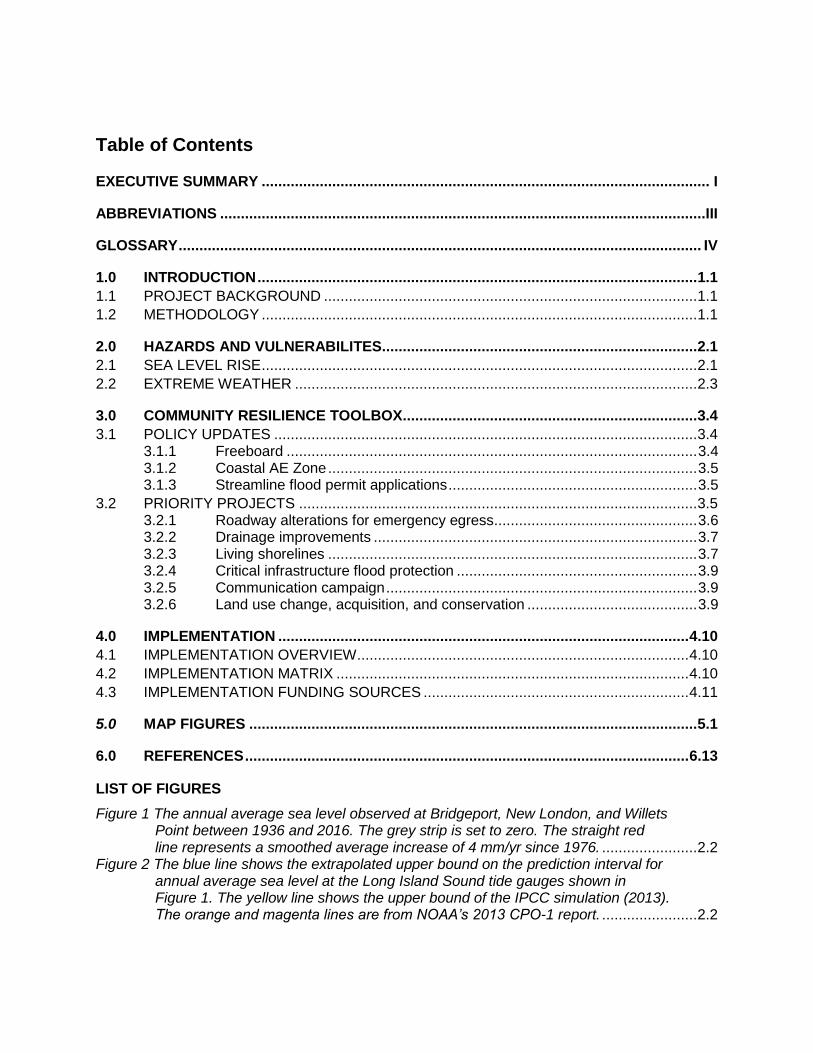
Table of Contents
EXECUTIVE SUMMARY ............................................................................................................ I
ABBREVIATIONS .....................................................................................................................III
GLOSSARY .............................................................................................................................. IV
1.0 INTRODUCTION .......................................................................................................... 1.1
1.1 PROJECT BACKGROUND .......................................................................................... 1.1
1.2 METHODOLOGY ......................................................................................................... 1.1
2.0 HAZARDS AND VULNERABILITES............................................................................ 2.1
2.1 SEA LEVEL RISE ......................................................................................................... 2.1
2.2 EXTREME WEATHER ................................................................................................. 2.3
3.0 COMMUNITY RESILIENCE TOOLBOX ....................................................................... 3.4
3.1 POLICY UPDATES ...................................................................................................... 3.4 3.1.1 Freeboard ................................................................................................... 3.4 3.1.2 Coastal AE Zone ......................................................................................... 3.5 3.1.3 Streamline flood permit applications ............................................................ 3.5
3.2 PRIORITY PROJECTS ................................................................................................ 3.5 3.2.1 Roadway alterations for emergency egress ................................................. 3.6 3.2.2 Drainage improvements .............................................................................. 3.7 3.2.3 Living shorelines ......................................................................................... 3.7 3.2.4 Critical infrastructure flood protection .......................................................... 3.9 3.2.5 Communication campaign ........................................................................... 3.9 3.2.6 Land use change, acquisition, and conservation ......................................... 3.9
4.0 IMPLEMENTATION ................................................................................................... 4.10
4.1 IMPLEMENTATION OVERVIEW ................................................................................ 4.10
4.2 IMPLEMENTATION MATRIX ..................................................................................... 4.10
4.3 IMPLEMENTATION FUNDING SOURCES ................................................................ 4.11
5.0 MAP FIGURES ............................................................................................................ 5.1
6.0 REFERENCES ........................................................................................................... 6.13
LIST OF FIGURES
Figure 1 The annual average sea level observed at Bridgeport, New London, and Willets Point between 1936 and 2016. The grey strip is set to zero. The straight red line represents a smoothed average increase of 4 mm/yr since 1976. ....................... 2.2
Figure 2 The blue line shows the extrapolated upper bound on the prediction interval for annual average sea level at the Long Island Sound tide gauges shown in Figure 1. The yellow line shows the upper bound of the IPCC simulation (2013). The orange and magenta lines are from NOAA’s 2013 CPO-1 report. ....................... 2.2
Figure 3 Building additional freeboard reduces flood insurance premiums. Graphic courtesy of FEMA. ..................................................................................................... 3.4
Figure 4 The Coastal AE zone has wave heights between 1.5 and 3.0 feet. Graphic courtesy of FEMA. ..................................................................................................... 3.5
Figure 5 Living shorelines build resilience by protecting land use and creating habitats. Graphic courtesy of Stantec. ...................................................................................... 3.8
Figure 6 Surface and ground water. ......................................................................................... 5.2 Figure 7 Agricultural land. ........................................................................................................ 5.3 Figure 8 Land use. ................................................................................................................... 5.4 Figure 9 Sensitive habitats. ...................................................................................................... 5.5 Figure 10 Transportation. ......................................................................................................... 5.6 Figure 11 Hurricane surge........................................................................................................ 5.7 Figure 12 FEMA flood zones and areas of conflict. .................................................................. 5.8 Figure 13 FEMA flood zones and structures impacted by 24” of SLR. ...................................... 5.9 Figure 14 Priority projects. ..................................................................................................... 5.10 Figure 15 Evacuation zones (A and B) and major routes. ...................................................... 5.11 Figure 16 Critical infrastructure. ............................................................................................. 5.12
i
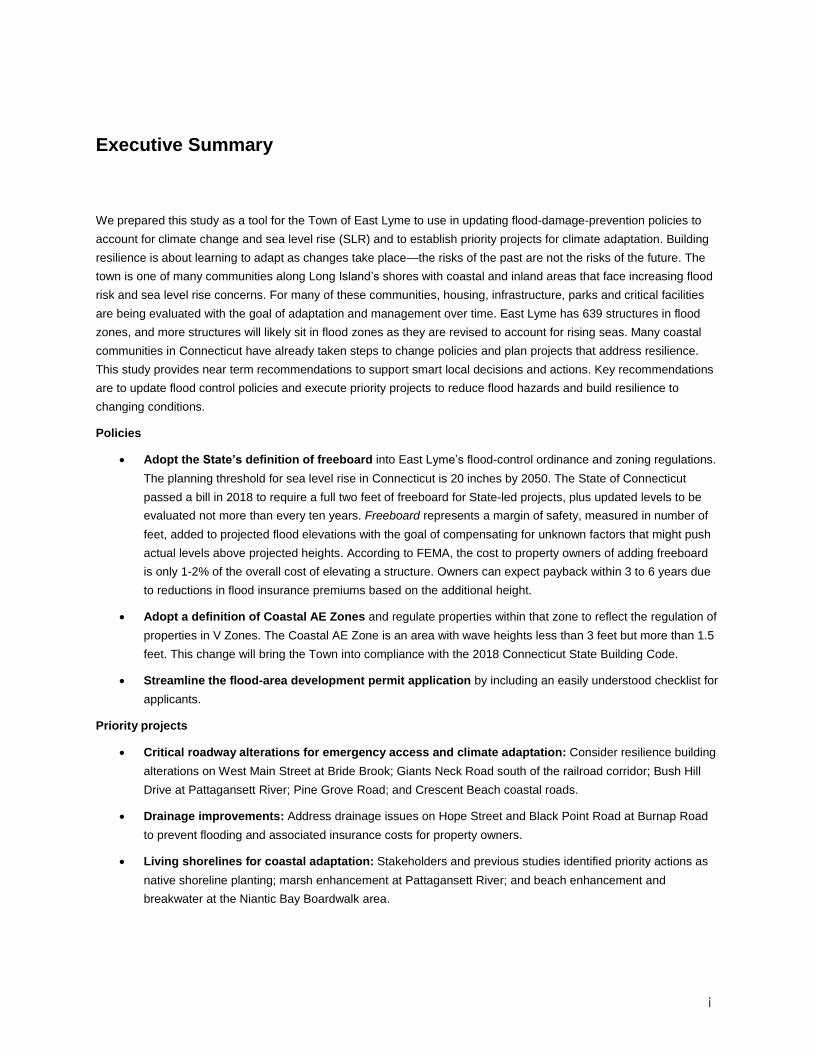
Executive Summary
We prepared this study as a tool for the Town of East Lyme to use in updating flood-damage-prevention policies to
account for climate change and sea level rise (SLR) and to establish priority projects for climate adaptation. Building
resilience is about learning to adapt as changes take place—the risks of the past are not the risks of the future. The
town is one of many communities along Long Island’s shores with coastal and inland areas that face increasing flood
risk and sea level rise concerns. For many of these communities, housing, infrastructure, parks and critical facilities
are being evaluated with the goal of adaptation and management over time. East Lyme has 639 structures in flood
zones, and more structures will likely sit in flood zones as they are revised to account for rising seas. Many coastal
communities in Connecticut have already taken steps to change policies and plan projects that address resilience.
This study provides near term recommendations to support smart local decisions and actions. Key recommendations
are to update flood control policies and execute priority projects to reduce flood hazards and build resilience to
changing conditions.
Policies
Adopt the State’s definition of freeboard into East Lyme’s flood-control ordinance and zoning regulations.
The planning threshold for sea level rise in Connecticut is 20 inches by 2050. The State of Connecticut
passed a bill in 2018 to require a full two feet of freeboard for State-led projects, plus updated levels to be
evaluated not more than every ten years. Freeboard represents a margin of safety, measured in number of
feet, added to projected flood elevations with the goal of compensating for unknown factors that might push
actual levels above projected heights. According to FEMA, the cost to property owners of adding freeboard
is only 1-2% of the overall cost of elevating a structure. Owners can expect payback within 3 to 6 years due
to reductions in flood insurance premiums based on the additional height.
Adopt a definition of Coastal AE Zones and regulate properties within that zone to reflect the regulation of
properties in V Zones. The Coastal AE Zone is an area with wave heights less than 3 feet but more than 1.5
feet. This change will bring the Town into compliance with the 2018 Connecticut State Building Code.
Streamline the flood-area development permit application by including an easily understood checklist for
applicants.
Priority projects
Critical roadway alterations for emergency access and climate adaptation: Consider resilience building
alterations on West Main Street at Bride Brook; Giants Neck Road south of the railroad corridor; Bush Hill
Drive at Pattagansett River; Pine Grove Road; and Crescent Beach coastal roads.
Drainage improvements: Address drainage issues on Hope Street and Black Point Road at Burnap Road
to prevent flooding and associated insurance costs for property owners.
Living shorelines for coastal adaptation: Stakeholders and previous studies identified priority actions as
native shoreline planting; marsh enhancement at Pattagansett River; and beach enhancement and
breakwater at the Niantic Bay Boardwalk area.
ii
Critical infrastructure flood protection: Evaluate the impact of SLR on pump stations already in flood
hazard zones—as well as on other critical infrastructure—to protect these assets from extreme storms and
flooding.
Communication campaign: Start a communicate campaign to educate property owners impacted by
current and future flood risks.
Long-term land use change: Include resilience recommendations in the upcoming Plan of Conservation
and Development update, including long-term changes in land use. Funding sources exist to support Town
acquisition of flood-damaged properties for conservation.
iii
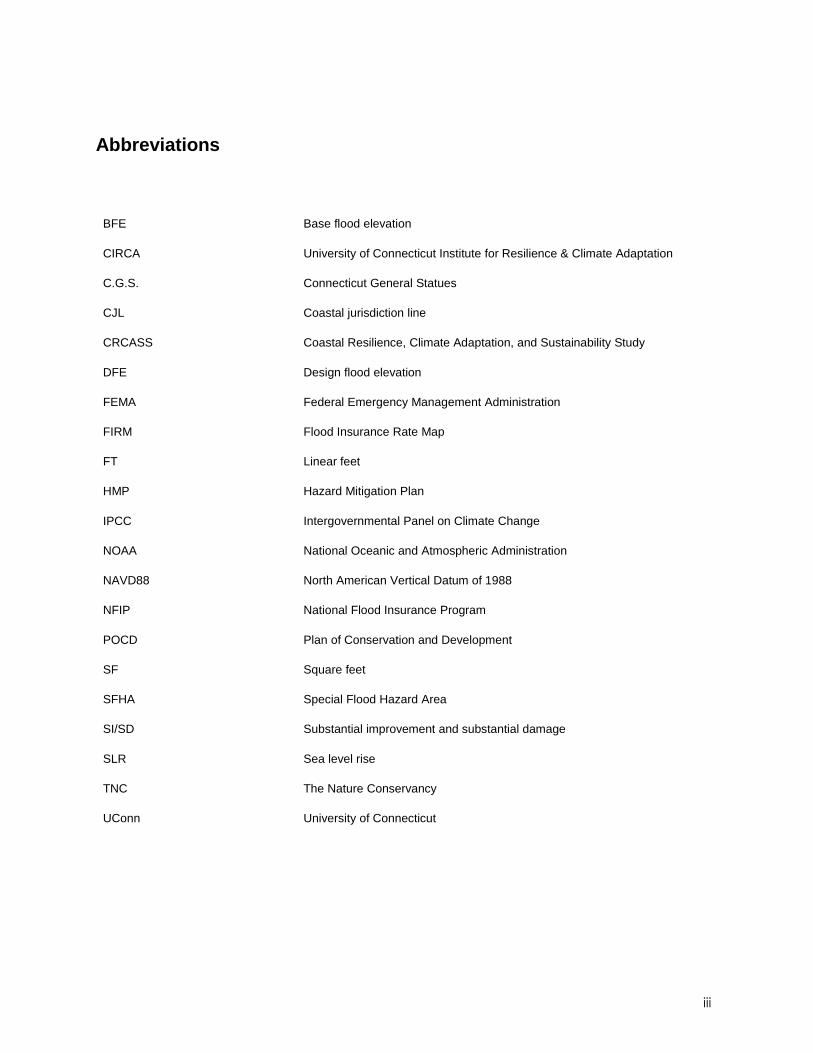
Abbreviations
BFE Base flood elevation
CIRCA University of Connecticut Institute for Resilience & Climate Adaptation
C.G.S. Connecticut General Statues
CJL Coastal jurisdiction line
CRCASS Coastal Resilience, Climate Adaptation, and Sustainability Study
DFE Design flood elevation
FEMA Federal Emergency Management Administration
FIRM Flood Insurance Rate Map
FT Linear feet
HMP Hazard Mitigation Plan
IPCC Intergovernmental Panel on Climate Change
NOAA National Oceanic and Atmospheric Administration
NAVD88 North American Vertical Datum of 1988
NFIP National Flood Insurance Program
POCD Plan of Conservation and Development
SF Square feet
SFHA Special Flood Hazard Area
SI/SD Substantial improvement and substantial damage
SLR Sea level rise
TNC The Nature Conservancy
UConn University of Connecticut
iv
Glossary
100-year flood This also goes by “1%-annual-chance flood,” since it has a 1% probability of occurring in any given year. Based on the area covered in an expected 100-year flood, FEMA maps show an area of inundation referred to as the “100-year floodplain.”
500-year flood A 500-year flood has the same definition as a 100-year flood, except that only has a 0.2% probability of occurring in any given year. It represents a more conservative (but also more extreme) projection than the 100-year flood level and serves as a crucial benchmark for evaluating the vulnerability of critical infrastructure.
Base flood A flood with a 1-percent chance of being equaled or exceeded in any given year, commonly referred to as the “100-year flood.” The NFIP and all federal agencies use the base flood as the national standard for the purchase of flood insurance and for regulation of new development.
Base flood elevation (BFE) The height of the base (1-percent annual chance or 100-year) flood in relation to a specified datum.
Federal Emergency Management Agency (FEMA)
The federal agency that, in addition to carrying out other activities, administers the National Flood Insurance Program.
Flood Insurance Rate Map (FIRM) The official map of a community on which FEMA has delineated both special flood hazard areas (SFHAs) and the risk-premium zones.
Freeboard A safety factor, expressed in feet above BFE, that takes into account unknown factors that might produce flooding beyond the calculated height. Among other things, these factors can include ice jams, debris accumulation, wave action, obstruction of bridge openings and floodways, the effects of urbanization on the hydrology of a watershed, and loss of flood storage due to development and sedimentation of a watercourse bed.
Lowest floor The lowest floor of the lowest enclosed area of a building, including a basement. Any NFIP-compliant unfinished or flood-resistant enclosure used solely for vehicle parking, building access, or storage (other than a basement) does not qualify as a building’s lowest floor, provided the enclosure doesn’t put the structure in violation of other NFIP design requirements.
Special Flood Hazard Area (SFHA) Land areas subject to a 1% or greater chance of flooding in any given year. These areas appear on FIRMs as Zones AE, A1-A30, A99, AR, AO, AH, V, VO, VE, or V1-30. Mapped zones outside of the SFHA are Zone X (shaded or unshaded), B, or C.
Substantial damage Any kind of damage sustained by a structure whereby the cost of restoring the structure to its before-damaged condition would equal or exceed 50 percent of the structure’s market value before the damage occurred. A determination of substantial damage means that repair work qualifies as substantial improvements, regardless of actual repair work performed.

v
Substantial improvement Any reconstruction, rehabilitation, addition, or other improvement of a structure, the cost of which equals or exceeds 50 percent of the market value of the structure (or smaller percentage if established by the community) before the “start of construction” for the improvement. This term covers structures that have incurred “substantial damage,” regardless of actual repair work performed.
Introduction
2.1
1.0 INTRODUCTION
1.1 Project background
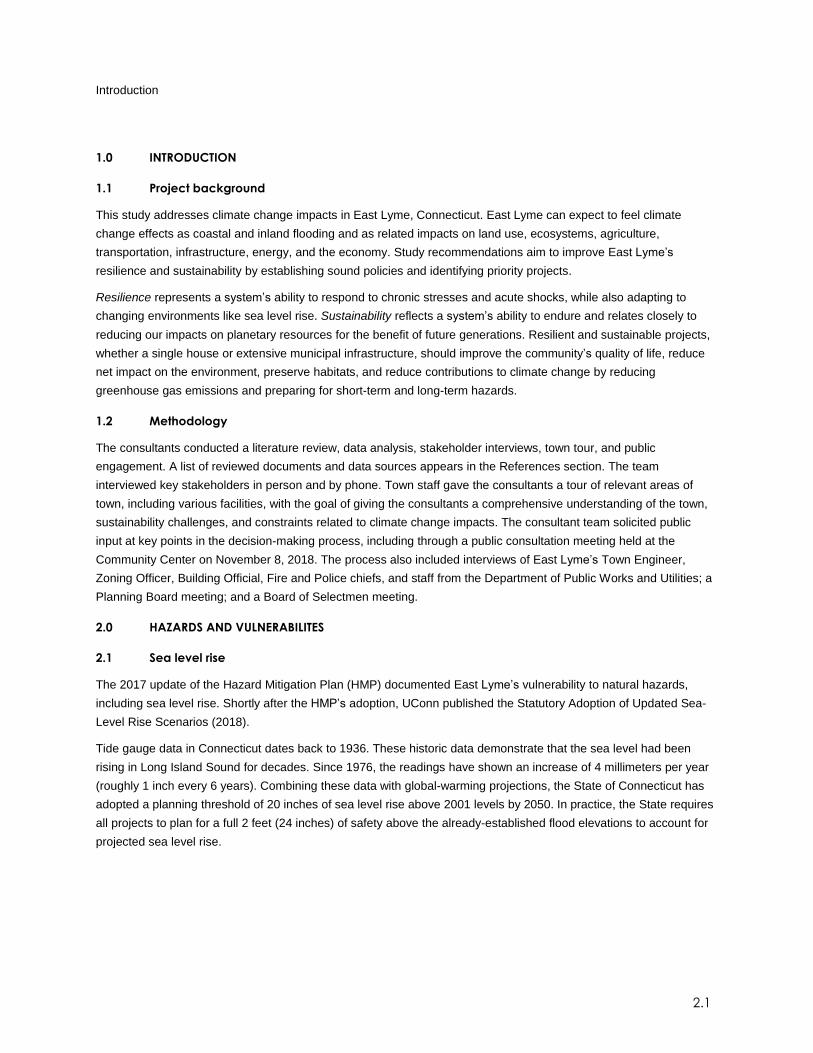
This study addresses climate change impacts in East Lyme, Connecticut. East Lyme can expect to feel climate
change effects as coastal and inland flooding and as related impacts on land use, ecosystems, agriculture,
transportation, infrastructure, energy, and the economy. Study recommendations aim to improve East Lyme’s
resilience and sustainability by establishing sound policies and identifying priority projects.
Resilience represents a system’s ability to respond to chronic stresses and acute shocks, while also adapting to
changing environments like sea level rise. Sustainability reflects a system’s ability to endure and relates closely to
reducing our impacts on planetary resources for the benefit of future generations. Resilient and sustainable projects,
whether a single house or extensive municipal infrastructure, should improve the community’s quality of life, reduce
net impact on the environment, preserve habitats, and reduce contributions to climate change by reducing
greenhouse gas emissions and preparing for short-term and long-term hazards.
1.2 Methodology
The consultants conducted a literature review, data analysis, stakeholder interviews, town tour, and public
engagement. A list of reviewed documents and data sources appears in the References section. The team
interviewed key stakeholders in person and by phone. Town staff gave the consultants a tour of relevant areas of
town, including various facilities, with the goal of giving the consultants a comprehensive understanding of the town,
sustainability challenges, and constraints related to climate change impacts. The consultant team solicited public
input at key points in the decision-making process, including through a public consultation meeting held at the
Community Center on November 8, 2018. The process also included interviews of East Lyme’s Town Engineer,
Zoning Officer, Building Official, Fire and Police chiefs, and staff from the Department of Public Works and Utilities; a
Planning Board meeting; and a Board of Selectmen meeting.
2.0 HAZARDS AND VULNERABILITES
2.1 Sea level rise
The 2017 update of the Hazard Mitigation Plan (HMP) documented East Lyme’s vulnerability to natural hazards,
including sea level rise. Shortly after the HMP’s adoption, UConn published the Statutory Adoption of Updated Sea-
Level Rise Scenarios (2018).
Tide gauge data in Connecticut dates back to 1936. These historic data demonstrate that the sea level had been
rising in Long Island Sound for decades. Since 1976, the readings have shown an increase of 4 millimeters per year
(roughly 1 inch every 6 years). Combining these data with global-warming projections, the State of Connecticut has
adopted a planning threshold of 20 inches of sea level rise above 2001 levels by 2050. In practice, the State requires
all projects to plan for a full 2 feet (24 inches) of safety above the already-established flood elevations to account for
projected sea level rise.
Hazards and vulnerabilites
2.2
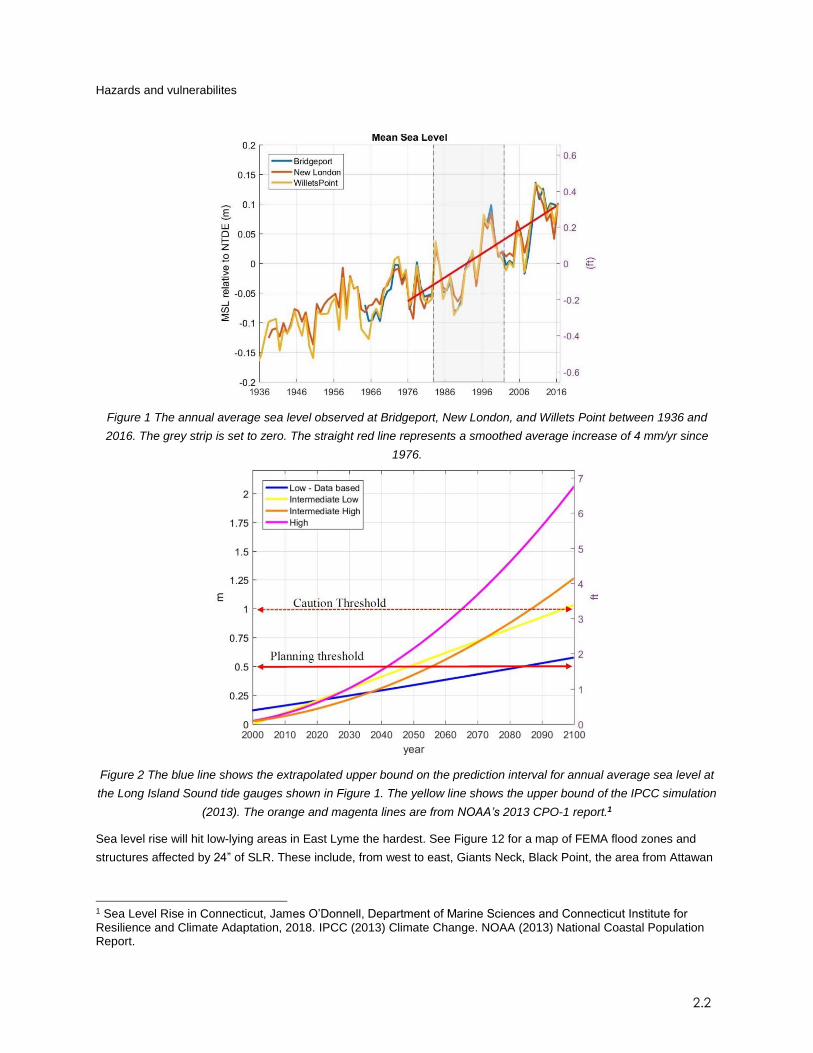
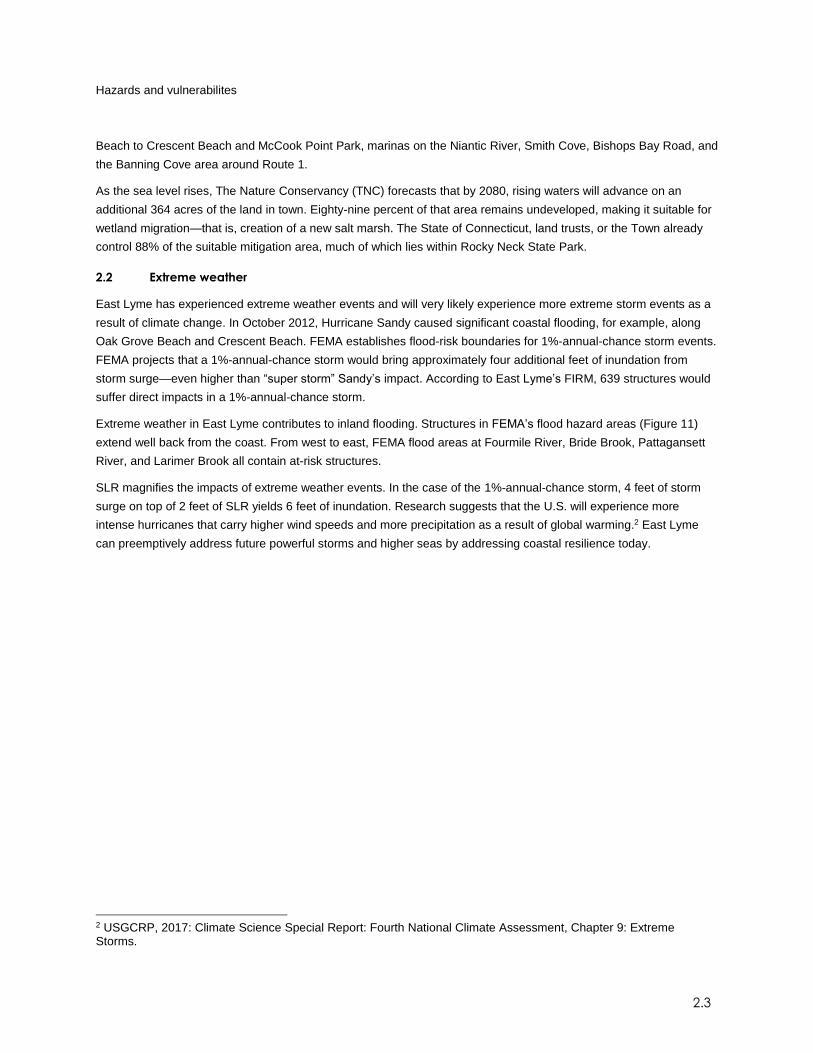
Figure 1 The annual average sea level observed at Bridgeport, New London, and Willets Point between 1936 and
2016. The grey strip is set to zero. The straight red line represents a smoothed average increase of 4 mm/yr since
1976.
Figure 2 The blue line shows the extrapolated upper bound on the prediction interval for annual average sea level at
the Long Island Sound tide gauges shown in Figure 1. The yellow line shows the upper bound of the IPCC simulation
(2013). The orange and magenta lines are from NOAA’s 2013 CPO-1 report.1
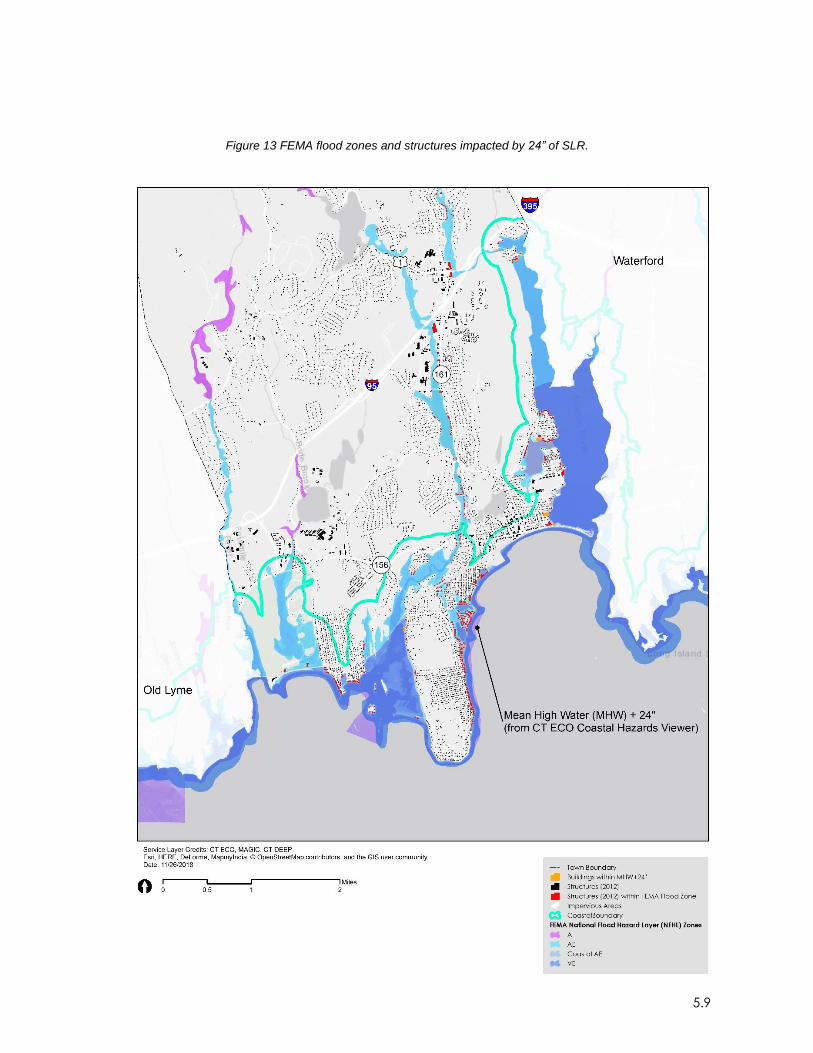
Sea level rise will hit low-lying areas in East Lyme the hardest. See Figure 12 for a map of FEMA flood zones and
structures affected by 24” of SLR. These include, from west to east, Giants Neck, Black Point, the area from Attawan
1 Sea Level Rise in Connecticut, James O’Donnell, Department of Marine Sciences and Connecticut Institute for Resilience and Climate Adaptation, 2018. IPCC (2013) Climate Change. NOAA (2013) National Coastal Population Report.
Hazards and vulnerabilites
2.3
Beach to Crescent Beach and McCook Point Park, marinas on the Niantic River, Smith Cove, Bishops Bay Road, and
the Banning Cove area around Route 1.
As the sea level rises, The Nature Conservancy (TNC) forecasts that by 2080, rising waters will advance on an
additional 364 acres of the land in town. Eighty-nine percent of that area remains undeveloped, making it suitable for
wetland migration—that is, creation of a new salt marsh. The State of Connecticut, land trusts, or the Town already
control 88% of the suitable mitigation area, much of which lies within Rocky Neck State Park.
2.2 Extreme weather
East Lyme has experienced extreme weather events and will very likely experience more extreme storm events as a
result of climate change. In October 2012, Hurricane Sandy caused significant coastal flooding, for example, along
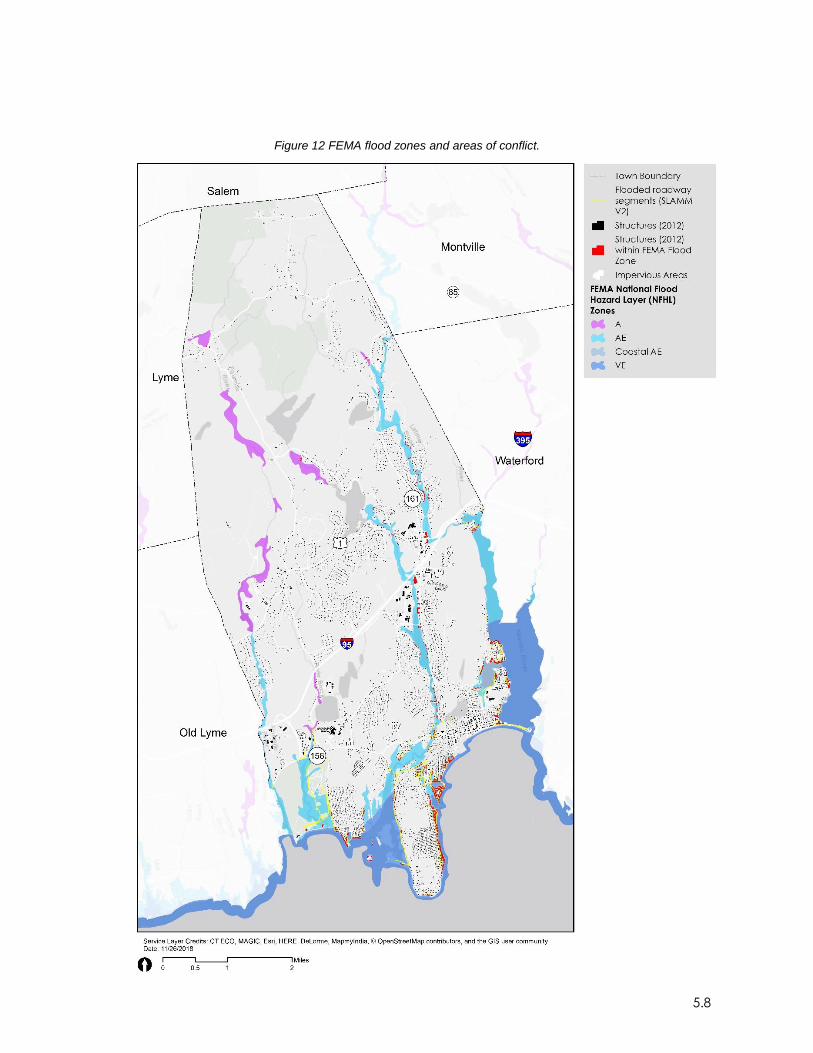
Oak Grove Beach and Crescent Beach. FEMA establishes flood-risk boundaries for 1%-annual-chance storm events.
FEMA projects that a 1%-annual-chance storm would bring approximately four additional feet of inundation from
storm surge—even higher than “super storm” Sandy’s impact. According to East Lyme’s FIRM, 639 structures would
suffer direct impacts in a 1%-annual-chance storm.
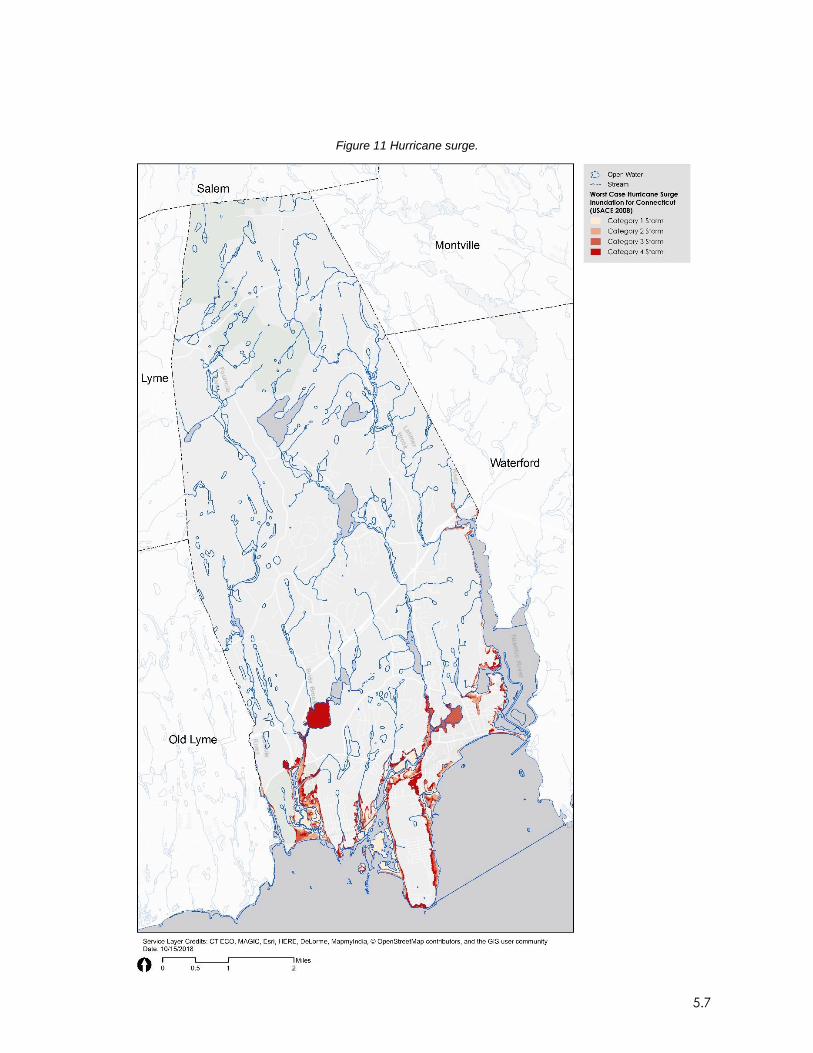
Extreme weather in East Lyme contributes to inland flooding. Structures in FEMA’s flood hazard areas (Figure 11)
extend well back from the coast. From west to east, FEMA flood areas at Fourmile River, Bride Brook, Pattagansett
River, and Larimer Brook all contain at-risk structures.
SLR magnifies the impacts of extreme weather events. In the case of the 1%-annual-chance storm, 4 feet of storm
surge on top of 2 feet of SLR yields 6 feet of inundation. Research suggests that the U.S. will experience more
intense hurricanes that carry higher wind speeds and more precipitation as a result of global warming.2 East Lyme
can preemptively address future powerful storms and higher seas by addressing coastal resilience today.
2 USGCRP, 2017: Climate Science Special Report: Fourth National Climate Assessment, Chapter 9: Extreme Storms.
Community Resilience Toolbox
3.4
3.0 COMMUNITY RESILIENCE TOOLBOX
This resilience toolbox provides recommended options for mitigating flooding that results from climate-change driven
increases in precipitation and sea level.
3.1 Policy updates
3.1.1 Freeboard
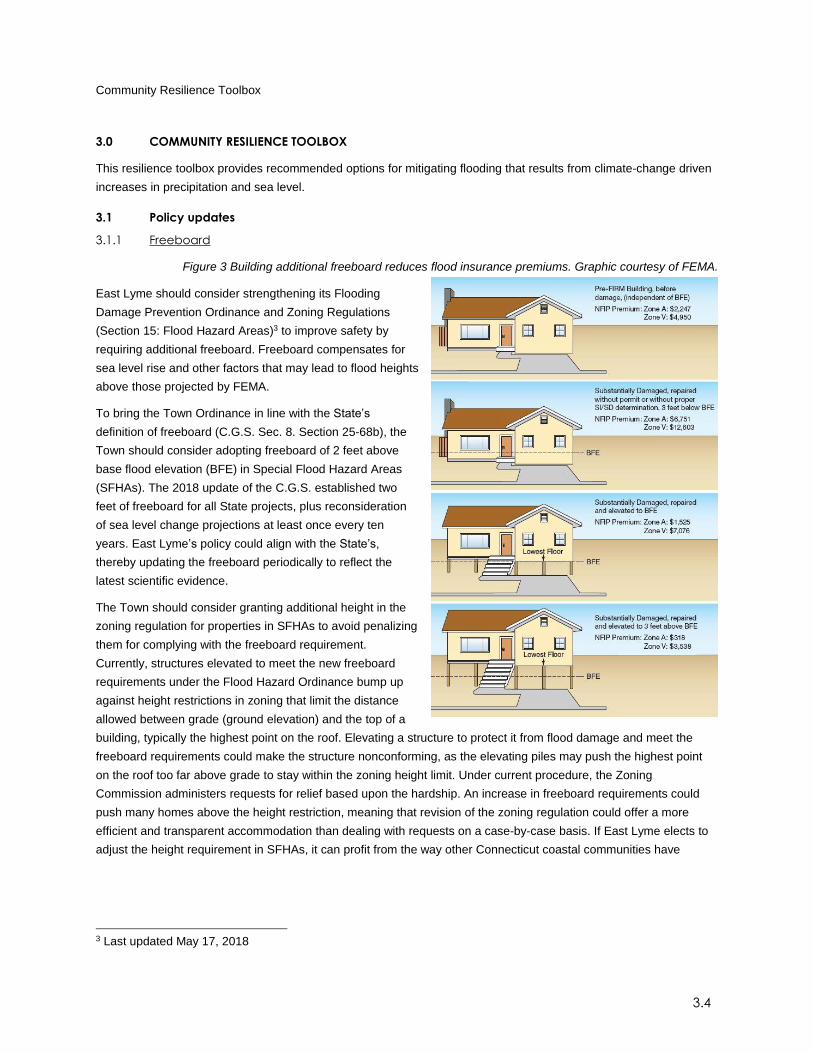
Figure 3 Building additional freeboard reduces flood insurance premiums. Graphic courtesy of FEMA.
East Lyme should consider strengthening its Flooding
Damage Prevention Ordinance and Zoning Regulations
(Section 15: Flood Hazard Areas)3 to improve safety by
requiring additional freeboard. Freeboard compensates for
sea level rise and other factors that may lead to flood heights
above those projected by FEMA.
To bring the Town Ordinance in line with the State’s
definition of freeboard (C.G.S. Sec. 8. Section 25-68b), the
Town should consider adopting freeboard of 2 feet above
base flood elevation (BFE) in Special Flood Hazard Areas
(SFHAs). The 2018 update of the C.G.S. established two
feet of freeboard for all State projects, plus reconsideration
of sea level change projections at least once every ten
years. East Lyme’s policy could align with the State’s,
thereby updating the freeboard periodically to reflect the
latest scientific evidence.
The Town should consider granting additional height in the
zoning regulation for properties in SFHAs to avoid penalizing
them for complying with the freeboard requirement.
Currently, structures elevated to meet the new freeboard
requirements under the Flood Hazard Ordinance bump up
against height restrictions in zoning that limit the distance
allowed between grade (ground elevation) and the top of a
building, typically the highest point on the roof. Elevating a structure to protect it from flood damage and meet the
freeboard requirements could make the structure nonconforming, as the elevating piles may push the highest point
on the roof too far above grade to stay within the zoning height limit. Under current procedure, the Zoning
Commission administers requests for relief based upon the hardship. An increase in freeboard requirements could
push many homes above the height restriction, meaning that revision of the zoning regulation could offer a more
efficient and transparent accommodation than dealing with requests on a case-by-case basis. If East Lyme elects to
adjust the height requirement in SFHAs, it can profit from the way other Connecticut coastal communities have
3 Last updated May 17, 2018
Community Resilience Toolbox
3.5
addressed this issue. The 2018 white paper Height Restrictions on Elevated Residential Buildings in Connecticut
Coastal Floodplains offers many applicable examples.4
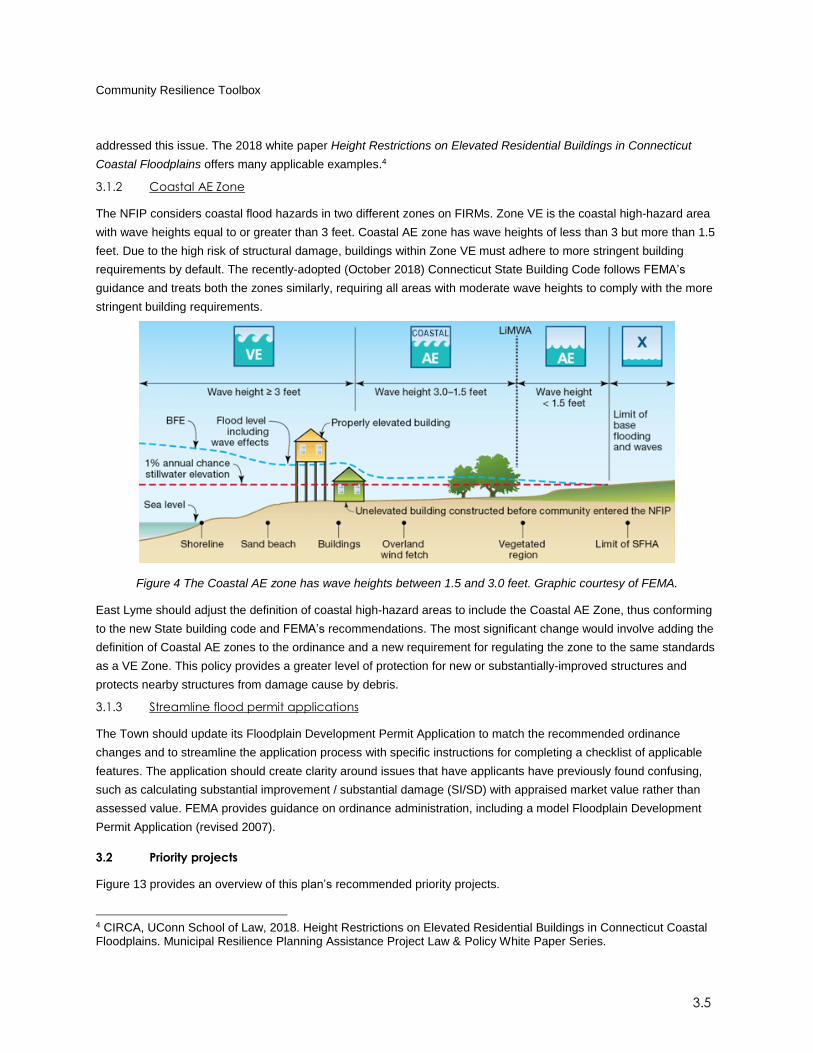
3.1.2 Coastal AE Zone
The NFIP considers coastal flood hazards in two different zones on FIRMs. Zone VE is the coastal high-hazard area
with wave heights equal to or greater than 3 feet. Coastal AE zone has wave heights of less than 3 but more than 1.5
feet. Due to the high risk of structural damage, buildings within Zone VE must adhere to more stringent building
requirements by default. The recently-adopted (October 2018) Connecticut State Building Code follows FEMA’s
guidance and treats both the zones similarly, requiring all areas with moderate wave heights to comply with the more
stringent building requirements.
Figure 4 The Coastal AE zone has wave heights between 1.5 and 3.0 feet. Graphic courtesy of FEMA.
East Lyme should adjust the definition of coastal high-hazard areas to include the Coastal AE Zone, thus conforming
to the new State building code and FEMA’s recommendations. The most significant change would involve adding the
definition of Coastal AE zones to the ordinance and a new requirement for regulating the zone to the same standards
as a VE Zone. This policy provides a greater level of protection for new or substantially-improved structures and
protects nearby structures from damage cause by debris.
3.1.3 Streamline flood permit applications
The Town should update its Floodplain Development Permit Application to match the recommended ordinance
changes and to streamline the application process with specific instructions for completing a checklist of applicable
features. The application should create clarity around issues that have applicants have previously found confusing,
such as calculating substantial improvement / substantial damage (SI/SD) with appraised market value rather than
assessed value. FEMA provides guidance on ordinance administration, including a model Floodplain Development
Permit Application (revised 2007).
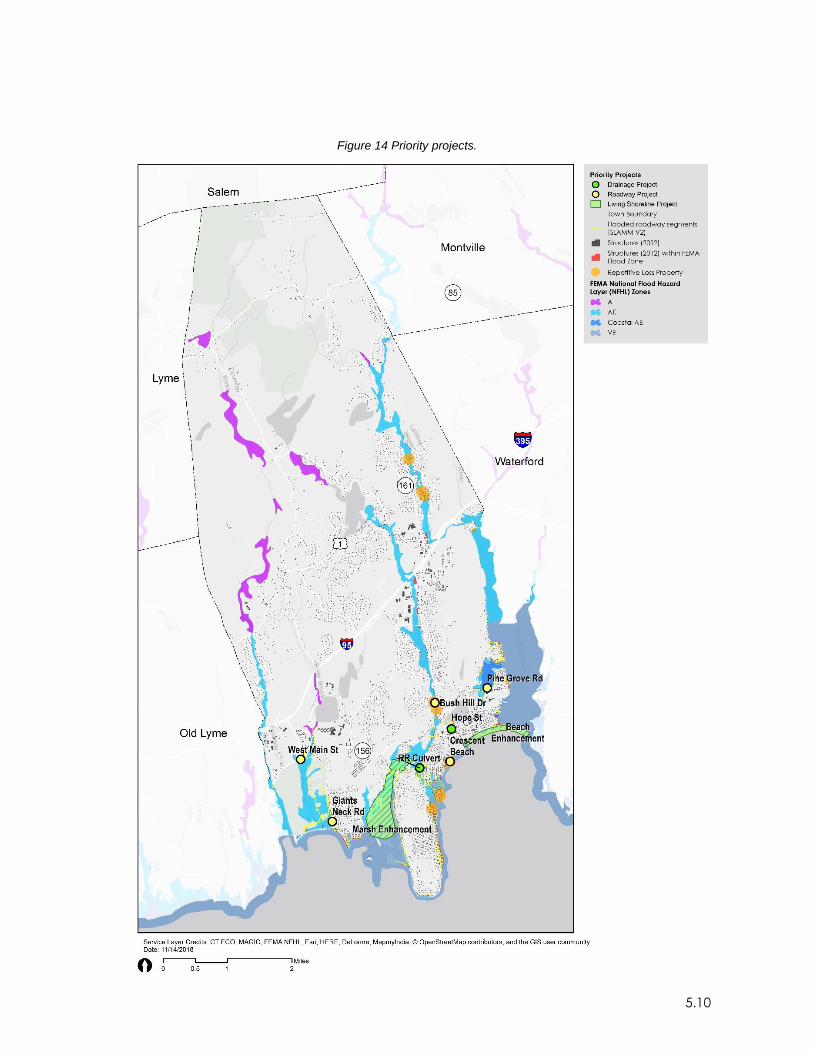
3.2 Priority projects
Figure 13 provides an overview of this plan’s recommended priority projects.
4 CIRCA, UConn School of Law, 2018. Height Restrictions on Elevated Residential Buildings in Connecticut Coastal Floodplains. Municipal Resilience Planning Assistance Project Law & Policy White Paper Series.
Community Resilience Toolbox
3.6
3.2.1 Roadway alterations for emergency egress
Roadway closures are the most common result of coastal flooding in East Lyme. When deciding whether to elevate
or abandon roads the Town must take into account emergency access and egress alternatives as described in the
2017 Hazard Mitigation Plan Update.
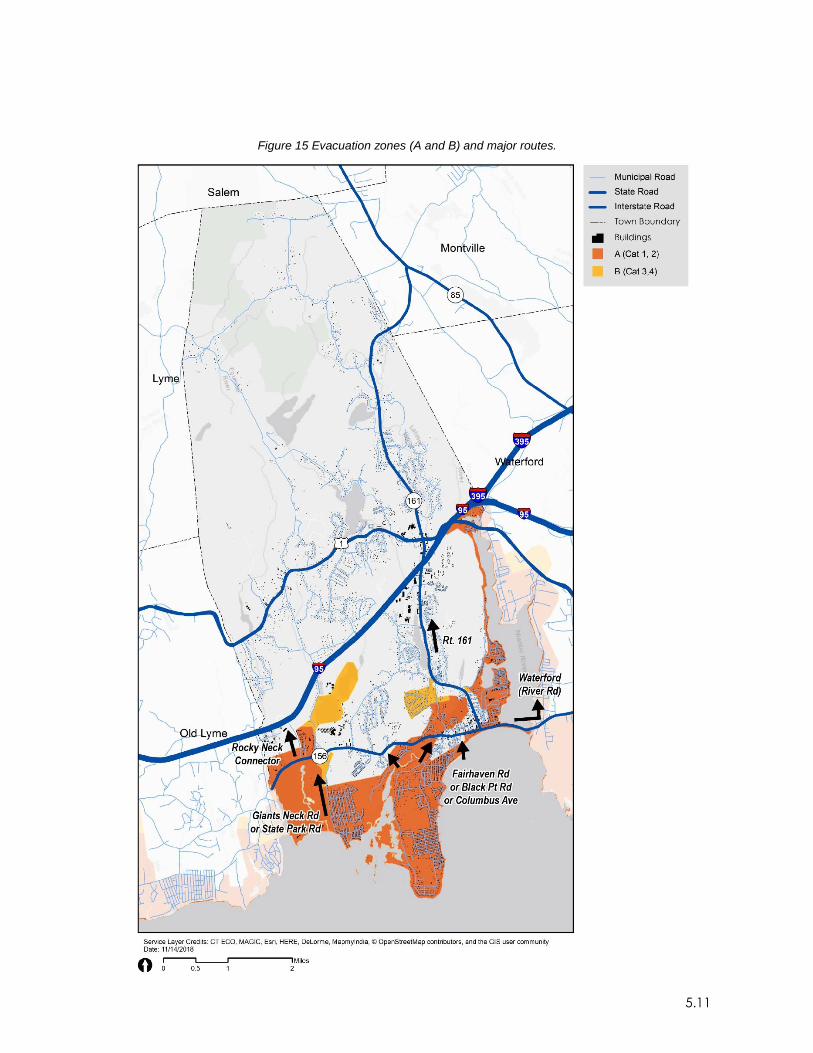
East Lyme’s major state and federal roads—including Route 161, Route 1, and Interstate 95—are its preferred
evacuation routes. The East Lyme Library / Community Center, at 39 Society Road, serves as the town’s primary
emergency shelter. School facilities function as secondary shelters.5
West Main Street
The point where West Main Street crosses Bride Brook is subject to coastal inundation coming through Rocky Neck
State Park. This segment of West Main, part of State-operated Route 156, provides important emergency access. It
sits adjacent to the I-95 access ramp, the state park entrance, and York Correctional Institution. ConnDOT and East
Lyme should consider roadway alterations such as road raising that can extend the road’s use during storms.
Giants Neck Road
Dell Lane and Edge Hill Road provide access to the relatively upland Giants Neck neighborhood during flooding.
However, the lower-elevation area where Giants Neck Road crosses the railroad corridor could become inundated,
isolating the neighborhood south of the railroad corridor. East Lyme should consider an emergency access plan that
involves either altering this section of the road or providing another means of access over the upland area.
Bush Hill Drive
A single low bridge over Pattagansett River provides the sole access to the Bush Hill neighborhood, effectively a cul-
de-sac with about 130 houses. High river levels already flood the bridge. East Lyme should consider altering the
bridge to protect access during storms. Alternatively, the town could create a new access point to the neighborhood
from nearby upland streets, such as Whiting Farm Lane or Romagna Road.
Pine Grove Road
The Pine Grove Neighborhood sits at the end of a peninsula with several structures in the SFHA. South of the
neighborhood the Army National Guard’s Camp Niantic blocks all access routes except for low-lying Pine Grove
Road, which can flood during storms. From the standpoint of infrastructure, the most direct solution would establish
access through Camp Niantic during emergencies when Pine Grove Road is flooded. The military does not typically
welcome unannounced visitors, however, so the Town should be prepared to elevate Pine Grove Road if cannot
negotiate a deal with Camp Niantic for emergency access.
Crescent Beach area roads
A low grade makes Crescent Beach one of the areas most susceptible to sea level rise in East Lyme. “King Tides”
(exceptionally high tides) periodically flood Atlantic Avenue, parts of Ocean Avenue, parts of Bayview Avenue, and
South Washington Street at Beach Avenue. For example, elevations along Atlantic Avenue reach as low as 4 feet
and sit within a VE 12-foot flood zone. Frequent floods strain both the residents and the municipality. The town should
consider gradually abandoning roadway segments that flood frequently. This process would eventually create a
series of dead-end streets that terminate at the shore. As roads flood more often and undergo gradually phase-out,
5 East Lyme is currently in the CT Enhanced 9-1-1 database. East Lyme is also in the CT Alert Emergency Notification System (ENS) that allows residents to receive emergency alerts through a variety of media.
Community Resilience Toolbox
3.7
the Town should make provisions for resident parking in a nearby upland area, such as in or near McCook Point
Park. Structures seaward of the abandoned roads are already in the process of being raised. As this process
continues, a new elevated boardwalk could provide access to those structures.
3.2.2 Drainage improvements
Flooding due to poor drainage occurs in both upland and coastal areas. This study relied on stakeholder input to
identify priority areas for improvement and did not conduct primary research into the condition of stormwater pipes,
culverts, or other infrastructure.
Hope Street
Hope Street floods during heavy rain, including backing up into the new construction on Methodist Street. Addressing
Hope Street would require comparison of the private and municipal stormwater pipe network connecting into
potentially undersized state storm pipe network on Main Street.
Black Point Road at Burnap Road
Approximately 28 structures and condos sit in a FEMA flood zone near the intersection of Black Point and Burnap
roads just south of the railroad corridor. Inundation in this area comes from Pattagansett River on the other side of
the tracks. The water appears travel through a culvert at an unknown location. The town should assess this
neighborhood for potential flood-control measures. For example, a backflow preventer might be sufficient to avoid
flooding, protecting property owners from having to meet more onerous flood insurance requirements.
3.2.3 Living shorelines
East Lyme’s existing shoreline contains many flood-control structures that do not qualify as “living.” Private seawalls
and bulkheads exist on Giants Neck, Seal Rock, Black Point, Attawan Beach, Crescent Beach, and Atlantic Avenue.
Groins and jetties also exist in the beach areas, built in an attempt to retain land by preventing erosion. Finally, larger
structures include breakwaters at Rocky Neck and the Amtrak-Metro North Railroad at Rocky Neck and the
Pattagansett River estuary that protects landward areas from wave velocity.
The living shorelines approach represents an alternative to hardened adaptation. It enhances natural habitats using
native plants, stone, sand fill, coir logs, and other materials. DEEP, CIRCA, TNC, and NOAA all recommend and
promote living shorelines. This approach provides benefits including pollution remediation, fish and shellfish habitat
enhancement, and shoreline protection. Examples of living shorelines projects include dune restoration, beach
nourishment, coastal bank protection with natural materials and vegetated cover, marsh enhancement, and living
breakwaters. Living shorelines typically fall within DEEP’s jurisdiction, as they typically lie waterward of the Coastal
Jurisdiction Line (CJL) or within tidal wetlands. The CJL is the jurisdiction line for activities requiring permits such as
filling and structures. The CJL’s elevation in East Lyme is 2.3’ (NAVD88).6 The State’s Coastal Policies and Use
Guidelines, the foundational document for coastal work, contains information about policies such as protecting beach
systems, navigation, natural shorelines processes, and tidal wetlands.
UConn and NOAA’s CREST project7 modeled living shoreline site suitability for the Connecticut coast using fetch,
bathymetry, erosion rates, marsh, and beach data as inputs. The project identified areas in East Lyme that could
support beach enhancement, marsh enhancement, and offshore breakwaters, as described in more detail below.
6 https://www.ct.gov/deep/cwp/view.asp?a=2705&Q=511544&deepNAV_GID=1622 7 https://circa.uconn.edu/crest/
Community Resilience Toolbox
3.8
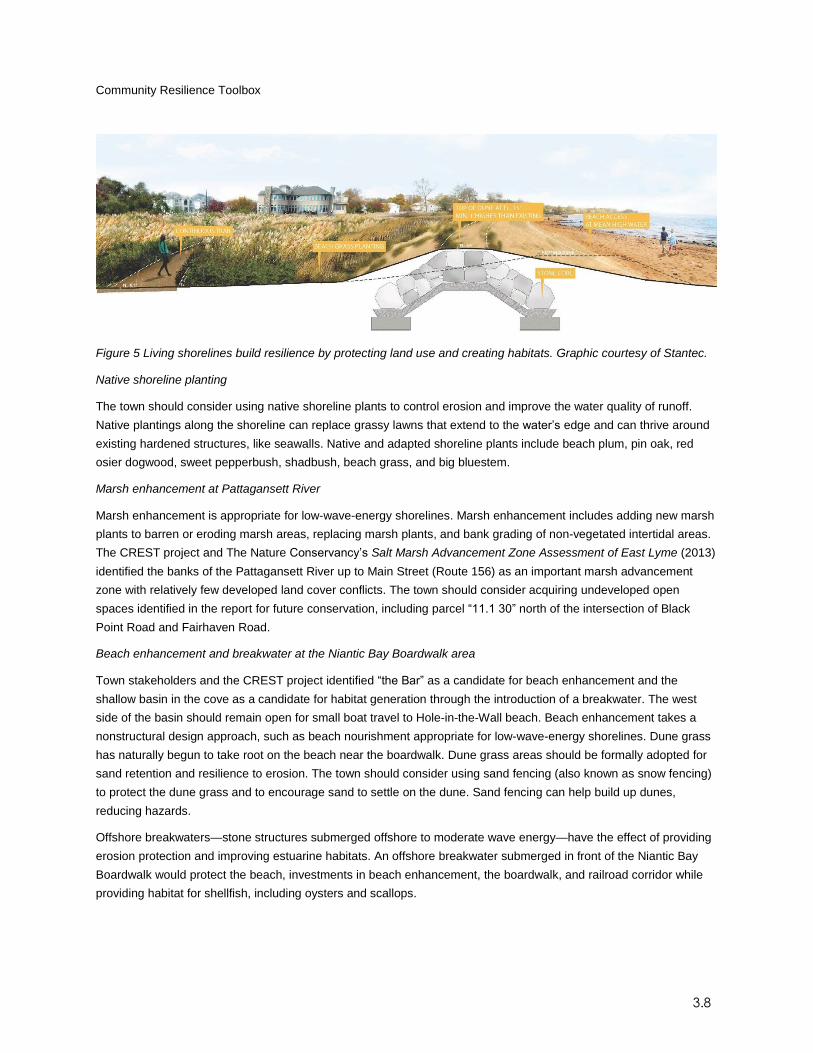
Figure 5 Living shorelines build resilience by protecting land use and creating habitats. Graphic courtesy of Stantec.
Native shoreline planting
The town should consider using native shoreline plants to control erosion and improve the water quality of runoff.
Native plantings along the shoreline can replace grassy lawns that extend to the water’s edge and can thrive around
existing hardened structures, like seawalls. Native and adapted shoreline plants include beach plum, pin oak, red
osier dogwood, sweet pepperbush, shadbush, beach grass, and big bluestem.
Marsh enhancement at Pattagansett River
Marsh enhancement is appropriate for low-wave-energy shorelines. Marsh enhancement includes adding new marsh
plants to barren or eroding marsh areas, replacing marsh plants, and bank grading of non-vegetated intertidal areas.
The CREST project and The Nature Conservancy’s Salt Marsh Advancement Zone Assessment of East Lyme (2013)
identified the banks of the Pattagansett River up to Main Street (Route 156) as an important marsh advancement
zone with relatively few developed land cover conflicts. The town should consider acquiring undeveloped open
spaces identified in the report for future conservation, including parcel “11.1 30” north of the intersection of Black
Point Road and Fairhaven Road.
Beach enhancement and breakwater at the Niantic Bay Boardwalk area
Town stakeholders and the CREST project identified “the Bar” as a candidate for beach enhancement and the
shallow basin in the cove as a candidate for habitat generation through the introduction of a breakwater. The west
side of the basin should remain open for small boat travel to Hole-in-the-Wall beach. Beach enhancement takes a
nonstructural design approach, such as beach nourishment appropriate for low-wave-energy shorelines. Dune grass
has naturally begun to take root on the beach near the boardwalk. Dune grass areas should be formally adopted for
sand retention and resilience to erosion. The town should consider using sand fencing (also known as snow fencing)
to protect the dune grass and to encourage sand to settle on the dune. Sand fencing can help build up dunes,
reducing hazards.
Offshore breakwaters—stone structures submerged offshore to moderate wave energy—have the effect of providing
erosion protection and improving estuarine habitats. An offshore breakwater submerged in front of the Niantic Bay
Boardwalk would protect the beach, investments in beach enhancement, the boardwalk, and railroad corridor while
providing habitat for shellfish, including oysters and scallops.
Community Resilience Toolbox
3.9
The CREST project recommends another offshore breakwater at Black Point Beach, a private beach on Bathing
Beach Road. The beach’s private status militated against its classification as a priority project for the Town to include
in implementation.
3.2.4 Critical infrastructure flood protection
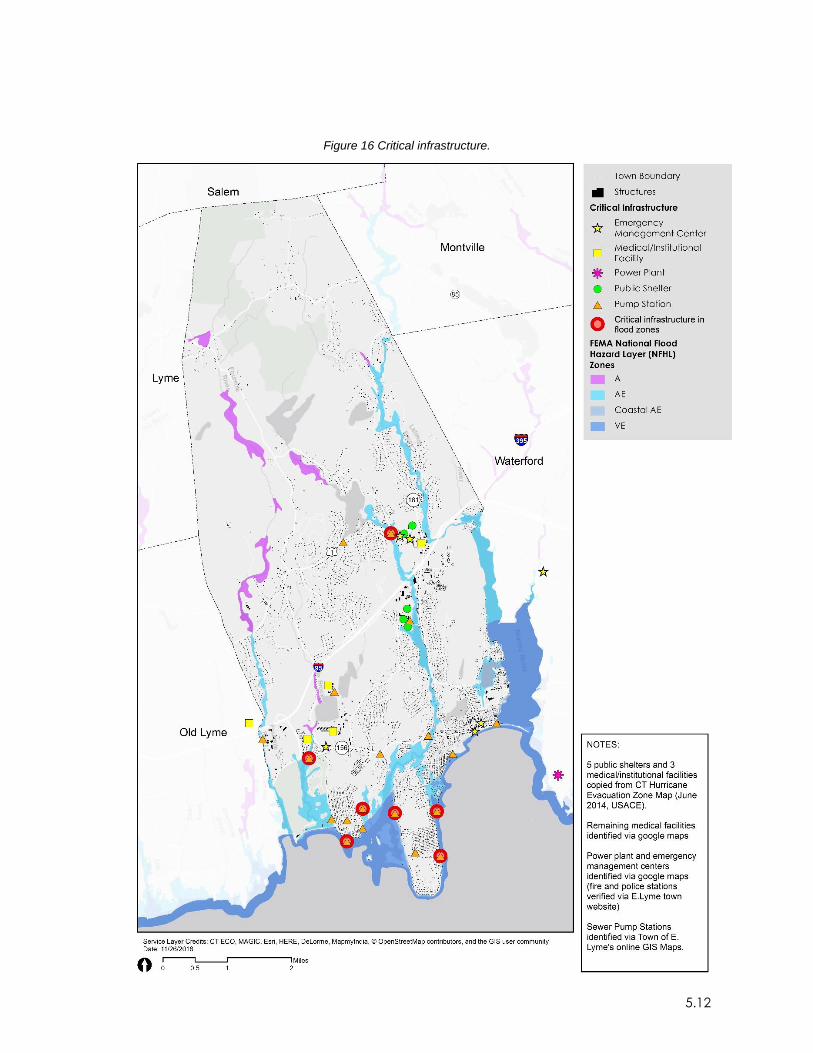
Figure 15 shows that seven of East Lyme’s pump stations sit in the 1%-annual-chance-storm flood zone.
Furthermore, the pump stations on Black Point Road and Attawan Avenue sit in velocity zones (areas with wave
heights greater than 3 feet). Critical infrastructure, like pump stations, with high risk of flooding and other hazards
should receive top priority for protection. EPA’s 2014 Guide for Water and Wastewater Utilities contains useful
suggestions for preventing intrusion of flood water, protecting assets, and ensuring reliability. Resilience-building
options available to East Lyme include construction of permanent or temporary barriers to flooding; to elevate or
relocate instrumentation, electrical controls, computers and records; and to ensure backup power for pumps.
3.2.5 Communication campaign
Property owners in flood zones have a lot of changes to keep track of, from sea level rise to insurance premiums. The
Town should consider a communication campaign to keep impacted property owners informed and educated
regarding current regulations and vulnerability to flooding. Tools such as a communication packet are recommended
to increase awareness of hazard mitigation and vulnerabilities at the sub-community level, as the threats from climate
change are often hyperlocal. A communication packet could contain pertinent information regarding the sub-area’s
hazards, adaptation measures, supportive services, and other opportunities for land owners and tenants.
Communications about the threats should have graphic representations of the hazard areas under future scenarios. A
community communication plan could include public education and provide practical information and answers, such
as how to adapt to sea level rise and where emergency shelters are. It will also be important to reach East Lyme’s
beach associations, as they are some of the most vulnerable to flooding.
3.2.6 Land use change, acquisition, and conservation
The upcoming update of East Lyme’s Plan of Conservation and Development update (POCD), expected in 2020,
presents an opportunity to discuss long-term land use changes with the community. The Town may consider policies
that limit development and redevelopment in flood-prone areas while providing incentives to encourage development
in upland areas.
In the wake of future floods, the Town may have opportunities to acquire properties with damaged structures from
owners who don’t choose to make repairs and continue living in hazard areas. FEMA’s Pre-Disaster Mitigation,
Hazard Mitigation Grant Program, Flood Mitigation Assistance, Repetitive Flood Claims, or Severe Repetitive Loss
programs may make funds available for such acquisitions.
Implementation
4.10
4.0 IMPLEMENTATION
4.1 Implementation overview
The Planning Commission will act as the steward of this study. The commission will shall monitor progress, assess
performance, maintain accurate information about implementation, and provide information to support status
reporting, progress measurement, and forecasting. Monitoring and evaluation—including collecting, measuring, and
assessing actual performance against the implementation matrix—should take place throughout implementation. The
Planning Commission should revisit implementation progress at least once a year, but ideally more frequently. The
commission should gather and evaluate data on progress for key performance indicators throughout the
implementation process.
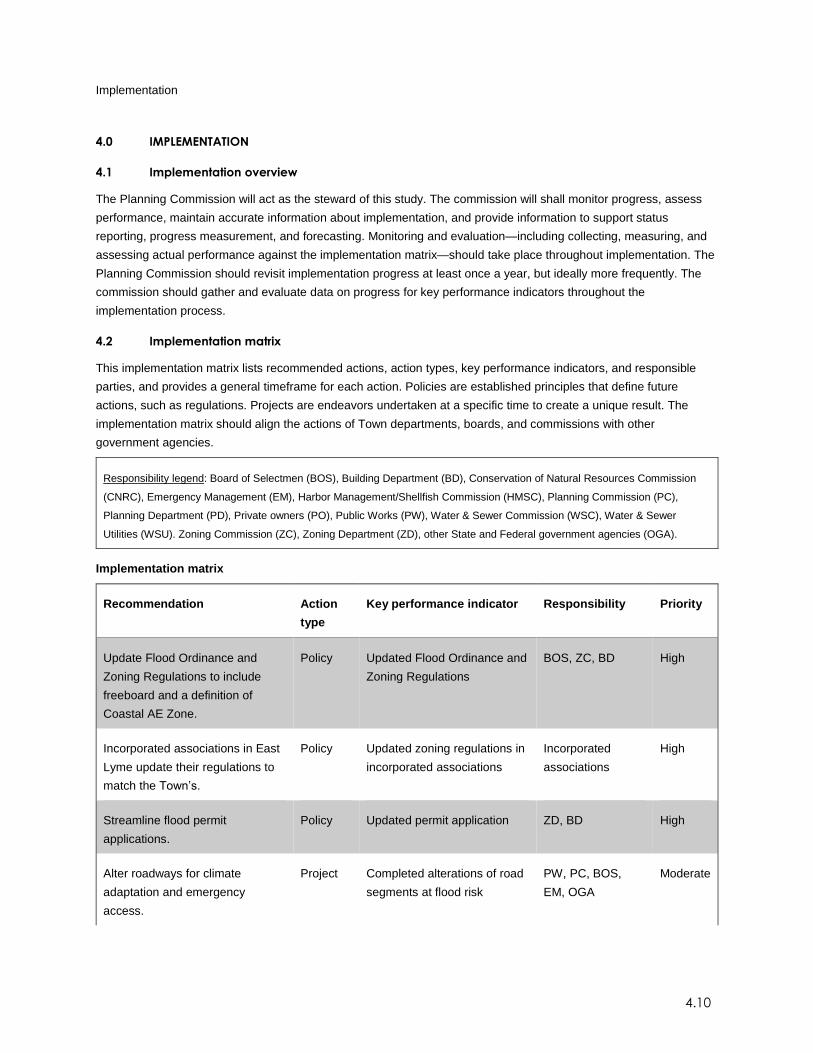
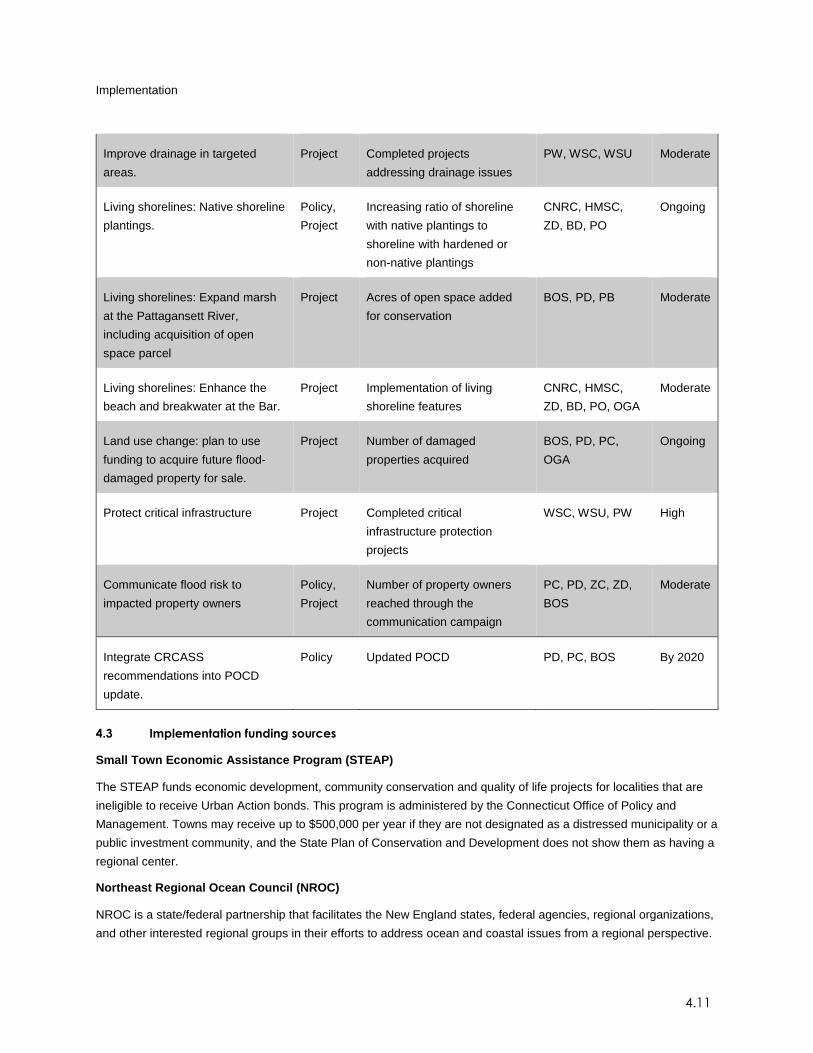
4.2 Implementation matrix
This implementation matrix lists recommended actions, action types, key performance indicators, and responsible
parties, and provides a general timeframe for each action. Policies are established principles that define future
actions, such as regulations. Projects are endeavors undertaken at a specific time to create a unique result. The
implementation matrix should align the actions of Town departments, boards, and commissions with other
government agencies.
Responsibility legend: Board of Selectmen (BOS), Building Department (BD), Conservation of Natural Resources Commission
(CNRC), Emergency Management (EM), Harbor Management/Shellfish Commission (HMSC), Planning Commission (PC),
Planning Department (PD), Private owners (PO), Public Works (PW), Water & Sewer Commission (WSC), Water & Sewer
Utilities (WSU). Zoning Commission (ZC), Zoning Department (ZD), other State and Federal government agencies (OGA).
Implementation matrix
Recommendation Action
type
Key performance indicator Responsibility Priority
Update Flood Ordinance and
Zoning Regulations to include
freeboard and a definition of
Coastal AE Zone.
Policy Updated Flood Ordinance and
Zoning Regulations
BOS, ZC, BD High
Incorporated associations in East
Lyme update their regulations to
match the Town’s.
Policy Updated zoning regulations in
incorporated associations
Incorporated
associations
High
Streamline flood permit
applications.
Policy Updated permit application ZD, BD High
Alter roadways for climate
adaptation and emergency
access.
Project Completed alterations of road
segments at flood risk
PW, PC, BOS,
EM, OGA
Moderate
Implementation
4.11
Improve drainage in targeted
areas.
Project Completed projects
addressing drainage issues
PW, WSC, WSU Moderate
Living shorelines: Native shoreline
plantings.
Policy,
Project
Increasing ratio of shoreline
with native plantings to
shoreline with hardened or
non-native plantings
CNRC, HMSC,
ZD, BD, PO
Ongoing
Living shorelines: Expand marsh
at the Pattagansett River,
including acquisition of open
space parcel
Project Acres of open space added
for conservation
BOS, PD, PB Moderate
Living shorelines: Enhance the
beach and breakwater at the Bar.
Project Implementation of living
shoreline features
CNRC, HMSC,
ZD, BD, PO, OGA
Moderate
Land use change: plan to use
funding to acquire future flood-
damaged property for sale.
Project Number of damaged
properties acquired
BOS, PD, PC,
OGA
Ongoing
Protect critical infrastructure Project Completed critical
infrastructure protection
projects
WSC, WSU, PW High
Communicate flood risk to
impacted property owners
Policy,
Project
Number of property owners
reached through the
communication campaign
PC, PD, ZC, ZD,
BOS
Moderate
Integrate CRCASS
recommendations into POCD
update.
Policy Updated POCD PD, PC, BOS By 2020
4.3 Implementation funding sources
Small Town Economic Assistance Program (STEAP)
The STEAP funds economic development, community conservation and quality of life projects for localities that are
ineligible to receive Urban Action bonds. This program is administered by the Connecticut Office of Policy and
Management. Towns may receive up to $500,000 per year if they are not designated as a distressed municipality or a
public investment community, and the State Plan of Conservation and Development does not show them as having a
regional center.
Northeast Regional Ocean Council (NROC)
NROC is a state/federal partnership that facilitates the New England states, federal agencies, regional organizations,
and other interested regional groups in their efforts to address ocean and coastal issues from a regional perspective.
Implementation
4.12
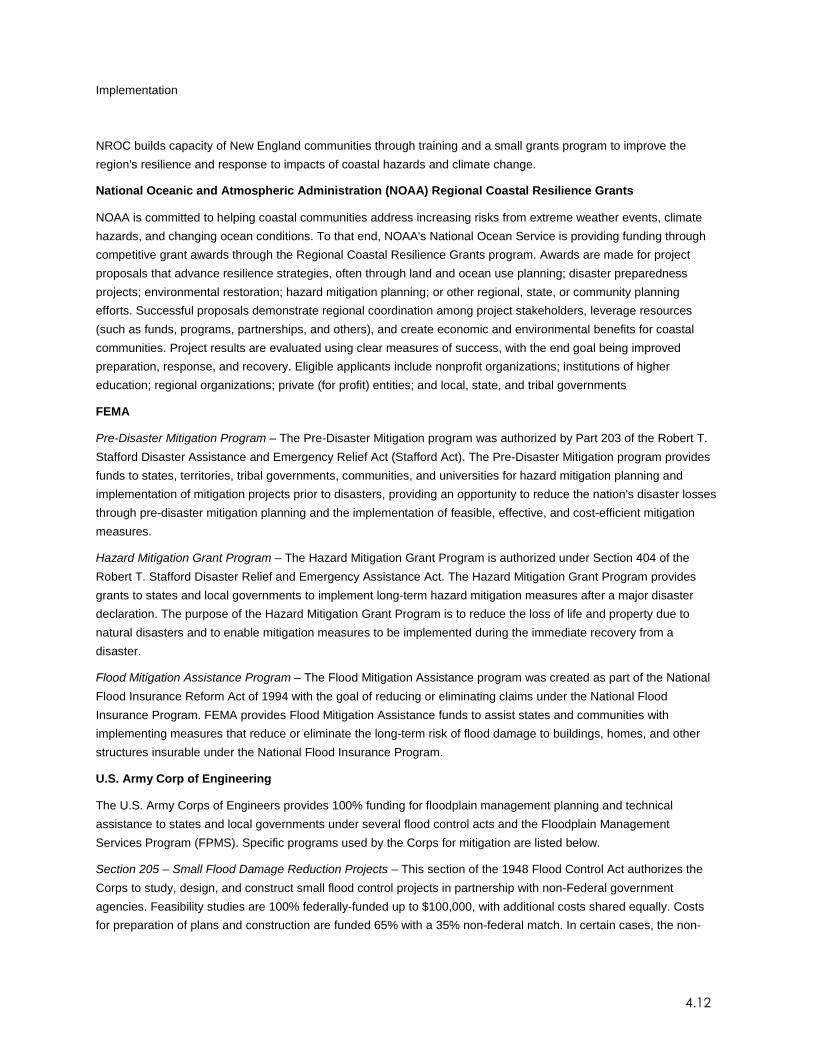
NROC builds capacity of New England communities through training and a small grants program to improve the
region's resilience and response to impacts of coastal hazards and climate change.
National Oceanic and Atmospheric Administration (NOAA) Regional Coastal Resilience Grants
NOAA is committed to helping coastal communities address increasing risks from extreme weather events, climate
hazards, and changing ocean conditions. To that end, NOAA's National Ocean Service is providing funding through
competitive grant awards through the Regional Coastal Resilience Grants program. Awards are made for project
proposals that advance resilience strategies, often through land and ocean use planning; disaster preparedness
projects; environmental restoration; hazard mitigation planning; or other regional, state, or community planning
efforts. Successful proposals demonstrate regional coordination among project stakeholders, leverage resources
(such as funds, programs, partnerships, and others), and create economic and environmental benefits for coastal
communities. Project results are evaluated using clear measures of success, with the end goal being improved
preparation, response, and recovery. Eligible applicants include nonprofit organizations; institutions of higher
education; regional organizations; private (for profit) entities; and local, state, and tribal governments
FEMA
Pre-Disaster Mitigation Program – The Pre-Disaster Mitigation program was authorized by Part 203 of the Robert T.
Stafford Disaster Assistance and Emergency Relief Act (Stafford Act). The Pre-Disaster Mitigation program provides
funds to states, territories, tribal governments, communities, and universities for hazard mitigation planning and
implementation of mitigation projects prior to disasters, providing an opportunity to reduce the nation's disaster losses
through pre-disaster mitigation planning and the implementation of feasible, effective, and cost-efficient mitigation
measures.
Hazard Mitigation Grant Program – The Hazard Mitigation Grant Program is authorized under Section 404 of the
Robert T. Stafford Disaster Relief and Emergency Assistance Act. The Hazard Mitigation Grant Program provides
grants to states and local governments to implement long-term hazard mitigation measures after a major disaster
declaration. The purpose of the Hazard Mitigation Grant Program is to reduce the loss of life and property due to
natural disasters and to enable mitigation measures to be implemented during the immediate recovery from a
disaster.
Flood Mitigation Assistance Program – The Flood Mitigation Assistance program was created as part of the National
Flood Insurance Reform Act of 1994 with the goal of reducing or eliminating claims under the National Flood
Insurance Program. FEMA provides Flood Mitigation Assistance funds to assist states and communities with
implementing measures that reduce or eliminate the long-term risk of flood damage to buildings, homes, and other
structures insurable under the National Flood Insurance Program.
U.S. Army Corp of Engineering
The U.S. Army Corps of Engineers provides 100% funding for floodplain management planning and technical
assistance to states and local governments under several flood control acts and the Floodplain Management
Services Program (FPMS). Specific programs used by the Corps for mitigation are listed below.
Section 205 – Small Flood Damage Reduction Projects – This section of the 1948 Flood Control Act authorizes the
Corps to study, design, and construct small flood control projects in partnership with non-Federal government
agencies. Feasibility studies are 100% federally-funded up to $100,000, with additional costs shared equally. Costs
for preparation of plans and construction are funded 65% with a 35% non-federal match. In certain cases, the non-
Implementation
4.13
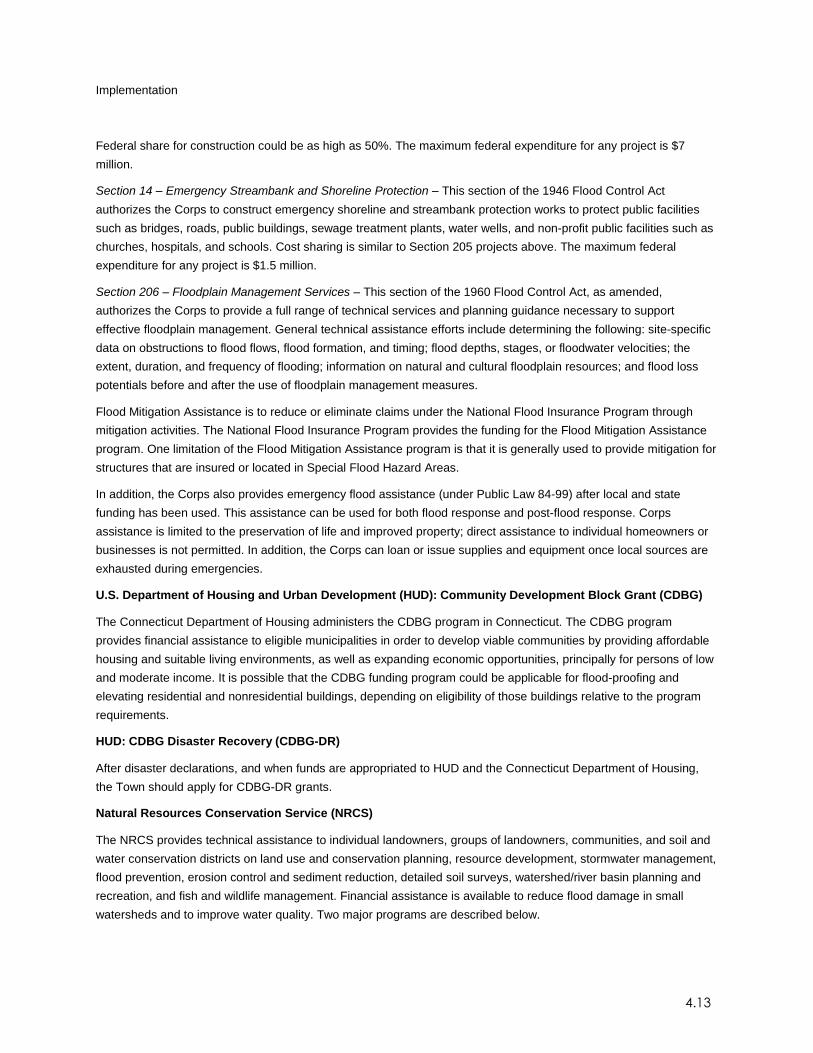
Federal share for construction could be as high as 50%. The maximum federal expenditure for any project is $7
million.
Section 14 – Emergency Streambank and Shoreline Protection – This section of the 1946 Flood Control Act
authorizes the Corps to construct emergency shoreline and streambank protection works to protect public facilities
such as bridges, roads, public buildings, sewage treatment plants, water wells, and non-profit public facilities such as
churches, hospitals, and schools. Cost sharing is similar to Section 205 projects above. The maximum federal
expenditure for any project is $1.5 million.
Section 206 – Floodplain Management Services – This section of the 1960 Flood Control Act, as amended,
authorizes the Corps to provide a full range of technical services and planning guidance necessary to support
effective floodplain management. General technical assistance efforts include determining the following: site-specific
data on obstructions to flood flows, flood formation, and timing; flood depths, stages, or floodwater velocities; the
extent, duration, and frequency of flooding; information on natural and cultural floodplain resources; and flood loss
potentials before and after the use of floodplain management measures.
Flood Mitigation Assistance is to reduce or eliminate claims under the National Flood Insurance Program through
mitigation activities. The National Flood Insurance Program provides the funding for the Flood Mitigation Assistance
program. One limitation of the Flood Mitigation Assistance program is that it is generally used to provide mitigation for
structures that are insured or located in Special Flood Hazard Areas.
In addition, the Corps also provides emergency flood assistance (under Public Law 84-99) after local and state
funding has been used. This assistance can be used for both flood response and post-flood response. Corps
assistance is limited to the preservation of life and improved property; direct assistance to individual homeowners or
businesses is not permitted. In addition, the Corps can loan or issue supplies and equipment once local sources are
exhausted during emergencies.
U.S. Department of Housing and Urban Development (HUD): Community Development Block Grant (CDBG)
The Connecticut Department of Housing administers the CDBG program in Connecticut. The CDBG program
provides financial assistance to eligible municipalities in order to develop viable communities by providing affordable
housing and suitable living environments, as well as expanding economic opportunities, principally for persons of low
and moderate income. It is possible that the CDBG funding program could be applicable for flood-proofing and
elevating residential and nonresidential buildings, depending on eligibility of those buildings relative to the program
requirements.
HUD: CDBG Disaster Recovery (CDBG-DR)
After disaster declarations, and when funds are appropriated to HUD and the Connecticut Department of Housing,
the Town should apply for CDBG-DR grants.
Natural Resources Conservation Service (NRCS)
The NRCS provides technical assistance to individual landowners, groups of landowners, communities, and soil and
water conservation districts on land use and conservation planning, resource development, stormwater management,
flood prevention, erosion control and sediment reduction, detailed soil surveys, watershed/river basin planning and
recreation, and fish and wildlife management. Financial assistance is available to reduce flood damage in small
watersheds and to improve water quality. Two major programs are described below.
Implementation
4.14
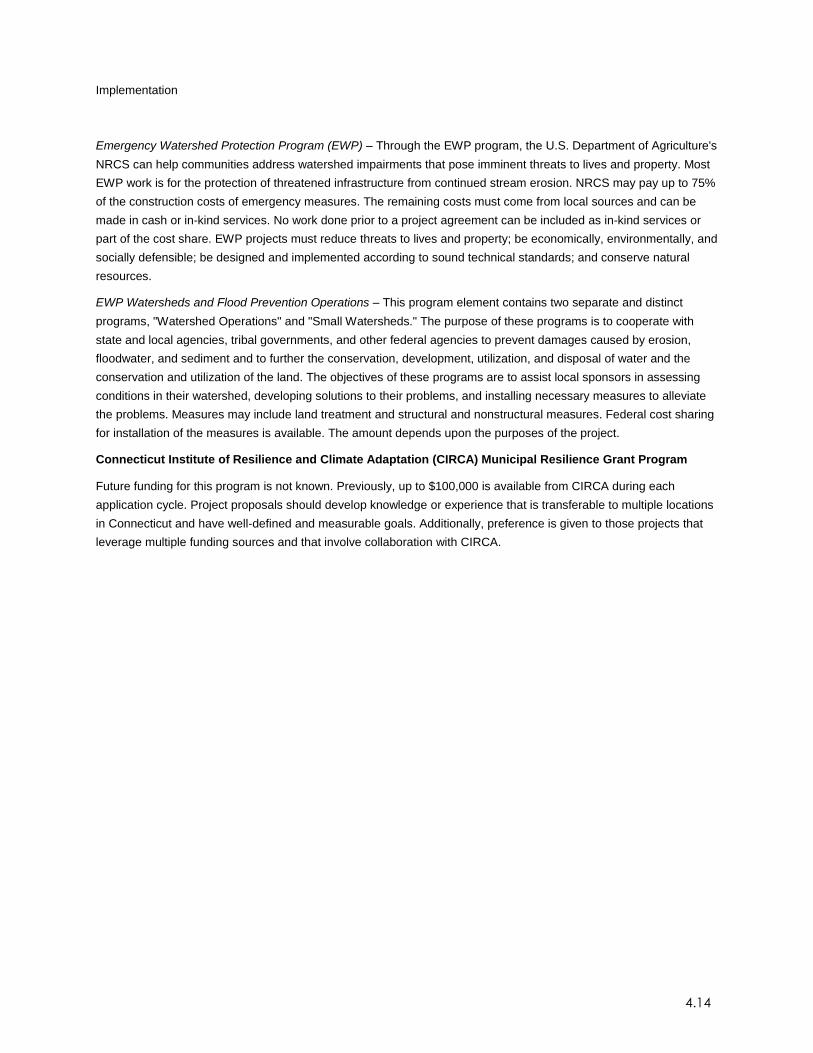
Emergency Watershed Protection Program (EWP) – Through the EWP program, the U.S. Department of Agriculture's
NRCS can help communities address watershed impairments that pose imminent threats to lives and property. Most
EWP work is for the protection of threatened infrastructure from continued stream erosion. NRCS may pay up to 75%
of the construction costs of emergency measures. The remaining costs must come from local sources and can be
made in cash or in-kind services. No work done prior to a project agreement can be included as in-kind services or
part of the cost share. EWP projects must reduce threats to lives and property; be economically, environmentally, and
socially defensible; be designed and implemented according to sound technical standards; and conserve natural
resources.
EWP Watersheds and Flood Prevention Operations – This program element contains two separate and distinct
programs, "Watershed Operations" and "Small Watersheds." The purpose of these programs is to cooperate with
state and local agencies, tribal governments, and other federal agencies to prevent damages caused by erosion,
floodwater, and sediment and to further the conservation, development, utilization, and disposal of water and the
conservation and utilization of the land. The objectives of these programs are to assist local sponsors in assessing
conditions in their watershed, developing solutions to their problems, and installing necessary measures to alleviate
the problems. Measures may include land treatment and structural and nonstructural measures. Federal cost sharing
for installation of the measures is available. The amount depends upon the purposes of the project.
Connecticut Institute of Resilience and Climate Adaptation (CIRCA) Municipal Resilience Grant Program
Future funding for this program is not known. Previously, up to $100,000 is available from CIRCA during each
application cycle. Project proposals should develop knowledge or experience that is transferable to multiple locations
in Connecticut and have well-defined and measurable goals. Additionally, preference is given to those projects that
leverage multiple funding sources and that involve collaboration with CIRCA.

5.1
5.0 MAP FIGURES
5.2
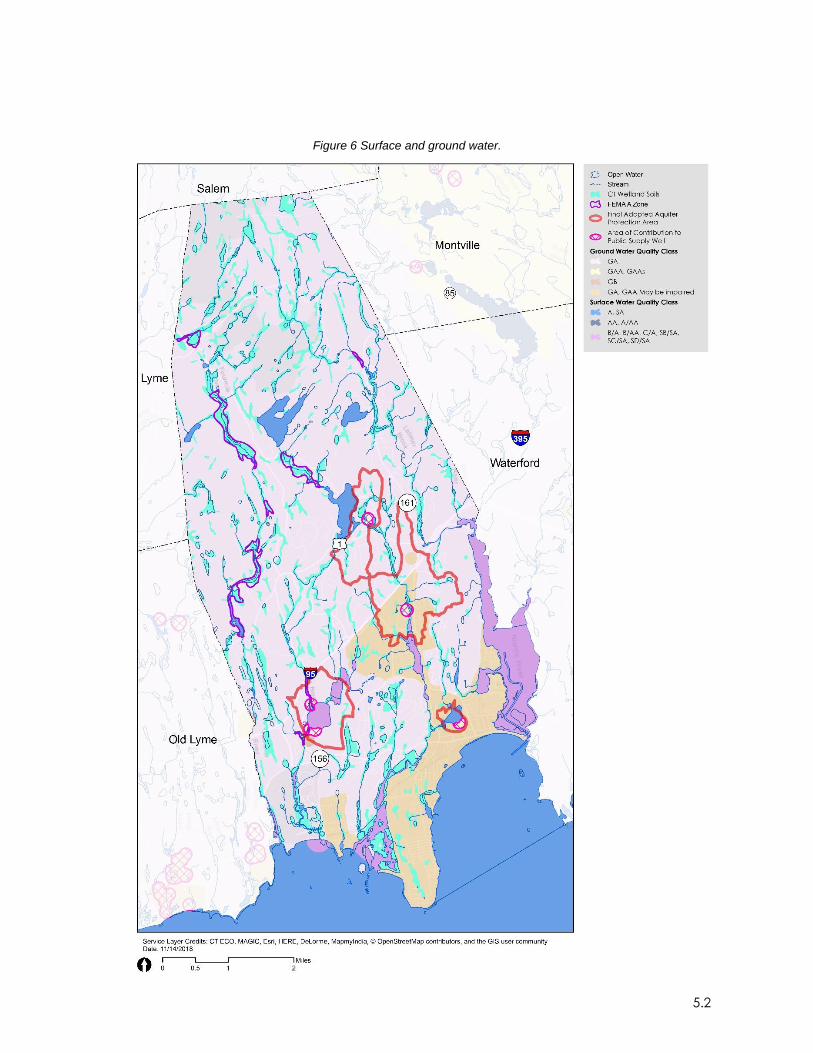
Figure 6 Surface and ground water.
5.3
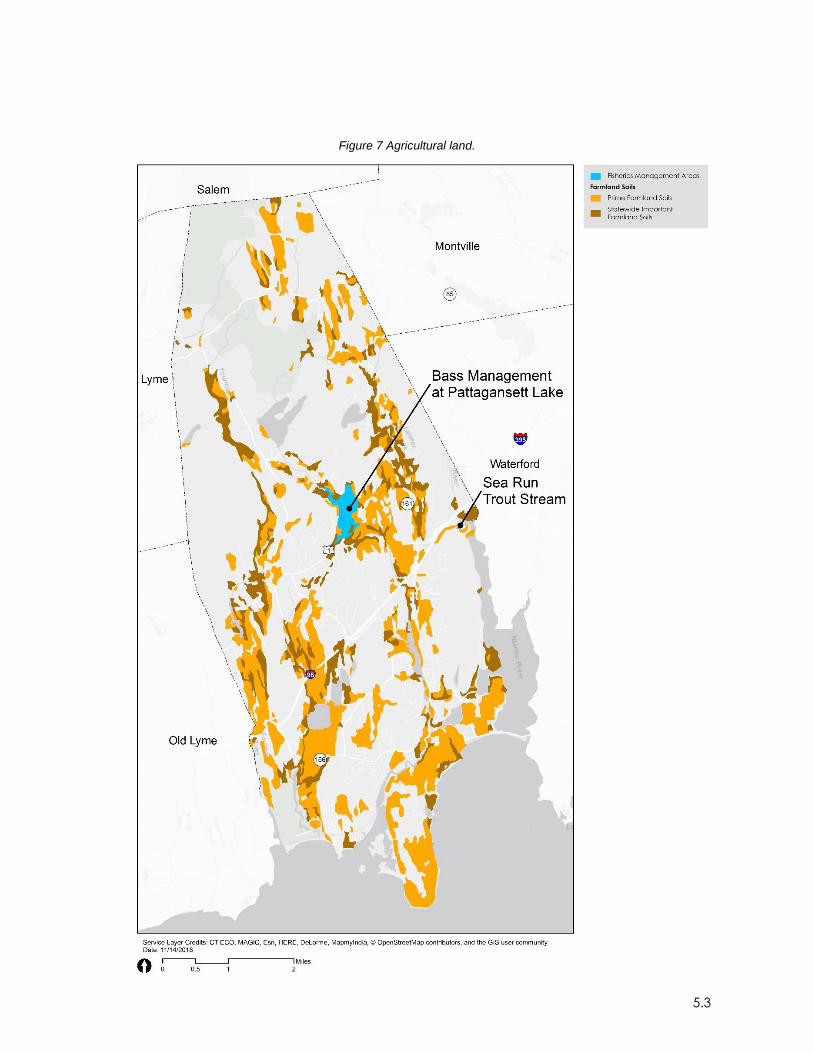
Figure 7 Agricultural land.
5.4
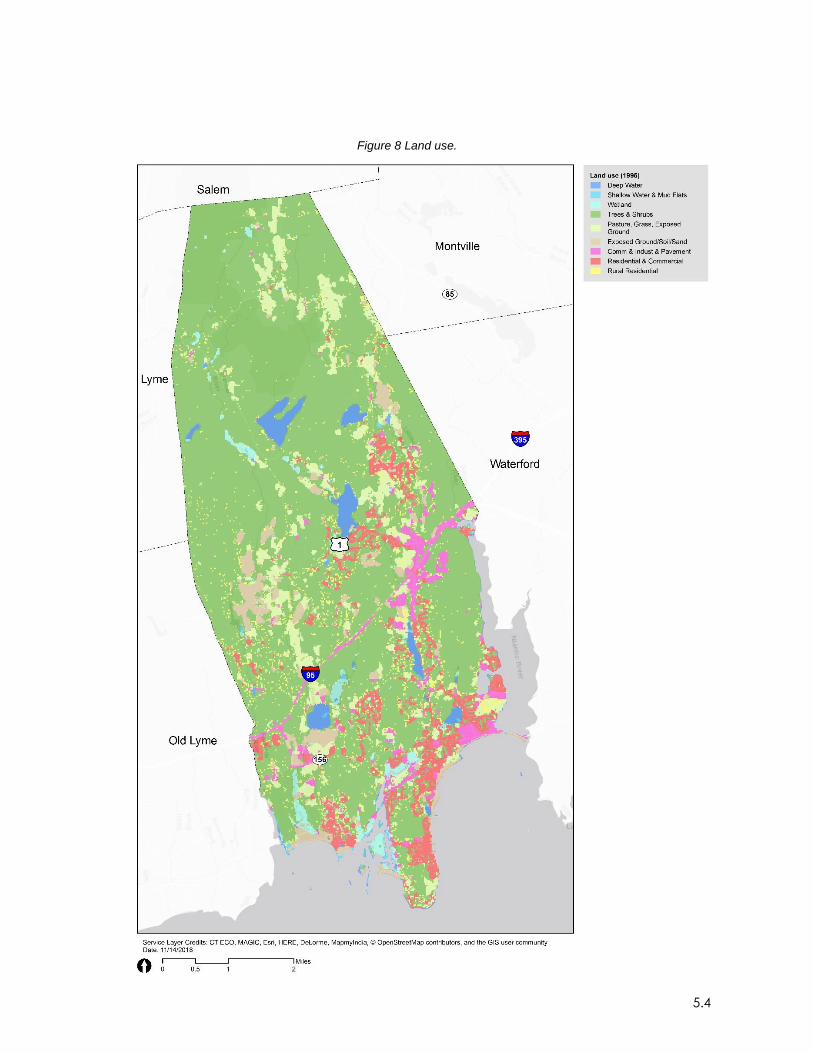
Figure 8 Land use.
5.5
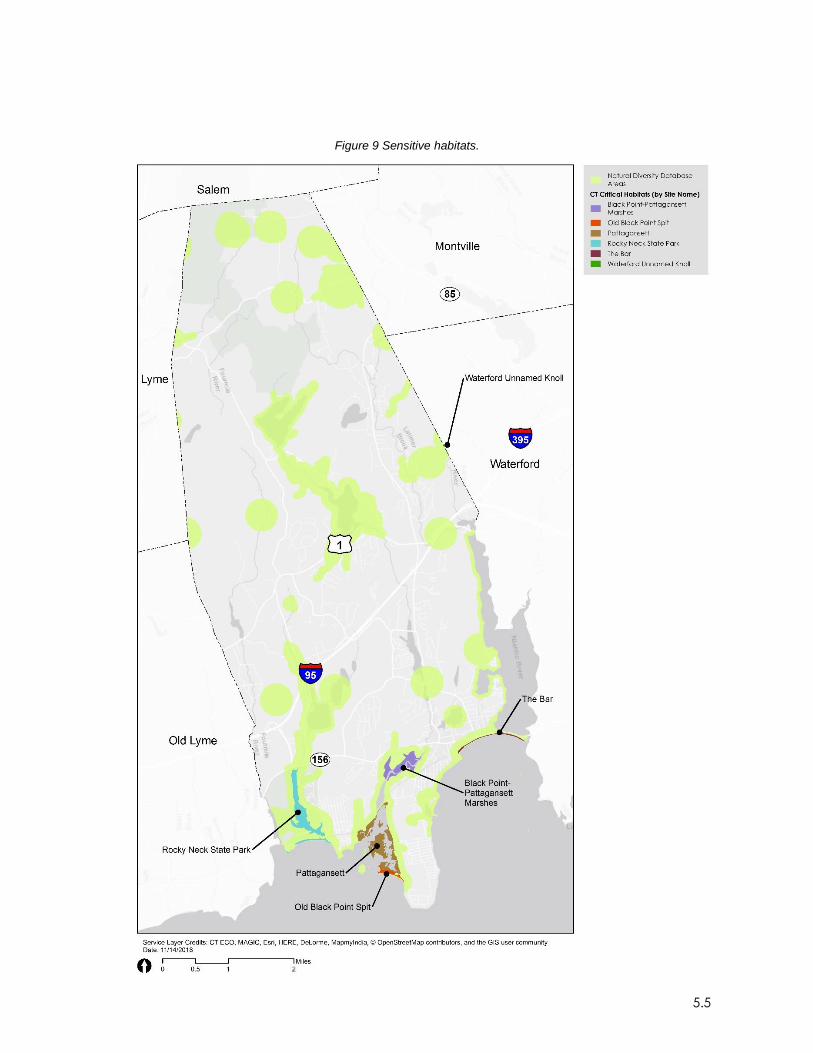
Figure 9 Sensitive habitats.
5.6
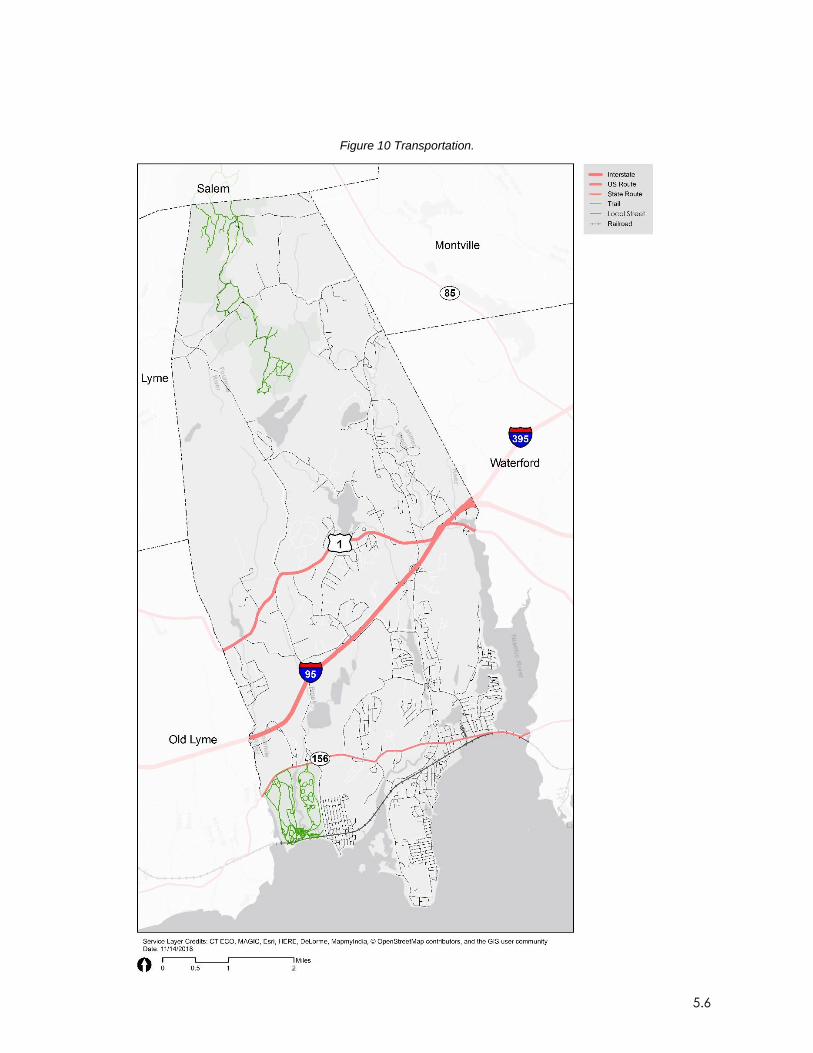
Figure 10 Transportation.
5.7
Figure 11 Hurricane surge.
5.8
Figure 12 FEMA flood zones and areas of conflict.
5.9
Figure 13 FEMA flood zones and structures impacted by 24” of SLR.
5.10
Figure 14 Priority projects.
5.11
Figure 15 Evacuation zones (A and B) and major routes.
5.12
Figure 16 Critical infrastructure.
6.13
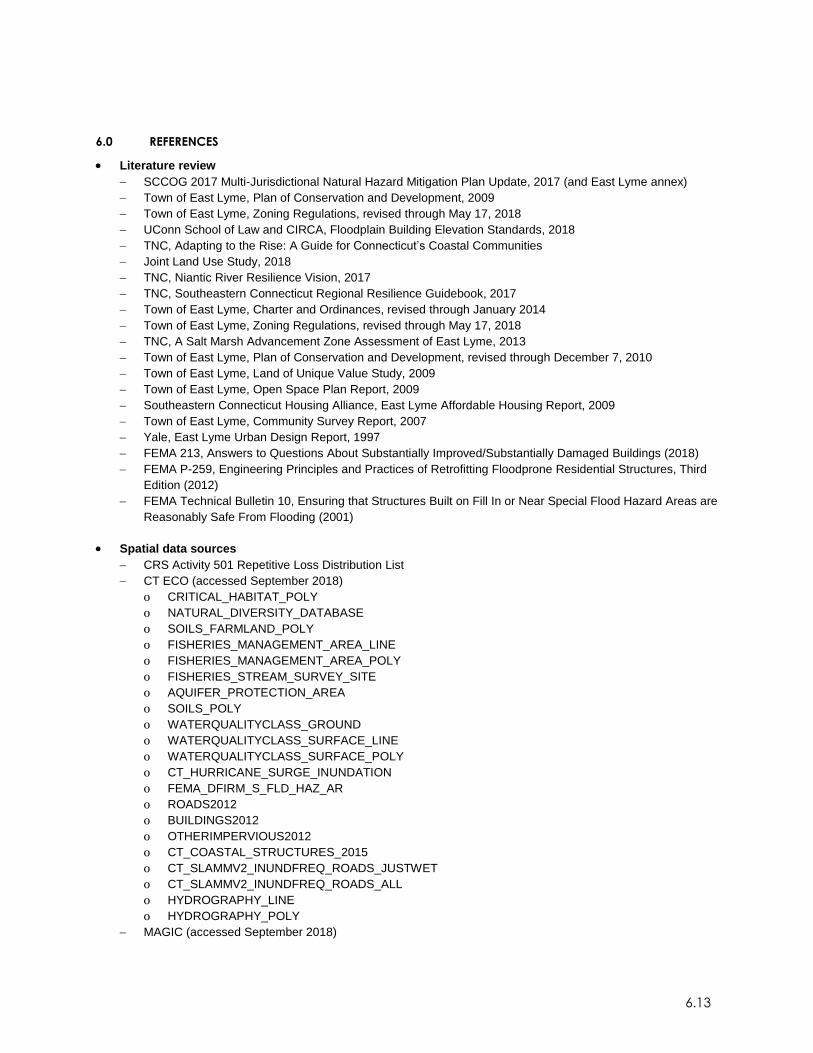
6.0 REFERENCES
Literature review
SCCOG 2017 Multi-Jurisdictional Natural Hazard Mitigation Plan Update, 2017 (and East Lyme annex)
Town of East Lyme, Plan of Conservation and Development, 2009
Town of East Lyme, Zoning Regulations, revised through May 17, 2018
UConn School of Law and CIRCA, Floodplain Building Elevation Standards, 2018
TNC, Adapting to the Rise: A Guide for Connecticut’s Coastal Communities
Joint Land Use Study, 2018
TNC, Niantic River Resilience Vision, 2017
TNC, Southeastern Connecticut Regional Resilience Guidebook, 2017
Town of East Lyme, Charter and Ordinances, revised through January 2014
Town of East Lyme, Zoning Regulations, revised through May 17, 2018
TNC, A Salt Marsh Advancement Zone Assessment of East Lyme, 2013
Town of East Lyme, Plan of Conservation and Development, revised through December 7, 2010
Town of East Lyme, Land of Unique Value Study, 2009
Town of East Lyme, Open Space Plan Report, 2009
Southeastern Connecticut Housing Alliance, East Lyme Affordable Housing Report, 2009
Town of East Lyme, Community Survey Report, 2007
Yale, East Lyme Urban Design Report, 1997
FEMA 213, Answers to Questions About Substantially Improved/Substantially Damaged Buildings (2018)
FEMA P-259, Engineering Principles and Practices of Retrofitting Floodprone Residential Structures, Third
Edition (2012)
FEMA Technical Bulletin 10, Ensuring that Structures Built on Fill In or Near Special Flood Hazard Areas are
Reasonably Safe From Flooding (2001)
Spatial data sources
CRS Activity 501 Repetitive Loss Distribution List
CT ECO (accessed September 2018)
o CRITICAL_HABITAT_POLY
o NATURAL_DIVERSITY_DATABASE
o SOILS_FARMLAND_POLY
o FISHERIES_MANAGEMENT_AREA_LINE
o FISHERIES_MANAGEMENT_AREA_POLY
o FISHERIES_STREAM_SURVEY_SITE
o AQUIFER_PROTECTION_AREA
o SOILS_POLY
o WATERQUALITYCLASS_GROUND
o WATERQUALITYCLASS_SURFACE_LINE
o WATERQUALITYCLASS_SURFACE_POLY
o CT_HURRICANE_SURGE_INUNDATION
o FEMA_DFIRM_S_FLD_HAZ_AR
o ROADS2012
o BUILDINGS2012
o OTHERIMPERVIOUS2012
o CT_COASTAL_STRUCTURES_2015
o CT_SLAMMV2_INUNDFREQ_ROADS_JUSTWET
o CT_SLAMMV2_INUNDFREQ_ROADS_ALL
o HYDROGRAPHY_LINE
o HYDROGRAPHY_POLY
MAGIC (accessed September 2018)
6.14
o STREETS
o RAILROAD
ARCGIS ONLINE (accessed September 2018)
o PARCELPOLYGON
o TOWN WELLS
o SEWER MAIN
o SEWER SHED
o AQUIFER PROTECTION DISTRICT
o ZONING