Embed Size (px)
Citation preview
Code Review at Cisco Systems / 63
Code Review at Cisco Systems
The largest case study ever done on lightweight
code review process; data and lessons.
In May of 2006 Smart Bear Software wrapped up a 10-month case
study of peer code review in the Cisco MeetingPlace1 product
group at Cisco Systems, Inc2. With 2500 reviews of 3.2 million
lines of code written by 50 developers, this is the largest case study
ever done on what’s known as a “lightweight” code review
process.
The subject of almost all published literature on code review
is of formal, heavyweight meeting-based inspections. But in recent
years many development organizations have shrugged off the yoke
of meeting schedules, paper-based code readings, and tedious
1 At the time of this writing (June 2006) Cisco is running television ads in America
touting the advantages of their teleconferencing solution. This is the story of that development group.
2 Cisco® and MeetingPlace® are registered trademarks of Cisco Systems Inc.. These names and the information herein are reproduced with permission.
64 / Best Kept Secrets of Peer Code Review
metrics-gathering in favor of new lightweight review processes.
Certain lightweight processes appear to have the same proven
benefits and measurability found in heavyweight processes while
drastically reducing total time spent engaged in procedures.
The studies in the previous essay have already suggested that
formal meetings add hours to the process without uncovering
additional defects. Furthermore we have found that most devel-
opers prefer a faster, more lightweight approach, and managers like
the idea of a process nimble enough to be applied to all code
changes across the board, not just those dangerous enough to
warrant the time investment of a formal inspection.
But you cannot sacrifice code quality. You cannot just throw
away 30 years of evidence that heavyweight process works. Where
are the numbers to support the effectiveness of a lightweight
process, and what guidelines should be followed to ensure an
effective review?
The Smart Bear / Cisco study sought to answer exactly those
questions. We used real developers working on commercially-
available software at an established software company; no students,
no contrived code snippets, no sterile laboratory conditions.
Cisco has a long history of using various types of code review
as part of their legendary quality control. The MeetingPlace group
was no exception. In July 2005, 50 developers in the MeetingPlace
group started using a software tool for lightweight review in the
hopes that it would increase defect detection while speeding up
overall review time and removing some of the drudgery normally
associated with inspections.
We’ll analyze the results of those reviews and determine the
general characteristics of effective, efficient reviews under this
system. In the process we will demonstrate that this particular
brand of lightweight review is able to uncover as many defects with
as many process metrics in much less time than heavyweight
formal inspections.
Code Review at Cisco Systems / 65
How reviews were conducted
The reviews were conducted using Smart Bear Software’s Code
Collaborator system for tool-assisted peer review. Code Collabo-
rator is described in detail and with screenshots in the “Code
Collaborator” essay in this collection; here we’ll only summarize
the process.
Cisco wanted a review before every code change was checked
into the version control server, which in their case was Perforce®.
They used a Perforce server trigger (included with Code Collabora-
tor) that prevented any code check-in unless a review existed in the
Code Collaborator server, and that review was “complete” with all
found defects fixed and verified.
Software developers were provided with several Code Colla-
borator tools allowing them to upload local changes from the
command-line, a Windows GUI, or from a plug-in to the Perforce
GUI clients P4Win and P4V.
Reviews were performed using Code Collaborator’s web-
based user interface. Authors determined who was “invited” to be
a reviewer or observer; about half the reviews had a single review-
er, the rest two or more. Invitations were sent by Code
Collaborator via e-mail.
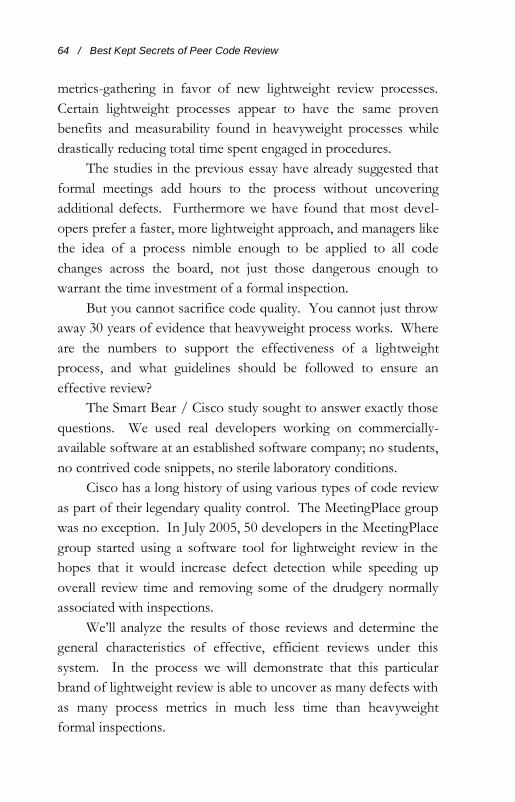
During the inspection, Code Collaborator presented be-
fore/after difference views to all participants. Everyone could
comment on any line of code by clicking on the line and typing.
Comments are kept threaded and are always visible next to the
code in question (see Figure 13).
66 / Best Kept Secrets of Peer Code Review
Figure 13: Code Collaborator screenshot showing
threaded comments next to Java code under in-
spection. The author is defending a design
decision.
Defects are logged like comments, also threaded by file and
line number. When an author believed a defect had been fixed, the
new files were uploaded to the same review. The web interface
then presents these new changes against the original so reviews can
verify that defects were fixed and no new defects opened. This
back-and-forth process happens as many times as is necessary for
all defects to be fixed.
Once all reviewers agree the review is complete and no de-
fects are still open, the review is complete and the author is then
allowed to check the changes into Perforce.
Code Collaborator automatically gathers key review metrics
such as man-hours spent in review and lines of code under
inspection. It is these metrics, combined with defect logs, that we
analyze below.
Code Review at Cisco Systems / 67
Thinning the herd
Some reviews in the sample set reflect special cases that we don’t
wish to analyze in general. There are two specific cases we want to
throw out of the analysis:
1. Reviews of enormous amounts of code. If many
thousands of lines of code were under review, we can
be sure this is not a true code review.
2. Trivial reviews. These are reviews in which clearly
the reviewer never looked at the code, or at least not
long enough for any real effect. For example, if the
entire review took two seconds, clearly no review ac-
tually took place.
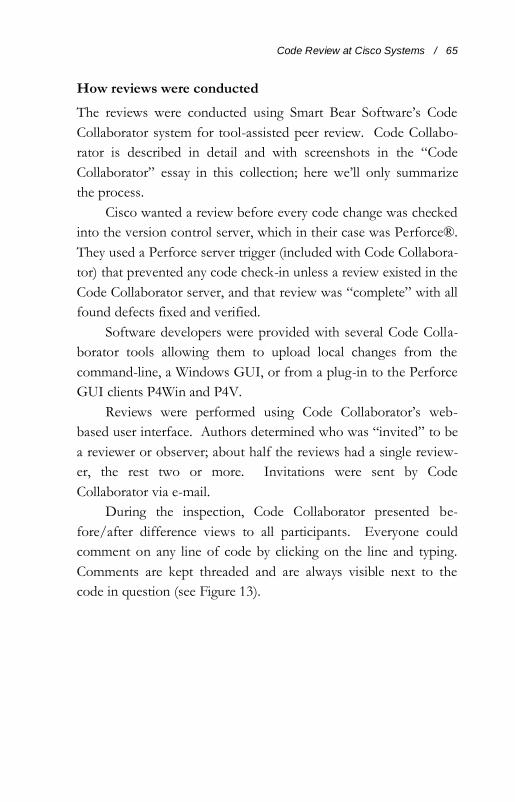
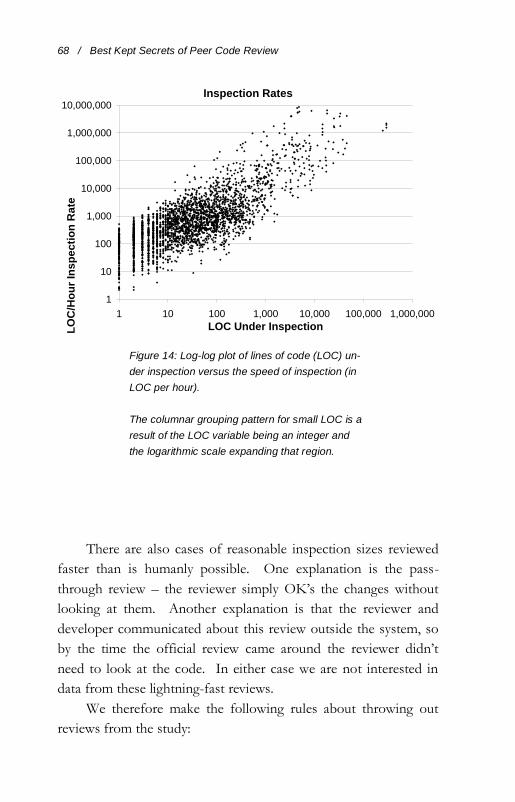
We can visualize these cases by considering a plot of “lines of
code under inspection” against “inspection rate in lines per hour.”
From the log-log chart in Figure 14 it is apparent that there are
aberrant data points for both enormous LOC and enormous
inspection rates.
There are some clear cut-off points for rejecting samples giv-
en the data in Figure 14. For example, a 10,000 line-per-hour
inspection rate implies the reviewer can read and understand
source code at a rate of three lines per second. As another
example, a single review of 10,000 lines of code isn’t possible. It is
also apparent that the majority of reviews appear in much more
reasonable ranges.
There are several explanations for these outliers. Because re-
view was required before version control check-in, large un-
reviewed changes will still pass through the system. This explains,
for example, the reviews of many tens of thousands of lines which
are reviewed too quickly to be careful inspections.
68 / Best Kept Secrets of Peer Code Review
Inspection Rates
1
10
100
1,000
10,000
100,000
1,000,000
10,000,000
1 10 100 1,000 10,000 100,000 1,000,000
LOC Under InspectionLO
C/H
ou
r In
sp
ec
tio
n R
ate
Figure 14: Log-log plot of lines of code (LOC) un-
der inspection versus the speed of inspection (in
LOC per hour).
The columnar grouping pattern for small LOC is a
result of the LOC variable being an integer and
the logarithmic scale expanding that region.
There are also cases of reasonable inspection sizes reviewed
faster than is humanly possible. One explanation is the pass-
through review – the reviewer simply OK’s the changes without
looking at them. Another explanation is that the reviewer and
developer communicated about this review outside the system, so
by the time the official review came around the reviewer didn’t
need to look at the code. In either case we are not interested in
data from these lightning-fast reviews.
We therefore make the following rules about throwing out
reviews from the study:
Code Review at Cisco Systems / 69
1. Throw out reviews whose total duration is shorter
than 30 seconds.
2. Throw out reviews where the inspection rate is great-
er than 1500 LOC/hour.
3. Throw out reviews where the number of lines under
review is greater than 2000.
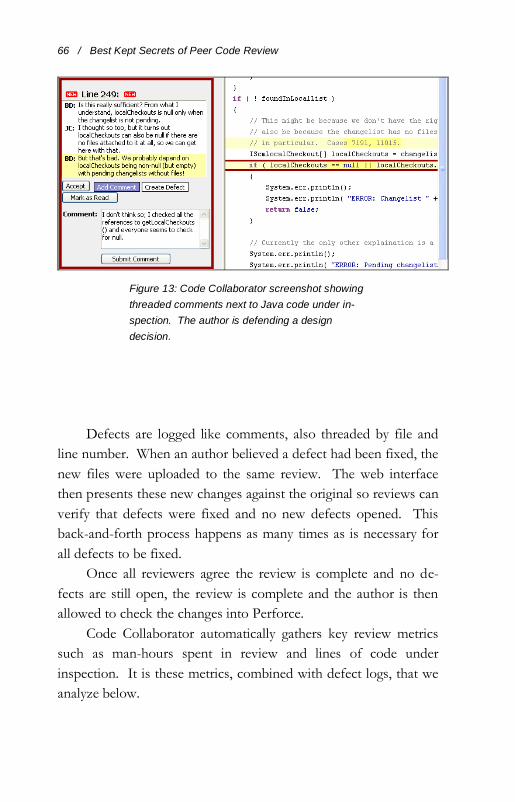
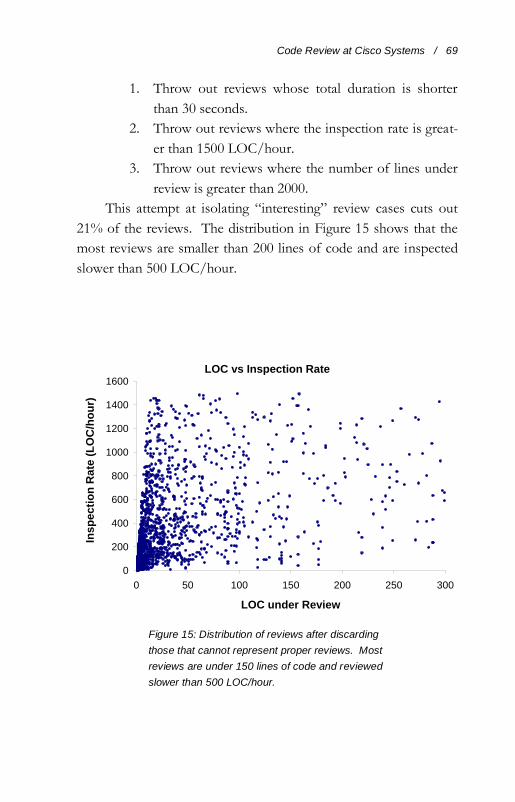
This attempt at isolating “interesting” review cases cuts out
21% of the reviews. The distribution in Figure 15 shows that the
most reviews are smaller than 200 lines of code and are inspected
slower than 500 LOC/hour.
LOC vs Inspection Rate
0
200
400
600
800
1000
1200
1400
1600
0 50 100 150 200 250 300
LOC under Review
Insp
ecti
on
Ra
te (
LO
C/h
ou
r)
Figure 15: Distribution of reviews after discarding
those that cannot represent proper reviews. Most
reviews are under 150 lines of code and reviewed
slower than 500 LOC/hour.
70 / Best Kept Secrets of Peer Code Review
Inspection Rate Analysis
How fast should code be reviewed? If you go too fast you’re liable
to miss defects. Industry experts say inspection rates should not
exceed 200 lines per hour if you want an effective review. Does
review rate differ by reviewer or author or the type of code under
inspection?
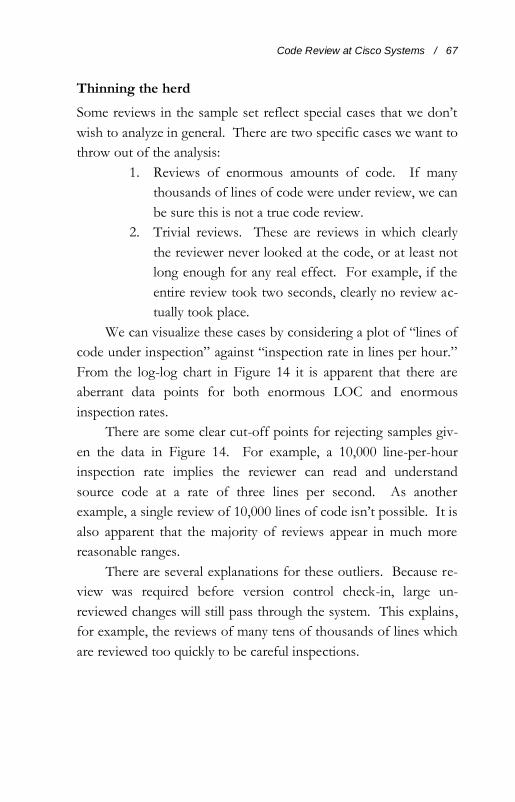
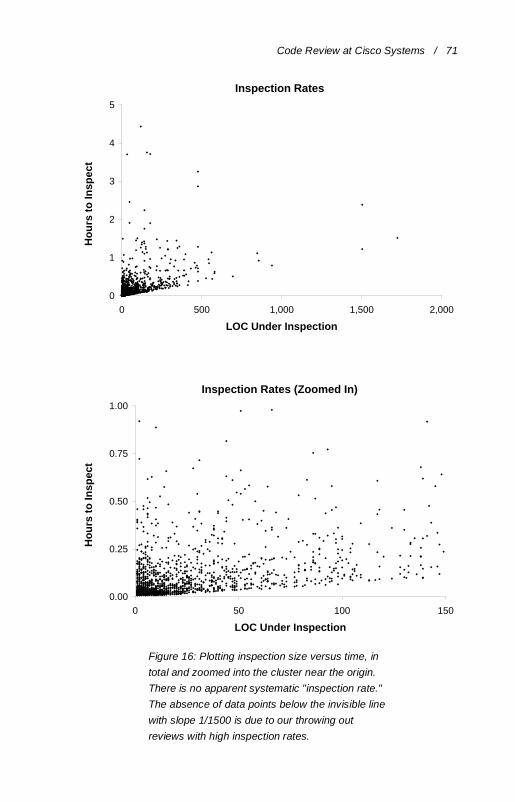
We might expect a relatively constant inspection rate. That is,
it should take twice as long to review 200 lines of code than it does
to review 100 lines of code. In general, if we plot code size versus
time-to-review, we expect the values to cluster around a line that
represents the average review rate. However, Figure 16 shows this
is not the case. No clustering around a common rate, not even
when we zoom in on the “cluster” of data with reviews under one
hour and under 200 lines.
Although this result is unexpected, it’s great news for our
analysis. It means that in this experiment review inspection rates
and sizes vary over a wide range of values, which means we have a
good sampling of data to use when answering questions like “Does
inspection rate or inspection size affect the number of defects
found?” or “What inspection rate makes the reviewer most
efficient at finding defects?”
Indeed, the next logical question is: “What are the factors that
determine the inspection rate?” Do detail-oriented reviewers
agonize over every line? Does the guy with empty Red Bull cans
all over his cubicle race through code? Do certain files or modules
take longer to review?
Code Review at Cisco Systems / 71
Inspection Rates
0
1
2
3
4
5
0 500 1,000 1,500 2,000
LOC Under Inspection
Ho
urs
to
In
sp
ec
t
Inspection Rates (Zoomed In)
0.00
0.25
0.50
0.75
1.00
0 50 100 150
LOC Under Inspection
Ho
urs
to
In
sp
ect
Figure 16: Plotting inspection size versus time, in
total and zoomed into the cluster near the origin.
There is no apparent systematic "inspection rate."
The absence of data points below the invisible line
with slope 1/1500 is due to our throwing out
reviews with high inspection rates.
72 / Best Kept Secrets of Peer Code Review
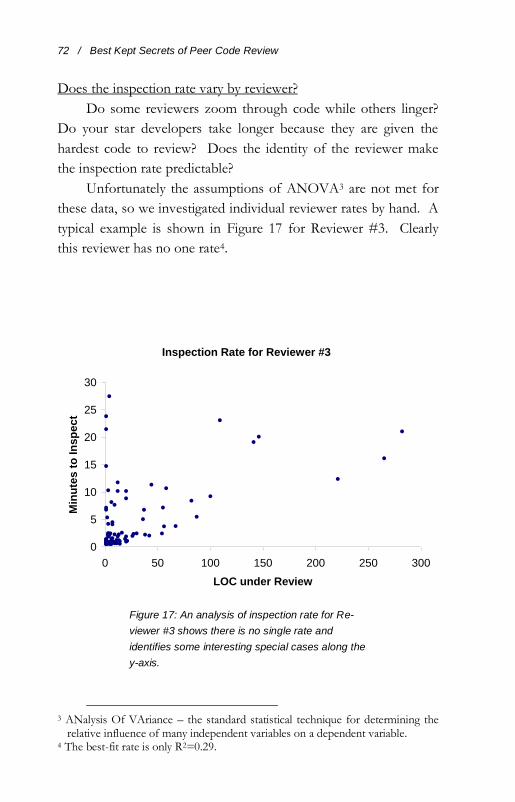
Does the inspection rate vary by reviewer?
Do some reviewers zoom through code while others linger?
Do your star developers take longer because they are given the
hardest code to review? Does the identity of the reviewer make
the inspection rate predictable?
Unfortunately the assumptions of ANOVA3 are not met for
these data, so we investigated individual reviewer rates by hand. A
typical example is shown in Figure 17 for Reviewer #3. Clearly
this reviewer has no one rate4.
Inspection Rate for Reviewer #3
0
5
10
15
20
25
30
0 50 100 150 200 250 300
LOC under Review
Min
ute
s t
o In
sp
ect
Figure 17: An analysis of inspection rate for Re-
viewer #3 shows there is no single rate and
identifies some interesting special cases along the
y-axis.
3 ANalysis Of VAriance – the standard statistical technique for determining the
relative influence of many independent variables on a dependent variable. 4 The best-fit rate is only R2=0.29.
Code Review at Cisco Systems / 73
We did notice something odd. There are four reviews of 1 or
2 lines of code that each took over 15 minutes to complete. The
other reviews that took that long had over 100 lines of code!
These might be aberrant, and removing aberrant data points might
give us a statistically significant inspection rate. So we took a
closer look.
Each of these outlier cases was explainable. In one case, a
separate review contained the real changes; the reviewer had simply
referred back to the first frequently while looking at the second. In
all other cases there was a lot of dialog between the reviewer and
the author or other reviewers. These code modifications, though
small in physical size, all seemed to have significant ramifications
for the rest of the system according to the comments.
So after close inspection it was clear that these data points
did belong in our data set. And this in turn means that there still is
not a clear inspection rate.
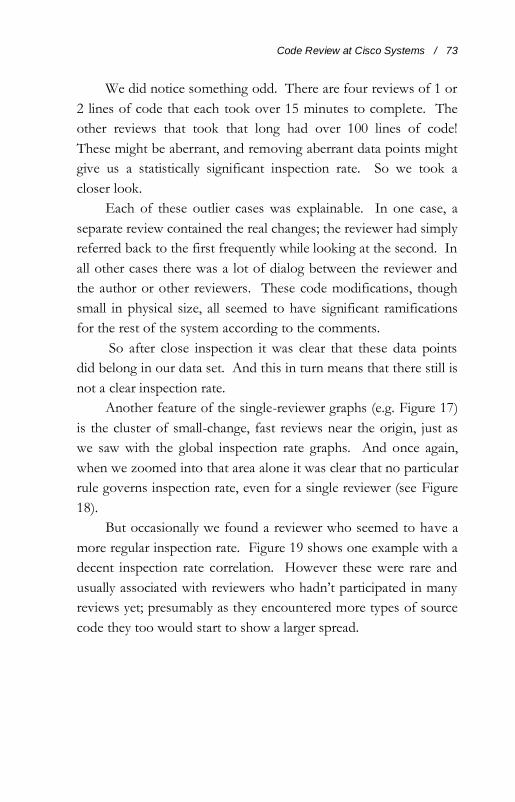
Another feature of the single-reviewer graphs (e.g. Figure 17)
is the cluster of small-change, fast reviews near the origin, just as
we saw with the global inspection rate graphs. And once again,
when we zoomed into that area alone it was clear that no particular
rule governs inspection rate, even for a single reviewer (see Figure
18).
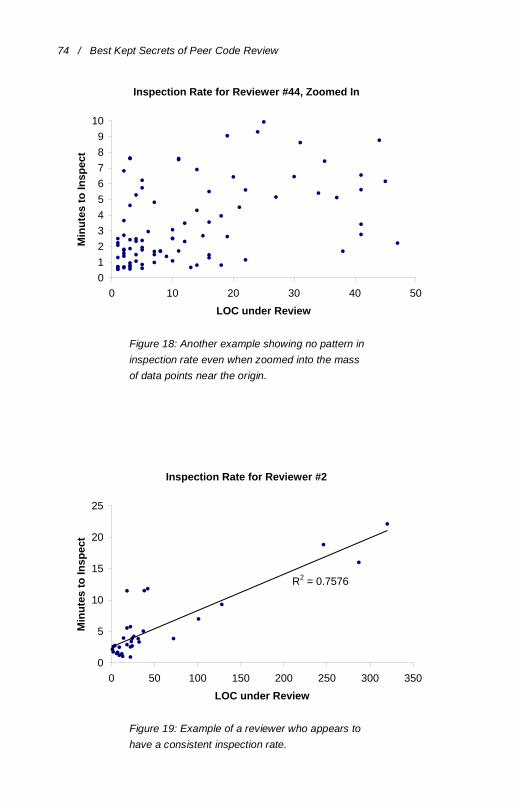
But occasionally we found a reviewer who seemed to have a
more regular inspection rate. Figure 19 shows one example with a
decent inspection rate correlation. However these were rare and
usually associated with reviewers who hadn’t participated in many
reviews yet; presumably as they encountered more types of source
code they too would start to show a larger spread.
74 / Best Kept Secrets of Peer Code Review
Inspection Rate for Reviewer #44, Zoomed In
0
1
2
3
4
5
6
7
8
9
10
0 10 20 30 40 50
LOC under Review
Min
ute
s t
o In
sp
ect
Figure 18: Another example showing no pattern in
inspection rate even when zoomed into the mass
of data points near the origin.
Inspection Rate for Reviewer #2
R2 = 0.7576
0
5
10
15
20
25
0 50 100 150 200 250 300 350
LOC under Review
Min
ute
s t
o In
sp
ect
Figure 19: Example of a reviewer who appears to
have a consistent inspection rate.
Code Review at Cisco Systems / 75
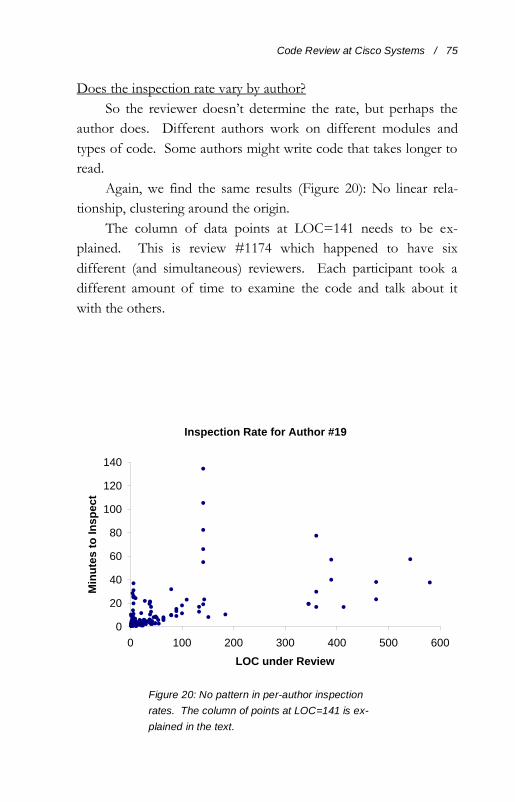
Does the inspection rate vary by author?
So the reviewer doesn’t determine the rate, but perhaps the
author does. Different authors work on different modules and
types of code. Some authors might write code that takes longer to
read.
Again, we find the same results (Figure 20): No linear rela-
tionship, clustering around the origin.
The column of data points at LOC=141 needs to be ex-
plained. This is review #1174 which happened to have six
different (and simultaneous) reviewers. Each participant took a
different amount of time to examine the code and talk about it
with the others.
Inspection Rate for Author #19
0
20
40
60
80
100
120
140
0 100 200 300 400 500 600
LOC under Review
Min
ute
s t
o In
sp
ect
Figure 20: No pattern in per-author inspection
rates. The column of points at LOC=141 is ex-
plained in the text.
76 / Best Kept Secrets of Peer Code Review
In fact, review #1174 constitutes additional evidence that in-
spection rate doesn’t depend on the reviewer. All six reviewers
were examining and chatting about a single review, yet the amount
of time spent during the review varied widely.
Conclusion for inspection rate
We found no metric that correlated significantly with inspec-
tion rate. It is clear that many factors combine to determine the
speed at which a reviewer will scan a set of code changes.
But none of this means all these reviews were equally effec-
tive or efficient at finding defects. The literature suggests that slow
inspections uncover more defects. But before we can explore
review effectiveness we first need to decide what constitutes a
“defect.”
Counting Defects
What is a “defect?” Before we get into defect rate and density
analysis we need to define exactly what a “defect” means and how
we will identify defects in our sample data here.
Although the word “defect” has an inherent negative conno-
tation, in code review it is defined in this way:
When a reviewer or consensus of reviewers determines that code must be
changed before it is acceptable, it is a “defect.” If the algorithm is wrong,
it’s a defect. If the code is right but unintelligible due to poor
documentation, it’s a defect. If the code is right but there’s a
better way to do it, it’s a defect. A simple conversation is not a
defect nor is a conversation where a reviewer believed he found a
defect but later agreed that it wasn’t one. In any event a defect is
an improvement to the code that would not have occurred without
review.
Counting defects in Code Collaborator should be easy in
theory because the software includes a built-in defect logging
system that not only logs defects against files and line numbers but
Code Review at Cisco Systems / 77
also allows for a selection of severity and type. Unfortunately this
theory does not apply with this data.
In particular, reviewers and authors are free to communicate
the existence of a defect without creating a proper defect record in
the database. Furthermore, with earlier versions of the software
the workflow surrounding defects was confusing, so the path of
least resistance was to talk about defects but not necessarily to
open them.
Therefore we cannot just use the defect data from the data-
base as a true measure of defects. Instead we took a random
sample of 300 reviews and studied the conversations in each one
to measure the number of true defects as defined above.
Defect Density Analysis
Almost all code review process analysts want to measure “defect
density,” meaning the number of defects found per 1000 lines of
code. This number is often associated with review “effectiveness”
in that a more effective review will uncover more defects per line
of code compared with a cursory review. In a predictive capacity,
the density number allows us to answer questions like “How many
defects will we expect code review to uncover in 10,000 lines of
code?”
Our reviews had an average 32 defects per 1000 lines of code.
61% of the reviews uncovered no defects; of the others the defect
density ranged evenly between 10 and 130 defects per kLOC.
Defect density and review size
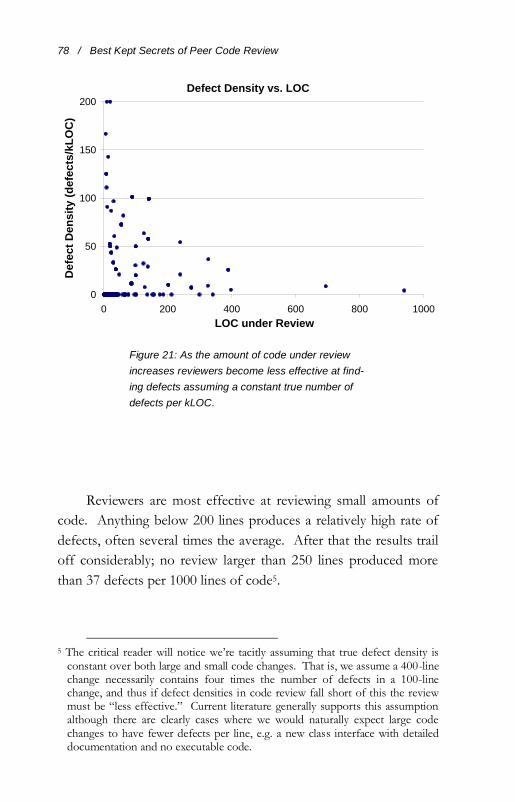
The relationship between defect density and the amount of
code under review is made clear by Figure 21.
78 / Best Kept Secrets of Peer Code Review
Defect Density vs. LOC
0
50
100
150
200
0 200 400 600 800 1000
LOC under Review
De
fect
Den
sit
y (
defe
cts
/kL
OC
)
Figure 21: As the amount of code under review
increases reviewers become less effective at find-
ing defects assuming a constant true number of
defects per kLOC.
Reviewers are most effective at reviewing small amounts of
code. Anything below 200 lines produces a relatively high rate of
defects, often several times the average. After that the results trail
off considerably; no review larger than 250 lines produced more
than 37 defects per 1000 lines of code5.
5 The critical reader will notice we’re tacitly assuming that true defect density is
constant over both large and small code changes. That is, we assume a 400-line change necessarily contains four times the number of defects in a 100-line change, and thus if defect densities in code review fall short of this the review must be “less effective.” Current literature generally supports this assumption although there are clearly cases where we would naturally expect large code changes to have fewer defects per line, e.g. a new class interface with detailed documentation and no executable code.
Code Review at Cisco Systems / 79
These results are not surprising. If the reviewer is over-
whelmed with a large quantity of code he won’t give the same
attention to every line as he might with a small change. He won’t
be able to explore all the ramifications of the change in a single
sitting.
Another explanation comes from the well-established fact
that after 60 minutes reviewers “wear out” and stop finding
additional defects6. Given this, a reviewer will probably not be
able to review more than 300-400 lines of code before his perfor-
mance drops.
But this hypothesis is more directly measurable by consider-
ing the inspection rate.
Defect density and inspection rate
It makes sense that reviewers hurried through a review won’t
find as many defects. A fast inspection rate might mean the
reviewer didn’t take enough time, or it could mean the reviewer
couldn’t give enough time for the large quantity of code under
review.
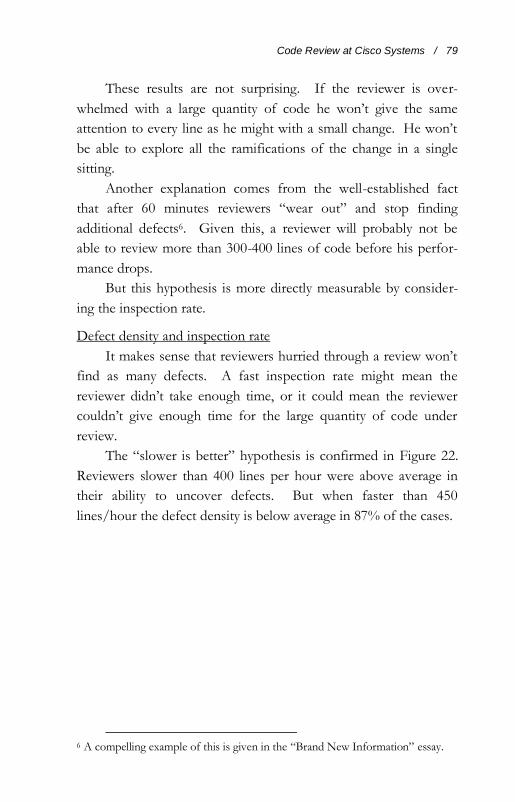
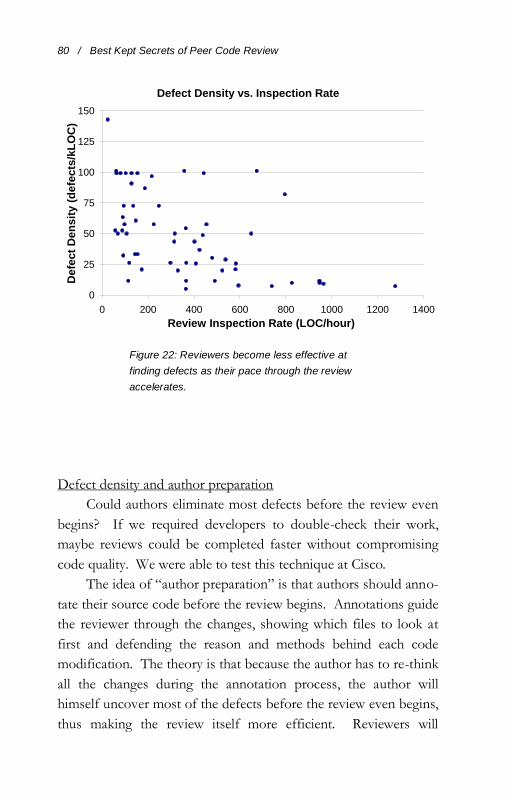
The “slower is better” hypothesis is confirmed in Figure 22.
Reviewers slower than 400 lines per hour were above average in
their ability to uncover defects. But when faster than 450
lines/hour the defect density is below average in 87% of the cases.
6 A compelling example of this is given in the “Brand New Information” essay.
80 / Best Kept Secrets of Peer Code Review
Defect Density vs. Inspection Rate
0
25
50
75
100
125
150
0 200 400 600 800 1000 1200 1400
Review Inspection Rate (LOC/hour)
De
fect
Den
sit
y (
defe
cts
/kL
OC
)
Figure 22: Reviewers become less effective at
finding defects as their pace through the review
accelerates.
Defect density and author preparation
Could authors eliminate most defects before the review even
begins? If we required developers to double-check their work,
maybe reviews could be completed faster without compromising
code quality. We were able to test this technique at Cisco.
The idea of “author preparation” is that authors should anno-
tate their source code before the review begins. Annotations guide
the reviewer through the changes, showing which files to look at
first and defending the reason and methods behind each code
modification. The theory is that because the author has to re-think
all the changes during the annotation process, the author will
himself uncover most of the defects before the review even begins,
thus making the review itself more efficient. Reviewers will
Code Review at Cisco Systems / 81
uncover problems the author truly would not have thought of
otherwise.
If author preparation has a real effect it will be to reduce the
number of defects found during the inspection. This means a lower
defect density because in theory the author has already removed most
of the defects.
So we tested the hypothesis: “Reviews with author prepara-
tion have smaller defect densities compared to reviews without.”
It is easy to detect “author preparation” in our data because we
record every comment, threaded by file and line of code. Without
author preparation, conversations are typically started by a
reviewer or observer and often answered by the author. Author
preparation is signified by the author kicking off the conversation.
In our manual scan of reviews we found almost no cases where the
author started the conversation and yet wasn’t prepping the
reviewer.
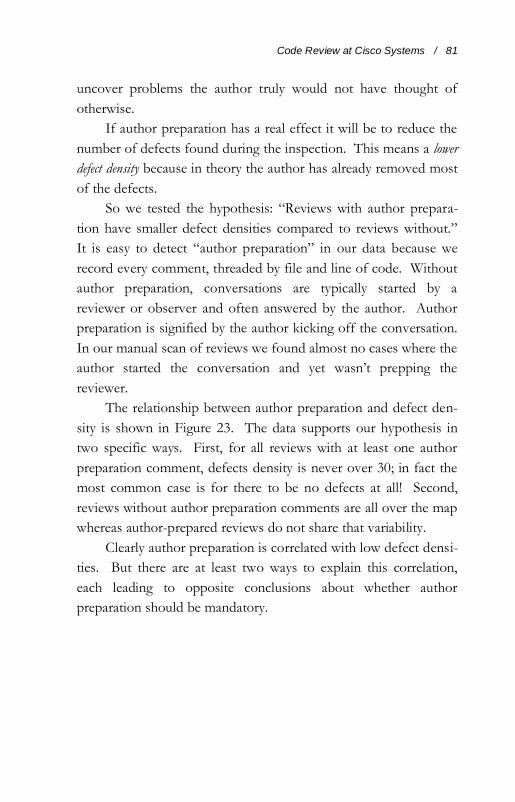
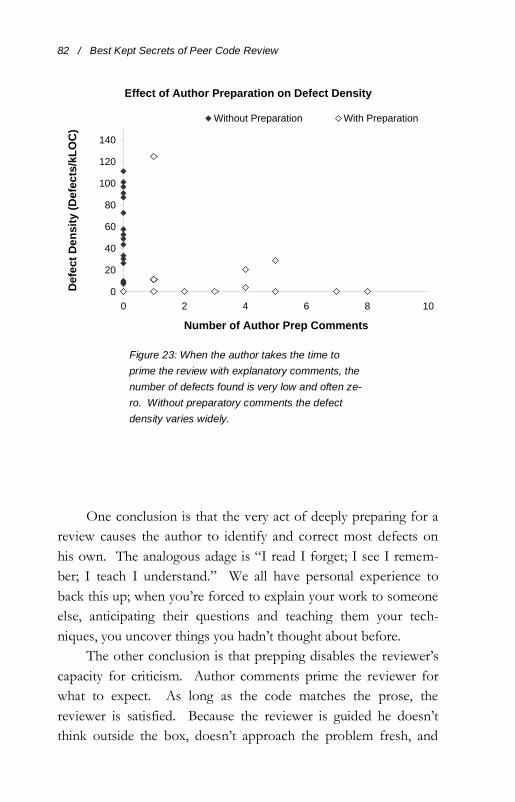
The relationship between author preparation and defect den-
sity is shown in Figure 23. The data supports our hypothesis in
two specific ways. First, for all reviews with at least one author
preparation comment, defects density is never over 30; in fact the
most common case is for there to be no defects at all! Second,
reviews without author preparation comments are all over the map
whereas author-prepared reviews do not share that variability.
Clearly author preparation is correlated with low defect densi-
ties. But there are at least two ways to explain this correlation,
each leading to opposite conclusions about whether author
preparation should be mandatory.
82 / Best Kept Secrets of Peer Code Review
Effect of Author Preparation on Defect Density
0
20
40
60
80
100
120
140
0 2 4 6 8 10
Number of Author Prep Comments
De
fect
Den
sit
y (
Defe
cts
/kL
OC
)
Without Preparation With Preparation
Figure 23: When the author takes the time to
prime the review with explanatory comments, the
number of defects found is very low and often ze-
ro. Without preparatory comments the defect
density varies widely.
One conclusion is that the very act of deeply preparing for a
review causes the author to identify and correct most defects on
his own. The analogous adage is “I read I forget; I see I remem-
ber; I teach I understand.” We all have personal experience to
back this up; when you’re forced to explain your work to someone
else, anticipating their questions and teaching them your tech-
niques, you uncover things you hadn’t thought about before.
The other conclusion is that prepping disables the reviewer’s
capacity for criticism. Author comments prime the reviewer for
what to expect. As long as the code matches the prose, the
reviewer is satisfied. Because the reviewer is guided he doesn’t
think outside the box, doesn’t approach the problem fresh, and
Code Review at Cisco Systems / 83
doesn’t bring new insight to the problem. The reason defect
density is low for an author-prepared review is not because the
author pre-fixed defects, but rather because the reviewers aren’t
looking hard enough.
We believe the first conclusion is more tenable. A survey of
the reviews in question show the author is being conscientious,
careful, and helpful, and not misleading the reviewer. Often the
reviewer will respond or ask a question or open a conversation on
another line of code, demonstrating that he was not dulled by the
author’s annotations.
Indeed, we believe these preparation comments belie a fun-
damental personal development philosophy of attention to detail,
consideration of consequences, and general experience. That is,
we believe the developers who are naturally meticulous will exhibit
this in the form of preparation – it’s just another way of expressing
their cautious approach. Even with developers who are not
naturally this way, we believe that requiring preparation will cause
anyone to be more careful, rethink their logic, and write better
code overall.
Defect Rate Analysis
Where defect density measures a review’s effectiveness, defect rate
– defects per hour – measures a review’s efficiency. It answers the
question, “How fast do we uncover defects?”
The overall defect rate was 13 defects per hour with 85% of
the reviews slower than 25 defects per hour.
With defect density we determined that large reviews resulted
in ineffective reviews. Will a large review also have a detrimental
effect on defect rate?
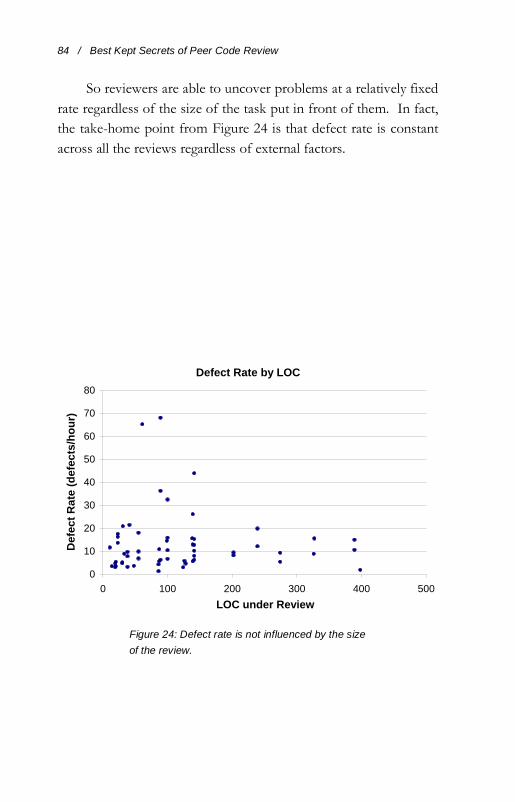
From Figure 24 it is clear that review size does not affect the
defect rate. Although the smaller reviews afforded a few especially
high rates, 94% of all reviews had a defect rate under 20 defects
per hour regardless of review size.
84 / Best Kept Secrets of Peer Code Review
So reviewers are able to uncover problems at a relatively fixed
rate regardless of the size of the task put in front of them. In fact,
the take-home point from Figure 24 is that defect rate is constant
across all the reviews regardless of external factors.
Defect Rate by LOC
0
10
20
30
40
50
60
70
80
0 100 200 300 400 500
LOC under Review
Defe
ct
Rate
(d
efe
cts
/ho
ur)
Figure 24: Defect rate is not influenced by the size
of the review.
Code Review at Cisco Systems / 85
Conclusions
We believe our results allow us to conclude the following:
LOC under review should be under 200, not to exceed
400. Anything larger overwhelms reviewers and defects
are not uncovered.
Inspection rates less than 300 LOC/hour result in best
defect detection. Rates under 500 are still good; expect to
miss significant percentage of defects if faster than that.
Authors who prepare the review with annotations and
explanations have far fewer defects than those that do not.
We presume the cause to be that authors are forced to
self-review the code.
Total review time should be less than 60 minutes, not to
exceed 90. Defect detection rates plummet after that time.
Expect defect rates around 15 per hour. Can be higher
only with less than 175 LOC under review.
Left to their own devices, reviewers’ inspection rate will
vary widely, even with similar authors, reviewers, files, and
size of the review.
Given these factors, the single best piece of advice we can
give is to review between 100 and 300 lines of code at a time and
spend 30-60 minutes to review it.
Smaller changes can take less time, but always spend at least 5
minutes, even on a single line of code7.
Lightweight vs. Heavyweight
How do our results compare with those from heavyweight formal
inspections? Were our lightweight inspections less effective at
uncovering defects? Did they really take less time?
7 We saw many reviews where a change to a single line of code had ramifications
throughout the system.
86 / Best Kept Secrets of Peer Code Review
Some of our results exactly match those from established lite-
rature. It is well-established that total review time should be under
90 minutes and that slower inspections yield more defects.
Other results are quite different. Across four of the studies of
heavyweight inspections given in the previous essay the average
defect detection rate was 2.6 defects per hour8; our reviews were
seven times faster. This is to be expected since our reviews didn’t
include two-hour inspection meetings with 3-5 participants.
However the critical reader will point out that faster is only
better if the same number of defects were uncovered than would
have been under a formal inspection process. Unfortunately
because this was a study in situ and not in a laboratory, we don’t
know how each of these reviews would have fared with a different
process. We can point to the work of Votta and others from the
previous essay for evidence that the lack of inspection meetings
did not significantly decrease the number of reported defects, but
we would have preferred to compare trials of the same code
reviewed in both ways9.
In light of these other studies, we conclude that lightweight
review using Code Collaborator is probably just as effective and
definitely more time-efficient than heavyweight formal inspections.
This is not to say that formal inspections don’t have a place in
the software development process. Many of our other Code
Collaborator customers perform formal inspections instead of or
on top of lightweight reviews. But heavyweight process takes too
much time to be practical with many code changes; here the
lightweight process provides measurable, respectable results fast
8 0.69 from Blakely 1991, 5.45 from Dunsmore 2000, 1.31 from Conradi 2003,
and 3.06 from Kelly 2003. 9 We cannot give a single number for “expected defect density” for formal
inspection because studies differ widely on this point. For example, Blakely 1991 found 105 defects per kLOC where Laitenberger 1999 found 7 and Kelly 2003 only 0.27!
Code Review at Cisco Systems / 87
enough to be realistically applied during almost every part of the
application development lifecycle.
Future Study
We would like to compare heavyweight and lightweight reviews on
the same set of code. We would like to experiment with specific
rules of review to see how we might improve defect density or
defect rate numbers. Would an enforced minimum inspection-
time rule increase defect densities? Would enforcing author
preparation comments result in more defects detected in less time?
Would reviewer-training result in better defect detection? Would a
per-file-type or per-author checklist improve defect detection?
We are currently looking for development groups who would
like to participate in future studies where some of these conclu-
sions can be tested directly.
Check with the Smart Bear website for new studies, and
please let us know if you would like to participate in one yourself.