Embed Size (px)
Citation preview
Coherent electro-optical detection ofterahertz radiation from an optical
parametric oscillator
F. Z. Meng1∗, M. D. Thomson1, D. Molter2, T. Löffler1, J. Jonuscheit2,R. Beigang2, J. Bartschke3, T. Bauer3, M. Nittmann3, and H. G.
Roskos1
1Johann Wolfgang Goethe-Universität, Physikalisches Institut, Max-von-Laue-Str. 1, D-60438Frankfurt, Germany
2Fraunhofer Institute for Physical Measurement Techniques IPM, Department of TerahertzMeasurement and Systems, Erwin-Schroedinger-Str., Building 56, 67663 Kaiserslautern,
Germany3Xiton Photonics GmbH, Kohlenhofstraße 10, D-67663 Kaiserslautern, Germany
Abstract: We report the realization of coherent electro-optical detectionof nanosecond terahertz (THz) pulses from an optical parametric oscillator,which is pumped by a Q-switched nanosecond Nd:YVO4 laser at 1064 nmand emits at ∼ 1.5 THz. The beam profile and wavefront of the THz beamat focus are electro-optically characterized toward the realization of areal-time THz camera. A peak dynamic range of ∼ 37 dB/
√Hz is achieved
with single-pixel detection.
© 2010 Optical Society of America
OCIS codes: (230.5170) Photodiodes; (160.2100) Electro-optical materials; (110.6795) Tera-hertz imaging; (110.4280) Noise in imaging systems.
References and links1. D. M. Mittleman, M. Gupta, R. Neelamani, R. G. Baraniuk, J. V. Rudd, and M. Koch, “Recent advances in
terahertz imaging,” Appl. Phys. B 68, 1085–1094 (1999).2. W. L. Chan, J. Deibel, and D. M. Mittleman, “Imaging with terahertz radiation,” Rep. Prog. Phys. 70, 1325–1379
(2007).3. B. B. Hu and M. C. Nuss, “Imaging with terahertz waves,” Opt. Lett. 20, 1716–1718 (1995).4. C. Baker, T. Lo, W. R. Tribe, B. E. Cole, M. R. Hogbin, and M. C. Kemp, “Detection of concealed explosives at
a distance using terahertz technology,” Proc. IEEE 95, 1559–1565 (2007).5. T. Löffler, T. May, C. am Weg, A. Alcin, B. Hils, and H. G. Roskos, “Continuous-wave terahertz imaging with a
hybrid system,” Appl. Phys. Lett. 90, 091111 (2007).6. A. Lisauskas, W. von Spiegel, S. B. Tombet, A. E. Fatimy, D. Coquillat, F. Teppe, N. Dyakonova, W. Knap, and
H. G. Roskos, “Terahertz imaging with GaAs field-effect transistors,” Electron. Lett. 44, 408–409 (2008).7. P. C. M. Planken and H. J. Bakker, “Towards time-resolved THz imaging,” Appl. Phys. A 78, 465–469 (2004).8. M. J. Khan, J. C. Chen, and S. Kaushik, “Optical detection of terahertz using nonlinear parametric upconversion,”
Opt. Lett. 33, 2725–2727 (2008).9. Q. Wu, T. D. Hewitt, and X. C. Zhang, “Two-dimensional electro-optic imaging of THz beams,” Appl. Phys.
Lett. 69, 1026–1028 (1996).10. X. C. Zhang, “Three-dimensional terahertz wave imaging,” Phil. Trans. R. Soc. Lond. A 362, 283–299 (2004).11. Z. Jiang and X. C. Zhang, “Terahertz imaging via electrooptic effect,” IEEE Trans. Microwave Theory Tech. 47,
2644–2650 (1999).12. T. Yasuda, Y. Kawada, H. Toyoda, and H. Takahashi, “Terahertz movies of internal transmission images,” Opt.
Express 15, 15583–15588 (2007).13. J. Shikata, M. Sato, T. Taniuchi, H. Ito, and K. Kawase, “Enhancement of terahertz-wave output from LiNbO3
optical parametric oscillators by cryogenic cooling,” Opt. Lett. 24, 202–204 (1999).
#125975 - $15.00 USD Received 25 Mar 2010; revised 26 Apr 2010; accepted 26 Apr 2010; published 13 May 2010(C) 2010 OSA 24 May 2010 / Vol. 18, No. 11 / OPTICS EXPRESS 11316

14. K. Kawase, J. Shikata, and H. Ito, “Terahertz wave parametric source,” J. Phys. D: Appl. Phys. 35, R1–R14(2002).
15. K. Kawase, Y. Ogawa, H. Minamide, and H. Ito, “Terahertz parametric sources and imaging applications,” Semi-cond. Sci. Technol. 20, S258–S265 (2005).
16. T. D. Wang, Y. Y. Lin, S. Y. Chen, A. C. Chiang, S. T. Lin, and Y. C. Huang, “Low-threshold, narrow-lineTHz-wave parametric oscillator with an intra-cavity grazing-incidence grating,” Opt. Express 16, 12571–12576(2008).
17. D. Molter, M. Theuer, and R. Beigang, “Nanosecond terahertz optical parametric oscillator with a novel quasiphase matching scheme in lithium niobate,” Opt. Express 17, 6623–6628 (2009).
18. R. Guo, S. Ohno, H. Minamide, T. Ikari, and H. Ito, “Highly sensitive coherent detection of terahertz waves atroom temperature using a parametric process,” Appl. Phys. Lett. 93, 021106 (2008).
19. Y. J. Ding and W. Shi, “Efficient THz generation and frequency upconversion in GaP crystals,” Solid StateElectron. 50, 1128–1136 (2006).
20. K. J. Siebert, H. Quast, R. Leonhardt, T. Löffler, M. Thomson, T. Bauer, H. G. Roskos, and S. Czasch,“Continuous-wave all-optoelectronic terahertz imaging,” Appl. Phys. Lett. 80, 3003–3005 (2002).
21. T. Bauer, J. S. Kolb, T. Löffler, E. Mohler, H. G. Roskos, and U. C. Pernisz, “Indium-tin-oxide-coated glass asdichroic mirror for far-infrared electromagnetic radiation,” J. Appl. Phys. 92, 2210–2212 (2002).
22. T. Hattori, K. Ohta, R. Rungsawang, and K. Tukamoto, “Phase-sensitive high-speed THz imaging,” J. Phys. D:Appl. Phys. 37, 770–773 (2004).
23. T. Hattori and M. Sakamoto, “Deformation corrected real-time terahertz imaging,” Appl. Phys. Lett. 90, 261106(2007).
24. Z. Jiang, F. G. Sun, Q. Chen, and X. C. Zhang, “Electro-optic sampling near zero optical transmission point,”Appl. Phys. Lett. 74, 1191–1193 (1999).
25. F. Meng, M. D. Thomson, V. Blank, W. von Spiegel, T. Löffler, and H. G. Roskos, “Characterizing large-areaelectro-optic crystals toward two-dimensional real-time terahertz imaging,” Appl. Opt. 48, 5197–5204 (2009).
26. Q. Wu and X.-C. Zhang, “Ultrafast electro-optic field sensors,” Appl. Phys. Lett. 68, 1604–1606 (1996).27. C. Winnewisser, P. U. Jepsen, M. Schall, V. Schyja, and H. Helm, “Electro-optic detection of THz radiation in
LiTaO3, LiNbO3 and ZnTe,” Appl. Phys. Lett. 70, 3069–3071 (1997).28. H. W. Kogelnik, E. P. Ippen, A. Dienes, and C. V. Shank, “Astigmatically compensated cavities for CW dye
lasers,” IEEE J. Quantum Electron. QE-8, 373–379 (1972).
1. Introduction
THz radiation in the frequency range of ∼0.1 - 3 THz is non-ionizing, harmless to biologicaltissue, and has the special property of penetrating various materials which are opaque in thevisible spectral range, such as paper, cardboard, ceramics, wood, textiles, and plastics. Thismakes it useful in many industrial and security applications, including non-destructive inspec-tion of sealed post packages, identification of defects in plastic pipes, security inspection ofhuman bodies at airports, and distinguishing diseased skin tissue [1–4]. Many THz imagingsystems have been developed for such applications. Most of them obtain the image by rasterscanning of the objects with a focused THz beam [5–7]. Although a high dynamic range canbe achieved [8], such measurement schemes are generally time-consuming. There are also THzimaging systems that can acquire simultaneously two-dimensional THz images by coherentelectro-optical (EO) detection of THz radiation with a CCD camera in femtosecond-laser-basedsystems [9–12]. However, such systems usually need an amplifier laser which is relatively ex-pensive and delicate. One type of narrow-band THz source, – i.e. the THz optical parametricoscillator (OPO) pumped by a nanosecond (ns) laser at 1064 nm and using LiNbO3 as thegain medium – should be a good candidate for making up the shortcomings of the foremen-tioned systems. THz OPOs, which ordinarily employ Q-switched YAG or Nd:YVO4 lasers thatare relatively cheap and are avaliable with industry-grade design for use in harsh environments,have been developed by several groups [13–17]. Among the reported applications of THz OPOs– for instance imaging and spectroscopy [14, 15] – incoherent intensity detection (e.g. using aSi-bolometer or pyro-electric detector) is the most popular method. Although there have beenreports [18, 19] of coherent detection of ns-THz pulses, using a parametric optical process, therequirements of an intense near-IR pump beam and a long nonlinear crystal allow this methodto work in a single-pixel regime only. In this paper, we report the realization of EO detection of
#125975 - $15.00 USD Received 25 Mar 2010; revised 26 Apr 2010; accepted 26 Apr 2010; published 13 May 2010(C) 2010 OSA 24 May 2010 / Vol. 18, No. 11 / OPTICS EXPRESS 11317
60 mm
cylindrical
lens
Polarizer
Beam sampler
Delay stage
Ge phtotodetector
PD2
Quarter-wave plate
PolarizerGe photodetector
PD1
ITO glass
CdTe
Single-mode fiber
Chopper
Nd:YVO4
laser A
B A-B
Chopper
controller
Lock-in amplifier
f = 120 mm
Seed
laser
Ref
THz
OPO
f = 127 mm
f = 127 mm
F1
F2
F3
M1
(a)
(b)
(c)
d
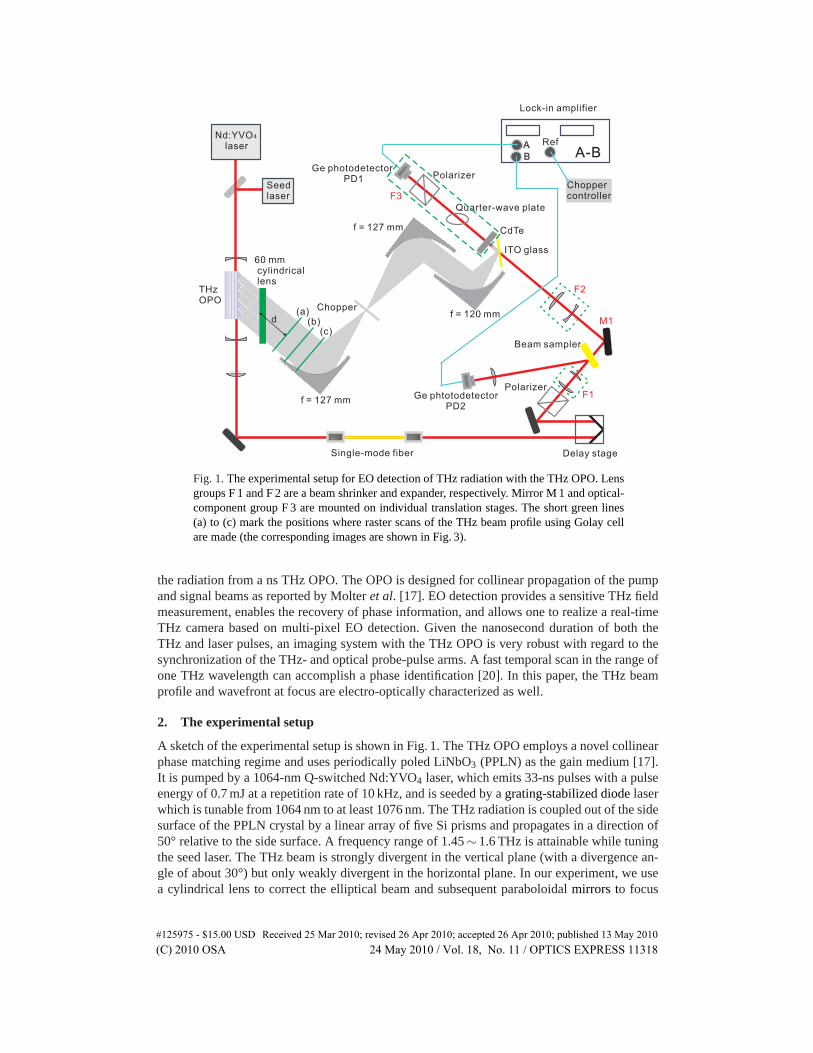
Fig. 1. The experimental setup for EO detection of THz radiation with the THz OPO. Lensgroups F 1 and F 2 are a beam shrinker and expander, respectively. Mirror M 1 and optical-component group F 3 are mounted on individual translation stages. The short green lines(a) to (c) mark the positions where raster scans of the THz beam profile using Golay cellare made (the corresponding images are shown in Fig. 3).
the radiation from a ns THz OPO. The OPO is designed for collinear propagation of the pumpand signal beams as reported by Molter et al. [17]. EO detection provides a sensitive THz fieldmeasurement, enables the recovery of phase information, and allows one to realize a real-timeTHz camera based on multi-pixel EO detection. Given the nanosecond duration of both theTHz and laser pulses, an imaging system with the THz OPO is very robust with regard to thesynchronization of the THz- and optical probe-pulse arms. A fast temporal scan in the range ofone THz wavelength can accomplish a phase identification [20]. In this paper, the THz beamprofile and wavefront at focus are electro-optically characterized as well.
2. The experimental setup
A sketch of the experimental setup is shown in Fig. 1. The THz OPO employs a novel collinearphase matching regime and uses periodically poled LiNbO3 (PPLN) as the gain medium [17].It is pumped by a 1064-nm Q-switched Nd:YVO4 laser, which emits 33-ns pulses with a pulseenergy of 0.7 mJ at a repetition rate of 10 kHz, and is seeded by a grating-stabilized diode laserwhich is tunable from 1064 nm to at least 1076 nm. The THz radiation is coupled out of the sidesurface of the PPLN crystal by a linear array of five Si prisms and propagates in a direction of50° relative to the side surface. A frequency range of 1.45∼ 1.6 THz is attainable while tuningthe seed laser. The THz beam is strongly divergent in the vertical plane (with a divergence an-gle of about 30°) but only weakly divergent in the horizontal plane. In our experiment, we usea cylindrical lens to correct the elliptical beam and subsequent paraboloidal mirrors to focus
#125975 - $15.00 USD Received 25 Mar 2010; revised 26 Apr 2010; accepted 26 Apr 2010; published 13 May 2010(C) 2010 OSA 24 May 2010 / Vol. 18, No. 11 / OPTICS EXPRESS 11318
the THz beam as tightly as possible. As shown in Fig. 1, we first put the cylindrical polyethy-lene (PE) lens (focus length f = 60 mm) 30 mm away from, and parallel to, the side surface ofthe PPLN crystal to collect and collimate the THz beam. Several designs for the cylindricallens were tested to achieve a fairly circular transmitted beam with low aberrations. Subsequentparaboloidal mirrors are used to image the beam to the EO detection stage, via an intermediatefocus. A mechanical chopper is used at this intermediate focal position to modulate the beamfor lock-in detection. The THz beam is then collimated and re-focused onto the EO crystal[1-mm-thick CdTe (110)]. In front of the EO crystal, the THz and laser beams are combinedcollinearly with the aid of a piece of ITO-coated glass [21]. The invisibility of the THz radia-tion and the lack of visible or NIR radiation copropagating with the emitted THz beam makesthe alignment of the THz optics less straightforward than in other optoelectronic THz systems.The correct alignment of these optics is important in order to minimize beam aberrations (suchas astigmatism) which degrade the wavefront and focusability of the THz beam. In order tooptimize the alignment (in particular, for the cylindrical lens), we employed a thorough proce-dure where the resultant THz beam profile was monitored using raster-scan measurements witha Golay cell. Representative THz beam profiles following this optimization procedure will bepresented in Sec. 3.4.
The THz OPO has a pump-enhancement cavity [17], which is an effective solution ofbuilding an oscillator for the signal laser while maintaining an efficient input coupling for thepump laser, with a simple linear cavity instead of employing a non-collinear-propagation phasematching configuration [13–16]. The IR laser pulse coming out of the OPO is a mixture of thestrongly depleted pump laser pulse, the generated signal laser pulse, and some other additionalmixing products with negligible power [17]. The total output power is about 250 mW. Hereinthe power of the pump laser is about 5 times that of the signal laser. For EO detection, onerequires both pump and signal laser beams, whose temporal intensity modulation is coherentwith the THz field. Although the signal laser pulse is generated from the pump laser pulse, theirbeams might not completely overlap spatially. In order to ensure optimal overlap, to removeany phase-front distortions, and to achieve a pure fundamental-lateral-mode beam profile, thetwo laser beams are guided through a short section of single-mode fibre (length 30 cm), beforereaching the delay stage and EO detector. A coupling efficiency of 25 % can be achieved witha single-lens fibre input coupler (focal length 15.3 mm, numerical aperture 0.16). Temporally,the pulses of the two lasers are partially overlapped, as shown in Fig. 2. The impact of this onthe EO detection will be discussed in detail in Sec. 3.3.
For the EO detector, a crossed-polarizer-type configuration is used, in which a quarter-waveplate works as the compensator [22–24]. This configuration will make the transition to multi-pixel detection straightforward. The lens groups F 1 and F 2 are a beam shrinker and expander,respectively. A collimated optical beam with a spot diameter smaller than 1 mm can be obtainedwith F 1, and a spot diameter of about 12 mm can be obtained with F 2. The second polarizer isin a rotational orientation close to that with maximal modulation depth for the EO signal [24].
For EO detection, relatively slow Ge photodiodes (Thorlabs, model no. PDA25K-EC, 8.75-μs rise time; 40-kHz bandwidth) are used to avoid saturation of the detection electronics. Forreducing the noise due to laser fluctuations and improving the signal-to-noise ratio (SNR), weuse two photodiodes and perform differential detection with the lock-in amplifier. One photo-diode (PD1) is fed with the laser beam going through the crossed-polarizer detector. Anotherphotodiode (PD2) is fed by a small fraction (10 %) of the laser beam split off the main beambefore the EO crystal and behind the first polarizer (see Fig. 1). In the measurement, the domi-nating noise source is still due to laser fluctuations (which are well above the shot noise level).In order to reduce their impact in future multi-pixel detection, where photodiode PD1 will bereplaced by a multi-pixel detector array, the signal of photodiode PD2 will be used for the
#125975 - $15.00 USD Received 25 Mar 2010; revised 26 Apr 2010; accepted 26 Apr 2010; published 13 May 2010(C) 2010 OSA 24 May 2010 / Vol. 18, No. 11 / OPTICS EXPRESS 11319
normalization of the array’s signals during data processing.
3. Preparation for EO detection of THz radiation
3.1. The crossed-polarizer-type EO detector
We employ the crossed-polarizer-type configuration [22, 25] in the EO detector. Assuming theintensity of the input probe-light is I0 (t), in absence of the THz field, the intensity of the trans-mitted light through the detector can be expressed as:
Ib (t) = I0 (t)[
η + sin2(Γ0 +2δ
2)], (1)
where η represents the fraction of transmitted light due to scattering from the polarizers andthe EO crystal, Γ0 is the residual birefringence of the EO crystal, and δ is the tilt angle of thesecond polarizer. When there is a THz field in the EO crystal, the intensity of the transmittedlight is given by
IT(t) = I0(t)[
η + sin2(Γ0 +Γ(t)+2δ
2)], (2)
where Γ(t) is the phase retardation induced by THz field. Therefore, the difference betweenIT(t) and Ib(t) is the intensity modulation ΔI (t) due to the THz field, i.e. the EO signal, whichis a linear function of Γ(t) when Γ(t) � (Γ0,δ ) � 1,
ΔI(t) = IT(t)− Ib(t) ≈ I0(t)(
Γ0
2+δ
)Γ(t). (3)
3.2. The EO crystal CdTe (110)
CdTe (110) is used as the EO crystal in our measurements. It belongs to the same zinc blendeclass as ZnTe. For EO detection, its EO coefficient r41 is one of the key factors. CdTe (110) usedwith 1064 nm lasers has an EO coefficient as high as that of ZnTe (110) crystals at 800 nm [26].The expression for the THz field induced phase retardation Γ(t) in Eq. (3) is given by [25]:
Γ(t) = βETHz(t) =2πn3
optr41L
λoptETHz(t), (4)
where ETHz(t) = ETcos(ΩTHzt −ϕ1) is the temporal field of THz pulse, ΩTHz is the THz fre-quency, λopt is the laser wavelength, nopt is the refractive index of the crystal at the laser wave-length, r41 is the electro-optical coefficient, and L is the thickness of the crystal.
Besides the EO coefficient, the coherence length and the absorption of the crystal at IR opticaland THz wavelengths are also important factors. The coherence length Lc of CdTe at 1064 nmand 1.5 THz is about 1 mm [25]. The absorption effects in CdTe for these conditions are domi-nated by the THz field absorption. One defines an absorption length Lα = (α/2)−1 with α beingthe power absorption coefficient [25, 27]. Referring to Ref. [25], the indium-compensation-doped CdTe (110) shows a lower THz absorption coefficient than nominally undoped material,which gives an absorption length of Lα > 1.3 mm at 1.5 THz. Based on these considerations, aCdTe crystal with a 1-mm thickness and 15×15 mm2 size is used in our measurements.
3.3. Effect of imperfect temporal overlap of the laser pulses on EO detection
The strongly depleted pump laser pulse and the signal laser pulse overlap only partially in time.This reduces the relative modulation depth of the EO signal and raises the question whether
#125975 - $15.00 USD Received 25 Mar 2010; revised 26 Apr 2010; accepted 26 Apr 2010; published 13 May 2010(C) 2010 OSA 24 May 2010 / Vol. 18, No. 11 / OPTICS EXPRESS 11320
measures should be taken to improve the pulses’ overlap and hence EO signal-to-noise ratio(SNR).
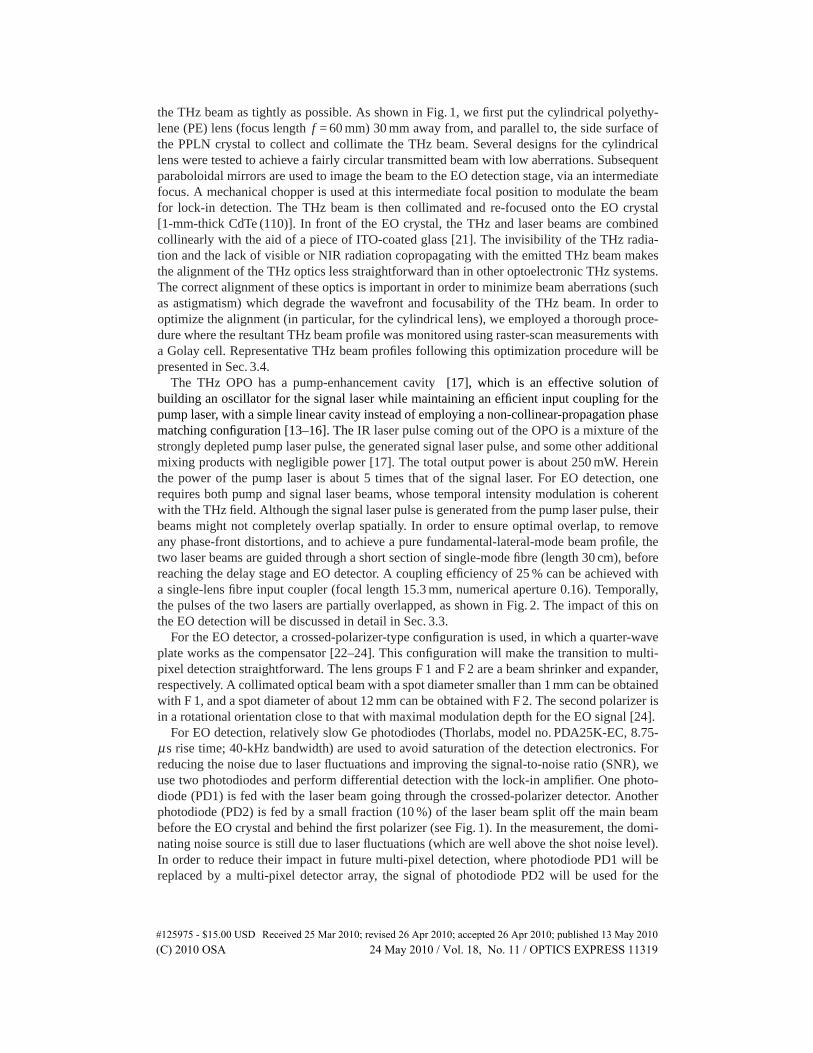
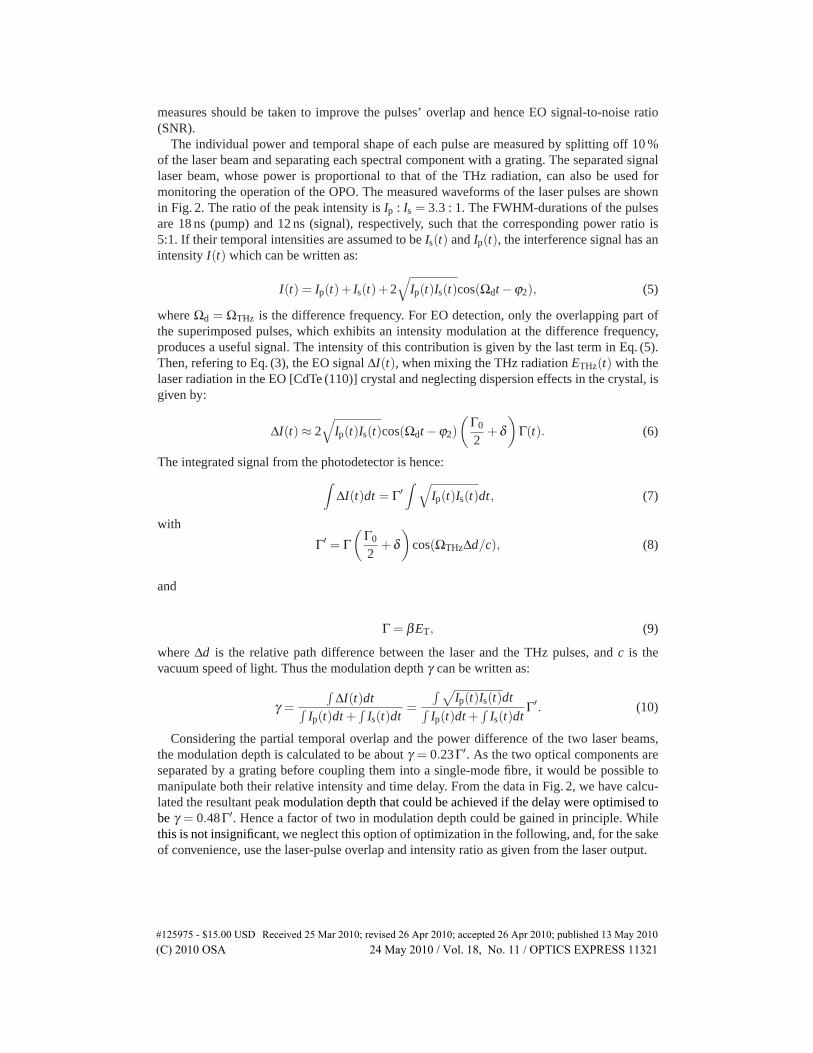
The individual power and temporal shape of each pulse are measured by splitting off 10 %of the laser beam and separating each spectral component with a grating. The separated signallaser beam, whose power is proportional to that of the THz radiation, can also be used formonitoring the operation of the OPO. The measured waveforms of the laser pulses are shownin Fig. 2. The ratio of the peak intensity is Ip : Is = 3.3 : 1. The FWHM-durations of the pulsesare 18 ns (pump) and 12 ns (signal), respectively, such that the corresponding power ratio is5:1. If their temporal intensities are assumed to be Is(t) and Ip(t), the interference signal has anintensity I(t) which can be written as:
I(t) = Ip(t)+ Is(t)+2√
Ip(t)Is(t)cos(Ωdt −ϕ2), (5)
where Ωd = ΩTHz is the difference frequency. For EO detection, only the overlapping part ofthe superimposed pulses, which exhibits an intensity modulation at the difference frequency,produces a useful signal. The intensity of this contribution is given by the last term in Eq. (5).Then, refering to Eq. (3), the EO signal ΔI(t), when mixing the THz radiation ETHz(t) with thelaser radiation in the EO [CdTe (110)] crystal and neglecting dispersion effects in the crystal, isgiven by:
ΔI(t) ≈ 2√
Ip(t)Is(t)cos(Ωdt −ϕ2)(
Γ0
2+δ
)Γ(t). (6)
The integrated signal from the photodetector is hence:∫
ΔI(t)dt = Γ′∫ √
Ip(t)Is(t)dt, (7)
with
Γ′ = Γ(
Γ0
2+δ
)cos(ΩTHzΔd/c), (8)
and
Γ = βET, (9)
where Δd is the relative path difference between the laser and the THz pulses, and c is thevacuum speed of light. Thus the modulation depth γ can be written as:
γ =∫
ΔI(t)dt∫Ip(t)dt +
∫Is(t)dt
=∫ √
Ip(t)Is(t)dt∫Ip(t)dt +
∫Is(t)dt
Γ′. (10)
Considering the partial temporal overlap and the power difference of the two laser beams,the modulation depth is calculated to be about γ = 0.23Γ′. As the two optical components areseparated by a grating before coupling them into a single-mode fibre, it would be possible tomanipulate both their relative intensity and time delay. From the data in Fig. 2, we have calcu-lated the resultant peak modulation depth that could be achieved if the delay were optimised tobe γ = 0.48Γ′. Hence a factor of two in modulation depth could be gained in principle. Whilethis is not insignificant, we neglect this option of optimization in the following, and, for the sakeof convenience, use the laser-pulse overlap and intensity ratio as given from the laser output.
#125975 - $15.00 USD Received 25 Mar 2010; revised 26 Apr 2010; accepted 26 Apr 2010; published 13 May 2010(C) 2010 OSA 24 May 2010 / Vol. 18, No. 11 / OPTICS EXPRESS 11321
40 60 80 100 120 140 1600
0.5
1
1.5
2
2.5
3
3.5
Time delay (ns)
Inte
nsity
(a.
u.)
SignalPump
Fig. 2. The signal (solid red line) and the depleted pump (dashed blue line) laser pulses.The pulse durations are 12 ns and 18 ns, respectively, and the power ratio is 1 : 5 (powerdetermined as intensity integrated over time).
(a) d = 200 mm
x (mm)
y (m
m)
10 20 30
5
10
15
20
251
2
3
4
5
(b) d = 280 mm
x (mm)
y (m
m)
10 20 30
5
10
15
20
251
2
3
4
5
(c) d = 360 mm
x (mm)
y (m
m)
10 20 30
5
10
15
20
251
2
3
4
5
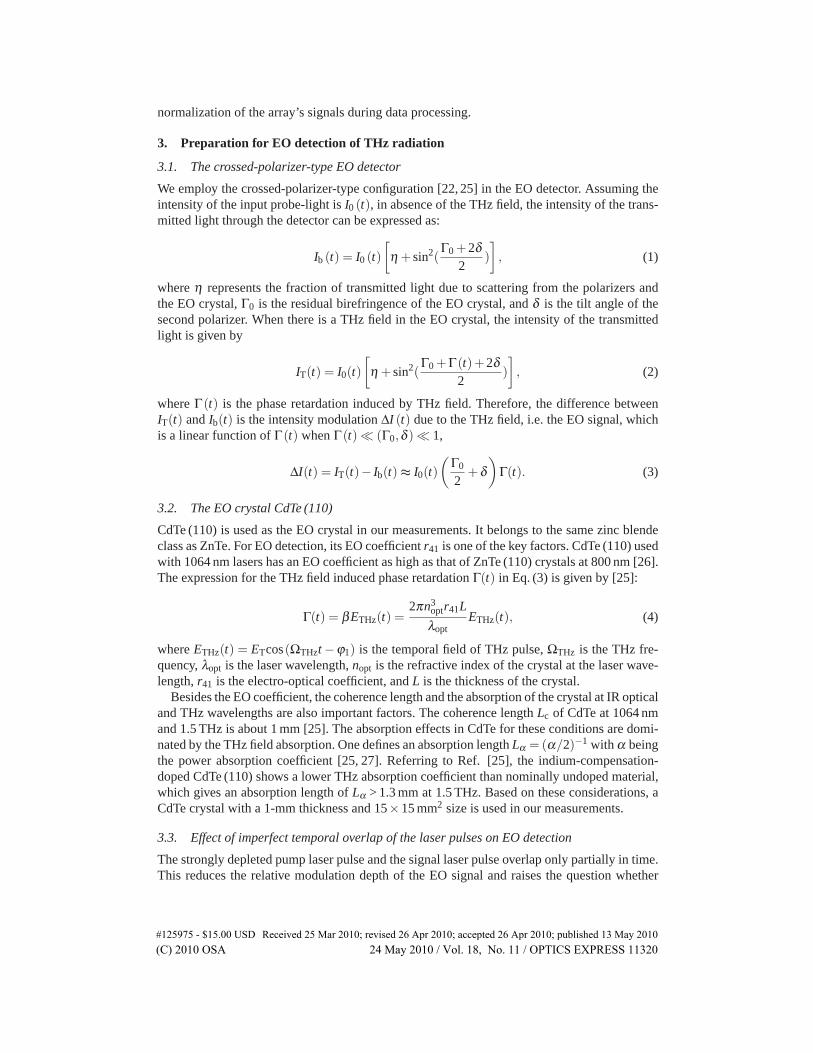
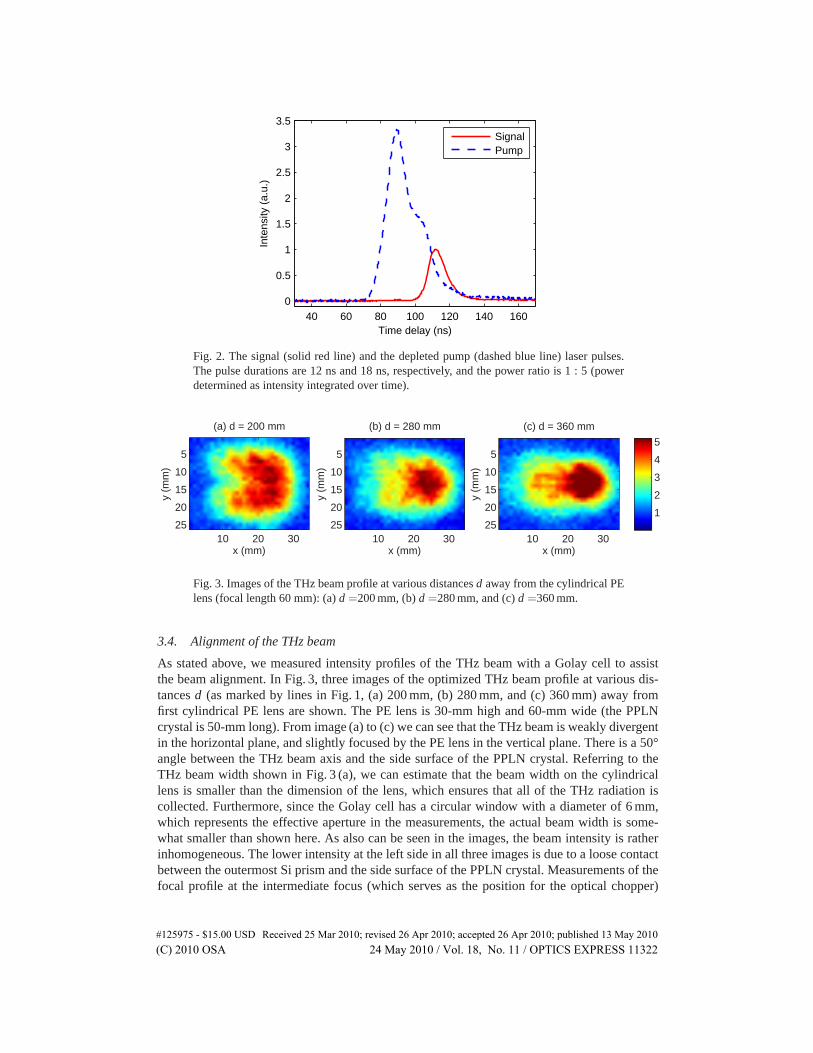
Fig. 3. Images of the THz beam profile at various distances d away from the cylindrical PElens (focal length 60 mm): (a) d =200 mm, (b) d =280 mm, and (c) d =360 mm.
3.4. Alignment of the THz beam
As stated above, we measured intensity profiles of the THz beam with a Golay cell to assistthe beam alignment. In Fig. 3, three images of the optimized THz beam profile at various dis-tances d (as marked by lines in Fig. 1, (a) 200 mm, (b) 280 mm, and (c) 360 mm) away fromfirst cylindrical PE lens are shown. The PE lens is 30-mm high and 60-mm wide (the PPLNcrystal is 50-mm long). From image (a) to (c) we can see that the THz beam is weakly divergentin the horizontal plane, and slightly focused by the PE lens in the vertical plane. There is a 50°angle between the THz beam axis and the side surface of the PPLN crystal. Referring to theTHz beam width shown in Fig. 3 (a), we can estimate that the beam width on the cylindricallens is smaller than the dimension of the lens, which ensures that all of the THz radiation iscollected. Furthermore, since the Golay cell has a circular window with a diameter of 6 mm,which represents the effective aperture in the measurements, the actual beam width is some-what smaller than shown here. As also can be seen in the images, the beam intensity is ratherinhomogeneous. The lower intensity at the left side in all three images is due to a loose contactbetween the outermost Si prism and the side surface of the PPLN crystal. Measurements of thefocal profile at the intermediate focus (which serves as the position for the optical chopper)
#125975 - $15.00 USD Received 25 Mar 2010; revised 26 Apr 2010; accepted 26 Apr 2010; published 13 May 2010(C) 2010 OSA 24 May 2010 / Vol. 18, No. 11 / OPTICS EXPRESS 11322
−3−1.5 0 1.5 3
10
20
30
40
50
60
70
80
90
Scan range (mm)
TH
z fie
ld (
a.u.
)
−3−1.5 0 1.5 3
1000
2000
3000
4000
5000
6000
7000
8000
9000
Scan range (mm)
TH
z in
tens
ity (
a.u.
)
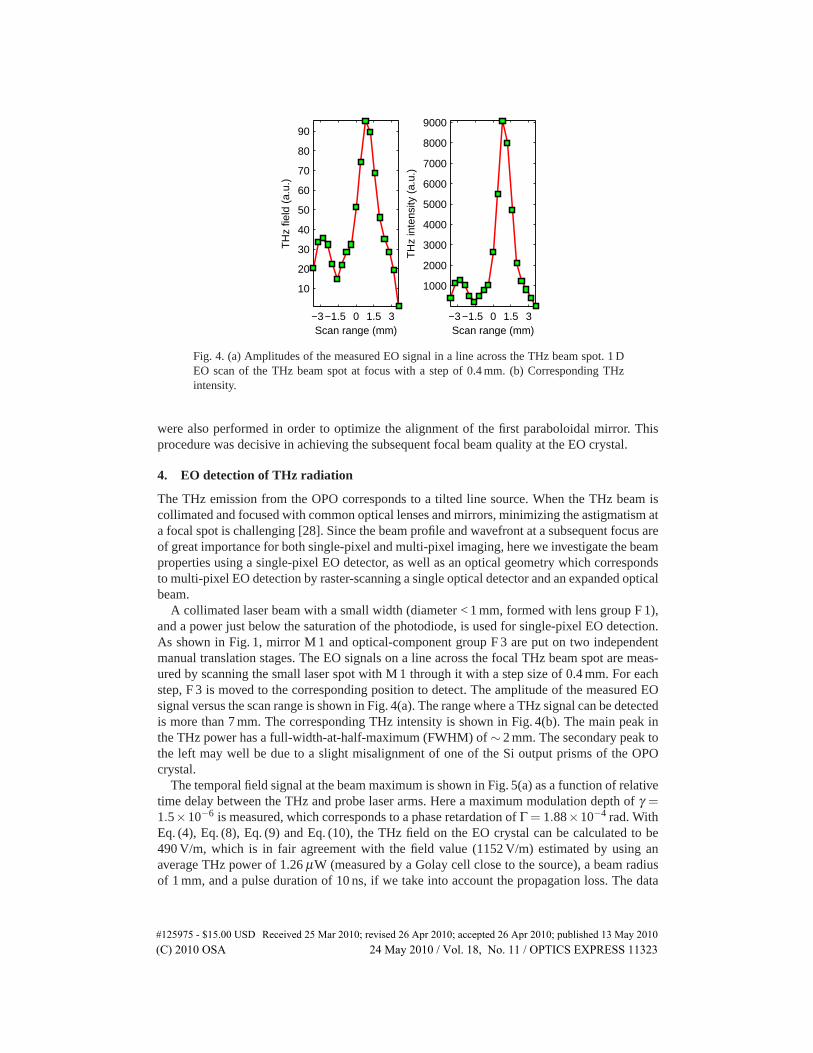
Fig. 4. (a) Amplitudes of the measured EO signal in a line across the THz beam spot. 1 DEO scan of the THz beam spot at focus with a step of 0.4 mm. (b) Corresponding THzintensity.
were also performed in order to optimize the alignment of the first paraboloidal mirror. Thisprocedure was decisive in achieving the subsequent focal beam quality at the EO crystal.
4. EO detection of THz radiation
The THz emission from the OPO corresponds to a tilted line source. When the THz beam iscollimated and focused with common optical lenses and mirrors, minimizing the astigmatism ata focal spot is challenging [28]. Since the beam profile and wavefront at a subsequent focus areof great importance for both single-pixel and multi-pixel imaging, here we investigate the beamproperties using a single-pixel EO detector, as well as an optical geometry which correspondsto multi-pixel EO detection by raster-scanning a single optical detector and an expanded opticalbeam.
A collimated laser beam with a small width (diameter < 1 mm, formed with lens group F 1),and a power just below the saturation of the photodiode, is used for single-pixel EO detection.As shown in Fig. 1, mirror M 1 and optical-component group F 3 are put on two independentmanual translation stages. The EO signals on a line across the focal THz beam spot are meas-ured by scanning the small laser spot with M 1 through it with a step size of 0.4 mm. For eachstep, F 3 is moved to the corresponding position to detect. The amplitude of the measured EOsignal versus the scan range is shown in Fig. 4(a). The range where a THz signal can be detectedis more than 7 mm. The corresponding THz intensity is shown in Fig. 4(b). The main peak inthe THz power has a full-width-at-half-maximum (FWHM) of ∼ 2 mm. The secondary peak tothe left may well be due to a slight misalignment of one of the Si output prisms of the OPOcrystal.
The temporal field signal at the beam maximum is shown in Fig. 5(a) as a function of relativetime delay between the THz and probe laser arms. Here a maximum modulation depth of γ =1.5×10⁻⁶ is measured, which corresponds to a phase retardation of Γ = 1.88×10⁻⁴ rad. WithEq. (4), Eq. (8), Eq. (9) and Eq. (10), the THz field on the EO crystal can be calculated to be490 V/m, which is in fair agreement with the field value (1152 V/m) estimated by using anaverage THz power of 1.26 μW (measured by a Golay cell close to the source), a beam radiusof 1 mm, and a pulse duration of 10 ns, if we take into account the propagation loss. The data
#125975 - $15.00 USD Received 25 Mar 2010; revised 26 Apr 2010; accepted 26 Apr 2010; published 13 May 2010(C) 2010 OSA 24 May 2010 / Vol. 18, No. 11 / OPTICS EXPRESS 11323
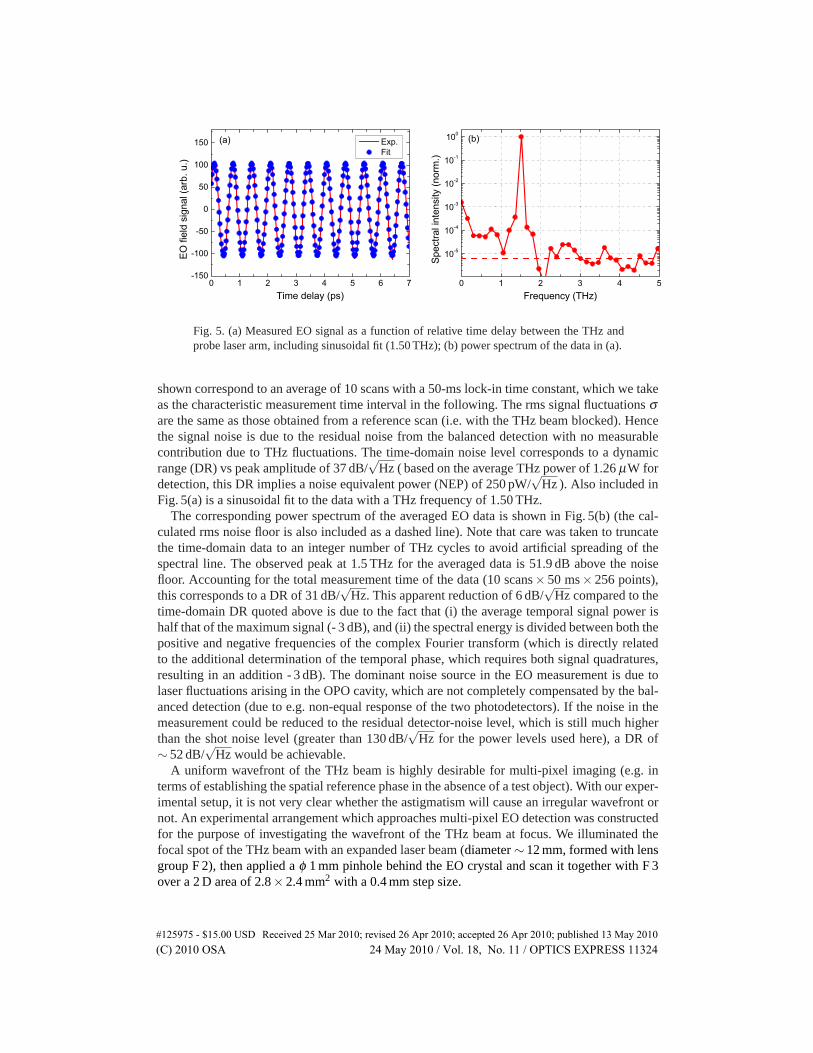
Fig. 5. (a) Measured EO signal as a function of relative time delay between the THz andprobe laser arm, including sinusoidal fit (1.50 THz); (b) power spectrum of the data in (a).
shown correspond to an average of 10 scans with a 50-ms lock-in time constant, which we takeas the characteristic measurement time interval in the following. The rms signal fluctuations σare the same as those obtained from a reference scan (i.e. with the THz beam blocked). Hencethe signal noise is due to the residual noise from the balanced detection with no measurablecontribution due to THz fluctuations. The time-domain noise level corresponds to a dynamicrange (DR) vs peak amplitude of 37 dB/
√Hz ( based on the average THz power of 1.26 μW for
detection, this DR implies a noise equivalent power (NEP) of 250 pW/√
Hz ). Also included inFig. 5(a) is a sinusoidal fit to the data with a THz frequency of 1.50 THz.
The corresponding power spectrum of the averaged EO data is shown in Fig. 5(b) (the cal-culated rms noise floor is also included as a dashed line). Note that care was taken to truncatethe time-domain data to an integer number of THz cycles to avoid artificial spreading of thespectral line. The observed peak at 1.5 THz for the averaged data is 51.9 dB above the noisefloor. Accounting for the total measurement time of the data (10 scans× 50 ms× 256 points),this corresponds to a DR of 31 dB/
√Hz. This apparent reduction of 6 dB/
√Hz compared to the
time-domain DR quoted above is due to the fact that (i) the average temporal signal power ishalf that of the maximum signal (- 3 dB), and (ii) the spectral energy is divided between both thepositive and negative frequencies of the complex Fourier transform (which is directly relatedto the additional determination of the temporal phase, which requires both signal quadratures,resulting in an addition - 3 dB). The dominant noise source in the EO measurement is due tolaser fluctuations arising in the OPO cavity, which are not completely compensated by the bal-anced detection (due to e.g. non-equal response of the two photodetectors). If the noise in themeasurement could be reduced to the residual detector-noise level, which is still much higherthan the shot noise level (greater than 130 dB/
√Hz for the power levels used here), a DR of
∼ 52 dB/√
Hz would be achievable.A uniform wavefront of the THz beam is highly desirable for multi-pixel imaging (e.g. in
terms of establishing the spatial reference phase in the absence of a test object). With our exper-imental setup, it is not very clear whether the astigmatism will cause an irregular wavefront ornot. An experimental arrangement which approaches multi-pixel EO detection was constructedfor the purpose of investigating the wavefront of the THz beam at focus. We illuminated thefocal spot of the THz beam with an expanded laser beam (diameter ∼ 12 mm, formed with lensgroup F 2), then applied a φ 1 mm pinhole behind the EO crystal and scan it together with F 3over a 2 D area of 2.8× 2.4 mm2 with a 0.4 mm step size.
#125975 - $15.00 USD Received 25 Mar 2010; revised 26 Apr 2010; accepted 26 Apr 2010; published 13 May 2010(C) 2010 OSA 24 May 2010 / Vol. 18, No. 11 / OPTICS EXPRESS 11324
−2 0 2
−505
−2 0 2
−505
−2 0 2
−505
−2 0 2
−505
−2 0 2
−505
−2 0 2
−505
−2 0 2
−505
−2 0 2
−505
−2 0 2
−505
−2 0 2
−505
−2 0 2
−505
−2 0 2
−505
−2 0 2
−505
−2 0 2
−505
−2 0 2
−505
−2 0 2
−505
−2 0 2
−505
−2 0 2
−505
−2 0 2
−505
−2 0 2
−505
−2 0 2
−505
−2 0 2
−505
−2 0 2
−505
−2 0 2
−505
−2 0 2
−505
−2 0 2
−505
−2 0 2
−505
−2 0 2
−505
−2 0 2
−505
−2 0 2
−505
−2 0 2
−505
−2 0 2
−505
−2 0 2
−505
−2 0 2
−505
−2 0 2
−505
−2 0 2
−505
−2 0 2
−505
−2 0 2
−505
−2 0 2
−505
−2 0 2
−505
−2 0 2
−505
−2 0 2
−505
Time delay (ps)
TH
z fie
ld (
arb.
u.)
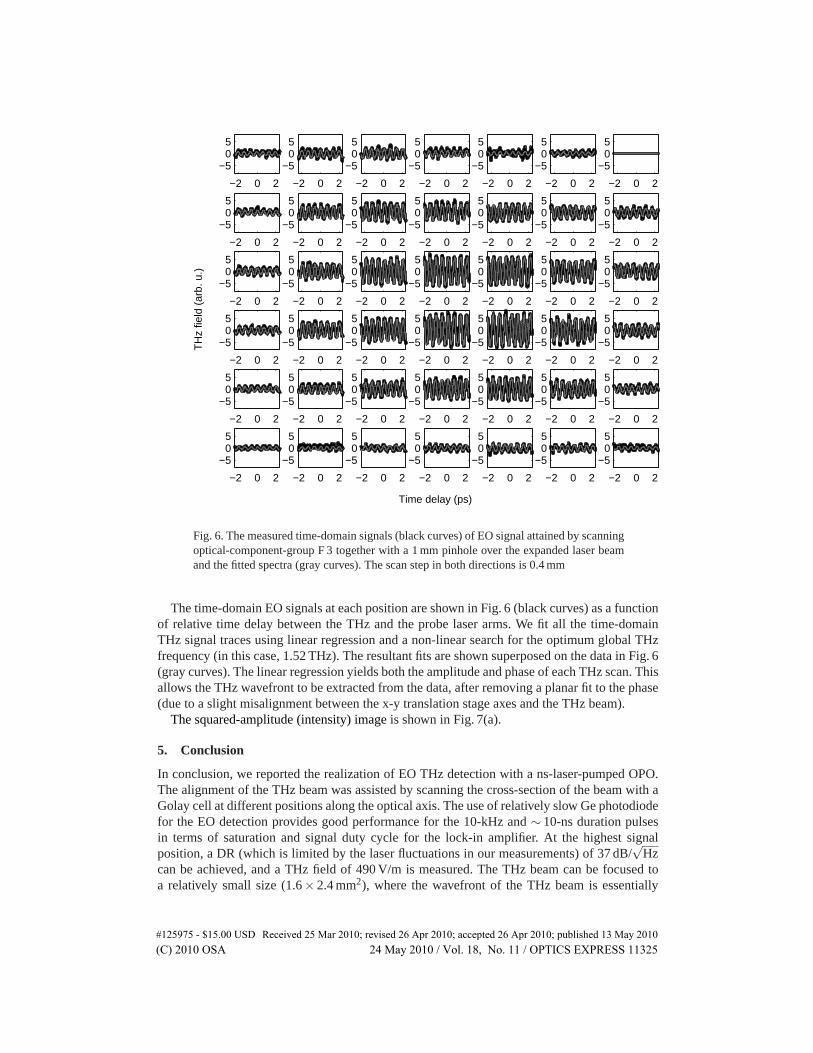
Fig. 6. The measured time-domain signals (black curves) of EO signal attained by scanningoptical-component-group F 3 together with a 1 mm pinhole over the expanded laser beamand the fitted spectra (gray curves). The scan step in both directions is 0.4 mm
The time-domain EO signals at each position are shown in Fig. 6 (black curves) as a functionof relative time delay between the THz and the probe laser arms. We fit all the time-domainTHz signal traces using linear regression and a non-linear search for the optimum global THzfrequency (in this case, 1.52 THz). The resultant fits are shown superposed on the data in Fig. 6(gray curves). The linear regression yields both the amplitude and phase of each THz scan. Thisallows the THz wavefront to be extracted from the data, after removing a planar fit to the phase(due to a slight misalignment between the x-y translation stage axes and the THz beam).
The squared-amplitude (intensity) image is shown in Fig. 7(a).
5. Conclusion
In conclusion, we reported the realization of EO THz detection with a ns-laser-pumped OPO.The alignment of the THz beam was assisted by scanning the cross-section of the beam with aGolay cell at different positions along the optical axis. The use of relatively slow Ge photodiodefor the EO detection provides good performance for the 10-kHz and ∼ 10-ns duration pulsesin terms of saturation and signal duty cycle for the lock-in amplifier. At the highest signalposition, a DR (which is limited by the laser fluctuations in our measurements) of 37 dB/
√Hz
can be achieved, and a THz field of 490 V/m is measured. The THz beam can be focused toa relatively small size (1.6× 2.4 mm2), where the wavefront of the THz beam is essentially
#125975 - $15.00 USD Received 25 Mar 2010; revised 26 Apr 2010; accepted 26 Apr 2010; published 13 May 2010(C) 2010 OSA 24 May 2010 / Vol. 18, No. 11 / OPTICS EXPRESS 11325
Intensity
x (mm)
y (m
m)
0 1 2
0
0.5
1
1.5
20
10
20
30
40Phase
x (mm)
y (m
m)
0 1 2
0
0.5
1
1.5
2
φ (r
ad)
−1
−0.5
0
0.5
(a) (b)
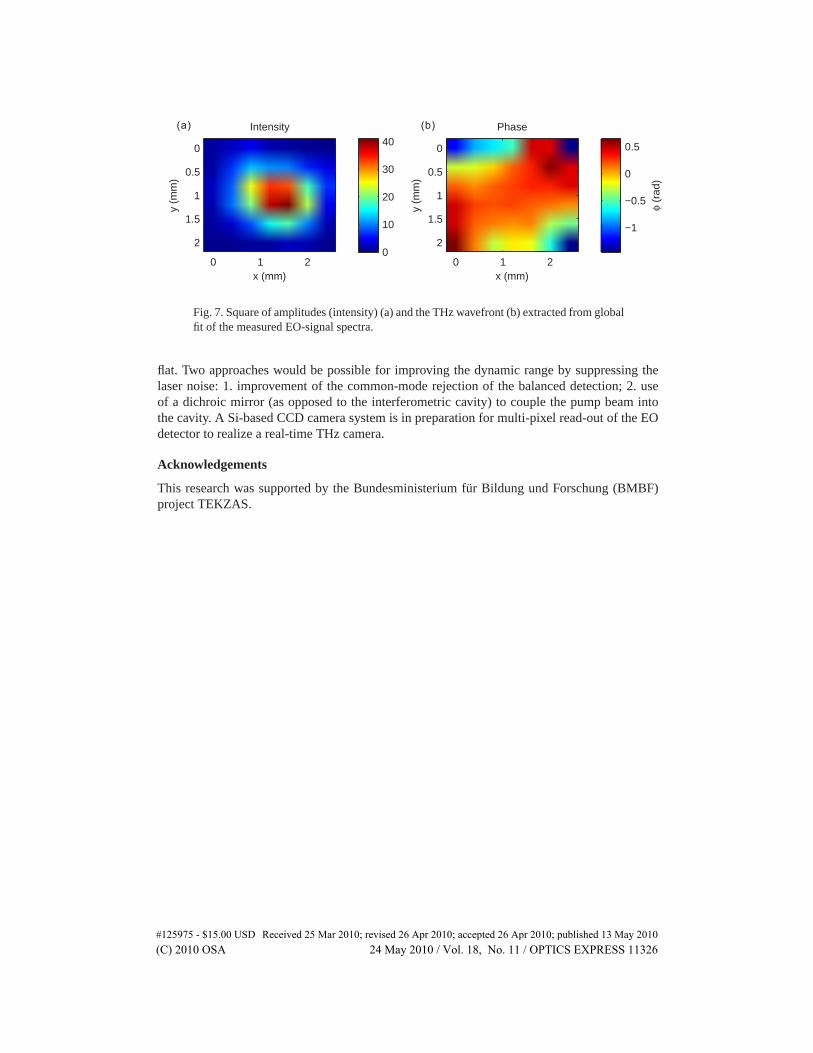
Fig. 7. Square of amplitudes (intensity) (a) and the THz wavefront (b) extracted from globalfit of the measured EO-signal spectra.
flat. Two approaches would be possible for improving the dynamic range by suppressing thelaser noise: 1. improvement of the common-mode rejection of the balanced detection; 2. useof a dichroic mirror (as opposed to the interferometric cavity) to couple the pump beam intothe cavity. A Si-based CCD camera system is in preparation for multi-pixel read-out of the EOdetector to realize a real-time THz camera.
Acknowledgements
This research was supported by the Bundesministerium für Bildung und Forschung (BMBF)project TEKZAS.
#125975 - $15.00 USD Received 25 Mar 2010; revised 26 Apr 2010; accepted 26 Apr 2010; published 13 May 2010(C) 2010 OSA 24 May 2010 / Vol. 18, No. 11 / OPTICS EXPRESS 11326