Embed Size (px)
Citation preview

1
AEB at Thatcham Research and in Euro NCAP
Colin Grover
Principal Engineer – ADAS & Automated Driving
November 2017

2Introduction
Introduction to Thatcham
AEB test development leading up to 2014 Euro NCAP implementation
Developments for 2018 AEB testing
Future Euro NCAP road map AEB developments

3
Automated Driving
Thatcham ResearchCore Activities
About Thatcham…
• Formed in 1969
• Funded by UK Motor Insurers
• Annual turnover £16m, not for profit
• Helping insurers control the cost of claims
• More recently, understanding risk
Claim of the Future Modelling
Enhanced Vehicle Data (ADAS)
Vehicle Safety Research & Testing
Repair Research (Methods & Times)
Training & Accreditation
Vehicle Security Research & Testing
…“Safer cars, fewer crashes”
4
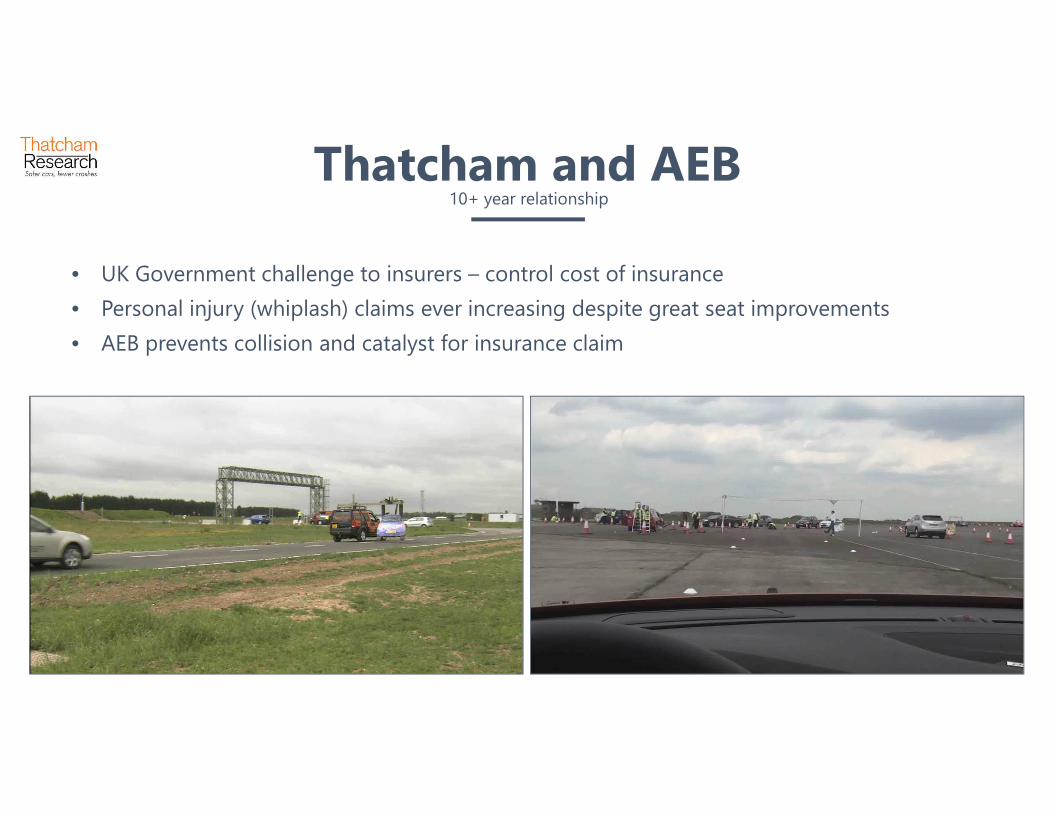
Thatcham and AEB10+ year relationship
• UK Government challenge to insurers – control cost of insurance
• Personal injury (whiplash) claims ever increasing despite great seat improvements
• AEB prevents collision and catalyst for insurance claim

5
AEB Group
“To design and implement test procedures reflecting real world data that can encourage the development of autonomous braking tec hnology that can help prevent or mitigate the effects of car-to-pedestria n and car-to-car crashes”
• Analyse real world accident data to define test scenarios
• Define and specify test methods and measurement equipment
• Define test metrics and rating process• Publish results/ratings to inform consumers/stakeholders of technology capability
• Integrate into existing consumer test programs (RCAR)
• Offer to Euro NCAP PNCAP for consideration for future test program

6
LOUGHBOROUGH STUDY OF ALL UK CRASHES
REAL WORLD DATA
Example
Cluster 1
• 30% of cases
• Lower speeds
• At junction
• Daylight
• Fine weather
• Vehicle A going ahead
• Vehicle B stop/starting
• Following traffic
Aim for 4-6 clusters
≥75% of cases
Unique in-depth study commissioned by Thatcham investigating real world crashes and their causation factors to formulate realistic test scenarios that drive AEB functionalities suitable for Euro NCAP and Insurers
• 11,192 STATS19 CCR cases analysed
• 10,574 STATS19 CP cases analysed
• 50 OTS CCR cases analysed
• 175 OTS CP cases analysed
7
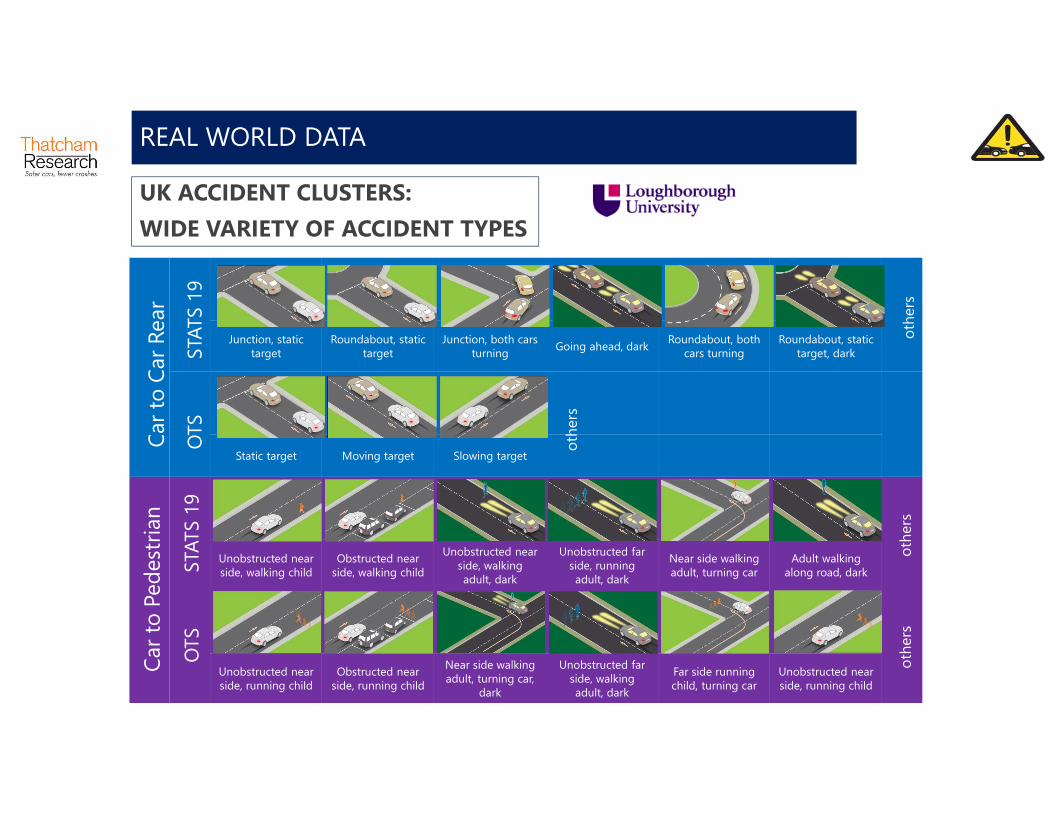
UK ACCIDENT CLUSTERS:
WIDE VARIETY OF ACCIDENT TYPES
Junction, static target
Roundabout, static target
Junction, both cars turning
Going ahead, darkRoundabout, both
cars turningRoundabout, static
target, dark
Static target Moving target Slowing target
Unobstructed near side, walking child
Obstructed near side, walking child
Unobstructed near side, walking adult, dark
Unobstructed far side, running adult, dark
Near side walking adult, turning car
Adult walkingalong road, dark
Unobstructed near side, running child
Obstructed near side, running child
Near side walking adult, turning car,
dark
Unobstructed far side, walking adult, dark
Far side running child, turning car
Unobstructed near side, running child
REAL WORLD DATAC
ar
to P
ed
est
rian
Car
to C
ar
Rear
OTS
STA
TS 1
9O
TS
STA
TS 1
9
oth
ers
oth
ers
oth
ers
oth
ers
8
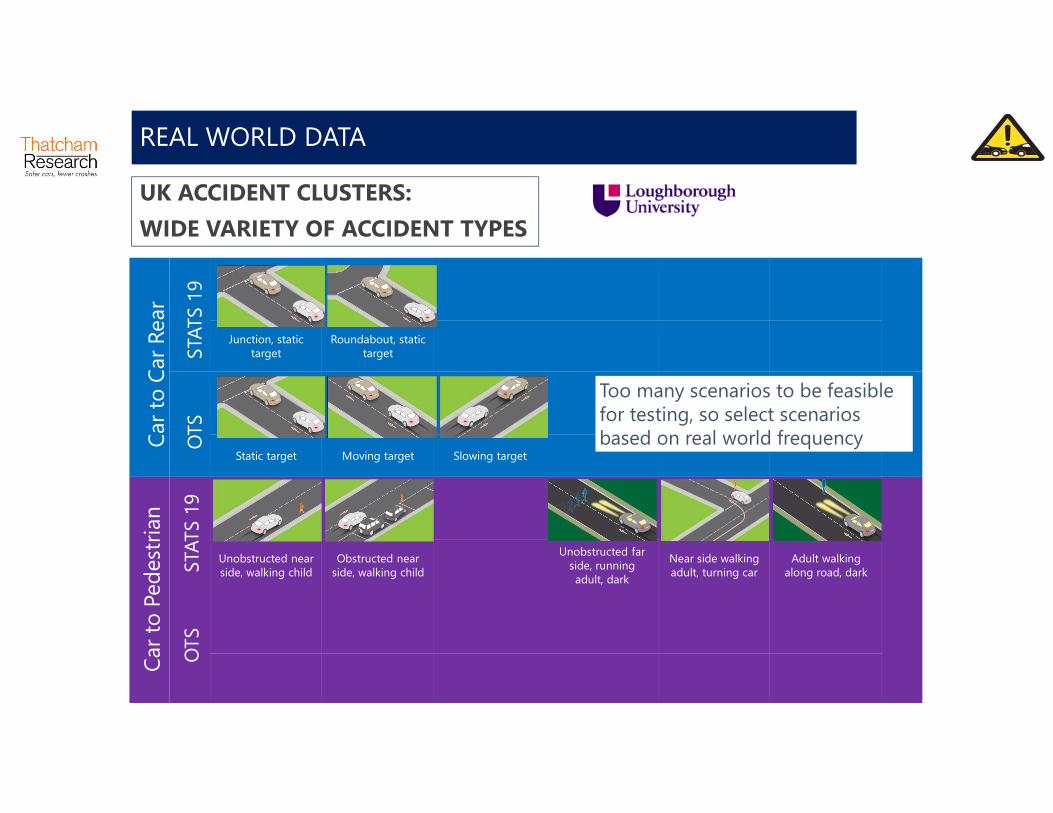
UK ACCIDENT CLUSTERS:
WIDE VARIETY OF ACCIDENT TYPES
Junction, static target
Roundabout, static target
Static target Moving target Slowing target
Unobstructed near side, walking child
Obstructed near side, walking child
Unobstructed far side, running adult, dark
Near side walking adult, turning car
Adult walkingalong road, dark
REAL WORLD DATAC
ar
to P
ed
est
rian
Car
to C
ar
Rear
OTS
STA
TS 1
9O
TS
STA
TS 1
9
Too many scenarios to be feasible for testing, so select scenarios based on real world frequency

9
TEST SCENARIOS SELECTED TO REPRESENT GREATEST
FREQUENCY OF REAL WORLD CRASHES
REAL WORLD DATA
Combining accident data from other international sources
UK UK Germany
STATS 19n=34,764cluster analysisrear-end collisions
OTSn=50 cluster analysisrear-end collisions
UDVn=285 (N=30,155)3rd party vehicle claims 2002-2006rear-end collisions
CITY & URBAN
Car drives into stationary vehicle 61% 56% 52%
URBANCar drives into slower moving vehicle 30% 10%
URBANCar drives into braking vehicle 14% 6%
In addition to real world data scenarios are also selected using engineering judgements. CCR 2 is situation noted from track testing where some AEB systems appear to fail. This scenario is under investigation, not yet tested due to limitation of 3D appearance of target.

10
TEST SCENARIOS SELECTED TO REPRESENT GREATEST
FREQUENCY OF REAL WORLD CRASHES
REAL WORLD DATA
Combining accident data from other international
sources
UK UK Germany USA
STATS 19n=10,574cluster analysisfrontal collisions
OTSn=175 cluster analysisfrontal collisions
UDVn=234 (N=18,571)3rd party vehicle claims 2002-2006frontal collisions
IIHS1997-2006 FARS & GESall car-pedestrians
Pedestrian walks from nearside 51%
59%
32%
27%Pedestrian walks out from behind obstruction 14% 7%
Pedestrian runs out from the far side 9% 37% 28%
Pedestrian walks along in the dark 3% 5% 8% 9%
Pedestrian walks out into the path of turning car 6%
Overall: going ahead 87%, Turning 13% 18% -
Darkness scenarios are not yet tested, but closest possible scenario is under investigation For example CP4 is tested as stationary pedestrian, but not in darkness
PED
ES
TR
IAN

11
FURTHER INTERNATIONAL CP STUDIES
INTERNATIONAL ACCIDENTOLOGY
•Overall the clusters derived from STATS 19 and OTS data for both CP and CCR data appear to be reasonably representative of other international accident distributions
•Scenarios were therefore considered to be globally representative

12
INITIAL SPEEDS AT START OF COLLISION
REAL WORLD DATA
Car to Pedestrian
Initial speed prior to braking was below 50km/h for 78% of cases
Initial speed
78%
93% of all accidents had a delta-v of less than 20km/h
93%
Delta-V
OTS case reconstructions
– UK
EDR data – AXA Switzerland
Initial speed prior to braking was below 60km/h for majority of cases
13
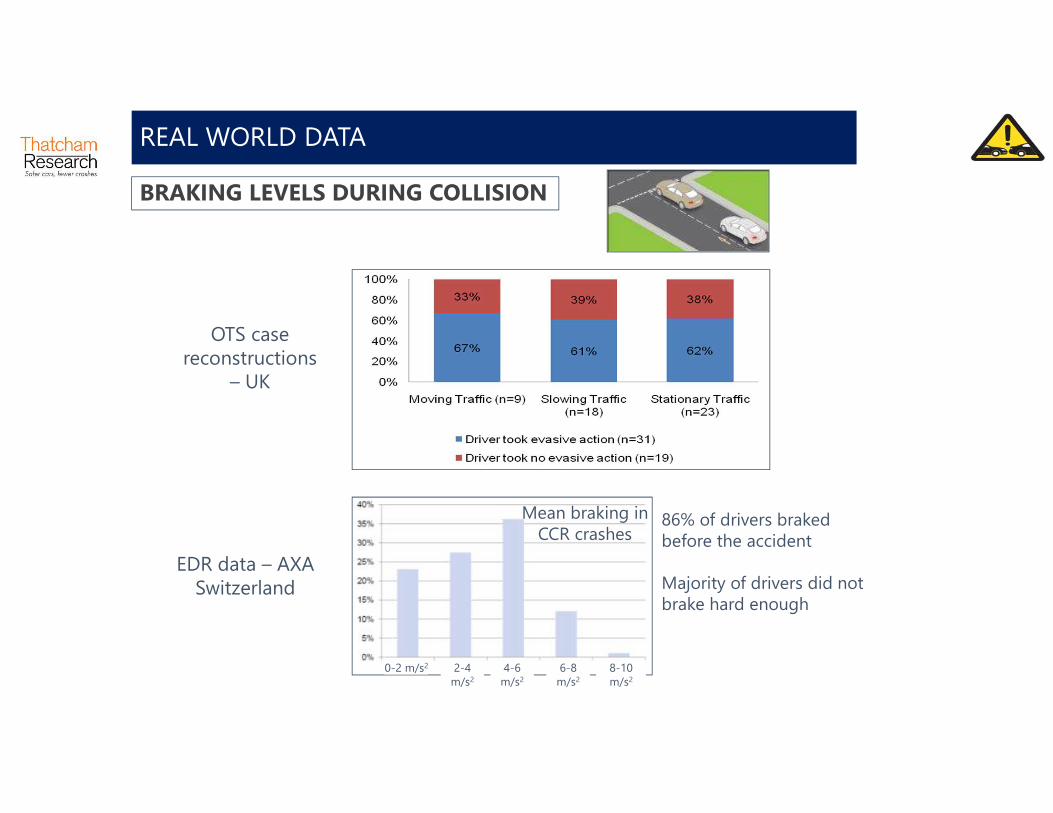
BRAKING LEVELS DURING COLLISION
REAL WORLD DATA
86% of drivers braked before the accident
Majority of drivers did not brake hard enough
Mean braking in CCR crashes
0-2 m/s2 2-4 m/s2
4-6 m/s2
6-8 m/s2
8-10 m/s2
OTS case reconstructions
– UK
EDR data – AXA Switzerland

14Dynamic Brake Support (DBS)In conjunction with Forward Collision Warning (FCW)
DBS
Mean deceleration in rear end crashes62 to 86% of drivers brake, but only moderately
DBS boosts driver braking response in emergency situations

15AEB Test ScenariosCar & Pedestrian
Car-to-Car Rear (CCR) Car-to-Pedestrian CP
CITYLead Vehicle Stopped<50km/h
CP1Unobscured nearside walking pedestrian
Lead Vehicle Stopped30-80km/h
CP2Obscured walking nearside pedestrian
Slower Lead VehicleTarget 20km/hTest 30-80km/h
CP3Unobscured farside pedestrian
Lead Vehicle Decelerating50km/h
INT
ER
-U
RB
AN
INT
ER
-U
RB
AN
INT
ER
-U
RB
AN

16
COMPARISON OF DIFFERENT TEST TARGETS
RADAR and Camera Systems
WHAT TARGET?
Car
Rabbit & Assessor
Assessor - Tyres Assessor - Ground
Rabbit & Suzuki ABsessor
Balloon Car
Adult Pedestrian target
Rabbit (Landrover Discovery with radar shielding) is not acquired as a target by the system

17
Golf 1.5
Balloon Car 2.7
Assessor 0.8
Assessor
tyres 0.8
Rabbit &
Assessor 1.2
Rabbit &
Suzuki 1.7
ABsessor 1.5
Walking
Man Target 1.5
Adult
walking 4.3
COMPARISON AT APPROACH SPEED ≈ 20KM/H
CAR & PEDESTRIAN TEST TARGETS
• System outputs confidence level of an object based on radar and visual attributes
• Scored on a scale of 0-5 with 5 being the higher confidence (green)
• Score of 0 indicates insufficient visual detail to confirm the object (red)
Distance from target mAvoidance distance m
Driver braking for safety
60.2
52.5
15.7
22.7
64.4
50.6
78.8
7.8
20.7
Driver braking for safety

18Euro NCAP Vehicle TargetEVT

192014 City AEB TestCar to car stationary
• Stationary target• Test speeds 10 to 50km/h in 5km/h steps• Preconditions:
• Front seat whiplash score: ≥1.5 points (good)• Full avoidance at 10, 15 and 20km/h
• Reward for AEB only (FCW not considered)• Full points for avoidance• Mitigation rewarded proportionally to speed
reduction
• Precondition: AEB system default ON at start of every journey
• Points awarded if deactivation NOT possible with a single button push

202014 City AEB TestCar to car stationary

212014 Inter-urban AEB TestAEB & FCW
• Stationary target• Test speeds ranging from 30 to
80km/h• Reward for Forward Collision
Warning (FCW)• No reward for AEB• Mitigation rewarded
proportionally to speed reduction
• Moving target 20 km/h• Test speeds AEB 30 to 70 km/h
FCW 50 to 80 km/h• Reward for AEB and FCW• Mitigation rewarded
proportionally to speed reduction• Maximum points awarded for
AEB avoidance
• Test target and test vehicle initially driving at 50km/h
• 12m and 40m headways, target deceleration 2 and 6m/s2
• Reward for AEB and FCW• Mitigation rewarded
proportionally to speed reduction

222014 Inter-urban AEB TestCar to car stationary FCW

232014 Inter-urban AEB TestCar to car moving

242014 Inter-urban AEB TestCar to car braking

25Inter-urban HMI pointsPre-conditions – no one button off switch, FCW must be ‘loud and clear’

26Modern AEB PerformanceAEB City
Euro NCAP see a 38% overall reduction in real-world, rear-end crashes
• Volvo• Mercedes• VW/Audi/Skoda/Seat• BMW• Toyota/Lexus• Nissan/ Infiniti• Alfa Romeo• Mazda• Honda• Peugeot• Opel/Vauxhall• Jaguar/Land Rover• Hyundai/Kia

27Modern AEB PerformanceCars achieving 50km/h AEB City collision avoidance
• Alfa Romeo Giulia, Stelvio• Audi Q2, A4 Q7 & A8• BMW X3, 5 Series & 6 Series• Honda Civic• Hyundai i30, Ioniq, Tucson, Jonathan• Infiniti Q30, QX30,• Jaguar XF, F Type, XJ , E-Pace,• Kia Moro, Picanto, Stinger, Stonic, Sportage• Range Rover Evoque, Velar• Mazda 3, CX3, CX5 • Mercedes GLA, CLS, E-Class• Nissan Micra• Opel Grandland X• Peugeot 3008, 5008• Seat Arona, Ateca, Ibiza, Karoq, Kodiaq, Octavia• Toyota Yaris, Prius, CHR, RAV4, Verso, Pro Ace Verso, Hilux• VW Polo, Passat, Arteon, Tiguan, T-Roc, Crafter• Volvo XC60, XC90, S90, V90

28AEB EffectivenessTest performance & claims data
TITLE2%
-9%
-26%
-3%-8%
7%
Own Damage Third Party Damage Third Party InjuryVolvo XC60
Frequency Cost
-10%
-24%-20%
-11% -11%
-1%
Own Damage Third Party Damage Third Party Injury
Volkswagen Golf
Frequency Cost
Real-world insurance analysis
VW Golf
Volvo XC60
High Speed
Low Speed
Testing
VW Golf
Volvo XC60

29AEB Effectiveness
Updated study of US insurance claims by Insurance Institute for Highway Safety (IIHS)
Weighted averages applied to US findings to represent UK market:• Injury reduction 26%• Damage reduction
15%
City safety reduces insurance claims
TREND: AEB is reducing collisions in the real world
Summary of studies:
Insurance claims study from Switzerland; 31% reduction in 3rd party rear-end claims
Insurance claims study from Germany; 9% reduction in all claims
Tristar worldwide (chauffeur fleet standard fit); 27% reduction rear impacts
Volvo study of real world crashes in GIDAS; 19% were avoidable with City Safety

30AEB availability on new carsNew cars launched in…
Early 2020s -AEB mandated by regulation

31AEB on Other Vehicle Types
EU Regulation No. 347/2012 - All vehicles > 8000 kg
HGV LCV
Currently no AEB requirement
79.3%
19.7%
1.0%
LCV AEB fitment availability
Not Available
Optional
Standard

32
13% of all road casualties
Vulnerable Road UsersPedestrian 2016 Implementation
Many VRU systems only work in daylight
Day light testing Euro NCAP in 2016, Night testing likely 2018
Test scenarios based on top 3 pedestriancollisions
Unobscured nearside walking adult
Obscured running nearside child
Unobscured farside adult

33
Cyclists 11% of all road casualtiesPedal cycle traffic increasing: 13% higher than 2005-9 average
Vulnerable Road UsersCyclist 2018 Implementation

34
2018 Euro NCAP AEB TestingAdditional tests and new target

35
City & Inter-Urban with 100, 75 and 50% overlap
2018 Euro NCAP AEB TestingAdditional tests and new target

36
2018 Euro NCAP AEB TestingAdditional tests and new target
UK insurance claims data analysis
3rd party rear damage 1st party striking
Speed ~50% stationary, 40% up to 30km/h More than 90% up to 50km/h
Direction More than 95% 6 o’clock, remainder 5 and 7 More than 95% 12 o’clock, remainder 11 and 1
Overlap 2/3 central or full width, 1/6 half to two thirds, 1/6 less than one third

37
AEB Offset TestingAdditional tests and new target
Make & Model Sensor technology Target Overlap 10 15 20 25 30 35 40 45 50
100% Avoid Avoid Avoid Avoid Avoid Avoid Mitigate Mitigate mitigate
50% Avoid Avoid Avoid mitigate No effect No effect
100% Avoid Avoid Avoid Avoid Avoid Avoid Avoid Avoid Avoid
50% Avoid Avoid Avoid Avoid Avoid Avoid Avoid Avoid Avoid
100% Avoid Avoid Avoid Avoid Avoid Mitigate Mitigate mitigate No effect
50% Avoid Avoid Avoid Mitigate
100% Avoid Avoid Avoid Avoid Mitigate No effect
50% Avoid Avoid Avoid Avoid mitigate No effect
100% Avoid Avoid Avoid Avoid Avoid Avoid Avoid Avoid Avoid
50% Avoid Avoid Avoid Avoid Avoid Avoid Avoid Mitigate
100% Avoid Avoid Avoid Avoid Avoid Avoid Avoid Mitigate Mitigate
50% Avoid Avoid Avoid Avoid Avoid Avoid (Avoid)
GST
GST
EVT
EVT
EVT
EVT
Honda Jazz Lidar
Toyota Prius Radar & camera
Volvo V40 Lidar, radar & camera
Mercedes E-Class Radar & camera
Prototype vehicle Radar & camera
Volvo V40 Lidar

38
Vehicle Testing Targets
Euro NCAP Vehicle Target (EVT)
NHTSA Strikeable Surrogate Vehicle (SSV)
Euro NCAP Vehicle Target (EVT) NHTSA Strikeable Surrogate Vehicle (SSV)
Current vehicle testing targets New target requirementsGVT
Suitable for full overlap rear end only
Representation
Straight line driving only
Manoeuvrability
Low to moderate speeds, full overlap only
Impactability
Increases development and confirmation workload
Different designs
Full 360°perimeter representation – radar, camera, lidar
Representation
Use stationary and travelling at speed – stability
Manoeuvrability
Impactable at speed – minimal damage
Impactability
Compatible with multiple carrier devices
Different designs
Durable or disposal
Economical

39
Light reflective elements
GVT Development ProcessGVT
Applied to lights and licence plate
Minimising platform effect – 22°edges, bulkheads and skirts
Achieving appropriate RCS
Internal reflections – enclosing target
dB return – increasing reflection whilst maintaining GPS
Wheel well and wheels – separate wheel blocks
Visual representation
Surface wrinkling – stiffeners added
Repeatable construction – telltale circles/windows

40
GVT ConstructionGlobal Vehicle Target

41
Target InteroperabilityGVT
ISO WG developing target attributes specification – referenced by Euro NCAP
?
?
DRI Low Profile Robotic Vehicle (LPRV)
ABD Guided Soft Target (GST)
DSD Ultraflat Overrunablerobot (UFO)
DRI Soft Car 360

42
2018 Inter-urban AEBCar to car moving

43Lane Support SystemsEmergency Lane Keeping

442020 Junction Collision ProtectionCrossing and Turning
City Safety including braking in intersection
Up to 31mph
Volvo XC90 S90 V90 XC60
Cross Traffic Function
Up to 22mph
Mercedes E-Class
3/4 of all injurious accidents involving a car and another vehicle occur at junctions
2/3 occur where the vehicle fails to give way to vehicles approaching from the right

45
Pedestrian
Example Junction Test Scenarios
Turn Across Path Crossing Traffic

46Junction Collision ProtectionVolvo XC90

47Junction Collision ProtectionMercedes E-Class

482020 Reversing Pedestrian AEBProposal
• ~1 in 6 pedestrian collisions are reversing
• ~1 in 3 MAIS 3+ injuries –upper leg and head
• Typically collisions withelderly pedestrians andchildren
• Speeds <10km/h
• Drivers rarely brake

49
AEB at Thatcham Research and in Euro NCAP
Colin Grover
Principal Engineer – ADAS & Automated Driving
November 2017