Embed Size (px)
Citation preview
ORIGINAL COMMUNICATION
Collaborative Learning Using Internet2 and RemoteCollections of Stereo Dissection Images
PARVATI DEV,1* SAKTI SRIVASTAVA,1 AND STEVEN SENGER2
1Stanford University Medical Media and Information Technologies (SUMMIT), Stanford University School of Medicine,Stanford, California
2Department of Computer Science, University of Wisconsin-La Crosse, La Crosse, Wisconsin
We have investigated collaborative learning of anatomy over Internet2, using an applica-tion called remote stereo viewer (RSV). This application offers a unique method of teach-ing anatomy, using high-resolution stereoscopic images, in a client–server architecture.Rotated sequences of stereo image pairs were produced by volumetric rendering of theVisible female and by dissecting and photographing a cadaveric hand. A client–serverapplication (RSV) was created to provide access to these image sets, using a highly inter-active interface. The RSV system was used to provide a ‘‘virtual anatomy’’ session for stu-dents in the Stanford Medical School Gross Anatomy course. The RSV application allowsboth independent and collaborative modes of viewing. The most appealing aspects of theRSV application were the capacity for stereoscopic viewing and the potential to access thecontent remotely within a flexible temporal framework. The RSV technology, used overInternet2, thus serves as an effective complement to traditional methods of teaching grossanatomy. Clin. Anat. 19:275–283, 2006. VVC 2006 Wiley-Liss, Inc.
Key words: medical education; gross anatomy; stereoscopic images; distancelearning; internet2
INTRODUCTION
The Visible Human Project (Spitzer et al., 1996)
made a very large collection of digital images avail-
able for human anatomy (Ackerman, 1999). This rich
data set has been used subsequently to create
numerous learning resources (Hoffman et al., 1997;
Schubert et al., 1997; Jastrow and Vollrath, 2002).
Other projects have added resources, such as the
Visible Korean Human (Park et al., 2005) and LUCY
2 (Heinrichs et al., 2004).
We have used the availability of such digital
image collections to begin the creation of a network-
ed resource of digital anatomy images for teaching
and learning (Dev and Senger, 2005). In particular,
we are investigating the advantages and limitations
of using the Internet as a complementary approach
to traditional cadaver-based teaching.
This article describes our experience in designing,
implementing, and evaluating a unique method of
teaching anatomy, using high-resolution stereoscopic
images, in a client–server architecture. This work
was done as a demonstration project for the National
Library of Medicine under its Next Generation
Internet initiative (http://www.ngi.gov). The NGI
initiative seeks to demonstrate the need for and
define the characteristics of the network technology
required to support innovative biomedical applica-
*Correspondence to: Parvati Dev, PhD, Stanford University
Medical Media and Information Technologies (SUMMIT), Stan-
ford University School of Medicine, 251 Campus Drive, MSOB
Room 240, Stanford, CA 94305-5466, USA.
E-mail: [email protected]
Grant sponsor: NLM/NIH; Grant number: 185N034.
Received 28 March 2005; Revised 12 October 2005; Accepted 3
November 2005
Published online 27 February 2006 in Wiley InterScience (www.
interscience.wiley.com). DOI 10.1002/ca.20313
VVC 2006 Wiley-Liss, Inc.
Clinical Anatomy 19:275–283 (2006)

tions. It envisions a secure, high-bandwidth,1 low-la-
tency network for the biomedical research community.
MATERIALS AND METHODS
Creating an Array of Images for Stereo Viewing
and Interaction
We created anatomy image data sets with various
dimensions of interactivity either by rendering 2-D
views of a 3-D volume of crosssectional data or by
photographing rotated views of a dissected specimen.
For rotational viewing and interaction, we acquire or
create a series of rotated views of the anatomy at 58intervals. The data volume or the dissected specimen
may also be photographed at different tipping angles
followed by rotation, as mentioned earlier. The result
is a 2-D array of images with combinations of differ-
ent rotation and tip angles. Additional dimensions of
interactivity include changing transparency and layers
of dissection.
Visible Human data was processed to generate a
series of sequentially rotated images, created at
intervals of 58. Seventy-two images were required to
obtain 3608 of rotation (72 3 5 ¼ 3608). Figure 1
shows five representative frames, acquired at inter-
vals of 158. The frames were originally rendered at a
resolution of 1,024 3 1,024 pixels, compressed for
transmission using a JPEG compression algorithm,
and displayed at the user-desired resolution, typi-
cally 768 3 768. These images were rendered from
the Visible Female CT data to show bone, muscle,
and skin, at increasing levels of transparency, using
segmentation and rendering software developed by
one of us (Senger, 1999). We have also generated
rotation series of the Stanford Visible Female and
other crosssectional data, using commercially avail-
able software (Amira and Volume Graphics).
The image data were stored on server computers
and organized for rapid retrieval. Images are stored
as compressed JPEG images (�200 kB), and are
transported to the client on demand, using a custom
protocol written over the unreliable datagram proto-
col layer, to reduce transmission overhead compared
to the more common TCP/IP protocol. The trans-
port rate was configured to be equal to the JPEG
decompression rate of the client, allowing the client
to interleave receipt and decompression of data.
Acquisition of Stereo Images of a
Dissected Specimen
A fresh cadaveric hand (amputated at mid-fore-
arm) was obtained from the Cadaver Donor Program
at Stanford University School of Medicine. The
hand was mounted on a PiXiTM mechanical turnta-
ble (Kaidan Corp., Feasterville, PA) using a custom-
designed central mounting post, and the entire con-
struct was inverted. Images were taken with a Kodak
520C digital camera with a resolution of 1,764 31,160 pixels. The turntable was rotated through
3608, in steps of 58, to produce a set of 72 images.
Background color, adequate lighting, camera shutter,
and aperture settings were adjusted to produce opti-
mum photographs.
The hand was then removed from the turntable
and dissected superficially. As the hand was re-
mounted, Kirschner guide wires through the radius
and ulna served as landmarks to standardize the hand
position relative to the first set of images. An addi-
tional set of 72 images at this progressively deeper
layer of dissection was then photographed. This pro-
cedure of dissection and photography was repeated
until seven sets of images were produced at increas-
ing depths of dissection. The last set consisted exclu-
sively of the deep layers of muscle of the hand. Fig-
ure 2 shows several representative ‘‘frames’’ from one
dissection level of this data array of 504 images.
The hand dissection data had two dimensions of
interaction: rotation around the long axis of the
hand and dissection depth to expose successive
layers of tissue. At each dissection layer, there are
72 images separated by 58 rotation, allowing one
complete rotation of the hand. Seven such dissec-
tion layers were photographed. Conceptually, this
array of images is organized in the computer as a
stack of seven rings, or a colosseum, so that the
learner traverses around the hand by moving around
a ring, and changes the depth by moving between
rings (Fig. 3).
Fig. 3. A conceptual illustration of the organization of the
images as a ‘‘colosseum.’’ Each floor of the colosseum corresponds
to a layer of the dissection. Traversal around the colosseum corre-
sponds to viewing rotated views at a particular dissection layer. One
such traversal is depicted in the image. The user begins at a skin
view, dissects one layer, rotates the hand through 16 different views
(corresponding to 808 of rotation), and then dissects further to layer
six (the superficial muscles), and finally rotates backward through
258 or five views. Adjacent images at one level are 58 apart, and
correspond to a stereo pair. [Color figure can be viewed in the
online issue, which is available at www.interscience.wiley.com.]
1Bandwidth refers to the amount of information, measured in
bits, which can be transmitted per time unit (usually seconds).
Latency refers to the amount of time that it takes for bits to get
from the source to the destination. Latency ranges from less than
1 msec in local area networks up to a couple of 100 msec for
overseas links via Internet2.
276 Dev et al.

Figure 3.
Fig. 2. Selected views from a 3608 revolution around a hand at multiple stages of dissection.
[Color figure can be viewed in the online issue, which is available at www.interscience.wiley.com.]
Fig. 1. Five representative frames from a sequence of rotated images rendered from CT slices of
the Visible Human female. [Color figure can be viewed in the online issue, which is available at
www.interscience.wiley.com.]

Technology to Support Viewing of Remote
Stereo Images
Stereo images were viewed on an appropriately
configured computer and monitor. The teacher and
students used similarly configured workstations. Each
workstation (cost about $1,200) consisted of a conven-
tional Windows computer (700 MHz Pentium3 pro-
cessor, 256 MB RAM, Windows NT) (Dell, Inc.,
Round Rock, Texas) augmented with a specialized
graphics card (Oxygen GVX1, 3dlabs, Milpitas, Cali-
fornia). Multiple people could view the screen, each
wearing specialized glasses that were automatically
controlled to alternate between left and right eye
vision. A NuVision stereo enabler unit (MacNaugh-
ton, Inc., Beaverton, Oregon) was connected to the
computer to control the glasses. Video conferencing
software (NetMeeting, Microsoft Corporation, Red-
mond, Washington) was used for communication
between workstations. Standard telephone lines were
used as audio channels to facilitate communication
between the students and the instructor. In our more
recent configurations, we use computers with a
2 GHz Pentium4 processor, 512 MB RAM, Windows
2000, or Windows XP operating system, and with
graphics cards ranging from Oxygen GVX1 to the
Wildcat4 (all graphics cards from Nvidia, Santa Clara,
California or 3dlabs, Milpitas, California).
The image database resided on SGI 3200 servers
(Silicon Graphics Inc., Mountain View, California),
on the IRIX unix operating system, locally at the
SUMMIT laboratory at Stanford, and remotely at
the Visualization Laboratory at University of Wiscon-
sin, La Crosse. The image database was accessed by
the students and teacher through a password-pro-
tected website. Each workstation accessed the Inter-
net through a 100-Mbps network interface card.
A Windows NT-based client software application,
the remote stereo viewer (RSV), developed by us for
this purpose, was created to provide access to the
hand and other similar data sets. Simple interaction
using the computer mouse controlled the rotated
view. Left/right mouse motion rotated the image by
shifting through consecutive images within each
rotational set. Vertical mouse motion shifted through
the successive layers of dissection. The client soft-
ware, on the learner’s computer, translates the
mouse motion into appropriate image requests to the
server. The server transmits each requested JPEG
image to the client for display. Adjacent images, sep-
arated by 58, are viewed simultaneously, producing a
stereo effect. A 3-D pointer, which approximates the
appropriate depth of anatomy at that point, was
developed for pointing out anatomical structures.
Technology to Support Video Conferencing
For our initial teaching session, with the complete
first year anatomy class, in 2001, we used a widely
available video conference program, NetMeeting,
with an inexpensive web camera, microphone, and
speaker at each client station. The video image
allowed the teacher to recognize the students in
each group, but was too small to support interaction
based on ‘‘body language.’’ The audio communica-
tion was acceptable. In subsequent teaching sessions,
we have utilized additional systems. We currently
use the open source, multisite, Windows-based,
video conference system, Access Grid, or its com-
mercial instance, supplied by Insors Corp. (inSORS
Integrated Communications, Inc., Chicago, Illinois).
Successful performance of the Access Grid for multi-
ple simultaneous users required a high bandwidth
available on Internet2.
Technology to Support Collaborative Learning
Three technologies were provided to support col-
laborative learning. First, video and audio conferenc-
ing allowed students (and the teacher) to discuss and
ask questions. Second, any learner could become the
‘‘leader’’ in selecting the image to be viewed and
have all other workstations ‘‘follow’’ automatically.
Third, the leader could control the 3-D pointer that
was visible on all follower workstations.
An important aspect of the collaboration technol-
ogy was that it allowed both independent and collab-
orative modes of viewing. In the collaborative view-
ing mode, clients had simultaneous access to the
server and hence the same set of images. One client
controls the image and dissection layer viewed,
while the others observed. Control of the image ori-
entation and pointer position can be easily shared
among clients, thereby creating a ‘‘virtual classroom,’’
in which anyone can lead the others through a set of
images. Assuming or relinquishing control is a simple
two-click process. Any learner could break off collab-
oration by choosing to leave the ‘‘class’’ and to have
independent, personal control of the image viewed.
A subtle aspect of the collaborative capability was
that, if the leader chose to move slowly through an
image sequence, a follower could change their view
locally and yet be brought back to the group view
whenever the leader moved to the next image.
System Configuration for Virtual Classroom
A typical configuration is summarized in Figure 4.
The teacher used a workstation configured for stereo
viewing (Fig. 4a). The image of anatomy is presented
in stereo. The emitter device on top of the monitor
278 Dev et al.

communicates with the specialized glasses, synchroniz-
ing the viewing eye with the display of the left or right
eye image. In Figure 4b, a small group of students is
at a similar workstation in a different building. They
also view the image in stereo. Both the teacher and
the students can control the image rotation independ-
ently. Figure 4c shows the teacher’s view of the stu-
dent groups. This is displayed to the teacher on a sec-
ond monitor. In this study, the students hear the
teacher but did not see him. In subsequent configura-
tions, the students were able to see and hear both the
teacher and the other student groups.
The three client workstations were used by stu-
dent groups in the Stanford University School of
Medicine Anatomy’s computer facility and a fourth
client was available at SUMMIT in a nearby build-
ing for use by the teacher.
A similar configuration, with only two worksta-
tions, was used when one teacher was instructing
another teacher, at a remote campus, in the use of
this new teaching tool. We tested various configura-
tions with multiple clients and different servers.
Use of Internet2
Interactive retrieval of a sequence of images results
in a transmission of bursts of large quantities of data.
(Typical burst bandwidth for our application was 70
Mbps). The commercial Internet does not support
individual use of such a high bandwidth, and results
in jerky displays and dropped images. We used Inter-
net2 (www.internet2.edu), a research and education
network, that is available to member universities
(Fig. 5). Internet2 typically supports ‘‘gigabit connec-
tivity’’ (1,000 Mbps bandwidth) to universities. It has
additional features, such as extended addressing and
security, which we did not use. However, we did use
the ‘‘multicast’’ feature that allowed the 3-D pointer
movement at one workstation to be displayed simul-
taneously at all workstations, and thus supporting col-
laborative discussion between users at different work-
stations at different locations.
Evaluation Instruments
We were interested in the performance of this
application over Internet2, in the students’ reaction
to this learning tool, and in user perception of its
utility as the performance of the network was
degraded. We used survey questionnaires, network
traffic measurement tools, and a 5-point perceptual
scale to assess user response.
Student Recruitment
The study was embedded in the required curricu-
lum for Human Gross Anatomy for first year medical
students. Of 86 first year medical students, 74 stu-
dents participated in the study, and completed the
questionnaire. A 20-min supplemental lesson on
hand anatomy was created and deployed via RSV.
This ‘‘virtual hand anatomy’’ session was held within
1 week of the students’ traditional lecture and labo-
ratory dissection session. Multiple 20-min sessions
with the same faculty member were conducted with
six or seven students each time over a 2-day period.
Sessions were typically about 20 min in length and
were divided into three parts. The first 2 min were
devoted to technological orientation, followed by
about 10 min of didactic, structured presentation by
Dr. Srivastava, one of the regular anatomy faculty.
During the last half of the session, control of hand
and pointer positions was transferred among students
in a more collaborative, open-ended manner. Quali-
tative feedback in the form of questionnaires was
collected from all students immediately after their
RSV session.
RESULTS
Student Response to Collaborative Learning
Using Stereo Images
Of all respondents, 93% professed a computer ex-
perience level of ‘‘moderate’’ or above (Table 1).
Over 86% of the students found the sessions ‘‘help-
ful’’ or ‘‘very helpful.’’ Students stated that they
would use the simulation for help in reviewing anat-
omy (89%), in a self-study mode (76%), and as part
of a collaborative session (39%).
The most appealing aspects of the RSV were the
capacity for stereoscopic viewing (89%) and the
potential to access the content remotely for review
within a flexible temporal framework (89%). Numer-
ous students requested access to other parts of the
body in a similar stereo format. Additional features
requested included image labels, an image-based
quiz, and availability of the program on the Macin-
tosh computer. A deterrent for home use was the
need for special equipment, such as the advanced
graphics card and the stereo glasses. Some found the
stereo viewing experience uncomfortable.
At the end of the quarter, the students completed
an evaluation of the course, which included some
questions about their stereo viewing lesson. The stu-
dents ranked dissection as the most useful learning
tool. Stereo images being ranked at the bottom, with
the stated reason that very few stereo images were
279Collaborative Learning Using Internet2

Fig. 4. A typical configuration for a ‘‘virtual classroom’’ session. a: The teacher uses a workstation
configured for stereo viewing. b: A group of students at a similar workstation in a different building. They
also view the image in stereo. c: A second monitor lets the teacher view all the three student groups.
[Color figure can be viewed in the online issue, which is available at www.interscience.wiley.com.]
Fig. 5. Network configuration to support access to
remotely stored RSV images and to support simultaneous
use of videoconferencing. [Color figure can be viewed in
the online issue, which is available at www.interscience.
wiley.com.]

provided (only hand dissection images were made
available). On the other hand, they ranked stereo
images as the highest among resources that they
wished to see increased.
Network Performance of the Application
The performance of the RSV application was also
measured during these interactive sessions. Trans-
port bursts of between 30 and 40 Mbps between the
servers (either at Stanford or Wisconsin) and the
classrooms were typical. When the Stanford server
was being used, the traffic flowed through the cam-
pus network. The backbone of this network provides
bandwidths in the order of gigabits and latencies of
less than 1 msec. When the server at Wisconsin was
being used, however, the network capabilities were
quite different: Stanford’s connection to the Inter-
net2 had a bandwidth limited to 622 Mbps in the
early experiments, and the delay between Stanford
and Wisconsin-LaCrosse is about 60 msec round trip.
The time between the learner’s query (mouse click)
and image retrieval and display was usually �7 msec
for images stored on the local Stanford server, and
<100 msec when accessing images stored at the Uni-
versity of Wisconsin. This delay is within the
bounds of satisfactory system performance. Table 2
shows the measured requirements for the user to
perceive a satisfactory performance. This perform-
ance was usually achieved even with the server at a
remote location.
Perceptual Response to Network Degrada-tion. In prior work (Dev et al., 2002), we have meas-
ured the user’s perceptual response to an application
as its performance degrades because of simulated
degradation of the network. For the RSV application,
we were able to show that the most significant net-
work parameter was the available bandwidth. In
actual usage, we expect that an increasing number of
clients will have the effect of reducing the bandwidth
available to any one client. For a satisfactory experi-
ence of collaboration, the most significant factor was
the time necessary to set up the direction of informa-
tion flow in multicast.
We attempted to determine how many client com-
puters could access the server simultaneously, when
both clients and server were in the same laboratory
(that is, we provided optimal network conditions).
Each client was programmed to request images as fast
as possible. We were able to test up to 32 simultane-
ous clients before the server stopped responding to
requests. For this test, we used a simulated user, that
is, a script that requests images as a user might. It is
possible that there would have been an earlier degra-
dation of perceived response with real users.
DISCUSSION
The potential for application of the RSV ranges
well beyond teaching anatomy to first year medical
students. Future uses could include demonstration
and sharing of clinical procedures, collaborative build-
ing of anatomical databases, or collection of a data-
base of anatomical variations for surgery. While we
have found much enthusiasm for the application, we
have also encountered some issues in its deployment.
The first issue encountered, in many schools where
we have tested the application, is the lack of a fully
featured high bandwidth Internet infrastructure. While
the campus backbone is often of adequate bandwidth,
many classroom buildings and most hospital areas pro-
vide only 10 Mbps ethernet connectivity. Multicast
transmission, a feature needed for the collaborative
capability of the RSV, is often disabled on many cam-
pus routers.
A second issue is the need for technical support.
Stereoscopic viewing of images from a remote data-
base, collaborative viewing, and dynamic assumption
and relinquishing of control of a viewing session, all
require technical support for configuration of the
learning stations as well as some technical expertise or
TABLE 1. Student Responses to a QuestionnairePresented at the End of the RSV Session
Number ofstudents
% ofstudents
DemographicsNumber of respondents 74 100Number with strong/moderatecomputer skills
69 93
AttitudeLiked the stereo images 66 89Liked the 3-D pointer 37 53
Usefulness in learningRated the stereo session ashelpful/very helpful
64 86
Added to their knowledge 50 68Helped in comprehendingstructure relationships
59 80
Cleared doubts or confusion 21 28Wanted to use it for review 66 89Wanted to use it for self study 56 76
Wanted to use it for self testing 53 72Valued collaborative style of learning 29 39
TABLE 2. Measured Parameters of the NetworkThat Are Required for the User to Rate the PerceptualExperience of Accessing Remote Images as Satisfactory
Bandwidth 40 MbpsPacket loss <0.01%Delay (one way) <100 msecMulticast setup time <1 sec
281Collaborative Learning Using Internet2
training of the users. Simplifying the configuration also
simplifies the technical expertise required, but with
corresponding loss of pedagogic power. For example,
it is possible to use the application without the stereo
viewing equipment and without any collaboration
requirement. It should be noted that we are in the
process of adding other features of pedagogic utility,
such as recording and play back of an interactive ses-
sion, and interactive labeling and sharing of labels
(Fig. 6). Effective use of these features will require
appropriate training of the faculty and student users.
A third issue is the reluctance of faculty to tamper
with the overloaded curriculum of the first year medi-
cal student. While we have used RSV successfully to
teach our medical students, it has been received
enthusiastically, and the sheer volume of material to
be taught and the need for many media types, includ-
ing the chalkboard, preclude widespread use of RSV
for the Human Gross Anatomy course. We expect to
see more use of the application in undergraduate
anatomy courses and in situations where access to
cadaver dissection is limited. Other possible uses for
an ‘‘interactive online cadaver lab’’ include resident
education, CME courses, simulation facilities, and in
conjunction with live surgery teaching sessions.
Although creating detailed and layered dissec-
tions, and accurately segmented, rotated views of
volume data, is a time-intensive process, we are con-
tinuing with other anatomical parts such that stu-
dents will have the ability to view and interact with
‘‘virtual cadaveric parts.’’ For example, a large data-
base of images (the entire Bassett collection, totaling
more than 1,500 high quality stereo images, from
‘‘head-to-toe’’) has been added, uploaded to our
server, and made available to students and faculty
through a Stanford password-protected web portal.
More recently, we have collaborated with Korean
researchers in creating interactive image data sets of
layered dissections of other body regions (Chung et al.,
unpublished material).
It is cumbersome for physicians to easily revisit
details of their anatomical training as they progress in
their careers. Computer-based approaches, such as
RSV, provide new opportunities for the teaching,
learning, and mastery of gross anatomy. It must be
emphasized that traditional methods (e.g., cadaver-
based) and technologically advanced methods (e.g.,
RSV application) are complementary; the RSV tool is
not intended to replace the ‘‘hands on’’ experience of
cadaver-based anatomy. The RSV technology does
offer students the ability to consolidate, review, and
expand upon what has been learned with cadavers.
In conclusion, the RSV application allows both in-
dependent and collaborative modes of learning
human anatomy over a high-speed, low-latency,
internet-based network. Deployment of the RSV de-
scribed here demonstrates the feasibility for up to 32
individuals on a local network to study dissection of
the same anatomical parts repeatedly and asynchro-
nously. In addition, students and teachers can inter-
act remotely and in real time, creating ‘‘virtual class-
rooms.’’ Thus, the RSV technology appears to be a
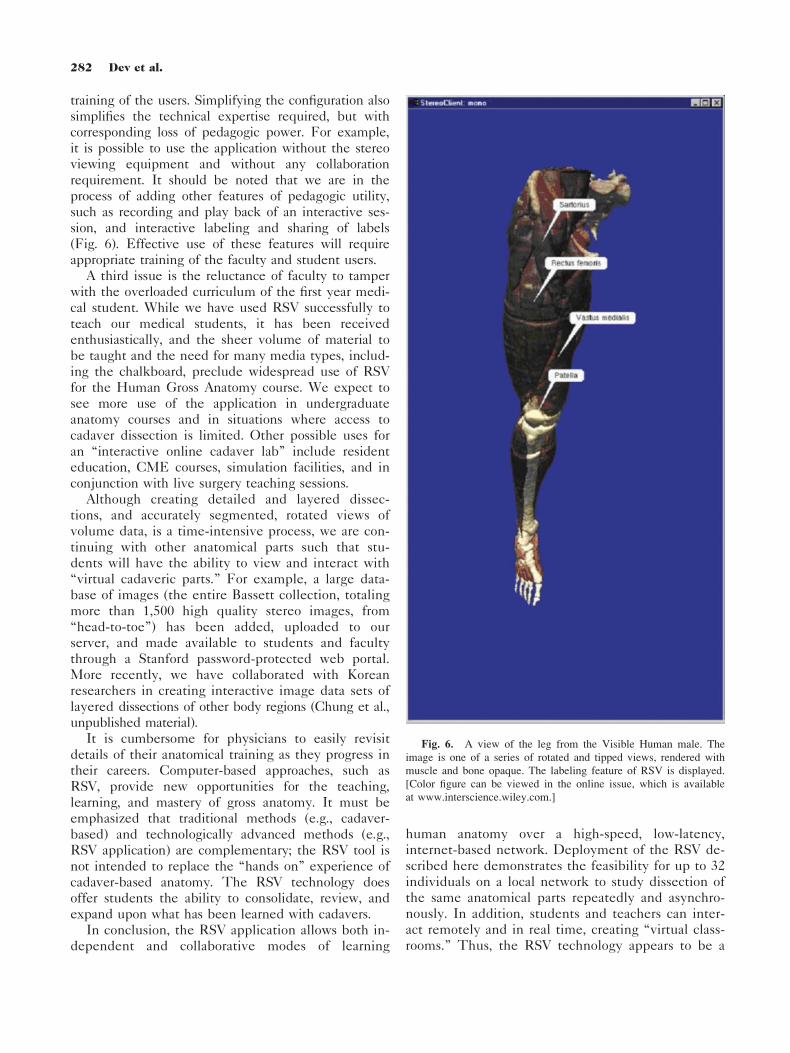
Fig. 6. A view of the leg from the Visible Human male. The
image is one of a series of rotated and tipped views, rendered with
muscle and bone opaque. The labeling feature of RSV is displayed.
[Color figure can be viewed in the online issue, which is available
at www.interscience.wiley.com.]
282 Dev et al.

promising addition to the traditional suite of tools
used in teaching gross anatomy.
REFERENCES
Ackerman MJ. 1999. The Visible Human Project: A resource
for education. Acad Med 74:667–670.
Dev P, Senger S. 2005. The visible human and digital anatomy
learning initiative. Stud Health Technol Inform 111:108–114.
Dev P, Harris D, Gutierrez D, Shah A, Senger S. 2002. End-
to-end performance measurement of internet-based medi-
cal applications. Proc AMIA Symp 2002:205–209.
Heinrichs WL, Srivastava S, Dev P, Chase RA. 2004. LUCY:
A 3-D pelvic model for surgical simulation. J Am Assoc
Gynecol Laparosc 11:326–331.
Hoffman H, Murray M, Danks M, Prayaga R, Irwin A, Vu D.
1997. A flexible and extensible object-oriented 3D archi-
tecture: Application in the development of virtual anatomy
lessons. Stud Health Technol Inform 39:461–466.
Jastrow H, Vollrath L. 2002. Anatomy online: Presentation of
a detailed WWW atlas of human gross anatomy—reference
for medical education. Clin Anat 15:402–408.
Park JS, Chung MS, Hwang SB, Lee YS, Har DH, Park HS.
2005. Visible Korean human: Improved serially sectioned
images of the entire body. IEEE Trans Med Imaging 24:
352–360.
Schubert R, Schiemann T, Tiede U, Hohne KH. 1997. Appli-
cations and perspectives in anatomical 3-dimensional mod-
elling of the visible human with VOXEL-MAN. Acta Anat
(Basel) 160:123–131.
Senger S. 1999. Visualizing and segmenting large volume data
sets. IEEE Comput Graph Appl Mag 19:32–37.
Spitzer V, Ackerman MJ, Scherzinger AL, Whitlock D. 1996.
The visible human male: A technical report. J Am Med
Inform Assoc 3:118–130.
283Collaborative Learning Using Internet2