Embed Size (px)
Citation preview
Collaborative Studies: XRF Component of Round 1 Study Current Status of PQRI Round 2 Study Donna Seibert on behalf of the Technical/Analytical Challenges Sub-team to the Coalition for Rational Implementation November 9, 2016
X-Ray Fluorescence Analyses of Elemental Impurities: Round 1 Experimental and Results Experimental slides courtesy of Thanh Nguyen
Subject Comments
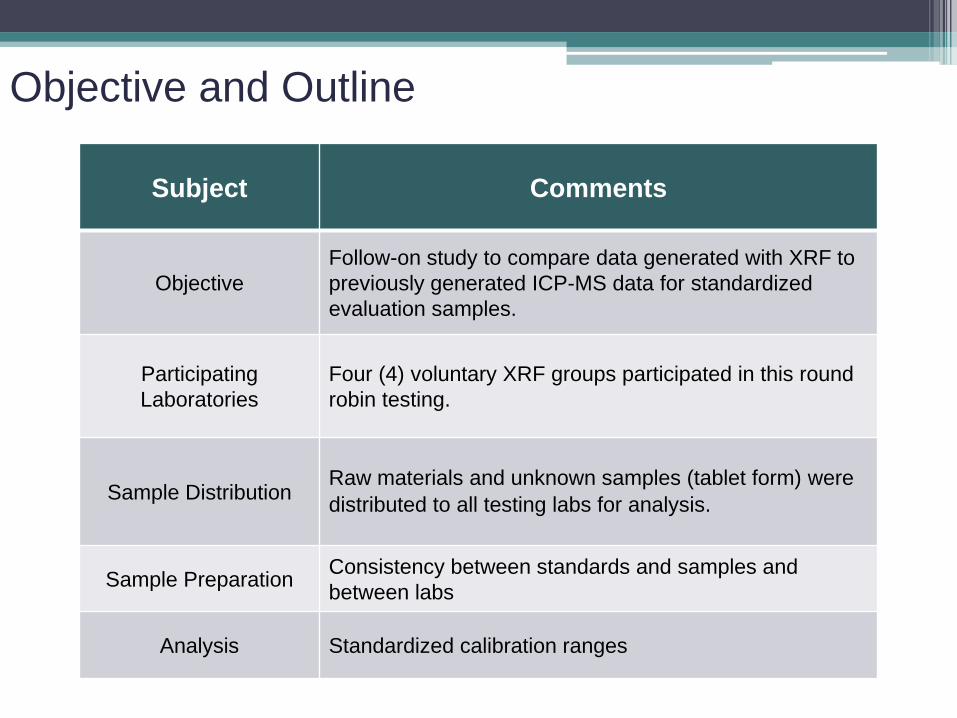
Objective Follow-on study to compare data generated with XRF to previously generated ICP-MS data for standardized evaluation samples.
Participating Laboratories
Four (4) voluntary XRF groups participated in this round robin testing.
Sample Distribution Raw materials and unknown samples (tablet form) were distributed to all testing labs for analysis.
Sample Preparation Consistency between standards and samples and between labs
Analysis Standardized calibration ranges
Objective and Outline
Preparation of Combined Standard Solutions
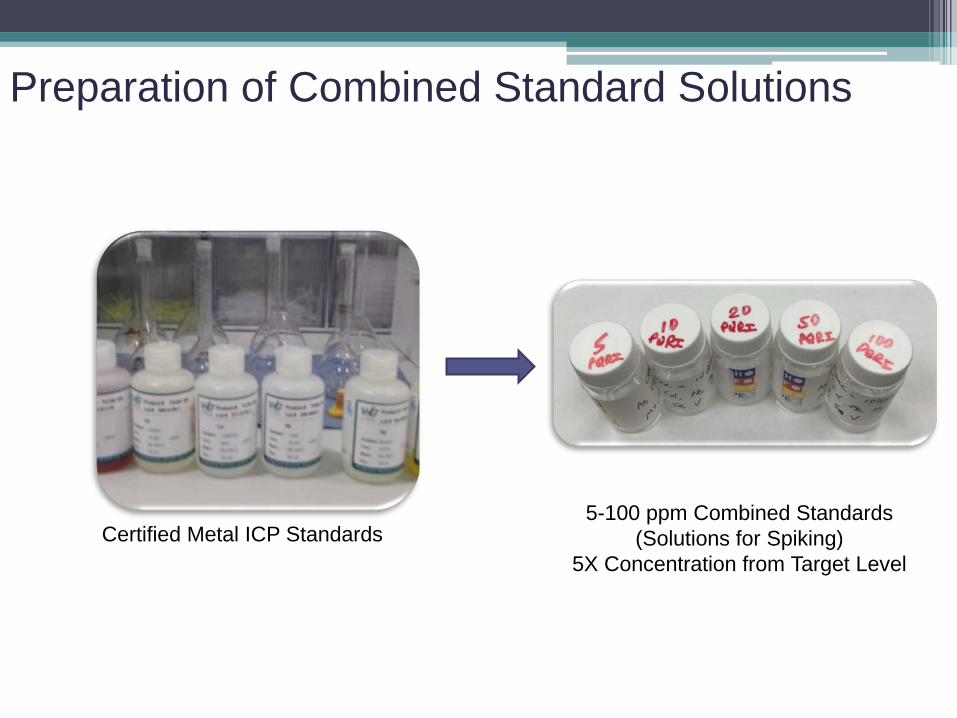
Certified Metal ICP Standards 5-100 ppm Combined Standards
(Solutions for Spiking) 5X Concentration from Target Level
Preparation of Solid Matrix for Standards
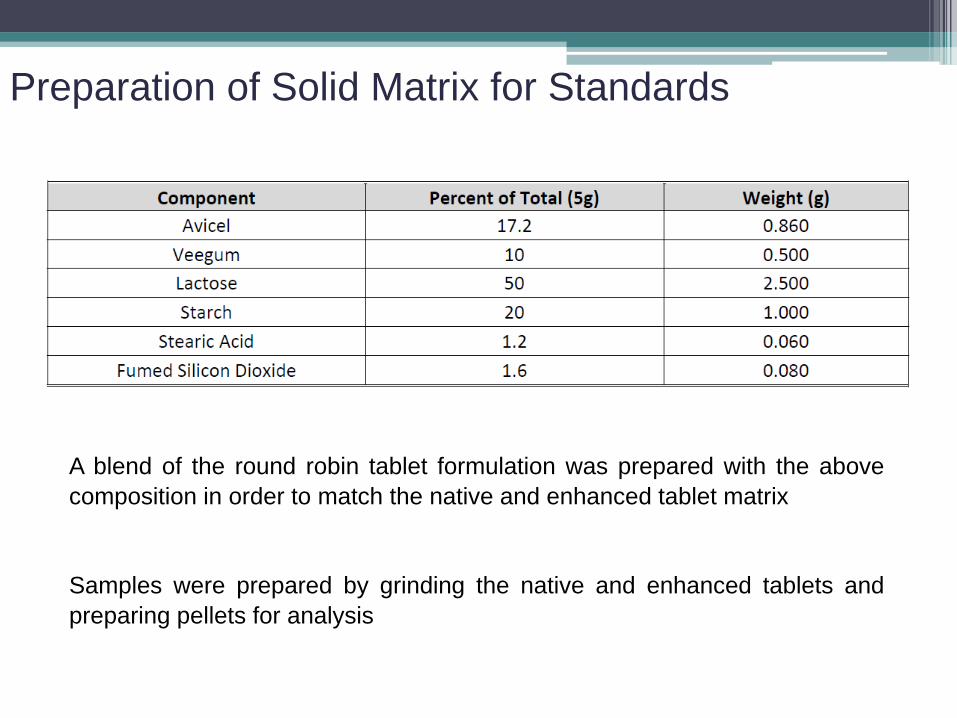
A blend of the round robin tablet formulation was prepared with the above composition in order to match the native and enhanced tablet matrix
Samples were prepared by grinding the native and enhanced tablets and preparing pellets for analysis
Spike and Mix Standards in Matrix
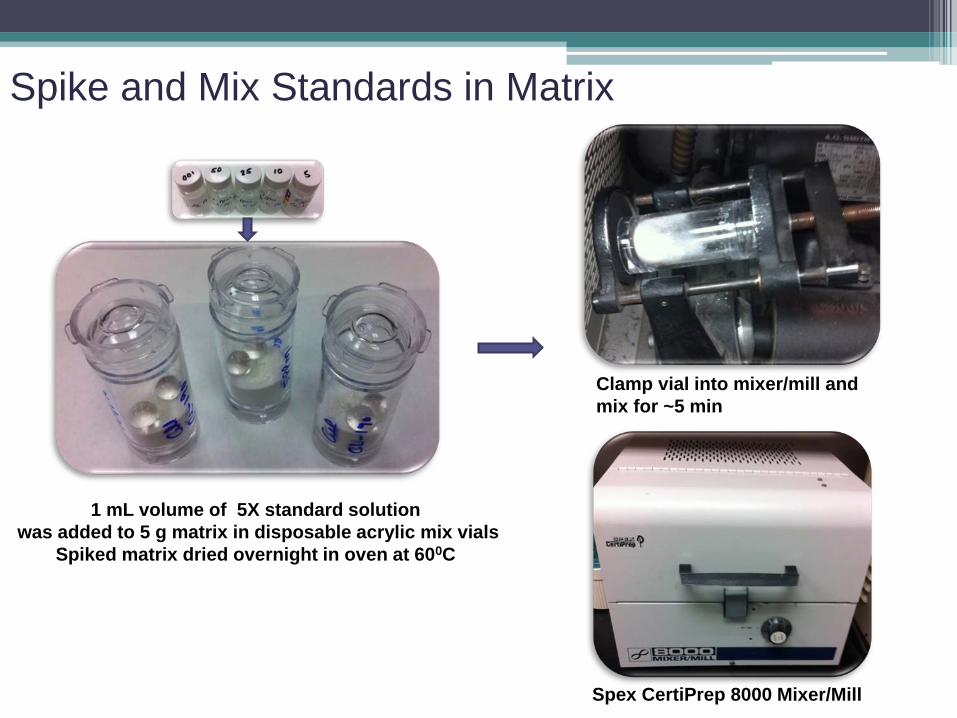
1 mL volume of 5X standard solution was added to 5 g matrix in disposable acrylic mix vials
Spiked matrix dried overnight in oven at 600C
Clamp vial into mixer/mill and mix for ~5 min
Spex CertiPrep 8000 Mixer/Mill
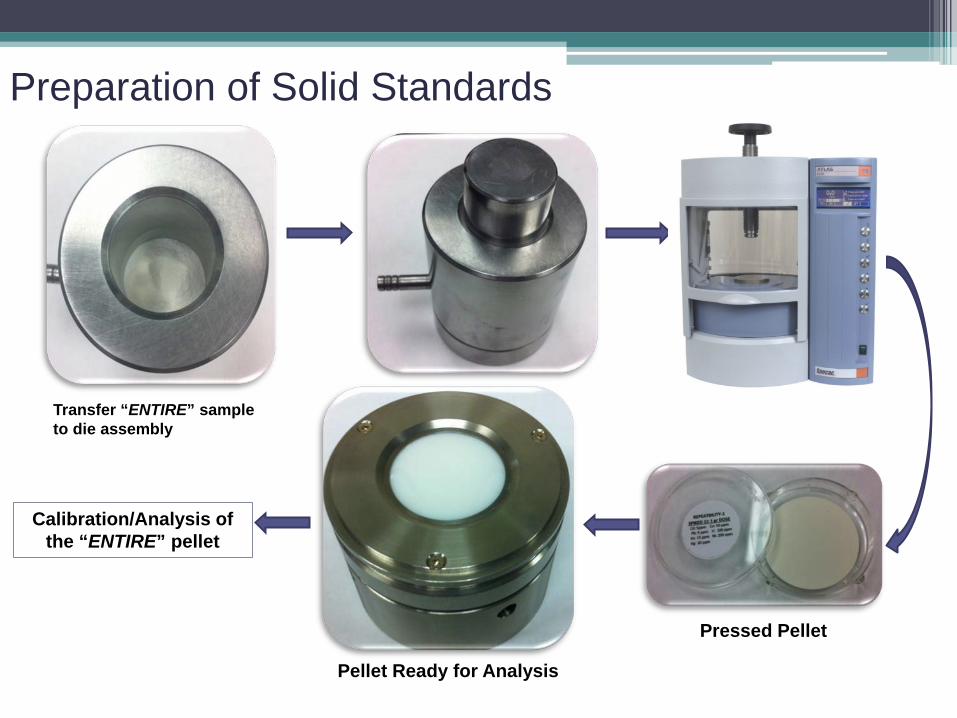
Preparation of Solid Standards
Pellet Ready for Analysis
Calibration/Analysis of the “ENTIRE” pellet
Transfer “ENTIRE” sample to die assembly
Pressed Pellet
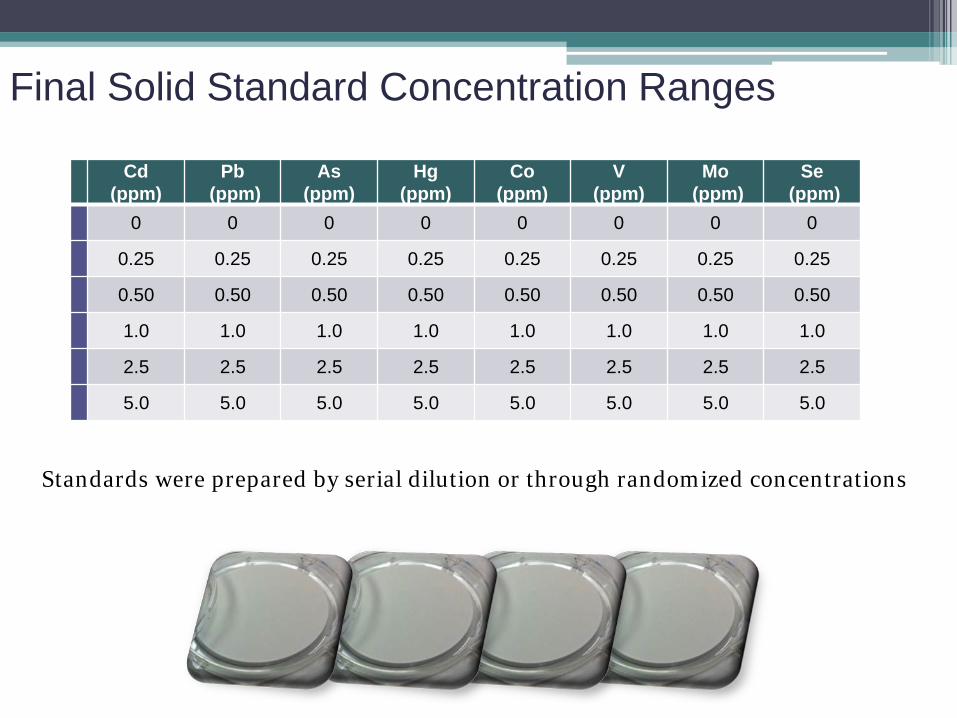
Final Solid Standard Concentration Ranges
Cd (ppm)
Pb (ppm)
As (ppm)
Hg (ppm)
Co (ppm)
V (ppm)
Mo (ppm)
Se (ppm)
0 0 0 0 0 0 0 0
0.25 0.25 0.25 0.25 0.25 0.25 0.25 0.25
0.50 0.50 0.50 0.50 0.50 0.50 0.50 0.50
1.0 1.0 1.0 1.0 1.0 1.0 1.0 1.0
2.5 2.5 2.5 2.5 2.5 2.5 2.5 2.5
5.0 5.0 5.0 5.0 5.0 5.0 5.0 5.0
Standards were prepared by serial dilution or through randomized concentrations
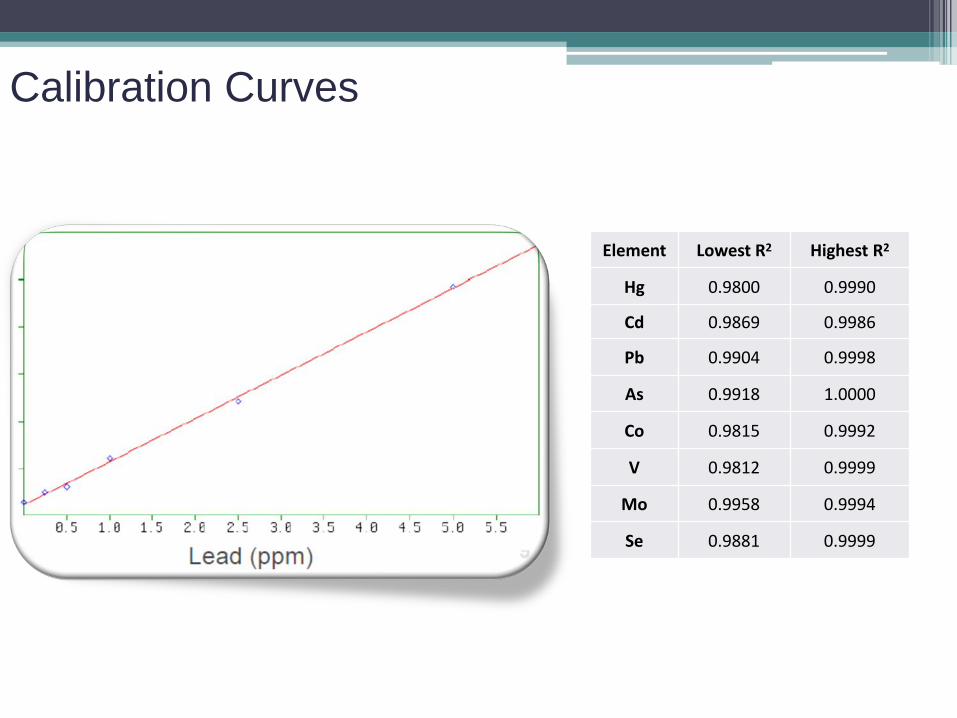
Calibration Curves
Element Lowest R2 Highest R2
Hg 0.9800 0.9990
Cd 0.9869 0.9986
Pb 0.9904 0.9998
As 0.9918 1.0000
Co 0.9815 0.9992
V 0.9812 0.9999
Mo 0.9958 0.9994
Se 0.9881 0.9999
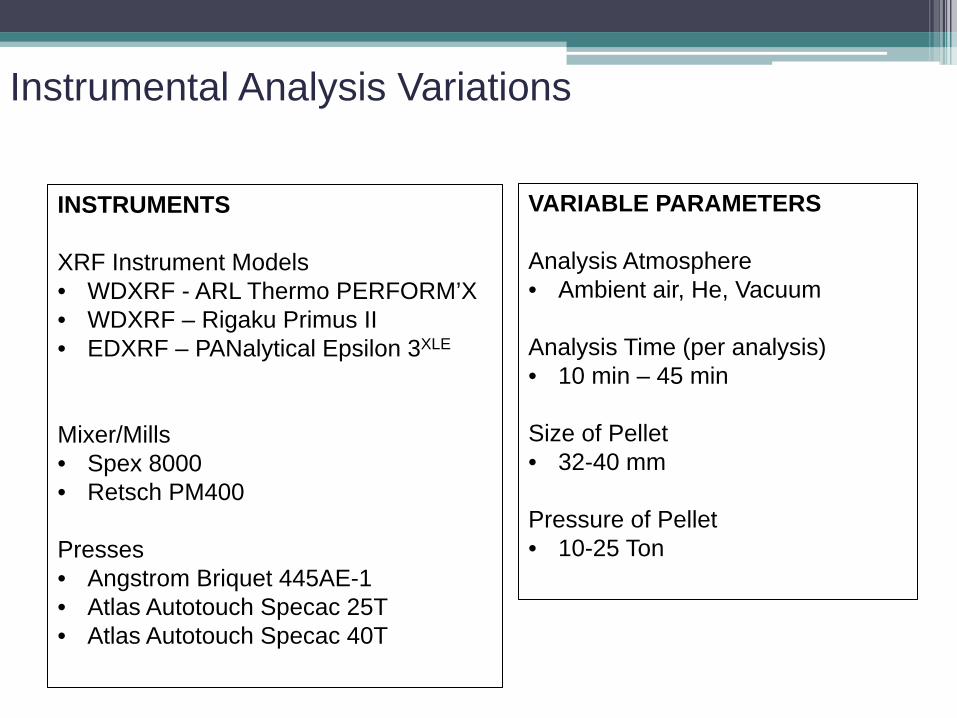
Instrumental Analysis Variations
INSTRUMENTS XRF Instrument Models • WDXRF - ARL Thermo PERFORM’X • WDXRF – Rigaku Primus II • EDXRF – PANalytical Epsilon 3XLE
Mixer/Mills • Spex 8000 • Retsch PM400
Presses • Angstrom Briquet 445AE-1 • Atlas Autotouch Specac 25T • Atlas Autotouch Specac 40T
VARIABLE PARAMETERS Analysis Atmosphere • Ambient air, He, Vacuum Analysis Time (per analysis) • 10 min – 45 min Size of Pellet • 32-40 mm Pressure of Pellet • 10-25 Ton
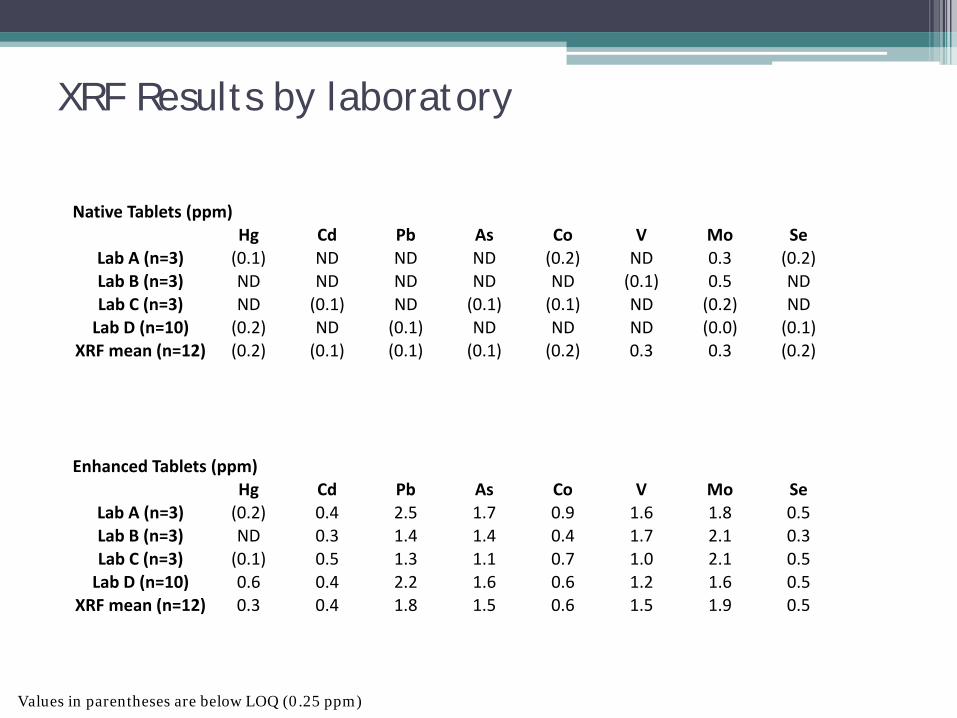
XRF Results by laboratory
Native Tablets (ppm) Hg Cd Pb As Co V Mo Se
Lab A (n=3) (0.1) ND ND ND (0.2) ND 0.3 (0.2) Lab B (n=3) ND ND ND ND ND (0.1) 0.5 ND Lab C (n=3) ND (0.1) ND (0.1) (0.1) ND (0.2) ND
Lab D (n=10) (0.2) ND (0.1) ND ND ND (0.0) (0.1) XRF mean (n=12) (0.2) (0.1) (0.1) (0.1) (0.2) 0.3 0.3 (0.2)
Enhanced Tablets (ppm) Hg Cd Pb As Co V Mo Se
Lab A (n=3) (0.2) 0.4 2.5 1.7 0.9 1.6 1.8 0.5 Lab B (n=3) ND 0.3 1.4 1.4 0.4 1.7 2.1 0.3 Lab C (n=3) (0.1) 0.5 1.3 1.1 0.7 1.0 2.1 0.5
Lab D (n=10) 0.6 0.4 2.2 1.6 0.6 1.2 1.6 0.5 XRF mean (n=12) 0.3 0.4 1.8 1.5 0.6 1.5 1.9 0.5
Values in parentheses are below LOQ (0.25 ppm)
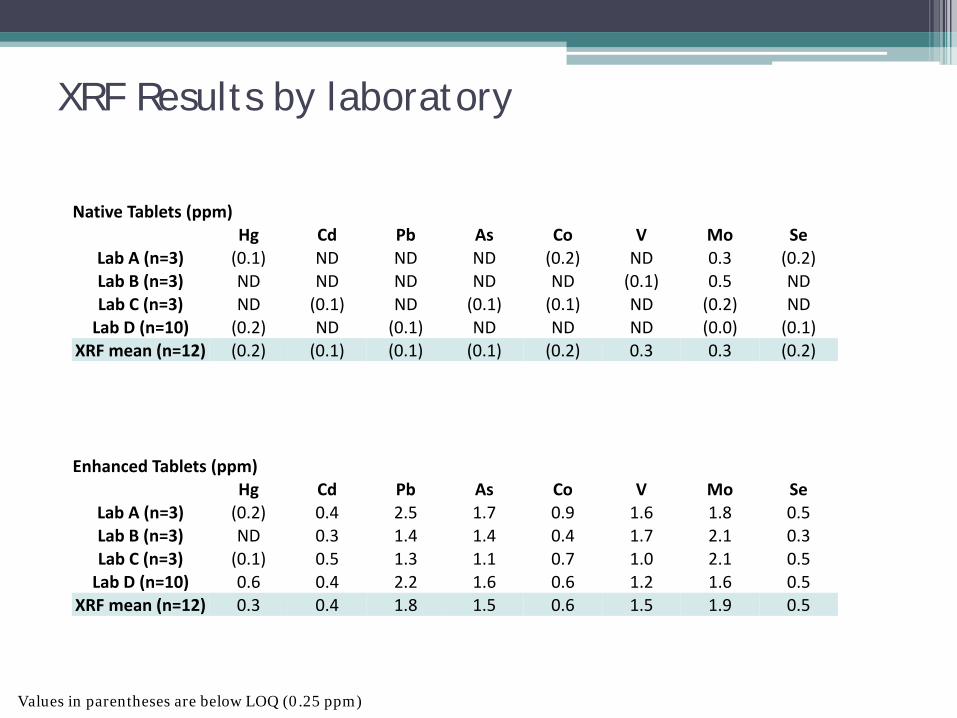
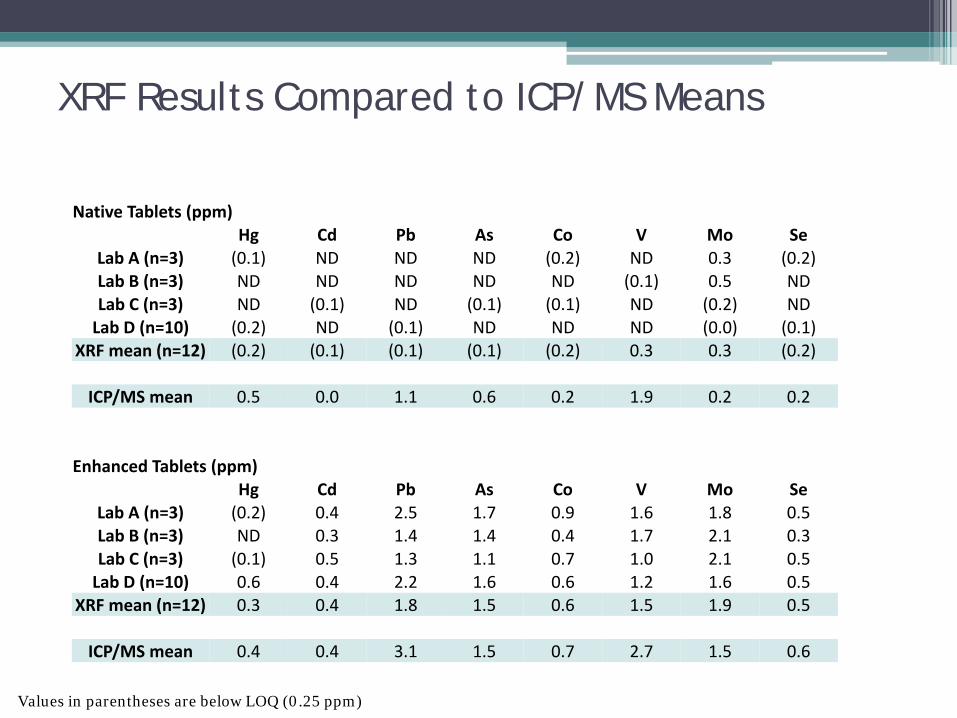
XRF Results Compared to ICP/MS Means
Native Tablets (ppm) Hg Cd Pb As Co V Mo Se
Lab A (n=3) (0.1) ND ND ND (0.2) ND 0.3 (0.2) Lab B (n=3) ND ND ND ND ND (0.1) 0.5 ND Lab C (n=3) ND (0.1) ND (0.1) (0.1) ND (0.2) ND
Lab D (n=10) (0.2) ND (0.1) ND ND ND (0.0) (0.1) XRF mean (n=12) (0.2) (0.1) (0.1) (0.1) (0.2) 0.3 0.3 (0.2)
ICP/MS mean 0.5 0.0 1.1 0.6 0.2 1.9 0.2 0.2
Enhanced Tablets (ppm) Hg Cd Pb As Co V Mo Se
Lab A (n=3) (0.2) 0.4 2.5 1.7 0.9 1.6 1.8 0.5 Lab B (n=3) ND 0.3 1.4 1.4 0.4 1.7 2.1 0.3 Lab C (n=3) (0.1) 0.5 1.3 1.1 0.7 1.0 2.1 0.5
Lab D (n=10) 0.6 0.4 2.2 1.6 0.6 1.2 1.6 0.5 XRF mean (n=12) 0.3 0.4 1.8 1.5 0.6 1.5 1.9 0.5
ICP/MS mean 0.4 0.4 3.1 1.5 0.7 2.7 1.5 0.6
Values in parentheses are below LOQ (0.25 ppm)
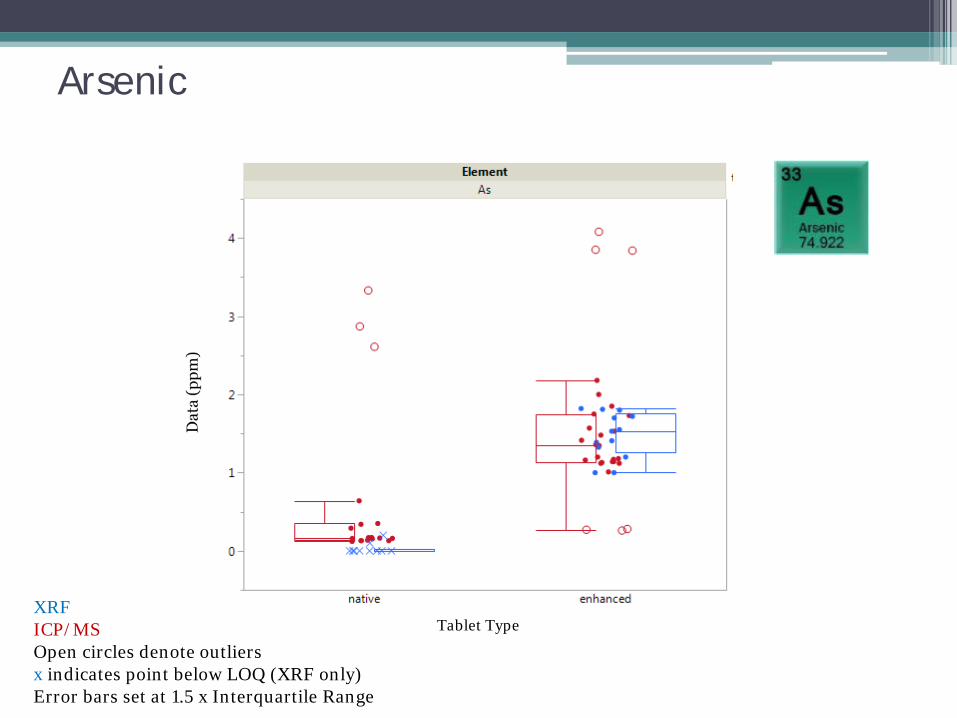
Arsenic
Tablet Type XRF ICP/MS Open circles denote outliers x indicates point below LOQ (XRF only) Error bars set at 1.5 x Interquartile Range
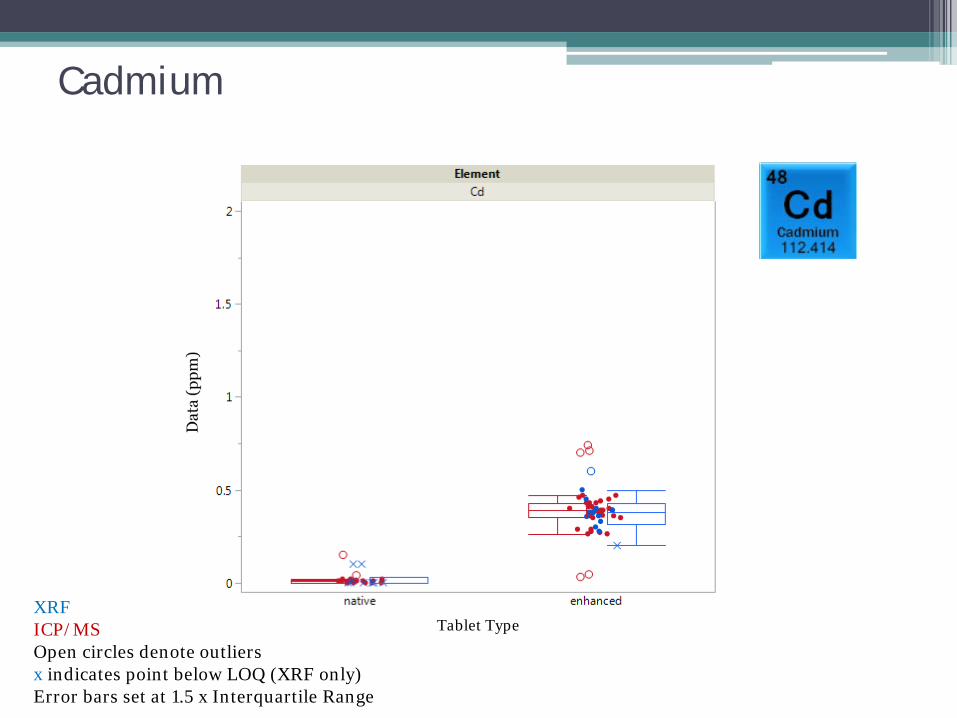
Cadmium
Tablet Type XRF ICP/MS Open circles denote outliers x indicates point below LOQ (XRF only) Error bars set at 1.5 x Interquartile Range
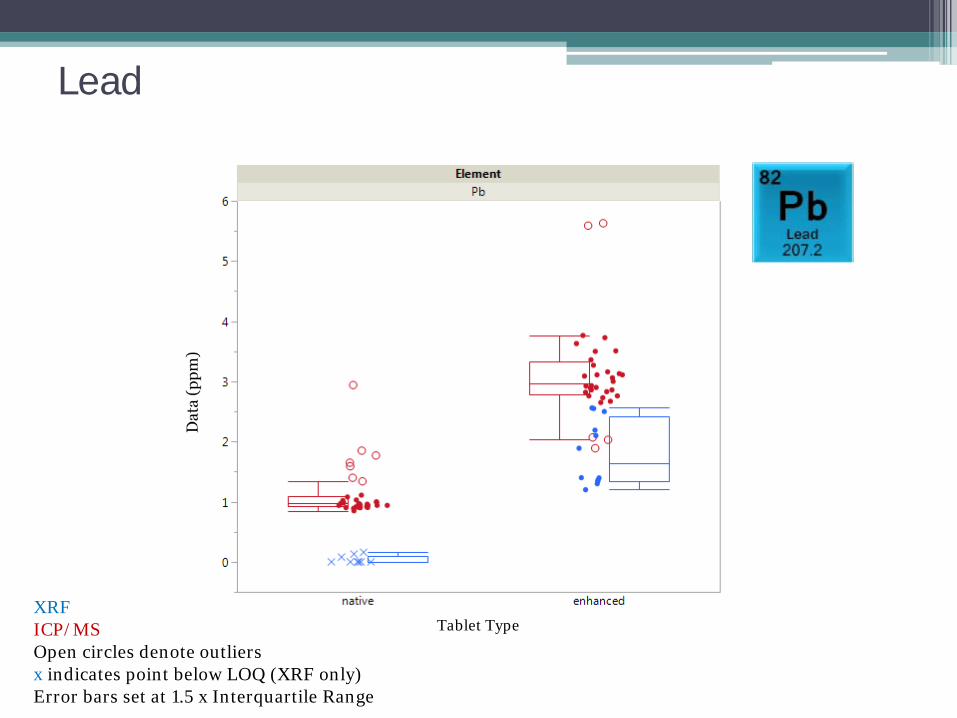
Lead
Tablet Type XRF ICP/MS Open circles denote outliers x indicates point below LOQ (XRF only) Error bars set at 1.5 x Interquartile Range
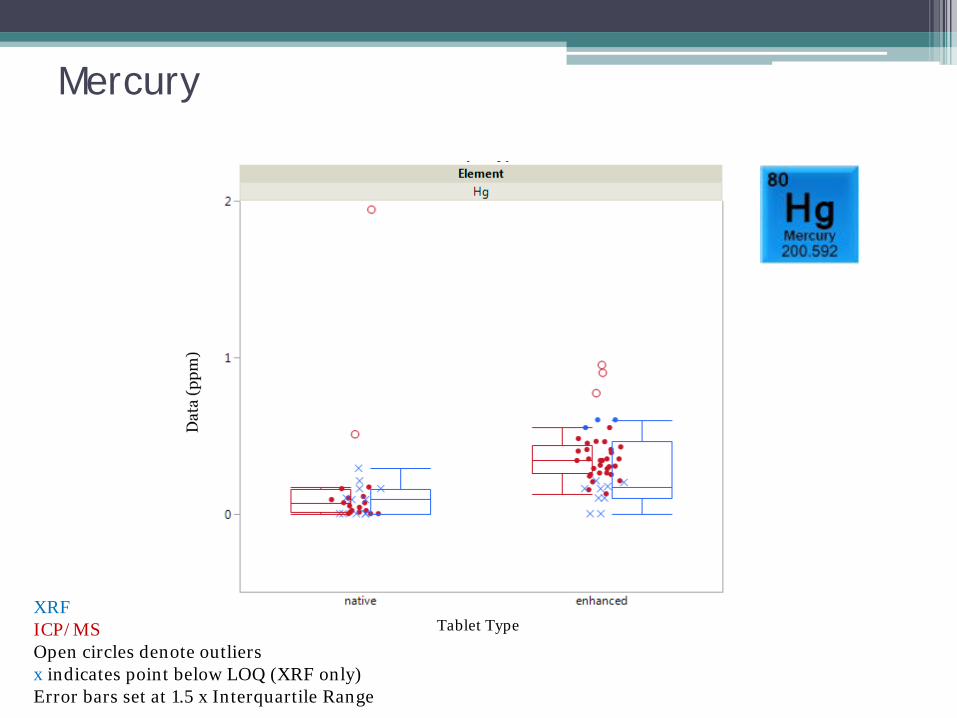
Mercury
Tablet Type XRF ICP/MS Open circles denote outliers x indicates point below LOQ (XRF only) Error bars set at 1.5 x Interquartile Range
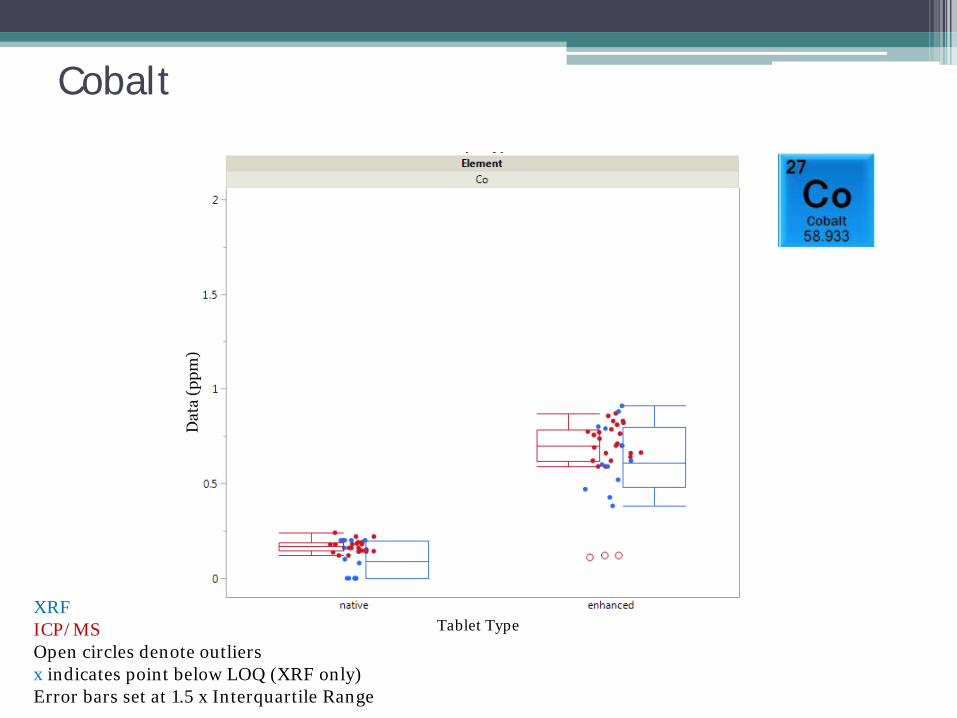
Cobalt
Tablet Type XRF ICP/MS Open circles denote outliers x indicates point below LOQ (XRF only) Error bars set at 1.5 x Interquartile Range
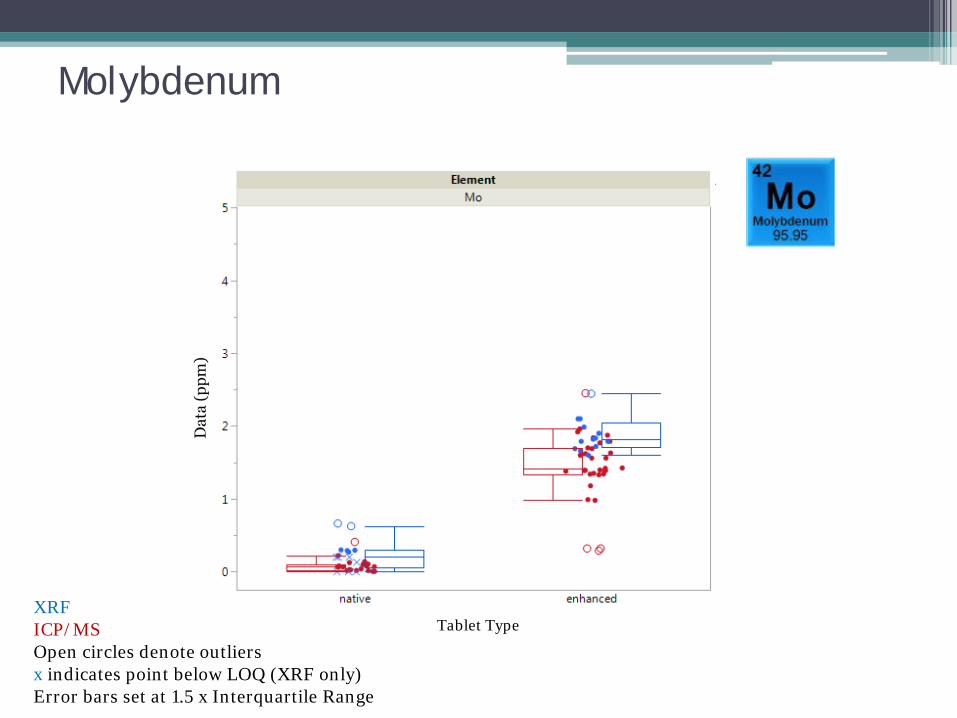
Molybdenum
Tablet Type XRF ICP/MS Open circles denote outliers x indicates point below LOQ (XRF only) Error bars set at 1.5 x Interquartile Range
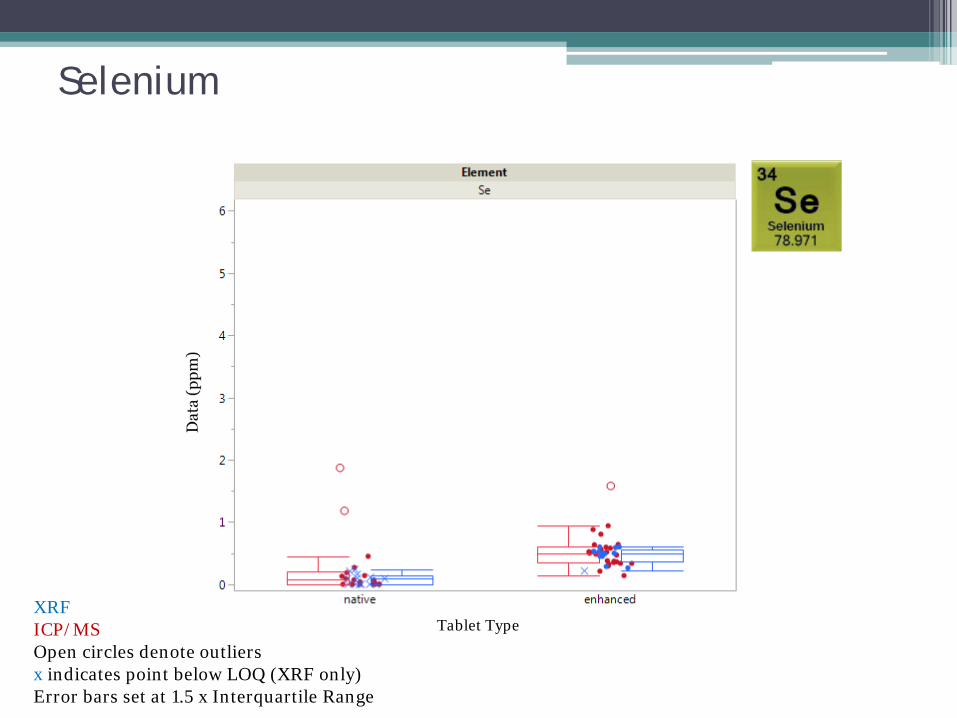
Selenium
Tablet Type XRF ICP/MS Open circles denote outliers x indicates point below LOQ (XRF only) Error bars set at 1.5 x Interquartile Range
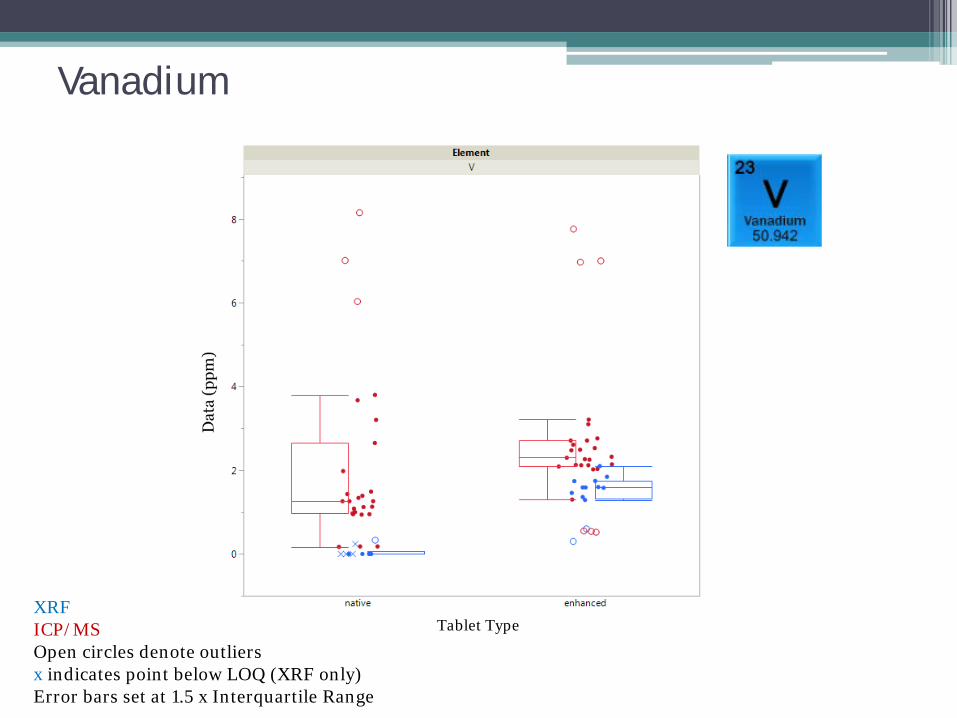
Vanadium
Tablet Type XRF ICP/MS Open circles denote outliers x indicates point below LOQ (XRF only) Error bars set at 1.5 x Interquartile Range
Conclusions
• Results generally comparable to ICP-MS • Bias from background levels in materials used to
make standards ▫ Apparent in Pb and V results ▫ Standard additions in calibration setup could
correct for this bias • When sample is not limited, XRF offers quick
and economical analysis ▫ Once calibration is established, only check
standards need to be analyzed
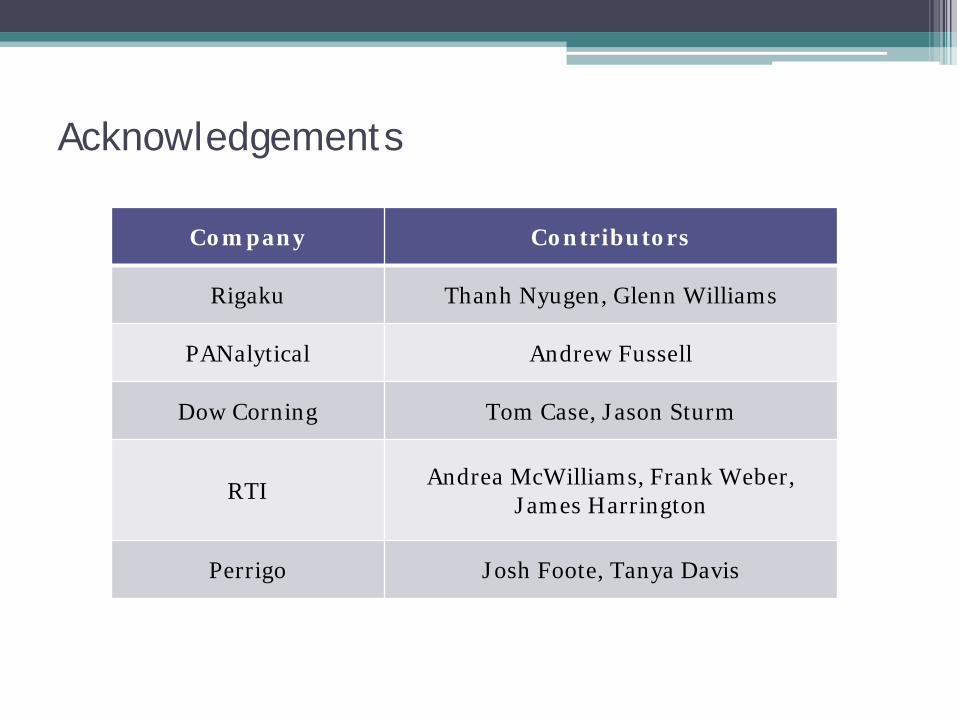
Acknowledgements
Company Contributors
Rigaku Thanh Nyugen, Glenn Williams
PANalytical Andrew Fussell
Dow Corning Tom Case, Jason Sturm
RTI Andrea McWilliams, Frank Weber, James Harrington
Perrigo Josh Foote, Tanya Davis
PQRI Sponsored Study Concept Elemental Impurities in Pharmaceuticals Second Round Experimental Outline
Slides courtesy of James Harrington
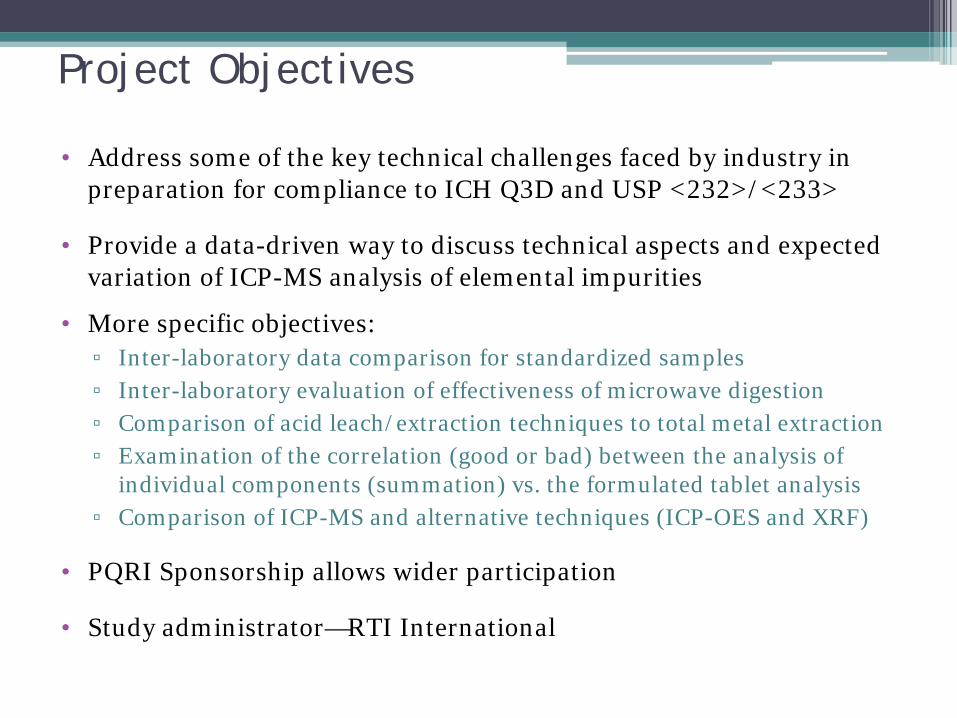
Project Objectives
• Address some of the key technical challenges faced by industry in preparation for compliance to ICH Q3D and USP <232>/<233>
• Provide a data-driven way to discuss technical aspects and expected variation of ICP-MS analysis of elemental impurities
• More specific objectives: ▫ Inter-laboratory data comparison for standardized samples ▫ Inter-laboratory evaluation of effectiveness of microwave digestion ▫ Comparison of acid leach/extraction techniques to total metal extraction ▫ Examination of the correlation (good or bad) between the analysis of
individual components (summation) vs. the formulated tablet analysis ▫ Comparison of ICP-MS and alternative techniques (ICP-OES and XRF)
• PQRI Sponsorship allows wider participation
• Study administrator—RTI International
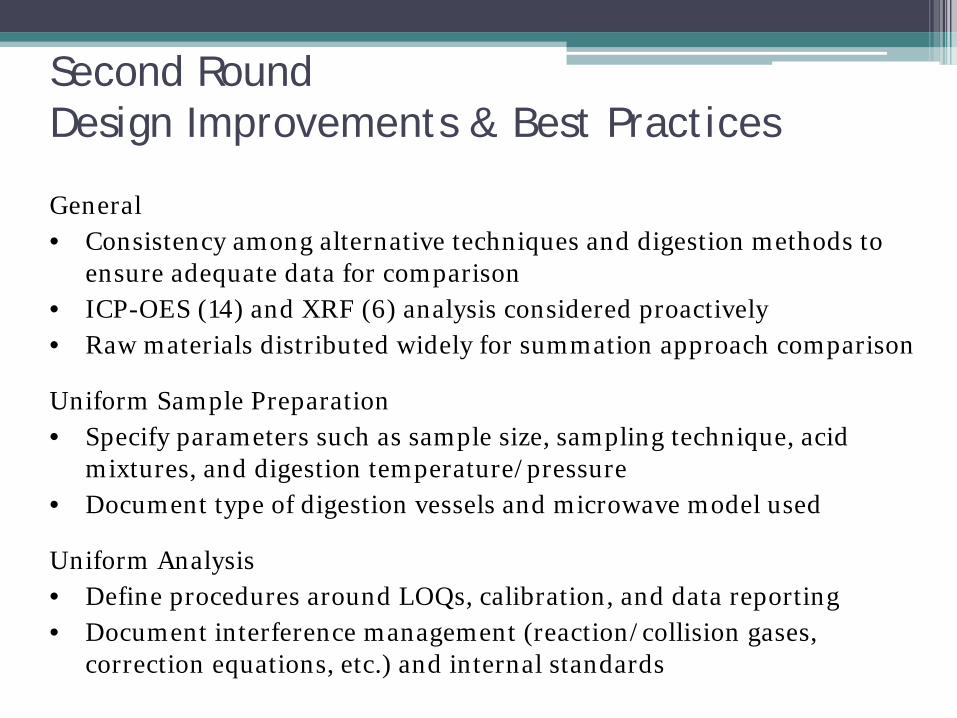
Second Round Design Improvements & Best Practices
General • Consistency among alternative techniques and digestion methods to
ensure adequate data for comparison • ICP-OES (14) and XRF (6) analysis considered proactively • Raw materials distributed widely for summation approach comparison
Uniform Sample Preparation • Specify parameters such as sample size, sampling technique, acid
mixtures, and digestion temperature/pressure • Document type of digestion vessels and microwave model used
Uniform Analysis • Define procedures around LOQs, calibration, and data reporting • Document interference management (reaction/collision gases,
correction equations, etc.) and internal standards
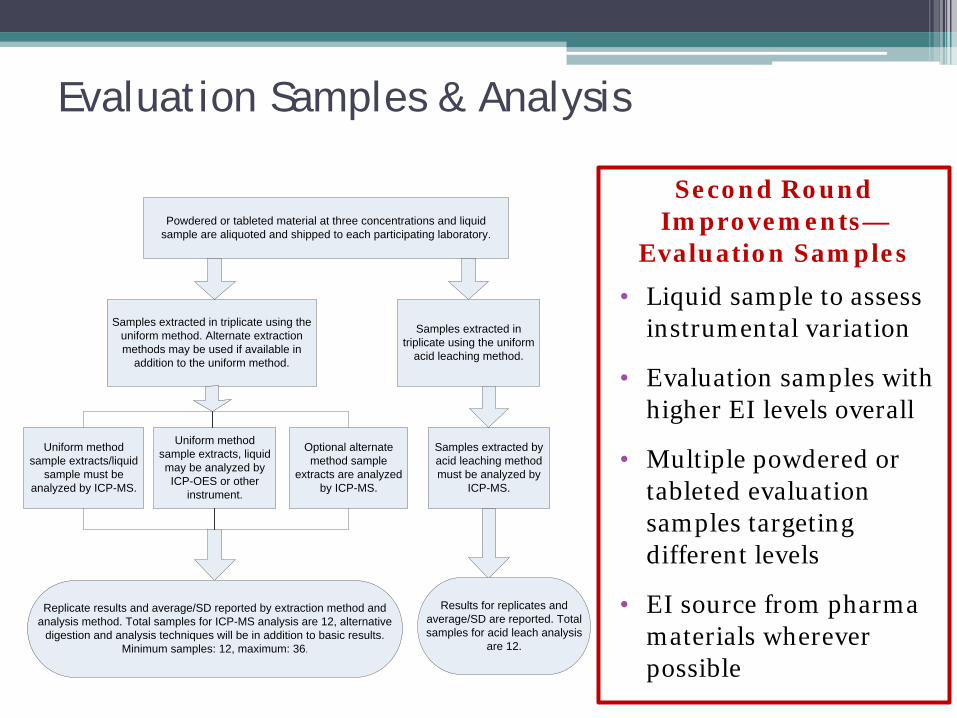
Evaluation Samples & Analysis
Second Round Improvements—
Evaluation Samples
• Liquid sample to assess instrumental variation
• Evaluation samples with higher EI levels overall
• Multiple powdered or tableted evaluation samples targeting different levels
• EI source from pharma materials wherever possible
Powdered or tableted material at three concentrations and liquid sample are aliquoted and shipped to each participating laboratory.
Samples extracted in triplicate using the uniform method. Alternate extraction methods may be used if available in
addition to the uniform method.
Uniform method sample extracts/liquid
sample must be analyzed by ICP-MS.
Optional alternate method sample
extracts are analyzed by ICP-MS.
Replicate results and average/SD reported by extraction method and analysis method. Total samples for ICP-MS analysis are 12, alternative
digestion and analysis techniques will be in addition to basic results.Minimum samples: 12, maximum: 36.
Uniform method sample extracts, liquid may be analyzed by ICP-OES or other
instrument.
Samples extracted in triplicate using the uniform
acid leaching method.
Samples extracted by acid leaching method must be analyzed by
ICP-MS.
Results for replicates and average/SD are reported. Total samples for acid leach analysis
are 12.
Formulation Challenges
• Ideal solid formulation is tableted ▫ To preserve homogeneity
• Pharmaceutical materials that contain significant, known levels have been elusive ▫ Few materials contain significant As & Hg
• Combination of materials must have ▫ Favorable mixing & flow properties ▫ Compressibility
• Current path for solid formulations ▫ Tablets similar to the first round tablets ▫ Include small amounts of XRF standards ▫ Three levels of elemental impurities
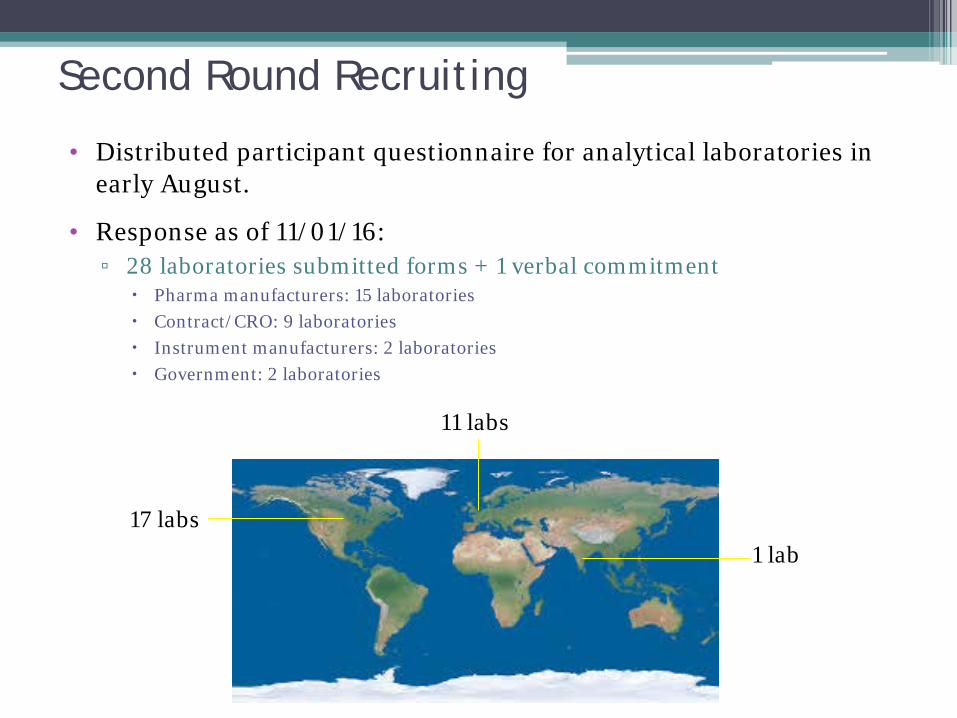
Second Round Recruiting
• Distributed participant questionnaire for analytical laboratories in early August.
• Response as of 11/01/16: ▫ 28 laboratories submitted forms + 1 verbal commitment
Pharma manufacturers: 15 laboratories Contract/CRO: 9 laboratories Instrument manufacturers: 2 laboratories Government: 2 laboratories
1 lab
11 labs
17 labs
Next steps:
• Finalize formulations • Produce tablets and liquid sample
▫ Partnering with Liverpool John Moore’s University
• Uniform method and acid leach method development ▫ To be developed with finalized tablets prior to distribution
• Still seeking participant laboratories! ▫ Can accommodate up to 50 labs
Acknowledgements
• James Harrington, RTI • Frank Weber, RTI • Phil Riby, Liverpool John Moore’s University • Dave Schoneker, Colorcon • PQRI • TAC Team members • All participating labs
Detail Slides
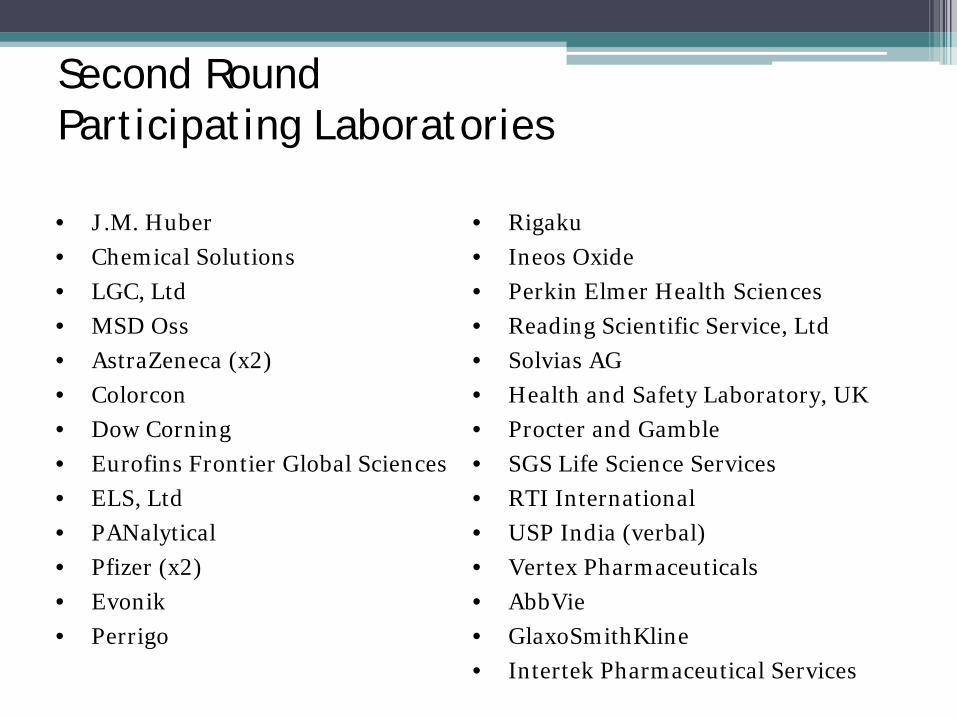
Second Round Participating Laboratories
• J.M. Huber • Chemical Solutions • LGC, Ltd • MSD Oss • AstraZeneca (x2) • Colorcon • Dow Corning • Eurofins Frontier Global Sciences • ELS, Ltd • PANalytical • Pfizer (x2) • Evonik • Perrigo
• Rigaku • Ineos Oxide • Perkin Elmer Health Sciences • Reading Scientific Service, Ltd • Solvias AG • Health and Safety Laboratory, UK • Procter and Gamble • SGS Life Science Services • RTI International • USP India (verbal) • Vertex Pharmaceuticals • AbbVie • GlaxoSmithKline • Intertek Pharmaceutical Services
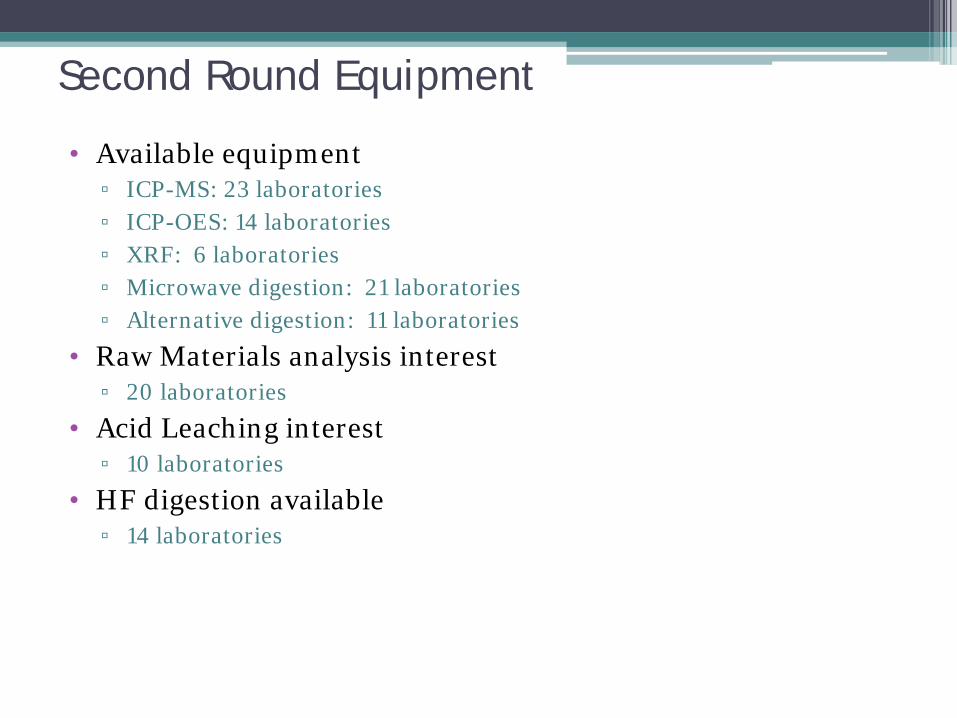
Second Round Equipment
• Available equipment ▫ ICP-MS: 23 laboratories ▫ ICP-OES: 14 laboratories ▫ XRF: 6 laboratories ▫ Microwave digestion: 21 laboratories ▫ Alternative digestion: 11 laboratories
• Raw Materials analysis interest ▫ 20 laboratories
• Acid Leaching interest ▫ 10 laboratories
• HF digestion available ▫ 14 laboratories


![Basics of Handheld XRF - Berg Engineering | Ultrasonic ... · Basics of Handheld XRF. ... XRF Spectrum L to R = Cr, Co, Ni, and Mo 200 250 300 350 ... 2009 Simple XRF Basics [Read-Only]](https://img.pdfslide.net/doc/110x75/5af4ea757f8b9a9e598d5e09/basics-of-handheld-xrf-berg-engineering-ultrasonic-of-handheld-xrf-.jpg)