Embed Size (px)
Citation preview
1
Collecting Data - Science Institute 2013-2014
+
Grade Level: 3-12
Activity Duration:
Introduction: 5 minutes
Part 1: 15 minutes
Part 2: 20 minutes
Part 3: 20 minutes
Wrap-up: 10 minutes
Overview:
I. Counting &
Estimating
II. Exploring Fisheries
Sampling Gear
III. Conducting a
Tagging Survey
IV. Assessing the Data
Summary: This lesson will help students learn why and how
fisheries managers conduct fish surveys. Students will become
familiar with some of the equipment and survey methods that
Minnesota DNR fisheries biologists use. Special authorization,
equipment, and expertise are needed to conduct a fish population
survey in an actual lake, but you can conduct a survey simulation
with student participation. They conduct a problem solving
investigation that helps them determine why local anglers are
catching fewer fish in their lake. Using tagging survey techniques
and a ratio formula students estimate the number of “walleye” in a
container (representing a lake).
Topic: Data Collection, Population Studies
Theme: Scientists use a variety of tools and methods to collect
data in order to answer their research questions.
Objectives:
The students will:
1. Recognize three types of fish sampling equipment used by
fisheries biologists.
2. Conduct a fish survey simulation using a mark and
recapture method.
3. Estimate a simulated population of walleye in a lake using
a ratio formula.
4. Give two examples of how fish surveys and research are
used in fisheries management.
Lesson Provided by the MN DNR MinnAqua Program:
MNDNR MinnAqua Program. (2010) Fishing: Get in the Habitat!
Leader’s Guide. “Lesson 4:2 – Fish Surveys.”
http://tinyurl.com/minnaqualg
Collecting Data
Resource for Understanding
the Nature of Science and
Debunking Student
Misconceptions
http://undsci.berkeley.edu/
2
Collecting Data - Science Institute 2013-2014
Suggested MN Science Standards:
This lesson may partially or fully address the following standards.
Grade 3:
3.1.1.1.1 - Provide evidence to support claims, other than saying “Everyone knows that,” or “I
just know,” and question such reasons when given by others.
3.1.1.2.4 - Construct reasonable explanations based on evidence collected from observations or
experiments.
3.1.3.2.1 - Understand that everybody can use evidence to learn about the natural world, identify
patterns in nature, and develop tools.
3.1.3.2.2 - Recognize that the practice of science and/or engineering involves many different
kinds of work and engages men and women of all ages and backgrounds.
Grade 5:
5.1.3.4.1 - Use appropriate tools and techniques in gathering, analyzing and interpreting data.
For example: Spring scale, metric measurements, tables, mean/median/range, spreadsheets,
and appropriate graphs.
5.4.4.1.1 - Give examples of beneficial and harmful human interactions with natural systems.
Grade 7:
7.1.1.2.3 - Generate a scientific conclusion from an investigation, clearly distinguishing between
results (evidence) and conclusions (explanation).
7.1.3.4.2 - Determine and use appropriate safety procedures, tools, measurements, graphs and
mathematical analyses to describe and investigate natural and designed systems in a life science
context.
7.4.4.1.2 - Describe ways that human activities can change the populations and communities in
an ecosystem.
Grade 8:
8.1.1.2.1 - Use logical reasoning and imagination to develop descriptions, explanations,
predictions and models based on evidence.
8.1.3.3.2 - Understand that scientific knowledge is always changing as new technologies and
information enhance observations and analysis of data.
8.3.4.1.2 - Recognize that land and water use practices affect natural processes and that natural
processes interfere and interact with human systems.
3
Collecting Data - Science Institute 2013-2014
Grades 9-12:
9.1.1.1.2 - Understand that scientists conduct investigations for a variety of reasons, including: to
discover new aspects of the natural world, to explain observed phenomena, to test the conclusions
of prior investigations, or to test the predictions of current theories.
9.1.1.1.4 - Explain how societal and scientific ethics impact research practices.
9.1.1.2.3 - Identify the critical assumptions and logic used in a line of reasoning to judge the
validity of a claim.
9.1.3.3.2 - Communicate, justify, and defend the procedures and results of a scientific inquiry or
engineering design project using verbal, graphic, quantitative, virtual, or written means.
9.1.3.4.2 - Determine and use appropriate safety procedures, tools, computers and measurement
instruments in science and engineering contexts.
Environmental Literacy Scope and Sequence
Benchmarks:
Social and natural systems are made of parts. (K-2)
Social and natural systems may not continue to function if some of their parts are missing.
(k-2)
When the parts of social systems and natural systems are put together, they can do things
they couldn’t do by themselves. (K-2)
In social systems that consist of many parts, the parts usually influence each one another.
(3-5)
Social and natural systems may not function as well if parts are missing, damaged,
mismatched, or misconnected. (3-5)
The output from a social or natural system can become the input to other parts of social
and natural systems. (6-8)
Social and natural systems are connected to each other and to other larger and smaller
systems. (6-8)
Interaction between social and natural systems is defined by their boundaries, relation to
other systems, and expected inputs and outputs. (9-adult)
Feedback of output from some parts of a managed social or natural system can be used to
bring it closer to desired results. (9-adult)
It is not always possible to predict accurately the result of changing some part or
connection between social and natural systems. (9-adult)
Concepts partially or fully addressed in this lesson: biotic factors, boundaries, change &
consistency, change over time, communication, community, diversity, ecosystem, feedback, formal
& non-formal, function, group, habitat, inputs and outputs, interactions and relationships,

4
Collecting Data - Science Institute 2013-2014
knowledge, language, member, parts & objects, patterns, population, products, rate, resources,
scale, stratification, structure, subsystems, technology.
For the full Environmental Literacy Scope and Sequence, see: www.seek.state.mn.us/eemn_c.cfm

5
Collecting Data - Science Institute 2013-2014
Great Lakes Literacy Principles
Only the bolded Great Lakes Literacy Principles are addressed in this lesson.
The Great Lakes, bodies of fresh water with many features, are connected to each other
and the world ocean.
Natural forces formed the Great Lakes; the lakes continue to shape the features of their
watershed.
The Great Lakes influence local and regional weather and climate.
Water makes the earth habitable; fresh water sustains life on land.
The Great Lakes support a diversity of life and ecosystems.
The Great Lakes and humans in their watersheds are inextricably
interconnected.
Much remains to be learned about the Great Lakes.
The Great Lakes are socially, economically, and environmentally significant
to the region, the nation, and the planet.
For more information about the Great Lakes Literacy Principles, visit: http://greatlakesliteracy.net/
6
Collecting Data - Science Institute 2013-2014
Materials: Work shirt labeled Fish Biologist
(make your own label)
Fish Survey Gear Cards (you
could enlarge these cards to post
around the room, or display on
your board)
Fish ID Cards (these can be made
into necklaces with string or
inserted into clip-on name badges)
Sample seine net (optional)
Sample Electrofishing Backpack
Unit (optional)
Rubber Gloves (optional,
dishwashing variety will serve for
the demo)
Large Fish Scoop Net (optional)
Minnesota fishing regulations
booklet (contact the Minnesota
DNR Information Center at 651-
296-6157 or 888-646-6367 to
obtain copies)
Clear fishbowl style container with
lid
A given number of fish snacks
(one or two bags should suffice)
Color picture of a walleye
Large plastic storage container
with lid (60 liters or more)
Lake Scenario and Tagging Survey
Scenario, to read to class
Fisheries Biologist Survey Training
Sheet (1/student)
Lake Survey Data Sheet
(1/student)
Lake Survey Questions Sheet
Version A or B depending on the
level of your students (1/group)
Lake Survey Questions Answer
Key Version A or B, one copy
Graphing Paper
10 3” aquarium nets
10 16-oz containers with lids
10 sealable plastic baggies
One or two bags of dried white
beans (about 250 beans for each
team of students, plus 300 for
training demonstration)
One or two bags of dried brown
beans (about 250 beans for each
team of students, plus 300 for
training demonstration)
One calculator for each team of
two students (optional)
Post-it notes (at least four inches
wide) or small pieces of paper
with tape, one for every pair of
students (1/pair of students)
Optional storybook, One Fish,
Two Fish, Red Fish, Blue Fish, by
Dr. Seuss
7
Collecting Data- Science Institute 2013-2014
Vocabulary:
Creel survey: collects data through an
interview process at lake access sites, or
on a lake or river boat to boat,
regarding the fish that anglers catch
Electrofishing: an active fish sampling
technique using an electrical charge to
temporarily stun fish and cause them to
float to the surface, where they’re
captured with nets
Estimate: a determination of the
approximate number of something
Hydro acoustics: a method of using sonar
to detect fish in the water
Lake class: a term used to reference an
individual lake based on the 43 classes
the MN DNR categorizes surveyed lakes
into using similarities in their chemical
and physical characteristics and fish
communities
Lake productivity: the rate at which
biomass (the mass of all living things
present) is generated within a lake
ecosystem
Mark-recapture: a survey method that
involved tagging or otherwise marking
an initial number of fish and releasing
them back into the population. A
subsequent sample is taken and numbers
of marked fish are compared to numbers
of unmarked fish in the sample to
statistically estimate population size.
Migration: the annual or seasonal
movement of an organism from one
habitat to another, which typically
involves a return trip to original habitat
Normal range: the range of values for
net catches, or average fish size, for
each lake class
Population: the collection of organisms of
the same species inhabiting a given
geographic area
Proportion: in mathematics, an equation
that states equality between two ratios
Ratio: in mathematics, a comparison
expressed as a fraction
Recapture: a tagged organism that is
captured during a follow-up survey
Researcher bias: a situation occurring
when a researcher knowingly or
unknowingly influences the results of an
experiment due to personal viewpoint or
individual technique
Sample: a representative smaller number
of a given population
Survey: to gather long-term information
on population size, population structure
(such as the proportion of fish in age or
length groups), organism growth rates,
reproductive success, species
abundance, harvest pressure rates,
seasonal movement or migration, and
habitat conditions (including plants,
plankton, and invertebrates)
Tag: to mark or identify individual fish by
giving each fish its own number or code
so that it can be tracked over time

8
Collecting Data- Science Institute 2013-2014
Instructor Background:
What is Fisheries Resource Management?
The Department of Natural Resources (DNR) is the lead agency responsible for fisheries
management in Minnesota. Fisheries resource management covers a range of activities
that include—in addition to providing angling opportunities—study, maintenance,
enhancement, protection, and fish and water resource education. A crucial part of
fisheries management involves knowing which fish inhabit the lakes, understanding
changes and trends in fish populations over time, and assessing the health of fish
populations. Populations are defined as the collection of organisms of the species
inhabiting a given geographic area. This information helps fisheries managers address
the needs of fish, aquatic ecosystems, anglers, commercial fishers, bait dealers, and
everyone who enjoys the opportunities and resources that our waters provide.
Information from lake and creel surveys forms the foundation of every Minnesota DNR
fisheries management activity undertaken to improve fishing—stocking fish, determining
the effectiveness of fishing regulations, and restoring habitat. Surveys provide long-term
information on trends in fish population size and structure (such as the proportion of fish
in age or length groups), fish growth, reproductive success, species abundance, fishing
pressure and harvest rates, seasonal fish movement or migration (the annual or seasonal
movement of an organism from one habitat to another, which typically involves a return
trip to original habitat), and habitat conditions in lakes. The Minnesota DNR also employs
other angler survey techniques to gather economic and socio-demographic data that
helps ensure effective management of the state’s fisheries resources for all Minnesota
citizens.
Lake surveys and creel surveys provide fisheries managers with tools for monitoring trends
in population abundance: whether populations are steady, increasing, or decreasing.
This form of trend analysis has been conducted in Minnesota for more than 50 years, and
is the backbone of fish population monitoring. It also helps fisheries managers form
conclusions and predictions about fish populations.
Lake and Stream Plans for Managing Fish Populations
Fisheries managers consider many factors to determine what information to collect and
which sampling methods to use. Survey data is used to create the Lake and Stream Plans
that guide fisheries work.
Sampling methods that yield a large number of samples may produce a more accurate
population estimate, but taking more samples can cost more money. As managers make
decisions regarding Lake and Stream Plans, budget concerns play a role, as well as
9
Collecting Data- Science Institute 2013-2014
considerations involving past and present lake conditions, species, management goals,
and the needs of anglers and other users.
Lake surveys help fisheries managers determine how to best refine their Lake and Stream
Plans and manage fish populations. Problems or questions about lake ecosystem and their
fish populations are addressed. If anglers’ catches are decreasing, a lake survey may
reveal that the lake’s fish population is declining. Or perhaps the anglers are using the
wrong kind of bait. If a lake survey shows a declining fish population, the manager could
decide that special regulations for harvest or size limits are necessary, that the fish
population could benefit from stocking programs, or that habitat protection or restoration
is necessary to ensure a healthy fish population for the future.
Minnesota’s Lake Survey Program
The primary tool guiding fish management is the lake survey. Lake surveys consist of
periodic monitoring of fish populations, angler creel surveys, water chemistry analysis,
and fish habitat. Lake survey data is used to track fish population trends, assess harvest
rates, evaluate the effectiveness of management actions (such as stocking), set realistic
management goals for a given lake, and address issues concerning fish populations.
Fisheries staff conduct an average of 600 lake surveys each year. Lakes with high
angling pressure are surveyed once every three to nine years. Smaller, more remote, or
lightly-used lakes may be surveyed just once every ten to twenty years. Most lake survey
fieldwork takes place between early June and late August. Specialized sampling
sometimes begins in early spring— just after ice-out—and continues until lakes freeze in
late fall.
Monitoring Fish Populations: Fish Surveys
How do you determine the number of fish in a lake? Imagine trying to count each fish in
Lake Winnebigoshish, Lake Mille Lacs, or Lake Superior! It wouldn’t be feasible or
practical to count and measure every fish in a lake. Instead, fisheries biologists collect a
sample— a representative smaller number of fish—from lakes in order to make inferences
about the entire population. This sample and data must be collected using methodical,
consistent surveys of fish populations, fish habitat, and fishing activity. Fish surveys
involve estimating, a determination of the approximate number of fish in the water, using
special equipment, procedures, and training. Fisheries biologists use mathematical
methods to accurately estimate fish populations.
10
Collecting Data- Science Institute 2013-2014
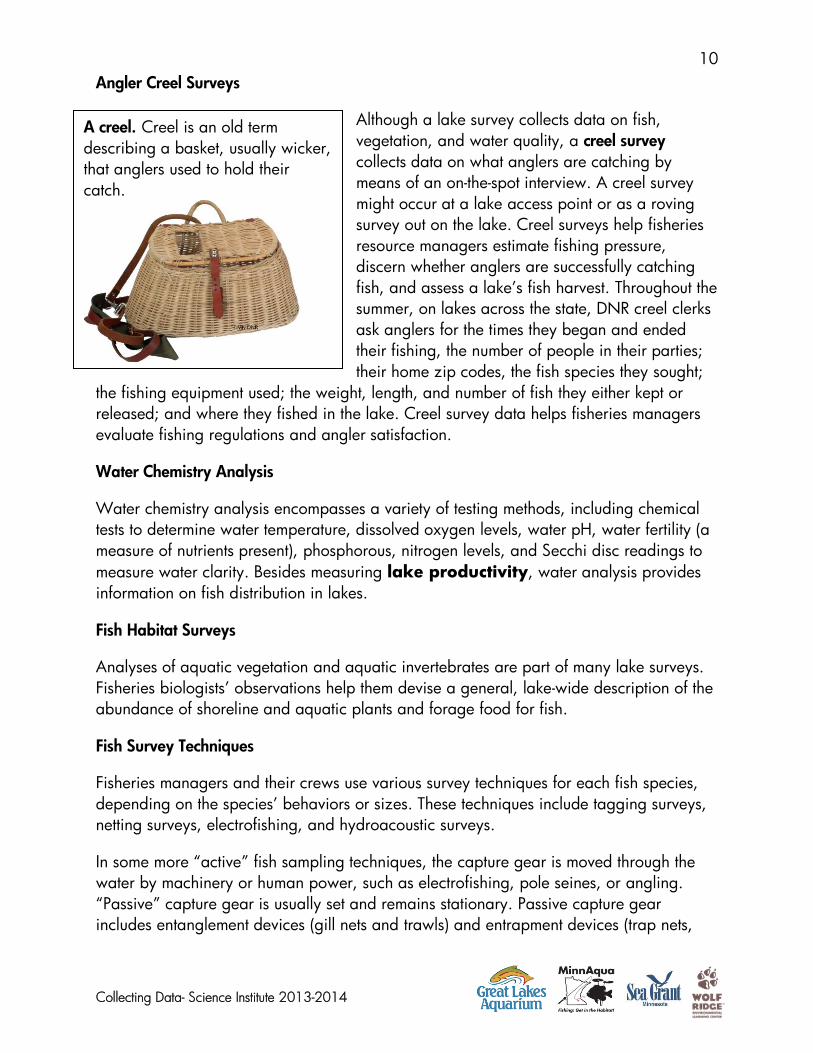
Angler Creel Surveys
Although a lake survey collects data on fish,
vegetation, and water quality, a creel survey
collects data on what anglers are catching by
means of an on-the-spot interview. A creel survey
might occur at a lake access point or as a roving
survey out on the lake. Creel surveys help fisheries
resource managers estimate fishing pressure,
discern whether anglers are successfully catching
fish, and assess a lake’s fish harvest. Throughout the
summer, on lakes across the state, DNR creel clerks
ask anglers for the times they began and ended
their fishing, the number of people in their parties;
their home zip codes, the fish species they sought;
the fishing equipment used; the weight, length, and number of fish they either kept or
released; and where they fished in the lake. Creel survey data helps fisheries managers
evaluate fishing regulations and angler satisfaction.
Water Chemistry Analysis
Water chemistry analysis encompasses a variety of testing methods, including chemical
tests to determine water temperature, dissolved oxygen levels, water pH, water fertility (a
measure of nutrients present), phosphorous, nitrogen levels, and Secchi disc readings to
measure water clarity. Besides measuring lake productivity, water analysis provides
information on fish distribution in lakes.
Fish Habitat Surveys
Analyses of aquatic vegetation and aquatic invertebrates are part of many lake surveys.
Fisheries biologists’ observations help them devise a general, lake-wide description of the
abundance of shoreline and aquatic plants and forage food for fish.
Fish Survey Techniques
Fisheries managers and their crews use various survey techniques for each fish species,
depending on the species’ behaviors or sizes. These techniques include tagging surveys,
netting surveys, electrofishing, and hydroacoustic surveys.
In some more “active” fish sampling techniques, the capture gear is moved through the
water by machinery or human power, such as electrofishing, pole seines, or angling.
“Passive” capture gear is usually set and remains stationary. Passive capture gear
includes entanglement devices (gill nets and trawls) and entrapment devices (trap nets,
A creel. Creel is an old term
describing a basket, usually wicker,
that anglers used to hold their
catch.
11
Collecting Data- Science Institute 2013-2014
minnow traps, and weirs). Behavior patterns determine whether a fish species will be
collected with passive or active sampling technique.
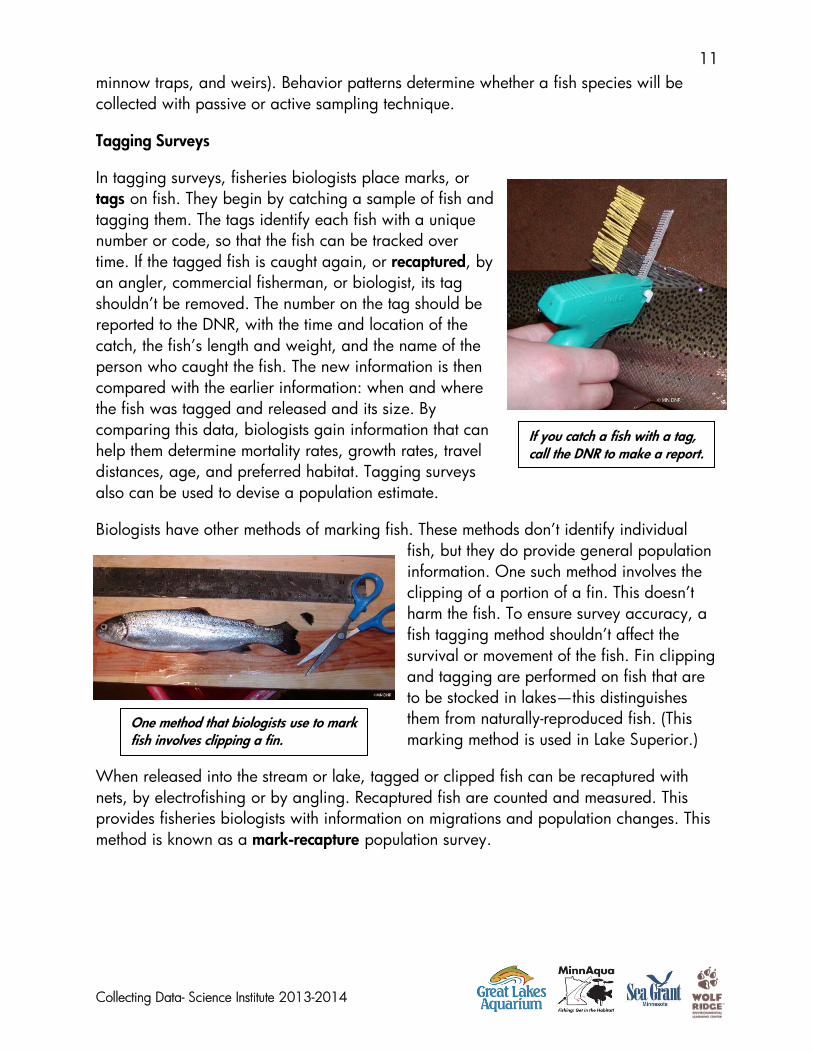
Tagging Surveys
In tagging surveys, fisheries biologists place marks, or
tags on fish. They begin by catching a sample of fish and
tagging them. The tags identify each fish with a unique
number or code, so that the fish can be tracked over
time. If the tagged fish is caught again, or recaptured, by
an angler, commercial fisherman, or biologist, its tag
shouldn’t be removed. The number on the tag should be
reported to the DNR, with the time and location of the
catch, the fish’s length and weight, and the name of the
person who caught the fish. The new information is then
compared with the earlier information: when and where
the fish was tagged and released and its size. By
comparing this data, biologists gain information that can
help them determine mortality rates, growth rates, travel
distances, age, and preferred habitat. Tagging surveys
also can be used to devise a population estimate.
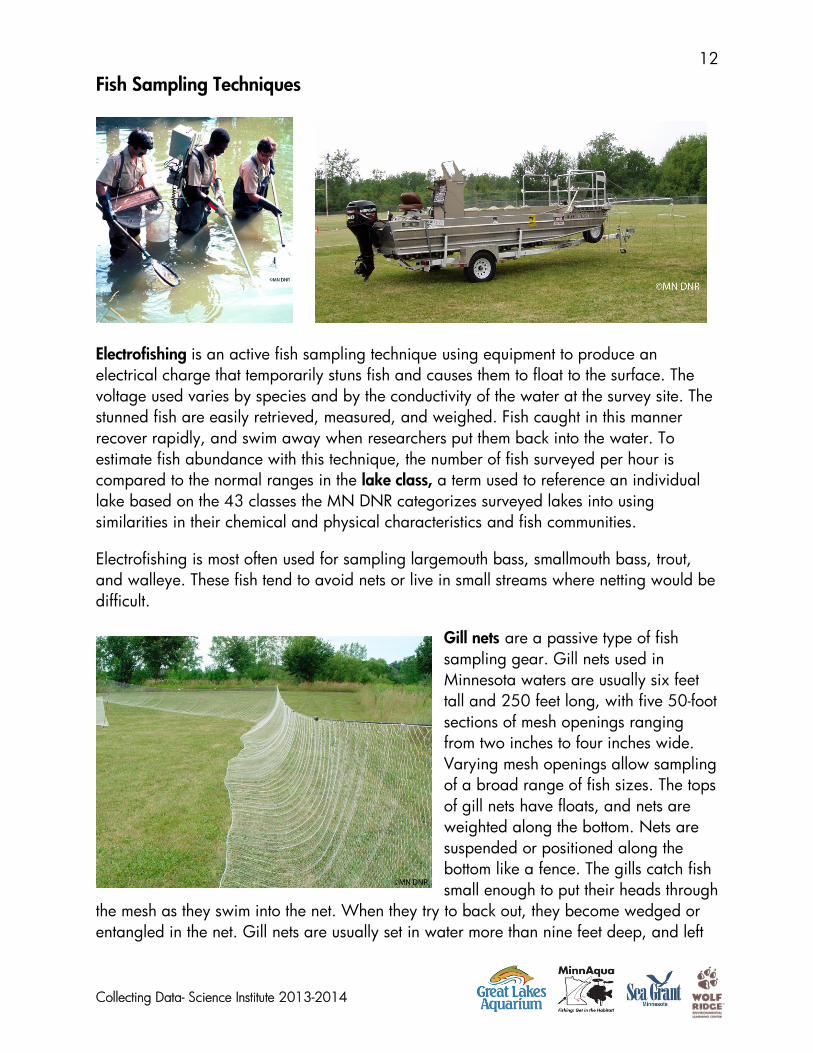
Biologists have other methods of marking fish. These methods don’t identify individual
fish, but they do provide general population
information. One such method involves the
clipping of a portion of a fin. This doesn’t
harm the fish. To ensure survey accuracy, a
fish tagging method shouldn’t affect the
survival or movement of the fish. Fin clipping
and tagging are performed on fish that are
to be stocked in lakes—this distinguishes
them from naturally-reproduced fish. (This
marking method is used in Lake Superior.)
When released into the stream or lake, tagged or clipped fish can be recaptured with
nets, by electrofishing or by angling. Recaptured fish are counted and measured. This
provides fisheries biologists with information on migrations and population changes. This
method is known as a mark-recapture population survey.
If you catch a fish with a tag,
call the DNR to make a report.
One method that biologists use to mark
fish involves clipping a fin.
12
Collecting Data- Science Institute 2013-2014
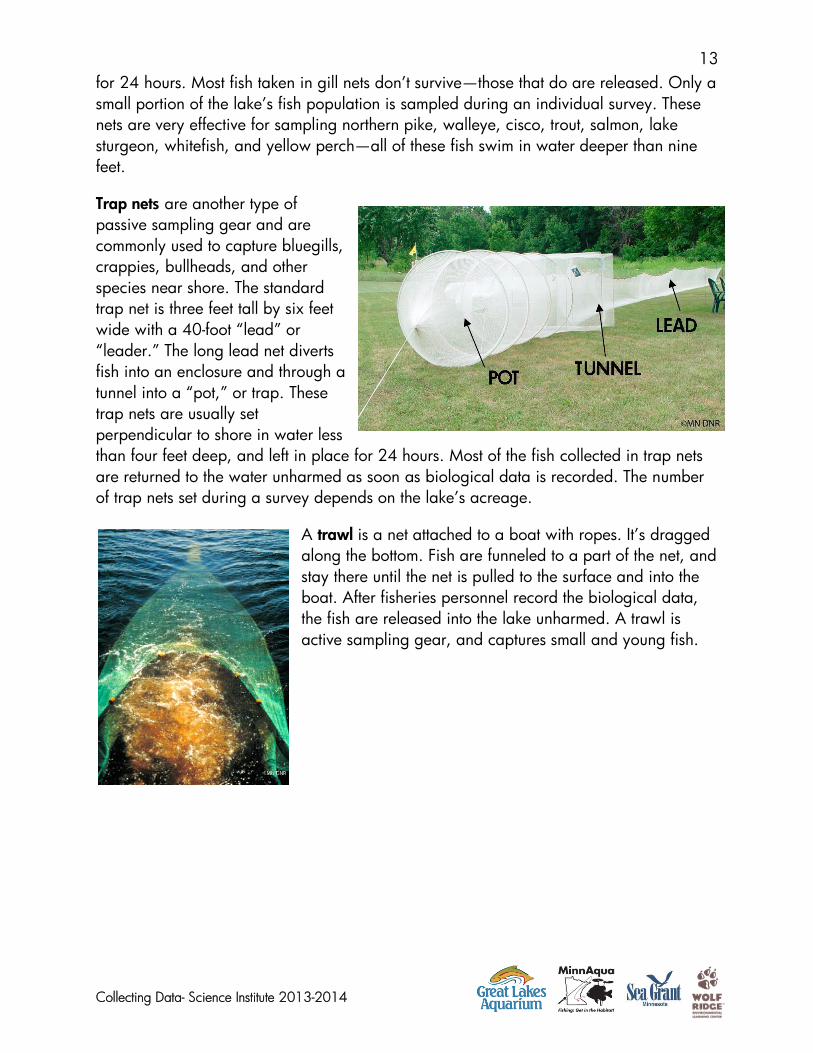
Fish Sampling Techniques
Electrofishing is an active fish sampling technique using equipment to produce an
electrical charge that temporarily stuns fish and causes them to float to the surface. The
voltage used varies by species and by the conductivity of the water at the survey site. The
stunned fish are easily retrieved, measured, and weighed. Fish caught in this manner
recover rapidly, and swim away when researchers put them back into the water. To
estimate fish abundance with this technique, the number of fish surveyed per hour is
compared to the normal ranges in the lake class, a term used to reference an individual
lake based on the 43 classes the MN DNR categorizes surveyed lakes into using
similarities in their chemical and physical characteristics and fish communities.
Electrofishing is most often used for sampling largemouth bass, smallmouth bass, trout,
and walleye. These fish tend to avoid nets or live in small streams where netting would be
difficult.
Gill nets are a passive type of fish
sampling gear. Gill nets used in
Minnesota waters are usually six feet
tall and 250 feet long, with five 50-foot
sections of mesh openings ranging
from two inches to four inches wide.
Varying mesh openings allow sampling
of a broad range of fish sizes. The tops
of gill nets have floats, and nets are
weighted along the bottom. Nets are
suspended or positioned along the
bottom like a fence. The gills catch fish
small enough to put their heads through
the mesh as they swim into the net. When they try to back out, they become wedged or
entangled in the net. Gill nets are usually set in water more than nine feet deep, and left
13
Collecting Data- Science Institute 2013-2014
for 24 hours. Most fish taken in gill nets don’t survive—those that do are released. Only a
small portion of the lake’s fish population is sampled during an individual survey. These
nets are very effective for sampling northern pike, walleye, cisco, trout, salmon, lake
sturgeon, whitefish, and yellow perch—all of these fish swim in water deeper than nine
feet.
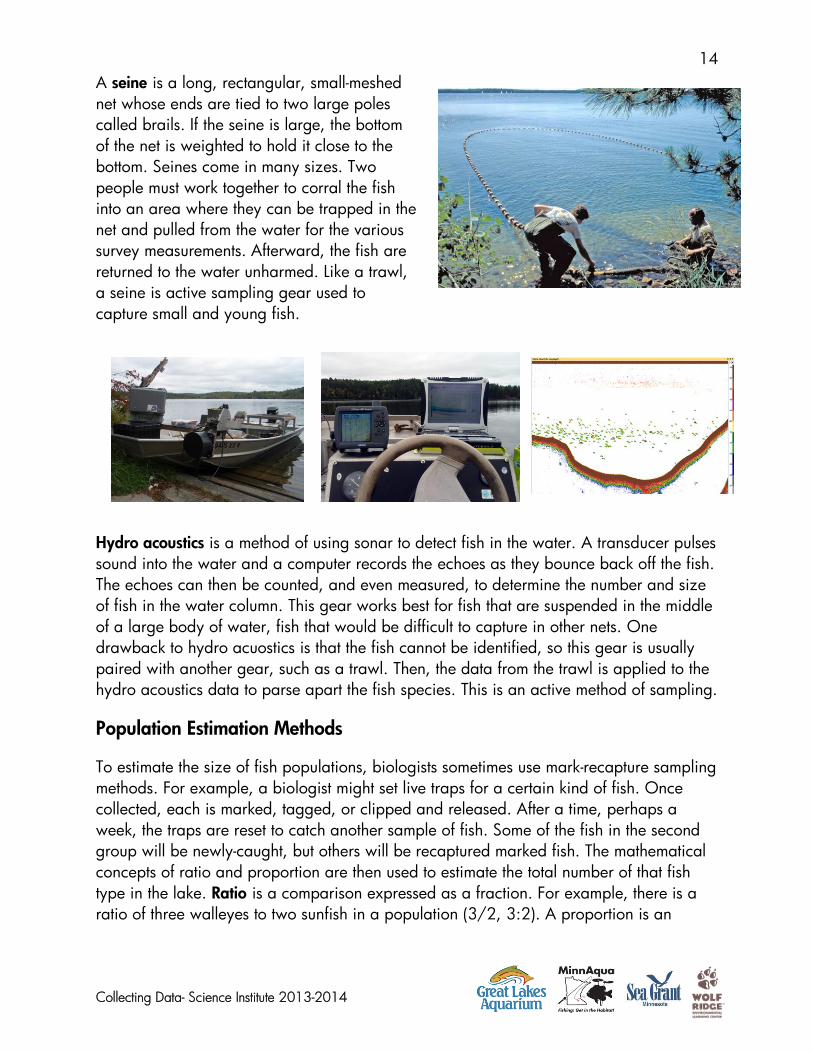
Trap nets are another type of
passive sampling gear and are
commonly used to capture bluegills,
crappies, bullheads, and other
species near shore. The standard
trap net is three feet tall by six feet
wide with a 40-foot “lead” or
“leader.” The long lead net diverts
fish into an enclosure and through a
tunnel into a “pot,” or trap. These
trap nets are usually set
perpendicular to shore in water less
than four feet deep, and left in place for 24 hours. Most of the fish collected in trap nets
are returned to the water unharmed as soon as biological data is recorded. The number
of trap nets set during a survey depends on the lake’s acreage.
A trawl is a net attached to a boat with ropes. It’s dragged
along the bottom. Fish are funneled to a part of the net, and
stay there until the net is pulled to the surface and into the
boat. After fisheries personnel record the biological data,
the fish are released into the lake unharmed. A trawl is
active sampling gear, and captures small and young fish.
14
Collecting Data- Science Institute 2013-2014
A seine is a long, rectangular, small-meshed
net whose ends are tied to two large poles
called brails. If the seine is large, the bottom
of the net is weighted to hold it close to the
bottom. Seines come in many sizes. Two
people must work together to corral the fish
into an area where they can be trapped in the
net and pulled from the water for the various
survey measurements. Afterward, the fish are
returned to the water unharmed. Like a trawl,
a seine is active sampling gear used to
capture small and young fish.
Hydro acoustics is a method of using sonar to detect fish in the water. A transducer pulses
sound into the water and a computer records the echoes as they bounce back off the fish.
The echoes can then be counted, and even measured, to determine the number and size
of fish in the water column. This gear works best for fish that are suspended in the middle
of a large body of water, fish that would be difficult to capture in other nets. One
drawback to hydro acuostics is that the fish cannot be identified, so this gear is usually
paired with another gear, such as a trawl. Then, the data from the trawl is applied to the
hydro acoustics data to parse apart the fish species. This is an active method of sampling.
Population Estimation Methods
To estimate the size of fish populations, biologists sometimes use mark-recapture sampling
methods. For example, a biologist might set live traps for a certain kind of fish. Once
collected, each is marked, tagged, or clipped and released. After a time, perhaps a
week, the traps are reset to catch another sample of fish. Some of the fish in the second
group will be newly-caught, but others will be recaptured marked fish. The mathematical
concepts of ratio and proportion are then used to estimate the total number of that fish
type in the lake. Ratio is a comparison expressed as a fraction. For example, there is a
ratio of three walleyes to two sunfish in a population (3/2, 3:2). A proportion is an
15
Collecting Data- Science Institute 2013-2014
equation that states equality between two ratios. Biologists and researchers use mark-
recapture methods to estimate the size of wildlife populations other than fish.
Survey Assumptions
Mark-recapture methods are based on a number of assumptions. Making assumptions is
an important part of scientific research. The most basic assumptions made by scientists
are that observations of individual organisms (or groups of organisms) will apply to the
rest of the population that is not captured or seen, and that every individual in a
population can always be identified as a member of the same species and counted
accurately. The assumptions are carefully determined to ensure the methods will reflect
reality. Some other assumptions related to mark-recapture sampling:
1. During the survey period, there are no fish leaving or entering the survey area (no
immigration or emigration). The survey methods also assume that significant death or
mortality, and significant recruitment or birth, aren’t occurring.
2. The tags or marks placed on the fish aren’t lost and are clearly recognizable.
3. Differential mortality doesn’t occur during the time of the survey. In other words, it’s
assumed that there’s no change in ratio between marked and unmarked fish during the
interval between samplings. This means, for example, that the marking technique doesn’t
make a fish more susceptible to predators.
4. Marked and unmarked fish are equally vulnerable to sampling gear. Every individual
in the population has an equal chance of being captured, ensuring that all samples are
random samples.
5. There is random mixing—the marked group is always proportionally represented in
relation to the total population in the collected samples. The time between samplings must
be long enough to allow for thorough mixing of marked animals, but not so long to allow
significant increase by immigration or reproduction.
16
Collecting Data- Science Institute 2013-2014
Researcher Bias
To eliminate researcher bias, biologists use a specific, consistent technique to conduct a
population survey. Researcher bias occurs when a researcher, knowingly or unknowingly,
influences the results of an experiment due to personal viewpoint or an individual
variation in technique. Each survey sample must use exactly the same technique and
equipment, and samples must be
repeated at approximately the same
time of year to ensure similar
environmental conditions for all
surveys. Specific results are
comparable from survey to survey. To
obtain a broad overview of the entire
fish population in a lake, multiple
survey samples may be taken from
different locations of the lake.
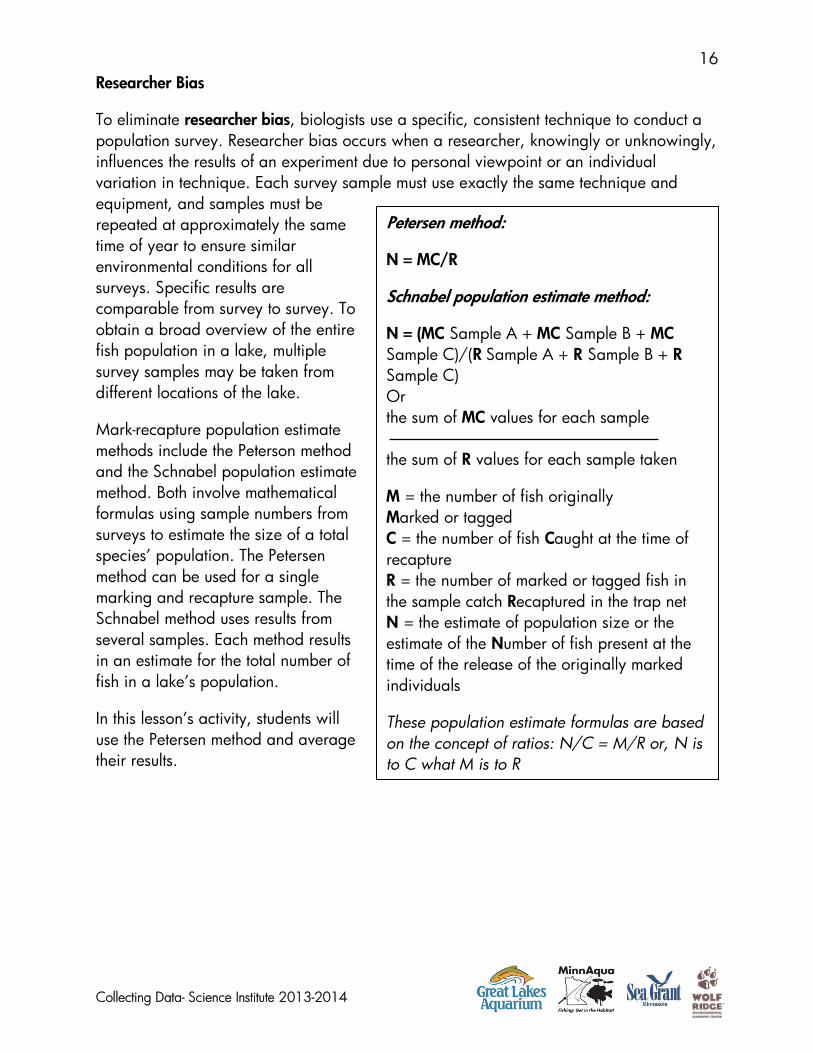
Mark-recapture population estimate
methods include the Peterson method
and the Schnabel population estimate
method. Both involve mathematical
formulas using sample numbers from
surveys to estimate the size of a total
species’ population. The Petersen
method can be used for a single
marking and recapture sample. The
Schnabel method uses results from
several samples. Each method results
in an estimate for the total number of
fish in a lake’s population.
In this lesson’s activity, students will
use the Petersen method and average
their results.
Petersen method:
N = MC/R
Schnabel population estimate method:
N = (MC Sample A + MC Sample B + MC
Sample C)/(R Sample A + R Sample B + R
Sample C)
Or
the sum of MC values for each sample
the sum of R values for each sample taken
M = the number of fish originally
Marked or tagged
C = the number of fish Caught at the time of
recapture
R = the number of marked or tagged fish in
the sample catch Recaptured in the trap net
N = the estimate of population size or the
estimate of the Number of fish present at the
time of the release of the originally marked
individuals
These population estimate formulas are based
on the concept of ratios: N/C = M/R or, N is
to C what M is to R
17
Collecting Data- Science Institute 2013-2014
Data Collection and Reporting
Examples of data collected from fish-in-hand include length, weight and scale samples,
which are later analyzed to determine age. After data is collected, most fish are returned
to the water unharmed. (Some mortality does occur in surveys using gill nets.) In all survey
techniques, a few fish are sacrificed for laboratory analysis, which determines sex,
stomach contents, disease, and internal parasites. Catch numbers are reported
separately, by gear type.
The primary technique for fish population monitoring in Minnesota involves standard net
surveys. Catches from surveys are standardized by calculating the number of fish of one
species caught per unit of sampling effort. For example: if 10 nets were set during a
survey and 40 walleye were caught, the net catch would be reported as 4.0 walleye per
gill net set.
Minnesota’s surveyed lakes have been categorized into 43 classes, or groups, based on
similarities in their chemical and physical characteristics and fish communities. When
discussing data collected from a lake it is referenced with its lake class. The term normal
range describes the range of values for net catches, or average fish size, for each lake
class. From many years of research and data collection, the DNR fisheries staff has
determined normal range values for the fish species in each lake class—if the walleye gill
net catch for a 1996 survey on your lake was 6.0 walleye per net, and the normal range
for other lakes in the same lake class was reported as 2.0 to 4.5 walleye per net, the
current population of walleye in your lake could be interpreted as higher than expected
for that type of water body.
When the spring, summer, and fall fieldwork has been completed, there is much to do
with the collected data. Information is entered into the lake survey database, checked for
errors, analyzed, and reported. It usually takes approximately one year from the time the
nets are lifted during a lake survey until the results of that survey are published on the
Minnesota DNR website or are available as printed DNR reports. If you can’t find a
record for a lake that interests you, it’s possible that the lake hasn’t yet been surveyed or
doesn’t have public access. Or, the most recent data may have been collected prior to
the development of the database and not yet entered. The lake survey database contains
information on 4,500 Minnesota lakes and streams—more than any other state—and
fisheries biologists add new information each year. Information from lake surveys is
available to the public in the LakeFinder area on the Minnesota DNR website.
http://www.dnr.state.mn.us/lakefind/index.html
18
Collecting Data- Science Institute 2013-2014
Preparation:
1. Gather materials referenced in materials list (see page 6).
2. Copy and cut out Fish Survey Gear Cards. If desired, enlarge these images and post
them in the room, or make overhead transparencies to show the class. Examples of real
fish survey gear can also be used.
3. Print and assemble Fish ID Cards. The cards are designed to print onto Universal 56003
or Avery 5390 name badges. (1 per student is needed)
4. Count out total number of fish snacks and place in a clear fishbowl shaped container.
Record the number of fish snacks on the bottom of the bowl.
5. Put 300 brown beans into the “lake” (use an empty aquarium or container with a
cover). Set 300 white beans aside in a plastic container.
6. For each student group, put 250 brown beans into a small plastic container and 250
white beans into a zip lock bag keeping the beans separated by color.
7. Create 2 Fisheries Biologist labels and attach them to the front of two large work shirts.
8. Copy one Lake Scenario with the Tagging Survey Scenario on the bottom to read to the
class.
9. Copy one of the following for each student:
Fisheries Biologist Survey Training Sheet
Lake Survey Data Sheet
Graphing Paper
10. Copy one of the following for each instructor:
Lake Survey Questions Answer Key
Lake Survey Questions Sheet (either Version A or B)
11. Prepare Fisheries Biologist Survey Training Sheet and the Lake Survey Data Sheet for
projecting.
19
Collecting Data- Science Institute 2013-2014
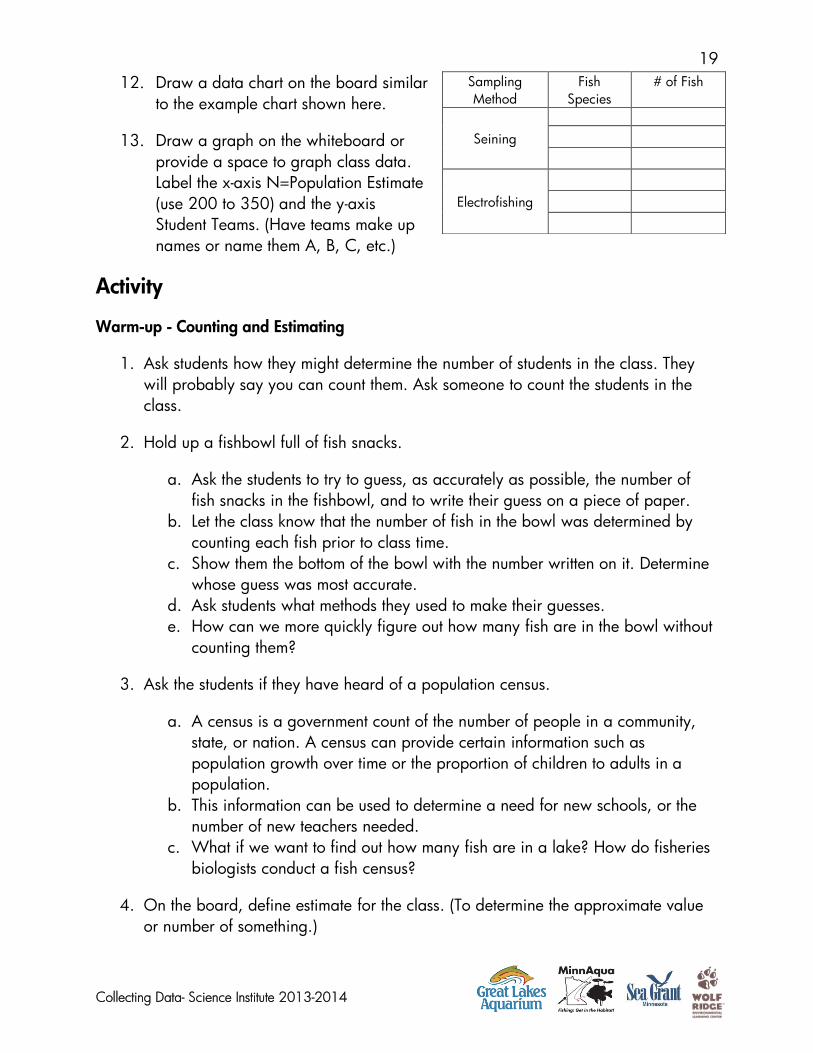
12. Draw a data chart on the board similar
to the example chart shown here.
13. Draw a graph on the whiteboard or
provide a space to graph class data.
Label the x-axis N=Population Estimate
(use 200 to 350) and the y-axis
Student Teams. (Have teams make up
names or name them A, B, C, etc.)
Activity
Warm-up - Counting and Estimating
1. Ask students how they might determine the number of students in the class. They
will probably say you can count them. Ask someone to count the students in the
class.
2. Hold up a fishbowl full of fish snacks.
a. Ask the students to try to guess, as accurately as possible, the number of
fish snacks in the fishbowl, and to write their guess on a piece of paper.
b. Let the class know that the number of fish in the bowl was determined by
counting each fish prior to class time.
c. Show them the bottom of the bowl with the number written on it. Determine
whose guess was most accurate.
d. Ask students what methods they used to make their guesses.
e. How can we more quickly figure out how many fish are in the bowl without
counting them?
3. Ask the students if they have heard of a population census.
a. A census is a government count of the number of people in a community,
state, or nation. A census can provide certain information such as
population growth over time or the proportion of children to adults in a
population.
b. This information can be used to determine a need for new schools, or the
number of new teachers needed.
c. What if we want to find out how many fish are in a lake? How do fisheries
biologists conduct a fish census?
4. On the board, define estimate for the class. (To determine the approximate value
or number of something.)
Sampling
Method
Fish
Species
# of Fish
Seining
Electrofishing
20
Collecting Data- Science Institute 2013-2014
a. There are ways scientists can estimate the size of a population when
counting every individual isn’t practical, and the methods for making
scientific estimates are more accurate than guessing.
b. We estimate numbers of fish because it would be too difficult or too costly
to count each individual fish.
5. Why count fish?
a. Hold up a Minnesota fishing regulations booklet or visit
www.dnr.state.mn.us/regulations/fishing. Ask the students if they’ve ever
been fishing, and ask them why we have fishing rules.
b. Briefly explain that fisheries biologists collect biological information from
lakes to design regulations. This biological information helps fisheries
managers solve a variety of challenges that fish may have in lakes, rivers,
streams, wetlands, and watersheds.
c. One thing a fisheries biologist might want to know is how many fish of a
given species live in a particular lake, so fisheries managers can figure out
if current regulations successfully protect that fish population. (Although
knowing how many are in the lake is important, we must also know how
many fish are leaving the lake, or being harvested, to make final population
size determinations.)
Part 1: Sampling Gear
1. Set out the Fish Survey Gear Cards and examples of fish sampling equipment.
2. If you do not have sample equipment, skip to step 23 and follow instructions for all
Fish Survey Gear Cards.
3. Explain to the group that they will be demonstrating how two types of fish
sampling equipment work by becoming fish in a lake or river and taking on the
role of fisheries biologists.
4. Choose two students to be fisheries biologists conducting a seine sample. Have
each volunteer put on a Fisheries Biologist Shirt. (All DNR Fisheries personnel must
be in uniform when they are doing fieldwork!)
5. Hand out one Fish ID Card to the rest of your students to wear.
21
Collecting Data- Science Institute 2013-2014
6. Draw a data chart on the board similar
to the example chart shown here.
7. Give each of the fisheries biologists one
side of the seine and have them separate
to hold the seine tight.
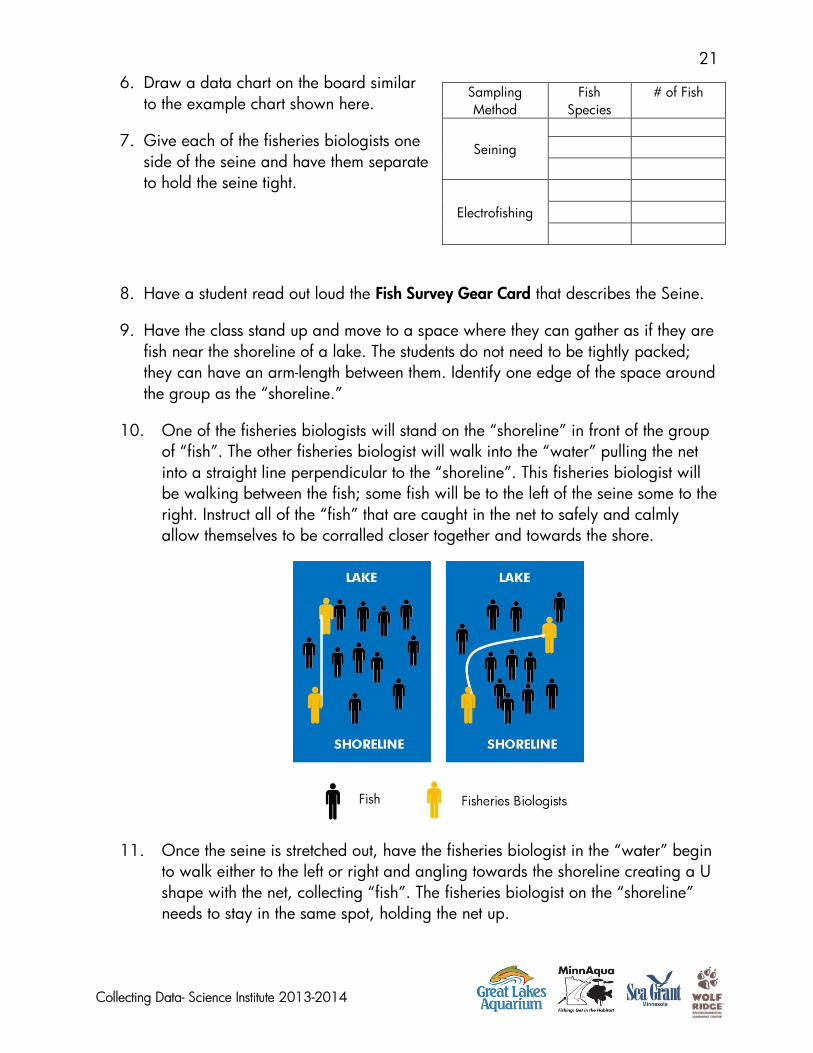
8. Have a student read out loud the Fish Survey Gear Card that describes the Seine.
9. Have the class stand up and move to a space where they can gather as if they are
fish near the shoreline of a lake. The students do not need to be tightly packed;
they can have an arm-length between them. Identify one edge of the space around
the group as the “shoreline.”
10. One of the fisheries biologists will stand on the “shoreline” in front of the group
of “fish”. The other fisheries biologist will walk into the “water” pulling the net
into a straight line perpendicular to the “shoreline”. This fisheries biologist will
be walking between the fish; some fish will be to the left of the seine some to the
right. Instruct all of the “fish” that are caught in the net to safely and calmly
allow themselves to be corralled closer together and towards the shore.
11. Once the seine is stretched out, have the fisheries biologist in the “water” begin
to walk either to the left or right and angling towards the shoreline creating a U
shape with the net, collecting “fish”. The fisheries biologist on the “shoreline”
needs to stay in the same spot, holding the net up.
Sampling
Method
Fish
Species
# of Fish
Seining
Electrofishing
22
Collecting Data- Science Institute 2013-2014
12. Once the fisheries biologist that is moving reaches the “shoreline” the two
fisheries biologists pull the “fish” in from the net and identify them by looking at
the Fish ID Card. Have one of the fisheries biologists record the types of fish
caught and the number of each type of fish in the chart on the board. Once the
“fish” are identified, they are released back into the “water”.
13. When all of the “fish” are released, thank the fisheries biologists for their good
work and ask for two new volunteers.
14. The two new volunteers can trade their fish ID cards for the fisheries biologists
shirts with the previous two volunteers.
15. Hand the sample electrofishing backpack and rubber gloves to one of the
fisheries biologists and a large fish net to the other one.
16. Have a student read out loud the Fish Survey Gear Card that describes
Electrofishing.
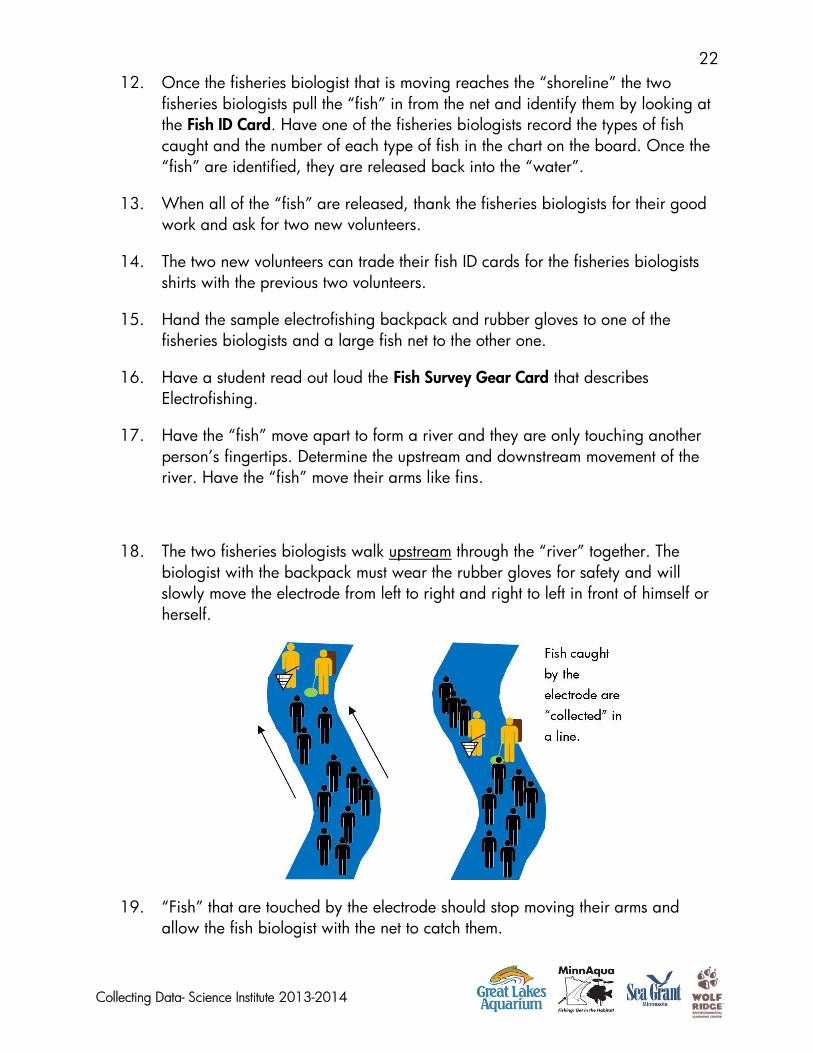
17. Have the “fish” move apart to form a river and they are only touching another
person’s fingertips. Determine the upstream and downstream movement of the
river. Have the “fish” move their arms like fins.
18. The two fisheries biologists walk upstream through the “river” together. The
biologist with the backpack must wear the rubber gloves for safety and will
slowly move the electrode from left to right and right to left in front of himself or
herself.
19. “Fish” that are touched by the electrode should stop moving their arms and
allow the fish biologist with the net to catch them.
23
Collecting Data- Science Institute 2013-2014
20. The caught “fish” can form a line behind the fisheries biologist with the net.
21. Once the two biologists have walked the length of the “river” they can identify
their “fish.” Have one of the fisheries biologists record the types of fish caught
and the number of each type of fish in the chart on the board. After the
biologists have finished counting and identifying their fish have the group return
to their desks.
22. Hand out the remaining Fish Survey Gear Cards (Gill Net, Trap Net, Trawl,
Hydroacoustics) and have the students read them out loud to the group.
23. Ask the group about the information that was gathered from the two surveys.
a. Did the surveys you conducted tell you how many fish are in the lake? (No)
b. What types of information did you learn about the fish from the lake with
the two surveys you conducted? (What kinds of fish are in the water at that
location and how many were caught in the net.)
Part 2: Conducting a Tagging Survey
Introduction to a walleye problem with your lake
1. Read the Lake Scenario to the class.
2. Display a covered container containing 300 brown beans (to simulate walleye).
3. Tell the class: “This is your lake.”
a. Ask your students how many “walleye” are in their lake.
b. After a few guesses, explain to the students that just like in a real lake,
counting fish in a covered container is more difficult than counting fish
snacks in a clear fishbowl. You cannot see the whole fish population in the
covered container, just as you would not be able to count every walleye in
the lake.
4. Tell students that they might be able to estimate the fish population in the lake
using samples. But to solve the walleye problem with your lake, they will have to
find a way to make an accurate estimate. Define sample on the board, (a
representative number of organisms collected to infer information about the entire
population).
Beginning Your Fish Survey Training!
1. Announce that the students are fisheries biologists who will conduct a tagging
survey to estimate the size of the walleye population of their lake.
24
Collecting Data- Science Institute 2013-2014
2. Hold up the mount or photo of a walleye and show the students how a fish can be
tagged or marked.
a. Show examples of various types of tags used to mark fish.
b. On the board, define tag and survey.
3. Hand a Fisheries Biologist Survey Training Sheet to each student. Tell the students
that, as fisheries biologists, they’re required to document their tagging survey
procedure and results. The data they gather can be used to identify fisheries
issues and to solve the problem of estimating how many walleye are in the lake.
The data and conclusions can be shared with the public.
4. Read and explain the Tagging Survey Scenario (at the bottom of the Lake Scenario
Sheet) to the class. After you are finished discussing the Tagging Survey
Scenario, tell the students, “Now, it’s time for your fish survey training!”
5. Ask a student volunteer to come to the front of the class to begin training for the
Walleye Survey. Put a work shirt with the Fisheries Biologist label on the student
volunteer.
6. Explain the proper sampling techniques:
a. Don’t look into the “lake” while taking the sample.
b. Take one quick scoop in the lake with the net.
c. The student will “tag” or “mark” the fish that are captured.
7. Give the small aquarium net to the fisheries biologist and ask him or her to use the
net to take one scoop of walleye from the lake.
8. Count the number of fish captured. (There should be approximately 80-100 brown
beans.)
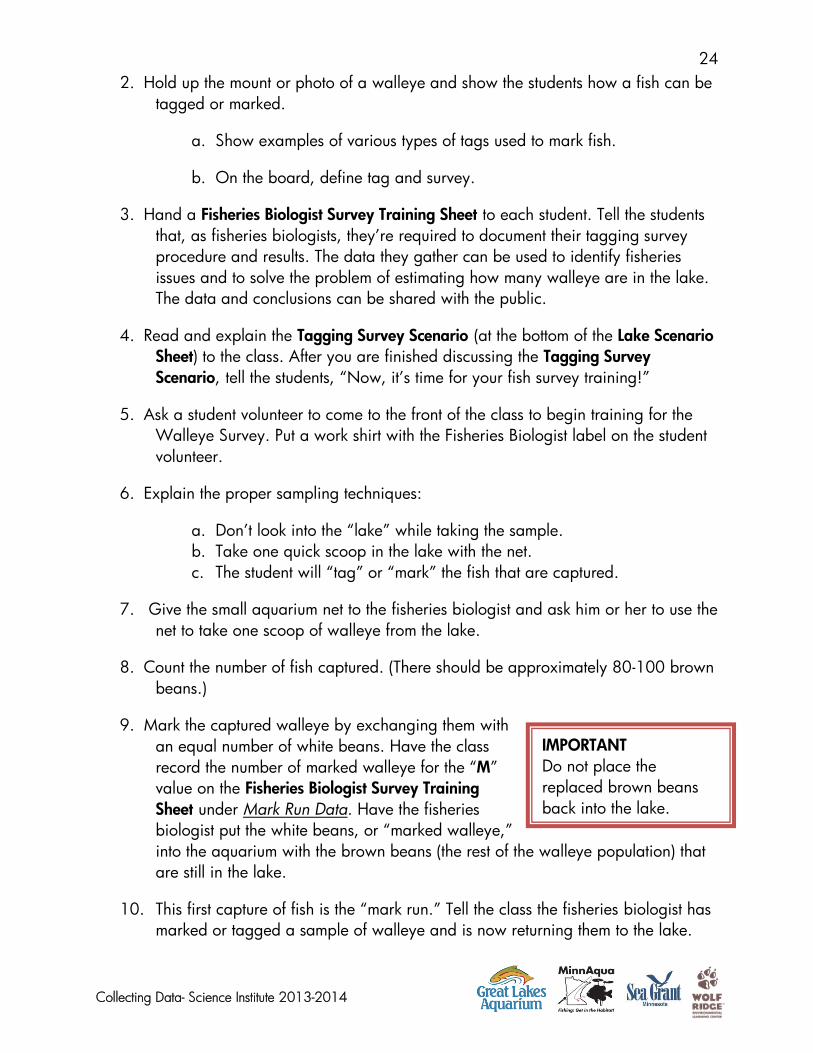
9. Mark the captured walleye by exchanging them with
an equal number of white beans. Have the class
record the number of marked walleye for the “M”
value on the Fisheries Biologist Survey Training
Sheet under Mark Run Data. Have the fisheries
biologist put the white beans, or “marked walleye,”
into the aquarium with the brown beans (the rest of the walleye population) that
are still in the lake.
10. This first capture of fish is the “mark run.” Tell the class the fisheries biologist has
marked or tagged a sample of walleye and is now returning them to the lake.
IMPORTANT
Do not place the
replaced brown beans
back into the lake.
25
Collecting Data- Science Institute 2013-2014
11. Stir the beans for fifteen seconds to simulate the fish swimming around in the
lake.
12. The next step in our Fish Survey Training is to take a “recapture run” sample.
13. Choose another volunteer to come to the front of the class and use the net to pull
the next sample of “walleye” from your lake for the recapture run. Put the
fisheries biologist work shirt on the new volunteer before they take their sample.
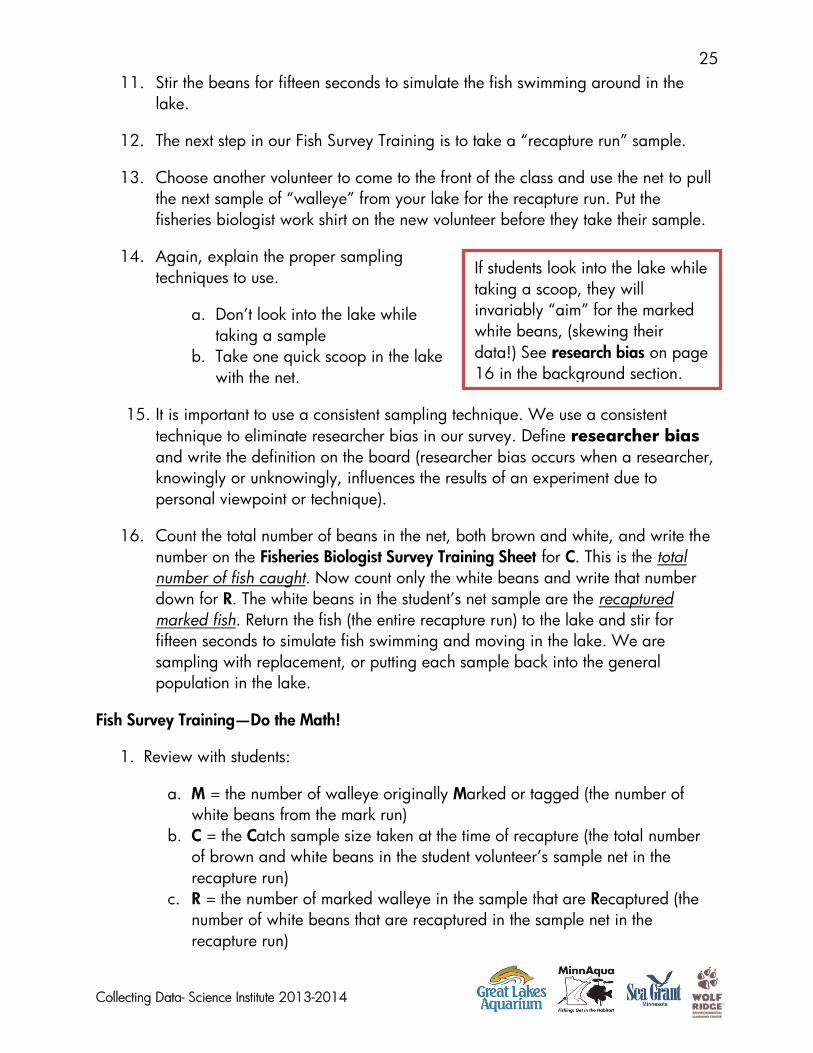
14. Again, explain the proper sampling
techniques to use.
a. Don’t look into the lake while
taking a sample
b. Take one quick scoop in the lake
with the net.
15. It is important to use a consistent sampling technique. We use a consistent
technique to eliminate researcher bias in our survey. Define researcher bias
and write the definition on the board (researcher bias occurs when a researcher,
knowingly or unknowingly, influences the results of an experiment due to
personal viewpoint or technique).
16. Count the total number of beans in the net, both brown and white, and write the
number on the Fisheries Biologist Survey Training Sheet for C. This is the total
number of fish caught. Now count only the white beans and write that number
down for R. The white beans in the student’s net sample are the recaptured
marked fish. Return the fish (the entire recapture run) to the lake and stir for
fifteen seconds to simulate fish swimming and moving in the lake. We are
sampling with replacement, or putting each sample back into the general
population in the lake.
Fish Survey Training—Do the Math!
1. Review with students:
a. M = the number of walleye originally Marked or tagged (the number of
white beans from the mark run)
b. C = the Catch sample size taken at the time of recapture (the total number
of brown and white beans in the student volunteer’s sample net in the
recapture run)
c. R = the number of marked walleye in the sample that are Recaptured (the
number of white beans that are recaptured in the sample net in the
recapture run)
If students look into the lake while
taking a scoop, they will
invariably “aim” for the marked
white beans, (skewing their
data!) See research bias on page
16 in the background section.
26
Collecting Data- Science Institute 2013-2014
d. N = the total Number of walleye estimated to be in your lake at the time of
the release of the originally marked fish (the estimate of the total Number of
all beans in the lake)
2. Students will now learn how to complete the calculations needed to estimate the
total walleye population in their lake (N) using the Petersen method.
3. Complete the calculation on the Fisheries Biologist Survey Training Sheet as a
class. What is the value for N? How many walleye are estimated to be in your
lake?
4. Now have students compare their estimates to the real population of walleye in
their lake.
a. Explain that, in reality, you wouldn’t know how many walleye are in the
lake because it would be very difficult, if not impossible, to catch each
walleye. But, in this case, we know the total number of beans so we can
see the accuracy of our estimates.
b. Tell the students that there were actually 300 walleye (beans) in the lake.
c. Discuss with the class how close the estimate (N) was to the total number. At
this point, you may wish to have students do Step 1 of the Extension.
5. Ask students if they think that the mark-recapture method is a good way to estimate
the walleye population in the lake. Why or why not? Can students think of other
situations where the mark-recapture method could be used to estimate the
population of a different animal species?
Graduating Fisheries Biologists
Hum “Pomp and Circumstance” and tell the class they have all
graduated and are now Fisheries Biologists. They are ready to
conduct their own fish surveys in their lakes!
Try It On Your Own—Fisheries Biologist Surveys of your lake
1. Divide your students into small groups, up to 4 students in a group, and explain
that, for safety reasons, fisheries biologists work in teams when they go travel on
the lake by boat.
2. Each student group will conduct mark-recapture lake surveys in their own lakes.
3. Distribute the smaller plastic cups, each containing 250 white beans and 250
brown beans, a larger container representing the lake, and a net to each team.
4. Have the students pour the brown beans into the lake.
To shorten the length
of this lesson, or for
younger students, stop
here.
27
Collecting Data- Science Institute 2013-2014
5. Tell the class that each team, using the Peterson method, will work together to
complete a lake survey to estimate the size of the walleye population.
6. Follow the directions for completing the Lake Survey Data Sheet and for doing the
calculations.
a. If students need help with their calculations, have them ask the fisheries
supervisor (instructor) for assistance.
b. If necessary, the instructor can put a transparency of the data sheet on the
overhead projector, or project the datasheet and guide the teams through
the calculations.
c. Each team will come up with an estimate for the number of walleye in the
lake.
7. After they complete the survey and calculations on the Lake Survey Data Sheet, ask
the teams to compare each value with the actual number of fish in the lake.
a. Were some group estimates more accurate than others?
b. How much did the various group estimates vary?
c. Why might one group’s estimate be more accurate than another’s?
d. Ask teams if they carefully avoided researcher bias during their surveys.
8. OPTIONAL: To make surveys more accurate, have each group conduct 3
mark/recapture surveys and take an average of their three answers to determine
the population of walleye in their lake.
9. Ask students what has happened to the walleye population in their lakes.
a. Remind students of the lake survey that was done three years ago (the large
group fisheries training survey)
b. Compare their data from their present surveys, and discuss what can be
determined regarding the lake’s walleye population since the last survey.
(The walleye population has declined in the three years since the previous
lake survey was performed.)
Part 3: Assessing Your Data
1. Draw a graph on the whiteboard. Label the x-axis N=Population Estimate (use 200
to 350) and the y-axis Student Teams. (Have teams make up names or name them
A, B, C, etc.)
2. Title the graph Walleye Population Estimates.
28
Collecting Data- Science Institute 2013-2014
Mode The most frequently
occurring value, or the value
that repeats most often, in a
group of data. It will be the
number with the most points
around it on the graph of the
class data. A group of
observations can have more
than one modal value. Modes
are often used for qualitative
data, or data that describe
qualities rather than quantities.
Median The middle value—half
of the values are above and half
the values are below the median
value. Median is also defined as
the middle piece of data, after
data have been sorted from the
smallest to the largest.
Mean The balance point, or
average, of the values. The
arithmetic mean of a set of
values is a sum of all values,
divided by their number.
Range The difference between
the highest and lowest values on
the graph.
3. Have each team write their estimate as a number on a post it note and place it as
a point on the graph.
4. Hand out a piece of graph paper and a Lake Survey Data Question Sheet to each
student.
5. Have the students create a graph, following the instructions on the Lake Survey
Data Question Sheet.
6. Have students copy the graph of the class from the board onto their graph.
7. What is the range of values on the graph for our class survey data?
a. Add the numbers on the graph together.
(The instructor may decide to permit the
use of a calculator.)
b. Have students record this number on their
Lake Survey Data Question Sheets.
8. Calculate the average population estimate by
dividing the total by the number of estimates
(teams) on the graph.
a. For example, if there are fifteen team
estimates on the graph, add the fifteen
estimates together, and then divide the
sum of the estimates by the number fifteen.
b. This is the class average estimate for the
number of fish in their lake.
c. Discuss with students whether this value is
the mean, mode, or median for our class
survey data set. (It’s the mean).
d. Have students record this value on the
Lake Survey Data Question Sheet.
e. What is the actual number of walleye that
were in their lake? (250)
f. How does the mean, or average,
compare to the actual number?
9. Determine the median, mean, and mode values.
a. How does each compare to the actual
number of walleye in the lake?
b. When does a fisheries biologist use
29
Collecting Data- Science Institute 2013-2014
mean? Mode? Median? (It’s up to the researcher to decide, depending on
the goals of the study.)
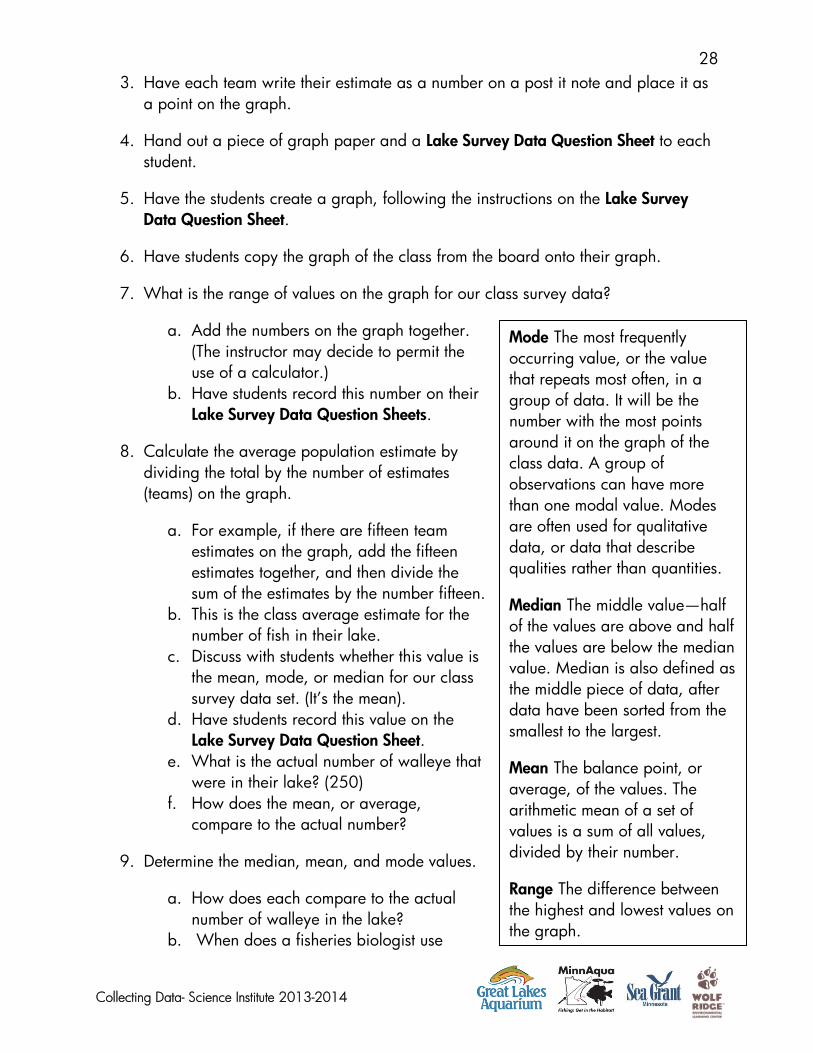
10. The important thing is to know which type of data is being used. Median, mean,
and mode are all “types” of averages. These types of averages are referred to as
“measures of central tendency” in statistics. The mean is the arithmetic average,
median is the middle value in a set of data, and mode is the most frequently
occurring value in a set of data. When reporting research information, it’s
important to be specific about the type of average to use.
11. Determine the range of values on the graph. Ask the students to explain why the
class obtained a range of values in their lake survey data.
Wrap-up
1. What’s next? The fisheries supervisor will want to do more research to find out
what has caused the population decline, and to determine how to restore the
walleye population in the future. It might be determined that:
a. Special fishing regulations need to be applied to the lake.
b. Shoreline habitat may have to be restored so that walleye can spawn and
find food.
c. A stocking program may be needed to restore the population.
d. To help improve water quality, lakeshore residents may have to reduce the
phosphorous content of their lawn fertilizers.
e. An exotic species may have entered the lake, negatively affecting the
walleye population, and it will need to be controlled.
2. Discuss the importance of using consistent sampling techniques (such as scooping
or netting in the same location, and in the same way, for each sample).
3. Compare the data of the various teams. Why do the numbers vary? (One reason
might be that variations will occur if the fish sample sizes are different. Or, each
team may have used a different technique for scooping fish.)
4. The Petersen method uses one sample to estimate population size.
a. How can this be a problem? (The single sample may not have been
representative of the entire fish population. Other sampling methods called
the Schnabel and Schumacher methods use multiple samples.)
b. How can this be helpful? (Using multiple samples increases the accuracy of
the estimate because the chances of obtaining representative samples are
increased.)
30
Collecting Data- Science Institute 2013-2014
5. What are some of the difficulties that fisheries biologists might encounter when
doing lake surveys? (Bad weather conditions, poor sampling technique, researcher
bias, lifting heavy nets filled with fish, all the tagged fish clustering in one part of
the lake, not catching any fish in the sampling nets, many different fish species in a
lake.)
6. What are the benefits of fish tagging? (Tags can identify individual fish by giving
each fish its own number or code, allowing that fish to be tracked over time.)
7. How might fisheries biologists increase the accuracy of tagging surveys? (They
might take multiple samples.)
8. How do lake surveys help fisheries managers? (Lake survey data is used to
estimate fish population sizes and track population trends, evaluate the
effectiveness of management actions such as stocking, and establish realistic
management goals for a given lake.)
Assessment Options
1. Have students create a brochure to explain the benefits of lake surveys to another
class.
2. Ask students to write a simple outline of a mark-recapture survey and explain why
fish surveys are used to estimate the size of a fish population.
3. Have students explore the mark-recapture method further by completing the
following exercises:
a. You have been asked to determine the walleye population in two lakes in
your area. One lake is quite small; the other is a large lake. In your mark
run you catch, tag, and release 50 walleye from each lake. The next day,
you return to complete your recapture run. You use the same technique and
catch 50 walleye from each lake. In the net, you have recaptured two
tagged fish from the large lake, and twelve tagged walleye from the small
lake. The Petersen Index: N = MC/R
i. Use the Petersen method to estimate the size of the walleye
population in the large lake.
ii. Use the Petersen method to estimate the size of the walleye
population in the small lake.
iii. Explain why the large lake would have fewer recaptured walleye
than the small lake.
31
Collecting Data- Science Institute 2013-2014
In exercise b,
students can use
example numbers
to help them
deduce the answer.
a. 40, 40, 30
b. 40, 75, 30
c. 100, 100, 35
d. 100, 100, 10
b. Which of the following lake survey results are from the lake with the largest
walleye population?
i. small mark run sample (M), small recapture run sample (C), large
number of recaptured tagged walleye (R)
ii. small mark run sample (M), large recapture run sample (C), large
number of recaptured tagged walleye (R)
iii. large mark run sample (M), large recapture run sample (C), large
number of recaptured tagged walleye (R)
iv. large mark run sample (M), large recapture run
sample(C), small number of recaptured tagged
walleye (R)
Survey iv was done in the lake with the largest walleye
population. We know this because the mark run and the
recapture run were both large samples, and only a small
number of tagged walleye were recaptured in the recapture
run. A low proportion of tagged fish in the recapture run
indicates a larger population. Survey a. was done in the lake
with the smallest walleye population because a small number of walleye were
captured in the recapture run, and a large proportion of those were recaptured
tagged walleye. A small recapture run with a high proportion of recaptured fish
indicates a small population.
4. Assessment options include the Checklist and Rubric created by the MinnAqua
Program found in the original lesson: http://tinyurl.com/fishsurveys
32
Collecting Data- Science Institute 2013-2014
Extensions:
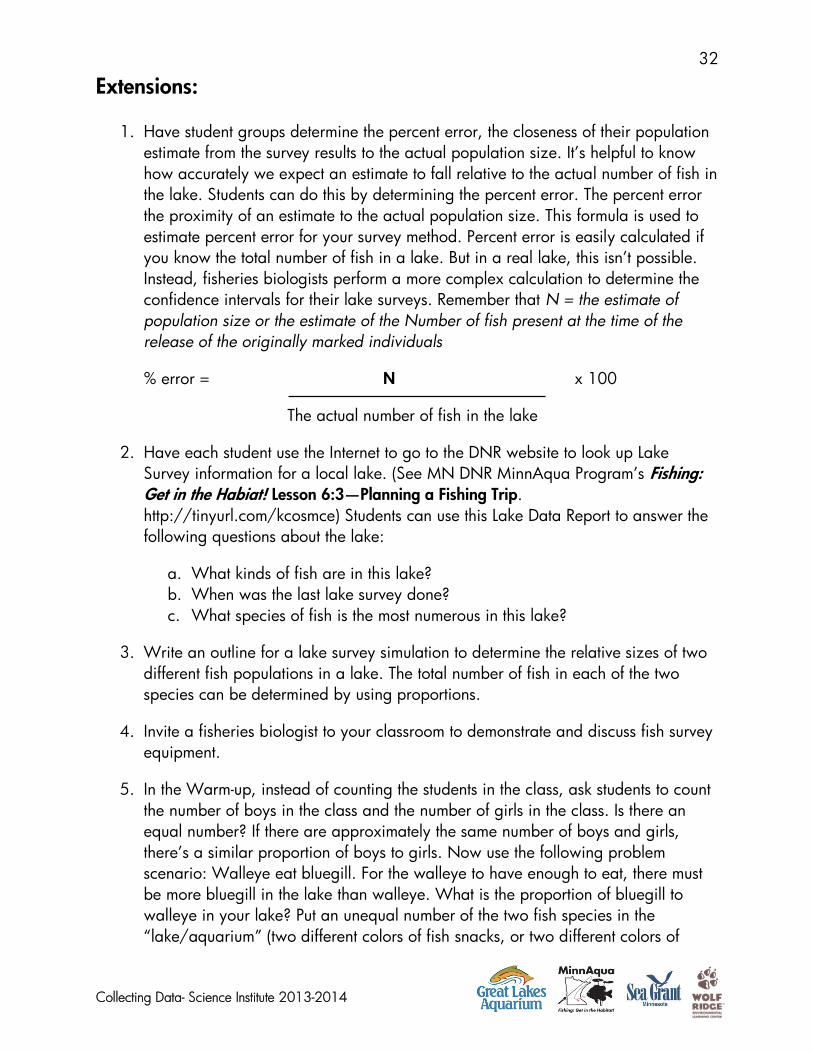
1. Have student groups determine the percent error, the closeness of their population
estimate from the survey results to the actual population size. It’s helpful to know
how accurately we expect an estimate to fall relative to the actual number of fish in
the lake. Students can do this by determining the percent error. The percent error
the proximity of an estimate to the actual population size. This formula is used to
estimate percent error for your survey method. Percent error is easily calculated if
you know the total number of fish in a lake. But in a real lake, this isn’t possible.
Instead, fisheries biologists perform a more complex calculation to determine the
confidence intervals for their lake surveys. Remember that N = the estimate of
population size or the estimate of the Number of fish present at the time of the
release of the originally marked individuals
% error = N x 100
The actual number of fish in the lake
2. Have each student use the Internet to go to the DNR website to look up Lake
Survey information for a local lake. (See MN DNR MinnAqua Program’s Fishing:
Get in the Habiat! Lesson 6:3—Planning a Fishing Trip.
http://tinyurl.com/kcosmce) Students can use this Lake Data Report to answer the
following questions about the lake:
a. What kinds of fish are in this lake?
b. When was the last lake survey done?
c. What species of fish is the most numerous in this lake?
3. Write an outline for a lake survey simulation to determine the relative sizes of two
different fish populations in a lake. The total number of fish in each of the two
species can be determined by using proportions.
4. Invite a fisheries biologist to your classroom to demonstrate and discuss fish survey
equipment.
5. In the Warm-up, instead of counting the students in the class, ask students to count
the number of boys in the class and the number of girls in the class. Is there an
equal number? If there are approximately the same number of boys and girls,
there’s a similar proportion of boys to girls. Now use the following problem
scenario: Walleye eat bluegill. For the walleye to have enough to eat, there must
be more bluegill in the lake than walleye. What is the proportion of bluegill to
walleye in your lake? Put an unequal number of the two fish species in the
“lake/aquarium” (two different colors of fish snacks, or two different colors of
33
Collecting Data- Science Institute 2013-2014
beans). For example, use a proportion of 3 to 1, or 4 to 1. Tell students the
fisheries biologists must determine the best estimate for the proportion of the two
species (walleye and bluegill) in the lake--the number of bluegills for every walleye
in the lake. Choose at least three student volunteers and have them come up to
your lake one at a time. Have each take a sample (define sample) using the net.
Remind each to not look in the lake and to take one sweep with the net. Return the
fish to the lake after each sample and stir the fish to simulate them swimming in the
lake. For each sample, write down the number of beans of each color. What is the
proportion of bluegill to walleye in each sample? Conclude by discussing the
results and determining the estimate of the proportion of walleyes to bluegills in
your lake. Discuss why counting every fish in a lake to get an exact number isn’t
possible, and why collecting samples to gain information is useful. If you have
time, take more samples, allowing each student a turn.
6. Ask students to make an argument for which survey method would be most
appropriate for the following situations. Keep in mind how each method works,
where fish will be located in the water column, and be able to give supporting
reasons for why a particular (or combination) method is most ethical and effective.
You could also assign each method to a group, and then have that “expert” group
debate why or why not to use the method they represent.
a. Assessing the number of fish that migrate through a stream
b. Total Fish population in a deep lake (over 100 meters deep)
c. How many juvenile fish (from stock fish population) survived
d. Population of big game fish (pike, muskegs) in a lake
34
Collecting Data- Science Institute 2013-2014
K-2 Options:
1. Read the Dr. Seuss book One Fish, Two Fish, Red Fish, Blue Fish to your class. This
children’s story is known to most students, and they’ll be able to identify with it. It
provides common ground—a base on which to construct knowledge. The book is
about fish, counting, colors, and more. It can prompt your students to start thinking
about fish, counting fish, and diversity. The lesson builds on the story by
addressing real-world fish counting using an estimation method for determining the
size of fish populations and various fisheries management tools.
2. Do the Warm-up. Invite a fisheries biologist to bring nets and fish survey
equipment to class, and explain how they’re used to capture fish. Use the
aquarium with beans or fish snacks to show students that it isn’t easy to estimate
the number of fish in a lake when you can’t see all of them.
Brought to you by Great Lakes Aquarium, MN DNR MinnAqua Program, Minnesota Sea Grant, and Wolf
Ridge ELC. This project is funded in part by the Coastal Zone Management Act, by NOAA’s Office of
Ocean and Coastal Resource Management, in conjunction with Minnesota’s Lake Superior Coastal
Program.
35
Collecting Data- Science Institute 2013-2014
Lake Scenario
You’re a fisheries biologist working for the state. Area residents have been calling your
office to report that they’re not catching as many walleye in your lake as they have in
past years. The resort owners on the lake are concerned that people will stop coming to
fish.
The fisheries supervisor knows that the walleye fishing on the lake has been very good for
as long as she can remember. She also knows that fishing on the lake is very important for
the local economy, and that people travel here from long distances for the fishing.
Any negative change in the quality of fishing on the lake can have a serious impact on
local residents who depend on tourism for their livelihoods. The herons, loons, and eagles
around the lake also depend on the fish for food. If there are fewer fish in the lake, it can
be a sign that something unknown—loss of fish-spawning habitat, too much fishing
pressure, or poor water quality—is causing the walleye to migrate or die. Any problems
should be identified so the fisheries manager can decide which management tools to use
to address the population decline.
But it’s difficult to know from a few fishing trips how many fish are in the lake. Maybe the
fish just aren’t interested in the bait that the anglers are using this year. The fisheries
manager needs to find out how many walleye are really in your lake.
A lake survey was done three years ago on your lake. The estimated walleye population
at that time was 1,000 fish. The fisheries supervisor sends the fisheries biologists to your
lake to do research, and to conduct a new lake survey to find out how many walleye are
in the lake this year.
Tagging Survey Scenario
A tagging survey is a scientific method that can be used to estimate the number of fish of
a given species in a lake. You’ll use a net to take a sample of walleye (beans) from your
lake, count them, mark them with tags, and release them back into the lake. Because fish
move around, or migrate, in the lake, and the lake is fairly large, the fisheries biologists
must take several samples at various locations throughout the lake while conducting
population surveys. For each sample, the fisheries biologists will record the total number
of walleye captured as well as the number of tagged walleye that are recaptured.
Fisheries biologists know that the total number of walleye in the lake can be estimated by
determining the ratio of the number of tagged walleye recaptured in the nets to the
number of known marked or tagged walleye that were first released in the lake. (Define
ratio on the whiteboard board or overhead projection device. Ratio is the relationship or
proportion between two or more values.)