Embed Size (px)
Citation preview
COLLEGE CHOICE AND COMPETENCY-BASED EDUCATION
LEARNER MOTIVATIONS
by
Cali Marie Koerner Morrison
A dissertation submitted in partial fulfillment of the requirements for the degree
of
Doctor of Education
in
Higher Education Administration
MONTANA STATE UNIVERSITY Bozeman, Montana
April, 2018

©COPYRIGHT
by
Cali Marie Koerner Morrison
2018
All Rights Reserved

ii
DEDICATION
This dissertation is dedicated to my smart, sassy, inquisitive, strong young ladies, Bryce and Portia. May having witnessed me achieve this goal while working and being a mom help you see that with hard work you can do anything you put your mind to.
To my ever-supportive husband, Bryan, for loving me even when I’m a sleep-deprived lunatic looking for just one more resource, tweaking one more graphic, or chasing the next shiny thing that catches my eye. For sitting by my side as I cried and just listening – not passing judgment or trying to fix anything – just being there for me. I only hope that one day our girls will be so lucky to find partners like you.
To my parents who first set me on this journey by teaching me the importance of education and modeling its pursuit through your own passions. Thank you for moving me to the amazing school district that nurtured my curiosity and gave me a leg up as I moved beyond its hallways. I will never be able to repay you for all you have given me, but I only hope to pay it forward by doing the same for my girls.
To my little brother, the best UncKit in the entire world. Thank you for your keen editing eye, for your encouragement, and for making my girls jump up and down with joy when they hear your car on our road. I count myself one of the lucky ones to have such an amazing sibling.
To all the teachers I have had, and to all the teachers my daughters will have, for the sometimes-thankless job you do in helping shape young minds.
To all of my extended family, including my family-by-marriage – I couldn’t have better people in my life and in the lives of my girls.
To all the friends who have encouraged me in this process and supported me through understanding when I bring a bag of chips to the potluck instead of a fancy confection, entertaining my kids so I could write, not commenting on the bags under my eyes or the dissertation donut I’m carrying around right now. I am lucky to have such a strong support network.
To my Lillian, who was ripped from my life too soon. I don’t have words for what our friendship meant me. For how proud I am of you for what you were achieving at MSU, for the woman you were becoming. I wish we were walking this stage together, but I will stand proud in your memory.
And last, but most certainly not least, to Dr. Betsy Palmer, the amazing soul who started me on this doctoral journey. From providing me with an excellent academic base in my master’s program to providing me with your basement while we built our dream on a couple acres of land. To special Tuesdays and the smell of dal bhat on the stove and walks with Mac and Duncan through snowy fields. To chasing dreams and seeing them grow into beautiful children. Your support as my mentor, as my friend, carried me through this journey though you are no longer here to see its fruition. I promise to continue to pay it forward, and mentor others the way you did me.
iii
ACKNOWLEDGEMENTS
Taking this step in my academic journey would never have come to this point
without the guidance of my chair, Dr. Carrie Myers, thank you for picking up this
orphaned doctoral student & seeing me through to the next beginning. To my
esteemed committee Dr. Marilyn Lockhart, Dr. Sarah Schmitt-Wilson, Dr. Bryce Hughes,
thank you for the guidance in preparing me to cross over the academic threshold. Dr.
Jim Rimpau and Dr. Ann Ellsworth, thank you for your support as past committee
members. To the institutions & learners who participated, thank you! Dr. Niki Bray, my
doc-rock, thank you. To my WCET & APUS Teams thanks for supporting me through this
journey & helping me chase the shiny ideas. To Dr. Patricia Campbell who reminds me
that nothing great happens without a little salty liquid. To the UW-M DETA Divas may
we continue our shared identity as researchers-by-day (or night!). To my academic
auntie, Dr. Karen Paulson, knit on sister. I am also grateful for Drs. Dave Longanecker,
Peter Ewell, Sally Johnstone, Karen Pedersen, Van Davis, Jeff Borden, Karan Powell,
Vernon Smith, Mike Offerman, Wally Boston, Matt Pistilli, Ellen Wagner, Mark Milliron,
& the late Drs. Bruce Chaloux & John Ebersole and Ed Klonoski & Russ Poulin for each
taking time to answer my questions. To Jamie O’Callaghan, best lunch date around! To
Steve Luft for all the times you let me bend your ear! Thanks to my CBE Thought-
Partners Drs. Lisa Hite, Sasha Thackaberry & Joellen Shendy & my eduinnovation co-
conspirators incl. Dr. Whitney Kilgore, Dr. Luke Dowden & #3wedu #DLNChat #LOOP!
iv
TABLE OF CONTENTS
1. INTRODUCTION TO THE STUDY ...................................................................................... 1
Introduction ..................................................................................................................... 1 Problem Statement ......................................................................................................... 5 Purpose of the Study ....................................................................................................... 8 Research Questions ......................................................................................................... 8 Significance of the Study ................................................................................................. 9 Theoretical/Conceptual Framework ............................................................................. 11 Research Design ............................................................................................................ 14 Operational Definitions ................................................................................................. 15
Authentic Assessment........................................................................................... 15 College Choice ....................................................................................................... 16 Competency-based Education .............................................................................. 16 Direct Assessment Competency-based Education ............................................... 16 Enrollment Motivators .......................................................................................... 17 Learners ................................................................................................................ 17
Assumptions ...................................................................................................................... 17 Delimitations ..................................................................................................................... 18 Limitations......................................................................................................................... 19 Summary ........................................................................................................................... 19
2. LITERATURE REVIEW ..................................................................................................... 21
Introduction ................................................................................................................... 21
What is Competency-based Education? ............................................................... 22 Historical Developments of Competency-based Education.......................................... 28
Apprenticeships .................................................................................................... 28 The Carnegie Unit and Higher Education .............................................................. 29 The Competency-based Education Programs of the 1970s ................................. 32 The Public Internet and Online Education ............................................................ 33 Western Governors University ............................................................................. 36 Direct Assessment Programs ................................................................................ 37
Competency-based Education Learners ....................................................................... 43 Adult and Non-Traditional Learners ..................................................................... 45 Access to Higher Education................................................................................... 47 The College Choice Process................................................................................... 50
Summary ....................................................................................................................... 58
v
TABLE OF CONTENTS CONTINUED 3. METHODOLOGY ............................................................................................................ 60 Introduction ................................................................................................................... 60 Research Questions ....................................................................................................... 62 Research Design and Rationale ..................................................................................... 63 Research Context .......................................................................................................... 64 Survey Methodology ..................................................................................................... 66 Population & Sample ..................................................................................................... 68 Variables and Constructs ............................................................................................... 79
Instrumentation .................................................................................................... 75 Instrumentation Validity and Reliability ....................................................................... 94 Data Analysis ................................................................................................................. 98 Study Reliability and Validity ....................................................................................... 104 Summary ..................................................................................................................... 106 4. RESULTS ....................................................................................................................... 107
Introduction ................................................................................................................. 107 Analysis ........................................................................................................................ 108
Characteristics of Competency-based Education Learners ................................ 108 Learners’ Characteristics predict Enrollment Motivators................................... 115
Modality .................................................................................................. 115 Learning Goals ......................................................................................... 116 New Career ............................................................................................. 116 Professional Goals ................................................................................... 117 Social Goals ............................................................................................. 117
Learner Satisfaction with Decision to Enroll ....................................................... 121 Enrollment Motivators and Predicting Learner Satisfaction .............................. 125
Modality .................................................................................................. 126 Learning Goals ......................................................................................... 126 New Career ............................................................................................. 127 Professional Goals ................................................................................... 127 Social Goals ............................................................................................. 128 Significant Enrollment Motivators – Modality, Learning Goals, and Social Goals ............................................ 128
College Choice Process ....................................................................................... 136 College Choice Process Conclusion ..................................................................... 157
5. CONCLUSIONS ............................................................................................................. 158
vi
TABLE OF CONTENTS CONTINUED Introduction ................................................................................................................. 158 Overview of the Study ................................................................................................. 158 Methodology ............................................................................................................... 159 Discussion of the Research Results ............................................................................. 161
Research Question #1 ......................................................................................... 161 Research Question #2 ......................................................................................... 164 Research Question #3 ......................................................................................... 167 Research Question #4 ......................................................................................... 168 Research Question #5 ......................................................................................... 171
Survey Question 1 ................................................................................... 171 Survey Question 2 ................................................................................... 172 Survey Question 3 ................................................................................... 173 Survey Question 4 ................................................................................... 174 Survey Question 5 ................................................................................... 174 Survey Question 6 ................................................................................... 175 A Look at Themes from the Survey Questions ....................................... 176
Recommendations from the Study ............................................................................. 177 Limitations ................................................................................................................... 180 Recommendations for Further Research .................................................................... 181 Conclusions .................................................................................................................. 182 REFERENCES CITED .......................................................................................................... 184 APPENDICES .................................................................................................................... 205
APPENDIX A: Email Request to Learner Participants .......................................... 206 APPENDIX B: College Choice and Competency-based Education Learner
Motivations Survey ....................................................................... 208
vii
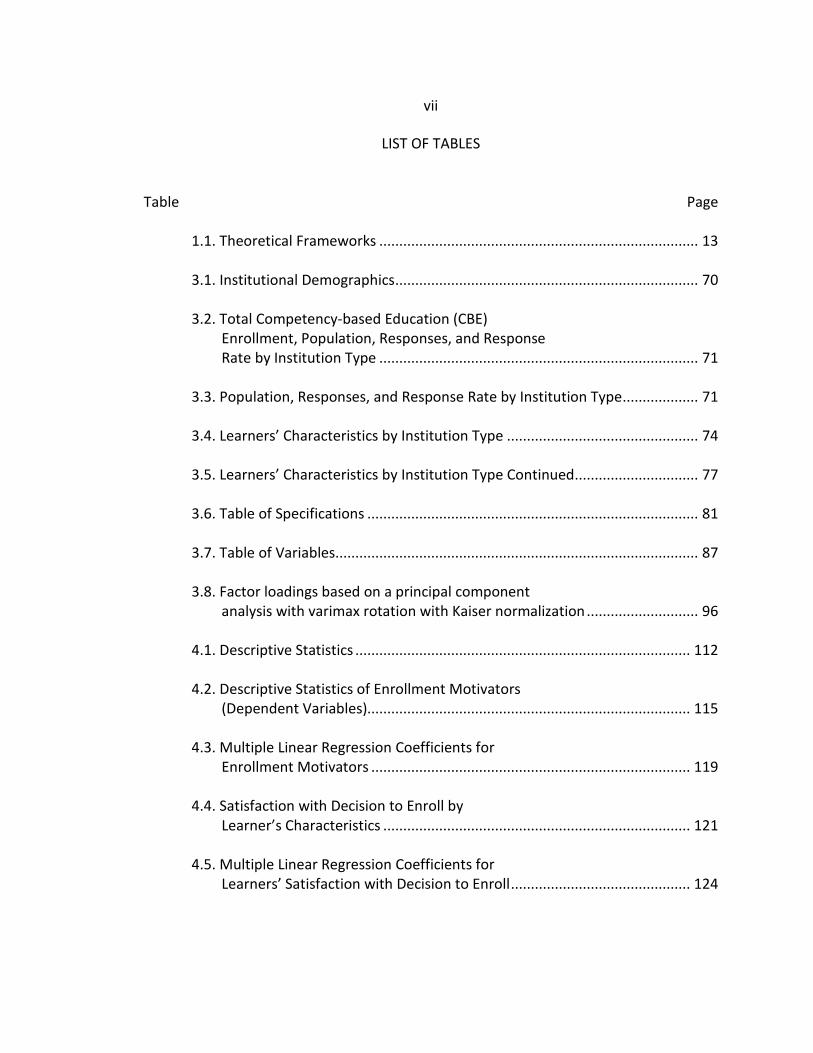
LIST OF TABLES
Table Page
1.1. Theoretical Frameworks ................................................................................ 13
3.1. Institutional Demographics ............................................................................ 70 3.2. Total Competency-based Education (CBE)
Enrollment, Population, Responses, and Response Rate by Institution Type ................................................................................ 71
3.3. Population, Responses, and Response Rate by Institution Type ................... 71 3.4. Learners’ Characteristics by Institution Type ................................................ 74
3.5. Learners’ Characteristics by Institution Type Continued ............................... 77 3.6. Table of Specifications ................................................................................... 81 3.7. Table of Variables........................................................................................... 87 3.8. Factor loadings based on a principal component
analysis with varimax rotation with Kaiser normalization ............................ 96
4.1. Descriptive Statistics .................................................................................... 112 4.2. Descriptive Statistics of Enrollment Motivators
(Dependent Variables)................................................................................. 115
4.3. Multiple Linear Regression Coefficients for Enrollment Motivators ................................................................................ 119
4.4. Satisfaction with Decision to Enroll by
Learner’s Characteristics ............................................................................. 121
4.5. Multiple Linear Regression Coefficients for Learners’ Satisfaction with Decision to Enroll ............................................. 124
viii
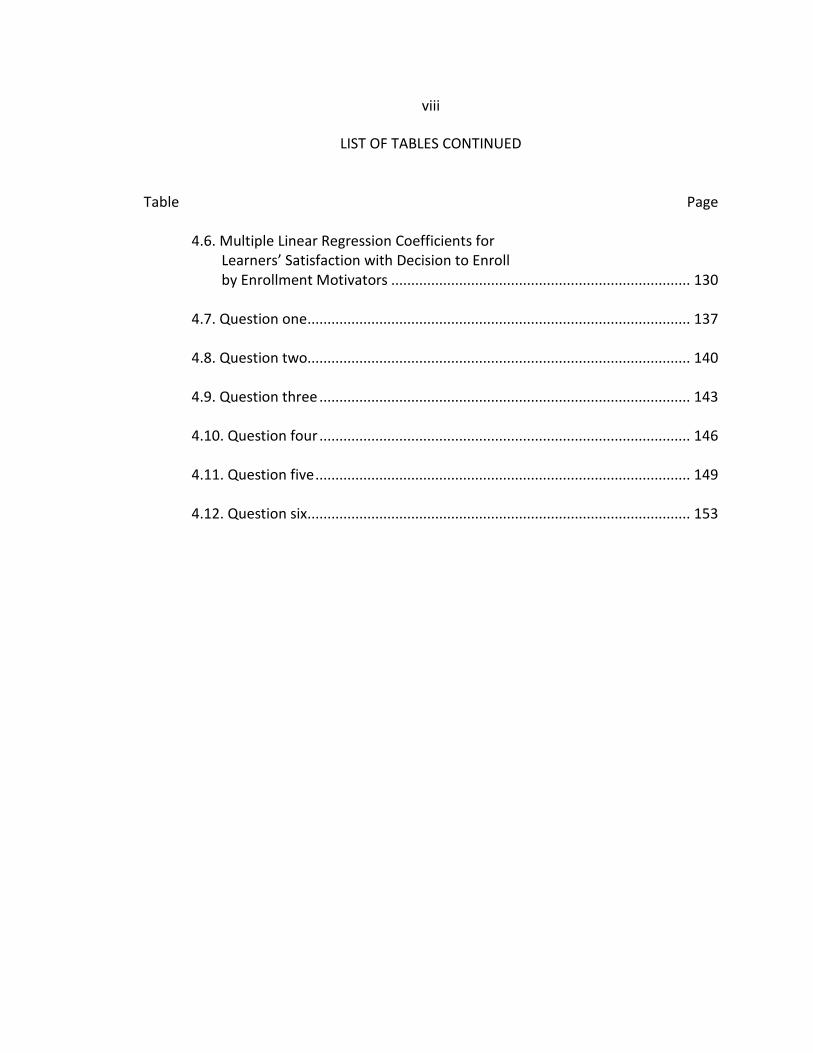
LIST OF TABLES CONTINUED Table Page
4.6. Multiple Linear Regression Coefficients for Learners’ Satisfaction with Decision to Enroll by Enrollment Motivators ........................................................................... 130
4.7. Question one ................................................................................................ 137 4.8. Question two................................................................................................ 140 4.9. Question three ............................................................................................. 143 4.10. Question four ............................................................................................. 146 4.11. Question five .............................................................................................. 149 4.12. Question six ................................................................................................ 153
ix
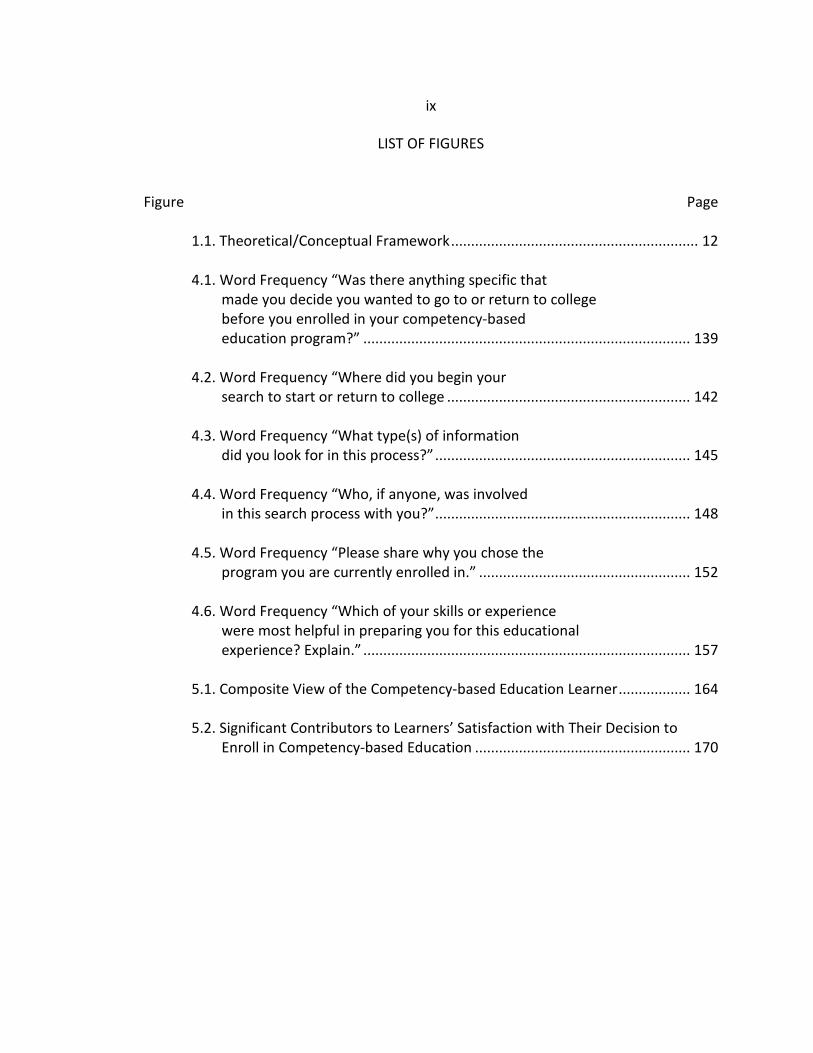
LIST OF FIGURES
Figure Page
1.1. Theoretical/Conceptual Framework .............................................................. 12 4.1. Word Frequency “Was there anything specific that
made you decide you wanted to go to or return to college before you enrolled in your competency-based education program?” .................................................................................. 139
4.2. Word Frequency “Where did you begin your
search to start or return to college ............................................................. 142
4.3. Word Frequency “What type(s) of information did you look for in this process?” ................................................................ 145
4.4. Word Frequency “Who, if anyone, was involved
in this search process with you?” ................................................................ 148
4.5. Word Frequency “Please share why you chose the program you are currently enrolled in.” ..................................................... 152
4.6. Word Frequency “Which of your skills or experience
were most helpful in preparing you for this educational experience? Explain.” .................................................................................. 157
5.1. Composite View of the Competency-based Education Learner .................. 164 5.2. Significant Contributors to Learners’ Satisfaction with Their Decision to
Enroll in Competency-based Education ...................................................... 170
x
ABSTRACT
Recently there has been a resurgence of interest in competency-based education, a learning modality which is mastery-based, self-paced and focused on demonstrations of knowledge and skill rather than where or how they were attained (C-BEN, 2016; Cuckler, 2016; Tate & Klein-Collins, 2015; U.S. Department of Education, 2002). The face of higher education is changing, according to NCES (2015), 75% of students enrolled in college have one or more nontraditional characteristics. Recent studies suggest that competency-based education enrollees may fall under the larger non-traditional student population; (Kelchen, 2015; Kelchen, 2016; Kelly & Columbus, 2016). The purpose of this study was to investigate the learners’ characteristics, college choice process, and learners’ satisfaction with their decision to enroll in competency-based education. This multi-institutional study employed descriptive statistics, correlational research design utilizing ordinary least squares regression analyses, and quantitative content analysis.
This study found the typical competency-based education learner is a nearly 39-year-old, married (66.2%), white (84.4%), Non-Hispanic (89.6%) female (70.2%) who has been out of high school for just over 20 years. She lives in a different location than her current institution (68.5%) and has studied at a prior college (95.7%), including study in her current discipline (61%). She is slightly less likely to be a first-generation student (51.2%) than she is to be the first in her family to go to college. She is also more likely to be eligible for a Pell Grant (48.8%) than not. She is employed full time (71.4%), works an average of 38 hours a week and has worked for nearly 10 years (M=9.63, SD=9.28) in her field of study. 88.1% of these learners were very or extremely satisfied with their decision to enroll in competency-based education. The modality, learning goals, and social goals enrollment motivators significantly, positively influenced learners’ satisfaction with their decision to enroll. Common themes emerged in the choice process including affordability, career advancement, learning goals, and learning modality. I conclude that each learners’ path to CBE is their own and higher education institutions need to place greater emphasis on this learning pathway’s knowledge building capabilities rather than solely it’s perceived vocational focus.
1
CHAPTER ONE – INTRODUCTION TO THE STUDY
Introduction
Susan1 never wanted to go back to school: she’d done the calculations, she was
closer to retirement than anything else, and the payout of a college degree didn’t
balance with the cost to obtain it. With years of industry experience, a good job, and
children nearing college themselves, the prospect of having to pay and wait until she’d
passed a class to be reimbursed was too much risk (Morrison, 2015). Like many non-
traditional, distance learners, the cost of higher education weighed heavily in her choice
process (Lansing, 2017; Morrison, 2016). Her employer partnered with a competency-
based education program, offering employees the opportunity to learn with no upfront
cost, and Susan’s entire perspective changed. Something she had written off as
unattainable became a realistic choice. Over the next several months Susan dove into
her studies headfirst, coming out just nine months later with an associate degree, and a
thirst to continue. She continued working toward her bachelor’s degree, even
considered going on from there (Morrison, 2015).
Susan not only attained her degree but modeled for her children the dedication
it takes to complete a degree while working and raising a family. The availability of
competency-based education made access to higher education a viable choice for
Susan. By obtaining her degree, the effect is further reaching than Susan’s own
1 Name changed to protect the promised anonymity of the research participant.
2
academic and career development. One moment, a small catalyst, and at least three
lives are changed for the better. Prior research has shown that learners whose mothers
have earned a college credential are more likely to attain one themselves (Atwell, et al,
2007; Yakaboski, 2010).
To set the context, this study will utilize the terminology ‘learner’ to refer to
those who are over eighteen, participate in organized educational activities, and have
one or more characteristics of a non-traditional student (Choy, 2002; Cross, 1978; Cross,
1979; Finch, 2016; NCES, 2015). The term learner is commonly used in the adult
education and adult learning literature to which this research will contribute. Also
included in this literature is the practice of competency-based education as a learning
modality aimed at adult learners. While it is experiencing contemporary interest, this
method has a relatively brief history in the greater context of higher education.
Since the 1970s, institutions of higher education have been offering what is
known as competency-based education (CBE), a learning modality where learners
demonstrate mastery of a set of competencies that comprise a credential (C-BEN, 2016;
Grant, 1979; Spady, 1977; U.S. Department of Education, 2002). In postsecondary
education, there are currently several types of competency-based education programs:
those that are tied to the credit hour and courses, those that operate without a cross-
walk to the credit hour through direct assessment of competencies, and a hybrid of
these two (Book, 2014; Brower, 2014; Ebersole & Stewart, 2011; Fain, 2015; Hatcher
3
Group, 2014; Johnstone & Soares, 2014; Kelchen, 2015; Laitinen, 2012; Snowden, 2014;
U.S. Dept. of Education, 2014).
Excelsior College, Thomas Edison State College, Charter Oak State College,
Alverno College, and SUNY Empire State were all founded in the early 1970s with
directives to serve adult learners (Ebersole & Stewart, 2011; Klein-Collins, 2013;
Thackaberry, 2016). With these directives in mind, the institutions developed
competency-based education programs that met the flexibility adult learners needed to
complete credentials. These early competency-based education programs allowed
learners to bring in prior learning or use institutional resources, namely learning
materials and faculty, to develop the knowledge and skills necessary to prove their
mastery of competencies through authentic assessments. Wax and Klein-Collins (2015)
described authentic assessments succinctly as “the kind of projects or assignments that
they [learners] would regularly encounter in an actual workplace” (para. 4). Once
mastery is certified, students are awarded credit that leads to a higher education
credential, whether a certificate or a degree.
After the dawn of the internet age, in 1997, the governors of 19 western states
banded together to found Western Governors University. The purpose of this new
institution was to develop the workforce needs of rural western states by providing
access to quality credentials (Book, 2014; Ebersole & Stewart, 2011; Johnstone &
Soares, 2014; Kelchen, 2015; Laitinen, 2012; Morrison, 2016; Thackaberry, 2016a).
Within a decade, the Department of Education saw the value of this modality of
4
education and included a provision in the Reauthorization of the Higher Education Act of
1965 to include direct assessment competency-based education (Fain, 2013a; Lacey &
Murray, 2015; Lederman, 2012; U.S. Department of Education, 1999). While Western
Governors University did not continue the direct assessment path, this provision opened
the door for innovation. It would be another 5 years before anyone acted on the
provision, but when Paul LeBlanc, president of Southern New Hampshire University did
with College for America, it solidified contemporary interest in competency-based
education (Clerkin & Simon, 2014).
In January of 2015, the U.S. Department of Education used authority under the
experimental sites program to award over 40 institutions authorization to develop new
programs which are self-paced, competency-based education programs tied to the
credit hour or a hybrid of direct assessment program and some credit hour-based
coursework. (Fain, 2015; Morrison, 2016; U.S. Department of Education, 2014). The
implementation of these programs was delayed by a lag in the release of the operating
guidelines from the U.S. Department of Education, which were a condition in the
accreditors’ approval process for substantive change requests for new and revised
competency-based education programs (Bounds, 2015; C-RAC, 2015; Laitinen, 2015).
The rise of this wave of competency-based education is driven by the many calls
for a better educated American populace, by President Barack Obama (2009) and the
major foundations which support higher education (Lumina, 2009). Competency-based
education provides another avenue for access to higher education. Learners who
5
pursue competency-based education look for the ability to “work the school around
[their] life” and are conscientious regarding both time and financial costs. (Morrison,
2016, p.74). This allows learners to diminish the opportunity cost of pursing higher
education by allowing them to continue their work, family, and community obligations.
Learners cannot engage in higher education until they make an institutional
choice and enroll in a program. Without understanding the college choice process, we
risk providing an inequitable access. College choice varies greatly for different
subpopulations of learners – both in what motivates them to enroll in higher education
and what process they undertake to make that decision. Many adult learners make a
concurrent decision of both when and where to enroll (Bers & Smith, 1987; Morrison,
2016; NCES, 2015; NPEC, 2007). This research is built on the college choice model of
Southerland (2006) while also drawing proxies from the community college choice
literature (Broekemier, 2002; Laanan, 2003, Peek & Goldstein, 1991; Somers, et.al.,
2006; Southerland, 2006). What little is known about the competency-based education
student population shows parallels to community college enrollees.
Problem Statement
The face of higher education is changing, and in addition to continuing to
support our traditional student populations, institutions need to consider the best way
to address the educational and student support needs of nontraditional learners.
According to NCES (2015), seventy-five percent of students enrolled in college have one
6
or more nontraditional characteristics. Nontraditional characteristics include: being
independent (for tax purposes), having dependents, having received a GED or other high
school equivalency rather than a high school diploma, delaying postsecondary
attendance, attending part-time, and working full-time (NCES, 2015, p. 6). With non-
traditional learners attending higher education at higher rates than ever before, more
attention to the needs of these learners is warranted (Stevens, 2014).
Recent studies suggest that competency-based education enrollees may fall
under the larger non-traditional student population; however, more information is
needed about the characteristics of CBE learners to understand specific impacts on
access, recruitment, and delivery of services (Kelchen, 2015; Kelchen, 2016; Kelly &
Columbus, 2016). As Kelchen (2016) notes, the only data currently available on
competency-based education enrollees from federal datasets, such as IPEDS, are those
learners enrolled in institutions with primarily competency-based operations. NCES
does not separate competency-based enrollments from other types of enrollments such
as distance education enrollments. However, from the nine institutions Kelchen (2016)
studied, the data shows that 90% of these learners were 25 or older, on average 24%
received Pell grants – an indicator of low-income status -- and on average 55% were
women.
My previous research (2016) mirrors these statistics showing direct assessment
competency-based education learners are working adults, with family and community
commitments in addition to their school work. They make decisions based upon
7
financial impacts including the acceptance of transfer credits and employer benefit
programs and the opportunity costs of programs in addition to direct costs (Morrison,
2016). To understand the reasons learners’ choose competency-based education
programs, we must also investigate how learners select what program to enroll in.
Research on the college choices of older learners is scant and tends to be
focused on community college enrollees (Broekemier, 2002; Laanan, 2003; Peek &
Goldstein, 1991; Somers, et.al., 2006; Southerland, 2006). Whether they are new to
postsecondary education or a returning learner, the literature about the college choice
experiences of non-traditional learners is noted as lacking by several authors
(Bergerson, 2009; Kortesoja, 2009; NPEC, 2007; Morrison, 2016; Peek & Goldstein, 1991;
Perna, 2006; Roszawki & Reilly, 2005; Southerland, 2006). In her 2017 article, Jill
Lansing notes, “Despite the growing prevalence of distance learning opportunities and
the expanding body of research on distance education, research on college-going
decisions of distance learners is sparse (p.365).” In addition, new research by Andrew P.
Kelly and Rooney Columbus of the American Enterprise Institute (2016) note “fewer
articles have explored empirical questions as to who actually enrolls in CBE…” (p. 2).
Their research yielded just thirteen articles that look at learner characteristics and none
focused on the college choice process (Kelly & Columbus, 2016). When higher
education administrators, faculty, employers, and policymakers understand the factors
that influence students’ enrollment in competency-based programs, they can enhance
access to higher education, particularly for adult learners.
8
Purpose of the Study
The purpose of this study is to investigate the learners’ characteristics, college
choice process, and learners’ satisfaction with their decision to enroll in competency-
based education. The study utilizes data I first collected for the University of Wisconsin
– Milwaukee National Research Center for Distance Education and Technological
Advancements (DETA) in fulfillment of grant requirements. While that research focused
on the enrollment motivators for competency-based education enrollees, the survey
also contained questions related to these learners’ college choice process that are the
focus of this study. The intent of this study is to identify competency-based education
learners’ college choice process and explore if the enrollment motivators predict
learners’ perception satisfaction with their decision to enroll. Finally, this study
describes the learners’ characteristics in competency-based education. This study helps
demonstrate who is attending CBE programs and provides evidence for how these
programs expand access to higher education. This research will also assist the higher
education community in communicating the value of competency-based education to
potential learners, thus increasing their access opportunity.
Research Questions
Overall, the study investigates the learners’ characteristics and demographics of
competency-based education enrollees, also how they determined a competency-based
9
education program was the right opportunity to fulfill their educational, career, and life
goals. Specifically, it asks the following questions:
1. What are the characteristics of competency-based education learners?
2. Do characteristics of competency-based education learners predict enrollment
motivators?
3. Do characteristics of competency-based education learners predict satisfaction
with their decision to enroll?
4. Do the enrollment motivators predict competency-based education learners’
satisfaction with their decision to enroll?
5. What is the college choice process for competency-based education learners?
Significance of the Study
With the renewed interest in all forms of competency-based education by
students, institutions, and policymakers, this study is timely and relevant (Fain, 2015;
U.S. Dept. of Education, 2014). There are more than 500 competency-based education
programs in development, including the sixty eight percent of community colleges who
stated they are in the planning stages of implementing competency-based education
(AACC, 2016; Fain, 2016; Fain, 2015; Fleming, 2015; Kelchen, 2016; Mitchell, 2015;
Nodine, 2016; Public Agenda, 2015). With many institutions entering this educational
market, understanding the learners interested in this modality is key to competency-
based education implementation success.
10
This study will help institutions understand the enrollment motivators that led
students to choose a competency-based education program and the process they
undertook to make their final enrollment decision. Understanding these elements holds
the potential to assist institutions in opening access to learners through implementation
of this learning modality. For institutions, this could mean additional enrollments and
the potential through greater understanding of the population to retain learners in CBE
programs. Enrollments and retention are of greater importance than ever due to the
decreases in state funding the sector has seen over the years (Mitchell, Leachman, &
Masterson, 2016). The benefit goes beyond individual learners and institutions of
higher education. It supports the national educational attainment goals set by President
Obama in 2009 and echoed by many foundations that support higher education. The
goal to have America lead the world in postsecondary attainment by 2020 (Obama,
2009) will not be achievable without the addition of new learners.
As noted previously, the U.S. Department of Education recently utilized its
experimental sites authority to grant forty institutions more flexibility in crafting
competency-based education programs with regard to how they award federal financial
aid (Fain, 2015; Morrison, 2016; U.S. Department of Education, 2014). Adding to the
significance of this study is the dearth of extant literature on the college choices of adult
learners necessitating making proxies to community college learners (Broekemier, 2002;
Peak & Goldstein, 1991; Somers et al., 2006) and traditional learners (Hossler &
11
Gallagher, 1987; NPEC, 2007). Bers and Smith (1987) coined this well nearly three
decades ago:
While these models of college choice may apply to the nontraditional student, virtually no empirical studies have been conducted and reported in the literature to validate these models for nontraditional students (Bers & Smith, 1987, p.40).
Theoretical/Conceptual Framework
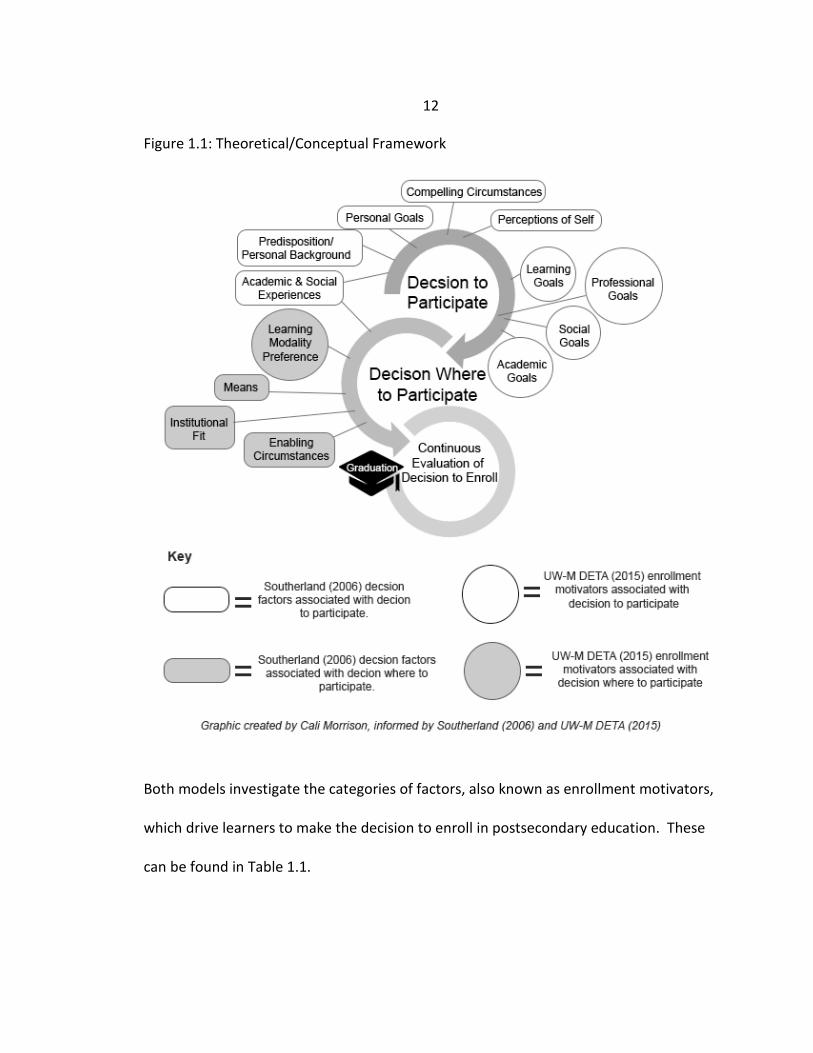
This study will draw on two theoretical frameworks, the 2006 college choice and
persistence model of Southerland and the 2015 enrollment motivation categories of the
University of Wisconsin – Milwaukee National Research Center for Distance Education
and Technological Advancements (DETA). Southerland (2006) posits that adult learners
utilize a three-decision point model for college choice and persistence (defined as
continued enrollment). Simply stated, first they decide whether to participate, then
when and where to participate, and finally they continuously reevaluate their prior
decisions until they complete a credential (Morrison, 2016; Southerland, 2006). This
process and its inputs and outputs are shown in Figure 1.1.
12
Figure 1.1: Theoretical/Conceptual Framework
Both models investigate the categories of factors, also known as enrollment motivators,
which drive learners to make the decision to enroll in postsecondary education. These
can be found in Table 1.1.
13
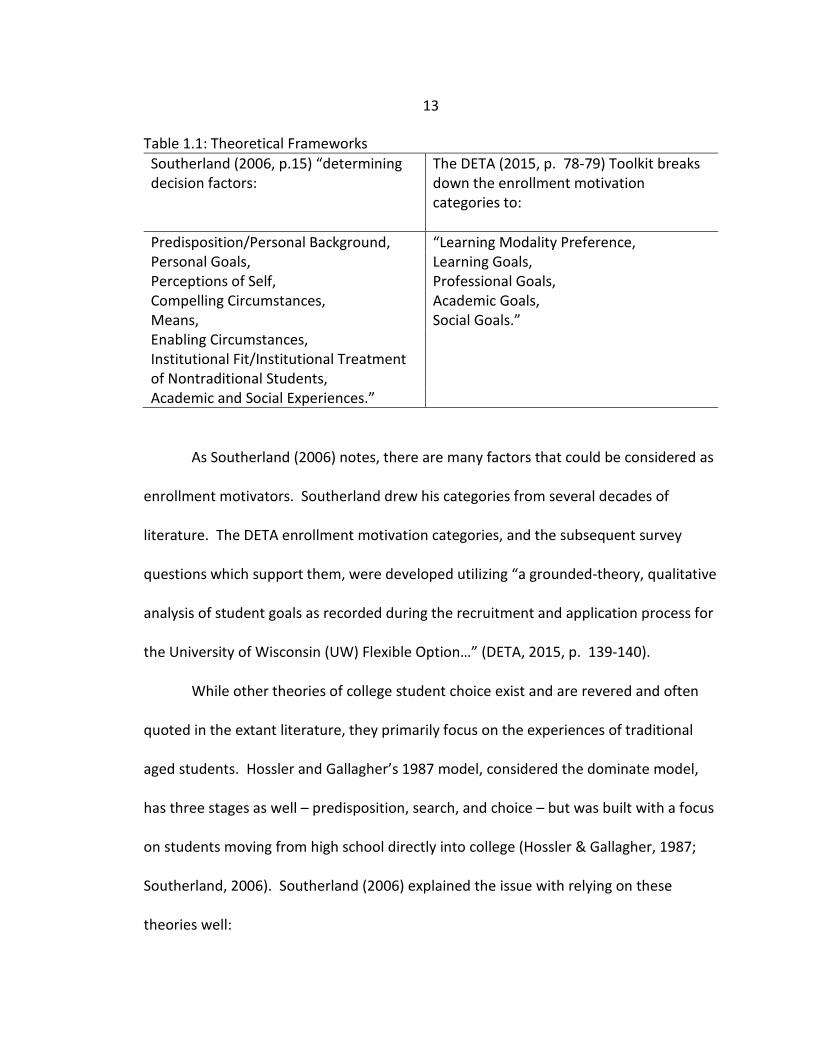
Table 1.1: Theoretical Frameworks Southerland (2006, p.15) “determining decision factors:
The DETA (2015, p. 78-79) Toolkit breaks down the enrollment motivation categories to:
Predisposition/Personal Background, “Learning Modality Preference, Personal Goals, Learning Goals, Perceptions of Self, Professional Goals, Compelling Circumstances, Academic Goals, Means, Social Goals.” Enabling Circumstances, Institutional Fit/Institutional Treatment of Nontraditional Students,
Academic and Social Experiences.”
As Southerland (2006) notes, there are many factors that could be considered as
enrollment motivators. Southerland drew his categories from several decades of
literature. The DETA enrollment motivation categories, and the subsequent survey
questions which support them, were developed utilizing “a grounded-theory, qualitative
analysis of student goals as recorded during the recruitment and application process for
the University of Wisconsin (UW) Flexible Option…” (DETA, 2015, p. 139-140).
While other theories of college student choice exist and are revered and often
quoted in the extant literature, they primarily focus on the experiences of traditional
aged students. Hossler and Gallagher’s 1987 model, considered the dominate model,
has three stages as well – predisposition, search, and choice – but was built with a focus
on students moving from high school directly into college (Hossler & Gallagher, 1987;
Southerland, 2006). Southerland (2006) explained the issue with relying on these
theories well:
14
Ironically, the prominent models of college choice and persistence have not been substantially overhauled for some time. Practitioners and theorists continue to rely upon models of college student behavior that are twenty, thirty, even fifty years old. As students evolve ever more rapidly, the accuracy and utility of these models erode at an ever-increasing pace (p. 2). The DETA enrollment motivators and Southerland’s college choice and
persistence model share common themes of personal, academic, and social experiences
and how they influence a learners’ college choice. These theories will define the code
book for the quantitative content analysis proposed for this study. A deeper discussion
of college choice theories is covered in Chapter 2 of this manuscript.
Research Design
The research design is a quantitative analysis of secondary survey data I
collected in fulfillment of grant deliverables committed to the University of Wisconsin –
Milwaukee National Research Center for Distance Education and Technological
Advancements (DETA) in 2016. The national population of competency-based enrollees
is difficult to fully determine. Federal datasets, such as the Integrated Postsecondary
Education Data System (IPEDS) do not delineate competency-based learners from other
institutional enrollments (Kelchen, 2015; Kelchen, 2016).
The population for this study is comprised of 5,142 enrollees from four
institutions offering competency-based, self-paced learning. While 421 survey
responses were collected, the usable sample size for this research was 346 learners.
15
Descriptive statistics were utilized to determine the learners’ characteristics of
competency-based education enrollees. Regression analyses were utilized to
investigate three areas – if learners’ characteristics predicted enrollment motivators; if
learners’ characteristics predicted satisfaction with their decision to enroll in
competency-based education; and if enrollment motivators predict learners’ satisfaction
with their decision to enroll. To investigate the college choice process, open-ended
textual questions were analyzed utilizing quantitative content analysis. The responses
were coded, utilizing computer aided text analysis along with human coding. Response
frequencies were tabulated.
Operational Definitions
For the purposes of this study, the operational definition is provided for each
term.
Authentic Assessment
Authentic assessment refers to the evaluation technique which asks learners to
“use academic knowledge in a real-world context for a significant purpose” (Johnson,
2002, p.165). Additional authors have noted that authentic assessment requires
“students to use the same competencies, or combinations of knowledge, skills, and
attitudes, that they need to apply in the criterion situation in professional life” (Gulikers,
Bastiaens, & Kirschner, 2004, p. 69). Authentic assessments can present as written
works, projects, portfolios, simulations, reports that mimic activity which is required of
16
professionals in the discipline being assessed, or even inter-disciplinary (Darling-
Hammond and Snyder, 2000; Gulikers et al., 2004; Johnson, 2002; Wiggins, 2011).
College Choice
College choice is the process a learner undertakes after they have been
motivated to enroll, to determine the right fit, and enroll in a postsecondary education
option (Bergerson 2009; Cabrera & La Nasa, 2000; Hossler & Gallagher, 1987; Jackson,
1987; Perna, 2006; Southerland, 2006).
Competency-based Education
Much of chapter two outlines the various definitions of competency-based
education. For the purpose of this research, it is defined as self-paced, mastery-based
learning focused on demonstrations of knowledge and skill rather than where or how
they were attained.
Direct Assessment Competency-based Education
Direct assessment competency-based education is best defined by the text
included in the 2006 revision of the Higher Education Act of 1965:
…an instructional program that, in lieu of credit hours or clock hours as a measure of student learning, utilizes direct assessment of student learning, or recognizes the direct assessment of student learning by others. The assessment must be consistent with the accreditation of the institution or program utilizing the results of the assessment (e-CFR, §668.10 (a)(1)).
17
Enrollment Motivators
Enrollment motivators are the factor(s) which converge and drive a student to
enroll in postsecondary education (Southerland, 2006). Southerland (2006) provides the
examples of personal goals, perceptions of self, and compelling circumstances.
Examples from the University of Wisconsin – Milwaukee National Research Center for
Distance Education and Technological Advancements (DETA) Toolkit (2015) include
“learning modality preference, professional goals, learning goals, academic goals, and
social goals” (p. 78-79).
Learners
Learners refers to those who are over eighteen, participate in organized
educational activities, and have one or more characteristics of a non-traditional student
(Choy, 2002; Cross, 1978; Cross, 1979; Finch, 2016; Merriam, Cafferella, and
Baumgartner,2007; NCES, 2015).
Assumptions
This research is based on the assumption that there are factors that motivated
learners to enroll in competency-based education programs and that learners
undertook a process to make their enrollment choice. The study also makes the
assumption, based on the work of Kelchen (2015, 2016) that the majority of the learners
enrolled in competency-based education programs are adult learners.
18
Delimitations
In the original data collection, I purposefully chose to limit the study to those
learners enrolled in competency-based education programs which are federally financial
aid eligible, have curriculum which are faculty developed (rather than outsourced to a
third-party provider), provide a personalized support person for enrollees (i.e. coach,
mentor, advisor, etc.) and are online, self-paced, and mastery-based learning. This was
under the advisement of the grant funder (T. Joosten, personal communication, April
12, 2016) to serve the purpose of data comparability between institutions. I also
purposefully chose to limit the study to undergraduate enrollees, as their motivational
factors may vary from graduate student enrollees. As there is great diversity in
institutions offering competency-based education programs, this did limit the depth of
the population but allows for a more focused investigation. The purpose for this focus is
to facilitate the comparability of the data. This study only looks at learners who made
the choice to enroll in a competency-based education program and does not attempt to
investigate those who considered a competency-based education program but
ultimately enrolled in another type of program.
19
Limitations
This study acknowledges the limitations of conducting a secondary analysis of
data rather than collecting primary data. Such as the inability to change the population
the data was collected from, the recruitment methods for both institutions and learners,
and the survey instrument itself. Although secondary data analysis has the mentioned
limitations, it is a valid methodology, which is underutilized in the social sciences (Smith,
2008).
Additionally, the self-select nature of the participants presents a limitation of the
original data collection. This is common in survey data collection. As the original survey
participation for learners was not tangibly incentivized, that could have affected the
number of participants. Furthermore, prior research by Morrison (2016) showed that
competency-based education programs are marketed with an eye toward the
motivational factors included in the survey, thus the influence of this marketing, which
is not being controlled for, could have affected students’ college choice.
Summary
Adult learners are no longer the outsiders in higher education, in fact,
nontraditional students are now the majority of learners (NPEC, 2015). Online learning
has moved from side stage to center stage (Poulin & Straut, 2016). Additionally, there
has been a revival in interest in the learning modality known as competency-based
education (AACC, 2016; Fain, 2016; Fain, 2015; Fleming, 2015; Kelchen, 2016; Mitchell,

20
2015; Nodine, 2016; Public Agenda, 2015; U.S. Dept. of Education, 2014). These
factors create an ideal space to explore how learners choose competency-based
education programs.
21
CHAPTER TWO – LITERATURE REVIEW
Introduction
Competency-based education is not a new phenomenon. Though it has gained
popularity in recent years, its origins can be traced back much further. This review of
the relevant literature will explore the historic moorings of competency-based
education and its winding path to where it is today. Additionally, we explore current
knowledge about who enrolls in competency-based education and what role that plays
in access to higher education in general. The review also looks at the history of the
college choice process and its connotations for this study.
To build a comprehensive view of these elements of the extant literature, I
utilized varied combinations of the terms “competency-based education,” “competency-
based learning,” “CBE,” “adult learners,” “college choice,” “college search,” “Non-
traditional [student, learner, college student],” “college choice theories,” “college choice
and online learning,” “college choice and distance education,” and “access and distance
education,” “access and college [choice, search, selection].” Utilizing these search terms
returned a variety of literature about these concepts. Much of the literature in
competency-based education focuses on specific disciplines or on elementary and
secondary education. Another section of the literature focuses on the development of
competencies, curriculum, and assessments for deploying competency-based education.
22
These topics were deemed adjacent to this research and not included in this literature
review.
There were three distinct waves of interest in competency-based education: the
mid-1970s to early 1980s, the late 1990s, and from 2010 to present. I observed, though
not formally investigated, the highest concentration of research on CBE during these
time periods. This literature review focused mostly on literature published after 2000;
however, where deemed seminal, older research was included. The purpose of this
focus was to recognize the influence of distance education technologies and promote
relevance to current practice. Also, research on competency-based or related topics
was limited to CBE research conducted in the United States, for reasons of population
comparability.
To begin, I will unpack the concept of competency-based education.
What is Competency-based Education?
To begin this discussion of competency-based education, I will examine each
element of the term. According to dictionary.com (n.d.), competence is “the possession
of required skill, knowledge, qualification, or capacity” and education is “the act or
process of imparting or acquiring particular knowledge or skills, as for a profession.”
Simply, competency-based education focuses on the demonstrated mastery of a set of
defined skills and knowledge rather than how, where, or how long it took the student to
develop that mastery. This contrasts with traditional online or on-ground academic
23
programs which are tied to time using the Carnegie Unit (Klein-Collins, 2013; Laitinen,
2012; Tate & Klein-Collins, 2015).
It is important to note that, while the various definitions of competency-based
education have similar elements such as maintaining a focus on learning rather than
time, there is no single agreed upon definition (Cuckler, 2016; Everhart, Bushway, &
Schejbal, 2016; Gervais, 2016; Kelchen, 2015, Sebesta, 2016, Thackaberry, 2016). Spady
(1977) treated competency-based education as: “a data-based, adaptive, performance
oriented set of integrated processes that facilitate, measure, record, and certify within
the context of flexible time parameters the demonstration of known, explicitly stated,
and agreed upon learning outcomes that reflect successful function in life roles” (p. 10).
In 1979, Grant and colleagues put forth, as the basis of their work exploring the
implications of competence-based education programs, the following definition:
Competence-based education tends to be a form of education that derives a curriculum from an analysis of a prospective or actual role in modern society and that attempts to certify student progress on the basis of demonstrated performance in some or all aspects of that role. Theoretically, such demonstrations of competence are independent of time served in formal educational settings (Grant, 1979, p. 6, pp. 3).
This definition fits well with much of the modern discussion, especially as it pertains to
how higher education is preparing (or not, as some believe) learners for the workforce.
However, competency-based education’s perceived vocational focus bars its wide
acceptance, as many within higher education still view the purpose of higher education
being more than vocational preparation (Bok, 2013; Fortino, 2012; Selingo, 2013;
Sutton, 2016).
24
In 2002, the U.S. Department of Education set their definition of competency as
“the combination of skills, abilities, and knowledge needed to perform a specific task”
(p. 7). While this definition of competency echoes within many of the other definitions,
it is still not a definitive definition used by the entire field. This is, in part, complicated
by the different modalities, or approaches, of competency-based education being
offered today.
It is possible the field is not operating from a single definition of competency-
based education because many still view it as a disruptive innovation (Weise, 2014).
According to Clayton Christensen (2017), disruptive innovation is “a process by which a
product or service takes root initially in simple applications at the bottom of a market
and then relentlessly moves up market, eventually displacing established competitors”
(para.1). To agree upon a definition could signal competency-based education is moving
toward becoming a sustaining innovation and more into the mainstream of higher
education (Christensen, 2017; Weise, 2014).
Another factor which may affect the use of a common definition is the divide
seen between two terms: learning and education. In a 2014 article in Strategic
Enrollment Quarterly, Monique Snowden made an observation by the work of Knowles,
Holton, and Swanson (2011) that there is a fundamental difference between education
and learning: namely which entity is being emphasized. Learners are the focal point of
competency-based learning, whereas educators are at the center of competency-based
education (Snowden, 2014).
25
Following in this same vein, the 2015 joint research published by the American
Council on Education and Blackboard, Inc. makes the distinction of competency-based
education focusing on the academic programs, practices, and policies whereas
competency-based learning focuses on learners and their experiences in learning
environments, whether those are formal or informal environments (Everhart, Sandeen,
Seymour, & Yoshino, 2015). Often, competency-based education and competency-
based learning are used interchangeably, likely stemming from the lack of a common
framework and vernacular. In this study, competency-based education will be the
primary term utilized, as the assessment of learning in a competency-based modality is
not within the scope of this study.
The Competency-based Education Network (C-BEN) defines competency-based
education as “an intentional and transparent approach to curricular design with an
academic model in which the time it takes to demonstrate competencies varies and the
expectations about learning are held constant” (C-BEN, 2016). As will be explained in a
later discussion of the Carnegie Unit, a focus on learning has not always been the case
for higher education. For over a century, time has been the constant and learning has
been variable (Klein-Collins, 2012; Klein-Collins, 2013; Laitinen, 2012). This means that
while all learners exit a course or program with the same number of credit hours, the
actual learning attained from learner to learner is different.
In their 2015 paper for the Council on Adult and Experiential Learning (CAEL),
Tate and Klein-Collins define competency-based education as, “programs that focus
26
more on what students have learned, rather than where or how long the learning takes
place” (p.2). Additionally, Tate & Klein-Collins (2015) state “CBE programs are designed
to improve the quality of higher education by putting the focus squarely on
demonstrated learning outcomes” (p.2).
There are several different implementations of competency-based education
being practiced today: direct assessment programs which assess learning without a
cross-walk to clock or credit hour, CBE programs tied to the credit hour and courses, and
a hybrid of these two modalities (Book, 2014; Brower, 2014; Ebersole & Stewart, 2011;
Fain, 2015; Hatcher Group, 2014; Johnstone & Soares, 2014; Kelchen, 2015; Kelchen,
2016; Laitinen, 2012; Snowden, 2014; Tate & Klein-Collins, 2015; U.S. Dept. of
Education, 2014). While some programs tied to the credit hour system have been
operating and eligible to offer federal financial aid for some time, only a handful of
direct assessment competency-based programs have been awarded the ability to offer
federal financial aid (Fain, 2015b).
The ability to offer federal financial aid does not affect the modalities of
competency-based education. Rather, possessing financial aid eligibility can affect
access, opening opportunity to learners who cannot afford to pay out of pocket. The
process for gaining eligibility for Federal Student Aid is quite rigorous. The program
must first obtain the approval of their institutional accrediting body to offer the direct
assessment modality and then must apply to the U.S. Department of Education. This
includes in-depth accounting of how learning will be measured, examples of those
27
measurements, the ways in which faculty will interact with students, and how
competency assessment compares to the credit or clock hour (U.S. Department of
Education, GEN-13-10, 2013).
Though they take on slightly different modalities, in her 2013 occasional paper
for the National Institute for Learning Outcomes Assessment (NILOA), Rebecca Klein-
Collins lays out five unifying concepts of competency-based degree programs:
1. “Competencies: An educated person is someone who does not just ‘know’
but can also ‘do’” (p. 5).
2. “Quality: Defining the competencies require for graduation helps ensure the
quality of graduates” (p. 6).
3. “Assessment: Competency-based assessment validates learning” (p. 7).
4. “Learning: Programs should focus on learning rather than on time spent in
learning activities” (p. 7).
5. “Student-Centered: Programs should ‘meet students where they are’” (p. 8).
Echoes of these concepts ring throughout each of the definitions of CBE described
earlier, support development of cohesive programs, and stand true across CBE modality.
These modalities share many similarities and could factor into a learner’s choice of a
specific competency-based program, because the modalities offer varying levels of
flexibility in learning.
28
Now that the foundation is laid for what competency-based education is, I will
explore the significant historical events and origins of the movement to bring learning to
the center of education.
Historical Developments of Competency-based Education
Apprenticeships
The origins of competency-based learning can be traced back to ancient Babylon
when young men worked to learn a craft or a trade from an experienced master
tradesperson and paid for it with an agreed upon number of years of work. These
arrangements continued throughout history, with apprentices moving up to the role of
journeyman after the agreed term and working for wages toward their own master
status (“Apprenticeship,” 2015). In more modern times, many institutions now employ
apprenticeship programs, which consist of concurrent enrollment in on-the-job training,
often with compensation or the promise of a job upon completion, and coursework
which complement each other (“Apprenticeship Programs,” 2013). In these early
programs, apprentices had to prove their skill and ability in order to progress from
apprentice to journeyman to master. Each step along the journey had distinct markers,
or competencies, which the junior man had to learn. Socio-politically, in the beginning
of documented apprenticeships, there were not vocational/technical postsecondary
schools through which young men could learn the skills. Their choices in life were more
limited, and social mobility would happen via apprenticeship programs. In these ways, I
29
see apprenticeships as one of the earliest contributors to the development of modern
competency-based education programs. This sentiment is echoed by Nodine (2016)
who stated, “the history of outcomes-based approaches can be traced back hundreds of
years to craft guilds, apprenticeship training programs, technical training programs (in
the military, etc.), and licensure programs (for doctors, lawyers, etc.)” (p.6). However,
since apprenticeship programs were typically time-bound, and only available to men,
they were different from modern competency-based education programs. The concept
of time, and how it has been used as a proxy for higher learning for over 100 years,
leads us next into an exploration of the Carnegie Unit.
The Carnegie Unit and Higher Education
In 1905, a ten-million-dollar check from Andrew Carnegie changed the way
colleges and universities are run to this very day (Silva & White, 2015; Silva, White &
Toch, 2015). It created the Carnegie Foundation for the Advancement of Teaching,
intended to create a pension system for professors, the logistics of which required
colleges and universities to begin tracking faculty workload, for equitable distribution of
the pensions (Silva & White, 2015; Silva et al., 2015). Following in the wake of the
Carnegie Unit, which was developed to track requirements for college preparatory high
school, colleges and universities adopted the credit hour as the unit of measure to track
faculty productivity (Silva & White, 2015; Silva et al., 2015). A credit hour is based on
the number of “contact hours” students spend in class per week in a given semester
(Silva et al., 2015). For a three credit-hour course, a student will typically spend 3 hours
30
in class per week for 15 weeks (Silva & White, 2015; Silva et al., 2015). A reflection of
the industrial background of the foundation’s namesake and the state of the American
labor force at this point in history, the credit hour was a mechanism to improve the
operational efficiency and standardization of higher education. Although, as Birnbaum
(2004) points out, systems designed to promote efficiency may reduce effectiveness if
they are not consistent with what the participant’s values.
In becoming the central organizing unit for faculty workload, the credit hour also
became the de facto proxy to tracking student learning. However, what it actually
tracks is what is commonly called ‘seat time,’ or the input of instruction not the output
of real learning. The Carnegie Unit is so entrenched in the management of higher
education nothing has been found yet to replace it. While some institutions are moving
toward tracking learning − most notably those using direct assessment competency-
based learning − the majority of higher education, even many competency-based
programs, are still tracked to the credit hour (Silva & White, 2015). The federal
government still ties funding, inclusive of federal financial aid eligibility, to the credit
hour, with a very few exceptions (Silva & White, 2015; Silva et al., 2015). Finance and
administrative leaders in higher education use it to track productivity, finances, and
more (Silva & White, 2015; Silva et al., 2015). In their recent review of the Carnegie
Unit, a research team from the Foundation concluded that the Carnegie Unit still holds
value as the common language, or currency, of higher education and though it has
caused barriers for some innovation, its benefits still outweigh its drawbacks (Silva et al.,
31
2015). The primary barrier the Carnegie Unit presents to innovation is its rigidity in
what counts towards contact hours.
While competency-based education divorces itself from the credit hour in the
direct-assessment applications, it does not in the more ‘traditional’ competency-based
program in which competencies are presented within courses which bear credit hours,
especially for means of tracking satisfactory academic progress for federal financial aid
(Book, 2014; Johnstone & Soares, 2014). Even in innovative programs like direct
assessment, federal financial aid eligibility requires a cross-walk to the credit or clock
hour. Though this may never be evident to the learner, it is a required justification of
the rigor of the program for financial aid eligibility (U.S. Department of Education, GEN-
13-10, 2013).
The primary message from this section is that the entire system of higher
education is over-dependent on this one idea, this one measure of productivity started
by a well-intentioned steel magnate and breaking free to embrace change is very
difficult. The credit hour system infiltrates functionality throughout institutions and our
federal higher education support systems, so many institutions have chosen to not
break from its chains. Next, I will explore some of these ‘traditional’ or credit-hour
dependent competency-based education programs, looking back into the 1970s to
understand the modern origins of these programs.
32
The Competency-based Education Programs of the 1970s
In the 1970s, the economy, and the return of our armed forces from service in
Vietnam, spurred a return to higher education by more non-traditional learners. These
learners made demand for new learning modalities that worked within their lives.
Additionally, they looked for programs that accepted the learning they had acquired
outside of the academy. There was a recession, high oil prices, and high unemployment
combined with stagflation, a slow growing economy with simultaneous rising inflation
(Nielsen, 2008). Many women were returning to school and the workforce after having
spent years raising children and managing households, so they had skills, and maybe
even some credits from school attended in their youth, which many traditional
institutions did not accept as they were outdated (Ebersole & Stewart, 2011).
Gallagher (2014) explains these proximal factors surrounding the impetus to
return to college:
This promise of more efficient and affordable education takes on particular resonance in historical moments of low public confidence in higher education and high public concern about the cost of higher education. Student demographics are changing; employers are clamoring for more “competent” workers; and the federal government and business leaders are calling for, and funding, initiatives meant to promote productivity and efficiency. These conditions apply today—and they applied in the 1970s (p.19).
These demographic shifts coupled with the Higher Education Act of 1965 led the
U.S. Department of Education to develop and provide grant funds through the Fund for
Improvement of Postsecondary Education (FIPSE). FIPSE grants allowed select colleges
33
to develop competency-based education programs to help address access issues for the
new demographic of college student (Klein-Collins, 2013; Thackaberry, 2016).
These calls for education that worked for adult students instead of against them
were met in part by a group of new institutions formed for the express purpose of
serving adult learners, such as Excelsior College, Thomas Edison State College, Charter
Oak State College, SUNY Empire State, and others, many of which built programs with
FIPSE grants. While they each had uniqueness in their mission and operations, their
underlying goal was the same: to help adult students gain quality credentials. These
institutions remain in operation today and they have all continued to evolve to serve
their target student population best by adding the option of completing courses to the
use of online education (Ebersole & Stewart, 2011; Klein-Collins, 2013). The addition of
online education would not have been possible without the launch of the public
internet. Next, I will look briefly at the evolution of the public internet and its
implications for competency-based education.
The Public Internet and Online Education
The public internet launched in the early 1990’s and for those of us who were
around at that time, we can still hear the beep, screetch, bodebo of our America Online
connecting through the dial-up phone connection. Compared to what we know today,
the internet in infancy was clunky, gaudy, and slow. But even at that, it expanded a
world of possibility for higher education. Merriam et al. (2007) expound, “technology’s
potential for increasing access to learning for people of all ages and possibly all
34
economic levels is unlimited” (p. 21). Online learning, as it were, was introduced in
1989 with programs at the Open University in the UK, The University of Phoenix Online
as well as at NJIT and in Canada (Harasim, 2000). As Helmi (2002) notes, “the growth of
online education has been largely market- or organization-driven” (p. 245). As the
proportion of learners who possess non-traditional characteristics continues to grow at
a pace that exceeds the growth of traditional 18-22-year-old residential student, this
new majority of learners who fit school into their life rather than life into their school,
the demand for online education continues to grow. In fact, from 2012 – 2014, distance
education enrollments rose 7% for those taking “at least one” and 9% for those learning
“exclusively” at a distance while overall higher education enrollments fell by 2% (Poulin
& Straut, 2016). According to the Fall 2014 IPEDS enrollment data, one in seven
students took all their courses at a distance, while more than one in four students took
at least one online course (Poulin & Straut, 2016).
These statistics are salient for this study because of the overlap in distance, or
online education, and many competency-based education programs. The demographic
data for all online students reported by Clinefelter & Aslanian (2016) shows that 73% of
online students are 25 years or older while the demographic data reported by Kelchen
(2016) shows that 90% of competency-based learners are 25 years or older. Both
populations also show additional non-traditional learner characteristics such as
attending part-time or bringing in credits from prior learning or college experiences
(Clinefelter & Aslanian, 206; Kelchen, 2016).
35
Additionally, the technology plays a role, as Nodine (2016) points out,
“the recent traction of CBE programs in higher education can be traced to a “perfect storm” of opportunities and pressures associated with: (a) the maturing of online technologies for education, particularly for individualized instruction and support; (b) increased institutional acceptance of outcomes-based approaches and online and hybrid instructional formats; (c) increased opportunities for and implications of direct assessment; and (d) pressure from policymakers and other stakeholders to offer lower cost models and provide opportunities for more working adults to achieve postsecondary credentials that are meaningful in the workplace” (p.8). This source points to not only the technological advancements tying online and
competency-based education but also the motivation of providing education for adult
learners.
The bottom line of looking at these enrollment numbers for online learners is
that while higher education overall has stagnant enrollment during the latest reporting
period (2012-2014), the online education sector continues to grow. As Harasim (2000)
notes, “Online learning is no longer peripheral or supplementary; it has become an
integral part of mainstream society” (p.59). Additionally, Layne, Boston, and Ice (2013)
point out “online learning has undoubtedly changed how, when, and where students
learn” (pp.4).
Competency-based education came into the internet age early, with the creation
of Western Governors University (WGU) and its foray into competency-based education.
As a significant marker in competency-based education’s history, I will next explore
WGU’s origins and how it relates to current implementations of the model.
36
Western Governors University
Competency-based education ran as an undercurrent for nearly 25 years after
the founding of the 1970s adult serving institutions such as Excelsior College, SUNY
Empire State and others (Nodine, 2016). Competency-based education could not be
categorized as stagnant all those years, rather the modality was quietly chugging along
doing the good work of educating those who did not fit the typical mold. Then in 1997
the field was brought back into the spotlight by a discussion spurred at the 1995
meeting of the Western Governors Association. The west was facing a boom in
population with limited funds to help educate the dispersed workforce (Goodchild &
Wrobel, 2014). Recognizing the potential of online education to help solve this
problem, 19 western governors joined forces and founded Western Governors
University (Cohen, 2014; Johnstone & Boyd, 2014; Western Governors University, n.d.).
This fully-online, competency-based education university is the only institution to
possess accreditation from the InterRegional Accrediting Committee (IRAC). The
committee has since disbanded, and WGU’s primary accreditation rests with the
Northwest Commission on Colleges and Universities. However, during the time that
WGU did possess IRAC accreditation, that possession of accreditation in every region
allowed for the creation of a teacher education program with NCATE accreditation to
license teachers in all fifty states (Cohen, 2014; Johnstone, 2006). In 2015 WGU
celebrated 50,000 graduates in 15 years, nearly 20,000 of whom, or 40%, were first-
generation college students (Western Governors University, 2015). In contrast, only
37
between 10.9% (low income) and 24.9% (not low income) of all first-generation college
students complete a bachelor’s degree within six years (Pell Institute, 2011).
Recognized as a best practice model WGU was granted the opportunity in 2013
to work with a set of eleven community colleges to help design, integrate into their
systems, and launch competency-based education pilot programs by the Department of
Labor and the Bill & Melinda Gates Foundation (Johnstone & Soares, 2014). While it is
still uncertain whether these institutions will succeed with competency-based
education, and potentially even expand out further, the field of competency-based
education doesn’t seem to be slowing down (Nodine & Johnstone, 2015).
WGU has had a big impact on the evolution of competency-based education,
both as a leader within the higher education realm and in helping familiarize the public
with this modality of higher education. More important than either of those is the
positive attention it garnered from policymakers, as a solution to a problem recognized
by the governors in the West. This sentiment is reflected by policymakers adding direct
assessment, the next modality I’ll delve into, to the in-progress reauthorization of the
Higher Education Act of 1965, to benefit WGU.
Direct Assessment Programs
In 2009 President Obama placed forward the challenge that “by 2020, America
will once again have the highest proportion of college graduates in the world” (Obama,
2009). Similar goals were set by the major educational foundations such as the Lumina
Foundation and the Bill & Melinda Gates Foundation (Lumina, 2009). It has been
38
recognized that continuing as higher education has been – with primary focus on
traditional aged students coming right out of high school – will not allow the field to
reach these ambitious goals. Higher education must engage the adult learner
population to come close to these goals (Shapiro, Dundar, Ziskin, Yuan, & Harrell, 2013;
Soares, 2013; U.S. Department of Education, 2011). Research by the Lumina
Foundation (2015) found that there has been progress toward the postsecondary
credential goals, however, it is not rapid enough progress to achieve their goal of 60%
with a postsecondary credential by 2025.
In order to meet these goals, higher education must break its mold. Enter Paul
LeBlanc and Southern New Hampshire University who, in late 2011 sketched out an idea
for a new type of competency-based program - one not tied back to the credit hour in
any way, otherwise known as direct assessment competency-based education (Book,
2014; Brower, 2014; Ebersole & Stewart, 2011; Fain, 2015; Hatcher Group, 2014;
Johnstone & Soares, 2014; Kelchen, 2015; Kelchen, 2016; Laitinen, 2012; Snowden,
2014; U.S. Dept. of Education, 2014). Direct assessment measures a learners’ mastery
of competencies directly, often by authentic assessment, without relying on the proxy of
time spent on learning activities.
LeBlanc set a team of four online learning experts up in an innovation lab and let
them hammer out the details of making it work for students and keeping the cost to
$2500/year. From this was born College for America (CfA) – the first program to use
direct assessment of competencies using authentic assessments to award degrees
39
without the credit hour (Clerkin & Simon, 2014). As mentioned previously, authentic
assessments ask, “students to use the same competencies, or combinations of
knowledge, skills, and attitudes, that they need to apply in the criterion situation in
professional life” (Gulikers et al., 2004, p. 69). In the spring of 2013, CfA was approved
as the first direct assessment program to be eligible for Title IV federal financial-aid
disbursement for its associate degree program (Clerkin & Simon, 2014; Fain, 2013a;
Fain, 2013b).
While LeBlanc’s development method and launch strategy were novel, the idea
of direct assessment competency-based education had been previously experimented
with, but no other institution brought it to sustainability. The primary difference
between direct assessment competency-based education and traditional learning is that
the focus is on the demonstration of learning rather than the amount of time it takes to
accrue that knowledge (C-BEN, 2016). In 2006, the U.S. Department of Education
included in their revision of the Higher Education Act of 1965 a provision for allowing
institutions to utilize direct assessment – defined as:
…an instructional program that, in lieu of credit hours or clock hours as a measure of student learning, utilizes direct assessment of student learning, or recognizes the direct assessment of student learning by others. The assessment must be consistent with the accreditation of the institution or program utilizing the results of the assessment (e-CFR, §668.10 (a)(1)). This definition and the rules which accompany it in the reauthorization of the
Higher Education Act of 1965, which was enacted in 2008, were added to the in-
progress reauthorization under the impetus of allowing Western Governors University
40
to continue on the direct assessment path it had started down during the 1999
demonstration project established by the U.S. Department of Education (Fain, 2013a;
Lacey & Murray, 2015; Lederman, 2012; U.S. Department of Education, 1999). WGU
did not choose to take advantage of this provision (Lederman, 2012) nor did any other
institution until Southern New Hampshire University’s College for America did in 2013
(Book, 2014; Fain, 2013a; Fain, 2013b; Fain, 2014a; Fain, 2014b).
Just prior to approving SNHU’s College for America for Title IV funding, in March
of 2013 the U.S. Department of Education released a ‘Dear Colleague’ letter providing
guidance to institutions that wished to have their direct assessment competency-based
programs considered for Title IV funding. Additionally, in 2013 the Department
approved Capella University’s FlexPath to offer direct assessment bachelors and
master’s degrees (Book, 2014; Fain, 2013a; Fain, 2013b; Fain, 2014a; Fain, 2014b). In
2014 the University of Wisconsin would also receive approval for its Flex Option
program which is a partnership between the University of Wisconsin system office, the
UW Extension, and its campuses (Brower, 2014).
Continuing with the theme of expanding access, the U.S. Department of
Education issued a July 2014 call for experimental sites to become authorized to use
federal financial aid for their competency-based education and limited direct
assessment programs. Those approved were announced in January 2015 a total of 34
institutions were approved for limited direct assessment experiments and 45
institutions in the competency-based education experiments. The CBE experiments
41
provide flexibility in how institutions provide Federal student aid to students enrolled in
self-paced competency-based education programs. Whereas the limited direct
assessment experiments provide flexibility for an institution to provide a mix of direct
assessment coursework and credit or clock hour coursework in the same program (Fain,
2015; U.S. Department of Education, 2014).
While they were approved in early 2015, as of August 2015 these new programs
had not begun operating, stalled by a lack of guidance on the regulations from the
Department of Education (Laitinen, 2015). In a blog promoting the release of the
Department’s September 2015 guidance, Ted Mitchell promised the Department will be
not only expanding the CBE experimental program but “collecting significant data from
the participating institutions to enable a rigorous evaluation of the impact of CBE
programs on issues of completion, affordability, and transparency of degrees” (Mitchell,
2015). In September 2016, Amy Laitinen, director for higher education in the Higher
Education Policy Unit at the New America Foundation, stated that to date, there is
“maybe one” of these experimental sites running, nearly on the one-year anniversary of
the guidance (A. Laitinen, September 26, 2016, personal communication).
What this all means for potential competency-based education learners is that
regulation is stalling higher education reform that may aid their ability to garner federal
financial aid for their studies. Silva, White, and Toch (2015) in their report regarding the
viability of the Carnegie Unit may have captured the problem with higher education
reform most eloquently:
42
American education has a long history of promising reform ideas that have failed to achieve their intended outcomes. It is one thing to have good ideas for change; it is another to execute effectively and efficiently in our large, complex educational systems (p.6). Competency-based education has a long and varied history. Rising out of
outcomes-based learning methodologies such as apprenticeships and training programs
and fitting into the various regulatory environments by conforming to the credit-hour
where necessary and breaking free of it when possible. At the same time, competency-
based education has been transformed over the years by the advancement of
technology, moving from the physical classroom into advanced technologically-
enhanced learning modalities. In this review of the relevant literature, I have
investigated what competency-based education is, its historical origins, and its modern
practice. Evidenced in this review is a call for a credentialed populace in the United
States (Obama, 2009; Lumina Foundation, 2009; Lumina Foundation, 2015) and idea
that to reach these goals, we will need to engage the adult learner population, not
solely those presently graduating high school (Shapiro, D., Dundar, A., Ziskin, M., Yuan,
X., & Harrell, A., 2013; Soares, 2013; U.S. Department of Education, 2011).
Competency-based education opens the opportunity for new pathways to earning
credentials for learners. In the next section, I will investigate the literature on learners
who choose competency-based education.
43
Competency-based Education Learners
Knowledge about population composition, and even the magnitude of the
population, of competency-based education learners is a recognized deficiency in the
extant literature (Kelchen, 2016; Kelly & Columbus, 2016; Nodine, 2016). In their 2015
study, which delves into the last 20 years of literature about competency-based
education, Kelly and Columbus found only thirteen academic articles, or 3.4% of the 380
articles coded, analyzing the characteristics of competency-based education enrollees.
I was given permission to view the coding of these studies. While they fit within
the definitions of Kelly and Columbus’ study, they do not reflect the parameters of my
study. Of the eleven articles I was able to review, four were focused on prior learning
assessment (PLA), which Kelly and Columbus (2016) included in their search but are not
appropriate for my study. Seven of eleven of the articles considered to display CBE
student characteristics by Kelly and Columbus originated outside of the United States,
which also disqualifies them for consideration in my study with some being doubly
disqualified as PLA and foreign. The balance of articles held some relevance for my
study such as Ben-Yoseph, Ryan, & Benjamin (1999) which showcased the students in its
population as adult learners, who demonstrate tendencies such as part-time and stop-
out enrollment, which affect their retention to graduation.
Perhaps the preeminent modern researcher in this area is Robert Kelchen, and
even he acknowledges the measures we currently have for determining the
44
competency-based education learner population and characteristics are flawed at best
(Kelchen, 2015; Kelchen, 2016). As he says in his 2015 look at the landscape of CBE:
Students interested in enrolling in CBE programs are typically typecast as being older, place-bound, and vocationally minded, with significant prior work experience and some prior college experience. But it is difficult to identify the characteristics of students enrolled in many CBE programs because existing data sets aggregate these students with the rest of the student body at the college (p. 6). In his 2016 manuscript, Kelchen focuses the analysis on nine colleges “where
many students are enrolled in some type of CBE program or typically enroll with
significant amounts of prior credit” (p. 51). Kelchen counted 146,924 undergraduate
students as enrolled in his competency-based population from the Fall 2012 Integrated
Postsecondary Education Data System (IPEDS) enrollment data. Demographically, 90%
of the enrolled students were 25 years old or older, the majority were white, female,
and on average 43% received federal financial aid (Kelchen, 2016). While Kelchen’s
research dilutes the population with students who may not be enrolled in a
competency-based program at all, it is the best definition of the modern population
available to date.
I also performed prior research focused on those learners who enrolled in
federal financial aid eligible direct assessment competency-based education programs. I
found these learners to be price-conscious, working adults juggling responsibilities at
work, at home and in the community with their school work (Morrison, 2016). The
emergence of adult and non-traditional learners as primary participants in competency-
45
based education warrants a brief investigation of the literature supporting the definition
of adult learner which I provide in the next section.
Adult and Non-Traditional Learners
Adult learners, those who are 25 years of age or older, are a growing population in
higher education (Bergman, 2012; Carnevale, Smith, Melton, & Price, 2015; Kasworm,
2003; Klein-Collins, 2012; Merriam et al., 2007; Shapiro, et al., 2014; Stevens, 2014). As
Kasworm (2003) shares, “over six million adult undergraduate and graduate students
were enrolled in 2000, more than the total collegiate enrollment in 1968” (p. 4). While
age is the primary factor in determining if a learner fits into the category of ‘adult,’
perhaps more useful in modern research is the non-traditional learner. Research
commissioned by the National Center for Education Statistics (NCES) and produced by
Radford, Caminole, and Skomsvold (NCES, 2015) shows that 74% of all undergraduates
in the 2011-12 cohort have at least one non-traditional characteristic. As defined by
NCES (1996, p. 4-7) these non-traditional characteristics include:
• Delayed enrollment in postsecondary education
• Part-time attendance
• Financially independent of parents
• Work full-time
• Have dependents other than a spouse
• Are a single parent
46
• Have a non-standard high school diploma, such as a GED
With a healthy majority, non-traditional learners should be the focus of policy and
practice at institutions across the nation, however prior research shows they are not. As
early as 1978 Patricia K. Cross alerted the higher education community of the need to
pay attention to the rising number of adults in higher education, how they learn and
incorporate those principles into practice. Lest higher education will become, in Cross’
(1978) words, “a joyless learning society, with people grimly fulfilling requirements and
seeking legitimacy for every variety of learning.” In 2001, Sissel, Hansman, and Kasworm
noted that the “voice of the adult students are not integrated into the ethos of campus”
(p.20) which renders them mute in various forms of institutional communication from
marketing and admissions to campus services. In 2014, Stevens noted, “It appears that
institutions of higher education are not adequately addressing the needs of these
nontraditional students” (p.65). There is evidence that this is improving, with a 2015
Ruffalo Noel Levitz survey revealing that across institutional sectors, institutions are
intentionally recruiting of adult learners.
To engage new learners in the pursuit of higher education credentials, we need
to understand how and which type of learners choose competency-based education
programs. This understanding will allow higher education, as an industry, to speak the
language that opens access to higher education. Thinking back to the opening example
of this paper, without lowering the barrier to higher education, Susan would never have
earned a credential and be pursuing additional higher education. Competency-based
47
education is a pathway to access to higher learning. In the next section, I will explore
the concept of access -- how it weaves into the fabric of higher education and has
supported the growth of competency-based education.
Access to Higher Education
To begin simply, access is “the ability, right, or permission to approach, enter,
speak with or use; admittance” (dictionary.com (n.d.)). In higher education, access has
been embedded in the mission of many institutions since the Morrill Act of 1862, a key
step in opening higher education access for all Americans. The Morrill Act called for the
creation of land-grant universities by offering states tracts of Western land which they
could sell and use the proceeds to fund “advanced instructional programs” (Thelin,
2011).
This complex relationship between the federal and state governments, has led to
oversimplification in the mainstream understanding of the law. Leading to the
translation that the federal government bestowed literal tracts of land for the building
of the higher education institutions. While some states already had universities, this
bolstered the offerings of accessible higher education with a broad, utilitarian
curriculum focused on agriculture, mechanics, mining and military instruction (Key,
1996; Thelin, 2011).
Land grant institutions continue to play a significant role in higher education,
though many have expanded their focus to include engineering, the sciences, education,
business, and the humanities in addition to the traditional curriculum. Land grant
48
institutions contributed to the higher education landscape not only by increasing access
but by bringing a greater number of institutions into the idea of educating for the
practical in addition to the theoretical (Key, 1996). Land grants also helped move away
from straight recitation of the classics and into the education of those who need to be
able to apply theory to build our world - from bridges to medicine to secondary
education curriculum (Key, 1996). This practical application of theory bodes well for
implementing competency-based education with its demonstrations of mastery through
authentic assessment. Land grant institutions opened access to many different types of
learners and normalized the idea that the practical held value as a higher education
pursuit, which is key to competency-based education being an access pathway.
Continuing the discussion of access to higher education, no study would be
complete without a look at what is commonly called the G.I. Bill. In 1944, Congress
moved forward with the Servicemembers Readjustment Act, or G.I. Bill, which included
provisions for education benefits for veterans. Congress and the President enacted
these benefits to help maintain social order as vets returned from war; they did not
want the protests that came after World War I (Thelin, 2011). For many colleges this
legislation resulted in doubling their enrollment. It also meant a new variety of student
was coming to campus: pragmatic, older, first-generation students, with much life
experience, often with spouses and children. Their priorities were different than those
of traditional aged college students and while they did partake in some extracurricular
activities, overall their goal was employability (Thelin, 2011).
49
The implementation of the G.I. Bill changed the face of American higher
education dramatically and continues to this day. College is no longer an elite
institution only for the children of the wealthiest Americans. A college degree is now
attainable for a greater diversity of learner.
The next pivotal event in access to American higher education was the Higher
Education Act of 1965 and its subsequent reauthorizations. November 8, 1965 brought
forth the passage of this bill, aimed at supporting the educational resources of
struggling colleges, primarily historically black colleges, and providing financial
assistance for students to attend higher education (“Higher Education Act of 1965,”
2009; “Higher Education Act of 1965,” 2015).
Periodically the Higher Education Act of 1965 is “reauthorized”—a process
through which Congress revisits existing programs to see how they can be made more
relevant for their time frame through a series of hearings (“Higher Education Act of
1965,” 2009; McCants, 2003). The Act was reauthorized in 1968, 1972, 1976, 1980,
1986, 1992, 1998, and 2008 (“Higher Education Act of 1965,” 2015; McCants, 2003).
During the summer of 2015, the Senate HELP (Health, Education, Labor, & Pensions)
Committee held six hearings in consideration of a new reauthorization of the HEA.
Though the times are different, some of the themes from the original act remain
relevant, such as - access and affordability. Other topics discussed during the hearings
are reminiscent of the 2008 reauthorization, including calls for greater accountability
(Morrison, 2015a).
50
The Higher Education Act and its subsequent reauthorizations have opened the
door to postsecondary education for many, especially low-income students. Without
federal grant and loan programs, higher education would largely be an elitist system
with only those who are wealthy enough to pay outright or those who are extremely
academically or athletically talented able to access postsecondary education. We would
also not have the diversity of institutional type available in the modern postsecondary
education landscape. Provisions in the Higher Education Act also make it possible for
institutions to implement competency-based education.
This study will next explore the college choice process, limiting the exploration to
the college choice process for adult and non-traditional learners.
The College Choice Process
Put most simply, college choice is the process a potential learner undertakes to
evaluate and commit to a postsecondary option. Choice paired with access, or the
opportunity to attend college, is important for competency-based education as it
supplies the learners who participate in the programs.
College choice is a transitional process where potential students define their
academic and occupational aspirations and abilities, gather information about
postsecondary options, and come to a decision they perceive will help them make those
aspirations a reality (Bergerson 2009; Cabrera & La Nasa, 2000; Hossler & Gallagher,
1987; Jackson, 1987; Perna, 2006; Southerland, 2006). As Litten (1982) points out “the
college selection process is a complex series of activities” (p.400). This process happens
51
in different ways and times for different types of learners. The models may not always
fit and may not capture the complex interplay, especially for diverse students who do
not fit into the first-time, full-time freshman profile (Hendrickson, 2002; Pitre, Johnson,
& Pitre, 2006; Southerland, 2006).
Access, however, often assumed by college choice theories, (Bergerson, 2009) is
not a given. Access refers to institutional practices and policies to provide equitable
opportunity for students to pursue education (“Access,” 2014). In 2006, the Spellings
Commission found that “access is unduly limited by the complex interplay of inadequate
preparation, lack of information about college opportunities, and persistent financial
barriers” (p. 1, U.S. Department of Education, 2006). Access is affected by many
demographic characteristics including socioeconomic status, high school preparation,
parental college experiences, and access to adequate information (NPEC, 2007; Perna,
2006; Tierney & Venegas, 2009). Access can also be affected by geographic location,
demonstrated by Turley (2009) who found a small but significant increase in the odds of
applying to college based on each additional institution within commuting distance.
Traditional college students are generalized as enrolling directly out of high-
school and attending full-time, while not working or working only part-time (Bergerson,
2009; Brock, 2010; Choy, 2002; NPEC, 2007; NCES, 2015; Southerland, 2006). According
to NCES (2015) these students make up less than 30% of all today’s college students.
The greater population of students today are what are referred to as ‘nontraditional’ or
‘adult’ learners, who encompass 74% of the college student population (NCES, 2015).
52
These students, sometimes called the new majority, (Bell, 2012) embody characteristics
such as delayed enrollment after high school graduation, financial independence
according to financial aid rules, having one or more dependents, being a single caregiver
for children or aging parents, part-time attendance, and being employed full-time (Bell,
2012; Bergerson, 2009; Bers & Smith, 1987; Brock, 2010; CLASP, 2011; Choy, 2002;
NPEC, 2007; NCES, 2015; Southerland, 2006).
One of the most cited college choice models of the last thirty years is Hossler and
Gallagher’s (1987) three-phase model of student college choice encompassing
predisposition, search, and choice. This model is so popular in fact, that Bergerson
(2009) spends nearly a whole chapter discussing its composition, its applications in
recent research and the critiques of the model. In this model of college choice, students
starting as young as middle school enter the predisposition phase, where they develop
academic and occupational aspirations. Predisposition is influenced by factors such as a
student's socioeconomic status; their academic ability; the school they attend; the
peers, teachers, and counselors they interact with; and the availability of college
information for the students and their parents (Bergerson 2009; Cabrera & La Nasa,
2000; Hossler & Gallagher, 1987).
Hossler and Gallagher (1987) quote Jackson (1978) as having identified types of
students who emerge from predisposition: the “Whiches,” “Whethers,” and the “Nots”
(p. 571). Nots are those who never really consider going to college, Whethers apply to
1-2 local colleges but may not attend, and Whiches never considered not going to
53
college. In this breakdown of types, Jackson (1978) notes that the Whiches focus on the
prestige and peer choices whereas the Whethers fit more into the economic crunch,
where the decision is weighed on the perceived value/perceived cost ratio. These
predisposition types were not directly carried forward into the later work, such as
Cabrera and La Nasa (2000) nor were other ‘types’ of students specified.
The second stage of the process is the search, in which students begin to
accumulate information and incorporate it into their forming thoughts of where and
why to matriculate in college (Cabrera & La Nasa, 2000; Hossler & Gallagher, 1987). As
Bergerson (2009) points out, “this step involves learning more about themselves and the
institutions in which they are interested” (p.24). This self-learning may include taking
college entrance exams (ACT, SAT) as well as determining the type of institution which
fits them, through increased interactions with college representatives (Bergerson,
2009). As Hossler and Gallagher (1987) say, “the search phase is not a static stage which
is conducted in the same manner by all students” (p.214).
The third and final phase of this model is where students’ complete
application(s) and collect the final inputs before making their enrollment choice. Again,
factors such as parental input, peer choices, academic standing and aspirations, and the
ever-important financial considerations weigh on the final decisions of matriculates
(Bergerson 2009; Cabrera & La Nasa, 2000; Hossler & Gallagher, 1987). What this model
of college choice means for institutions, is that engaging students early in their
education journey is key. While search, which is developmentally tied to grades 10 - 12
54
(Cabrera & La Nasa, 2000), is the most active phase of the process, providing
information, especially general financial information early may affect parent’s savings
for college which may affect the number of colleges students apply to and the likelihood
they will matriculate (Hossler & Vesper, 1993; Jackson, 1978).
While this theory has held up through time for the traditional learner, the
population of competency-based education learners does not fit this demographic
profile. Hossler and Gallagher’s phases (1987), which begin as early as middle school, do
not fit the profile of adult learners.
A contrasting theory of college choice for traditional aged students is the cultural
framework model developed by Tierney and Venegas (2009). This framework moves
away from a rational linear theory that depends on students making choices in a logical
manner based on subjective assumptions and looks at how students make decisions
based on inputs from multiple environments concurrently (Bergerson, 2009; Tierney &
Venegas, 2009). These environments include schools and school staff, peer groups,
families, and other social influences. The framework assumes that students have
agency in their decision to attend postsecondary education or not, and where to do so.
A cultural framework helps researchers understand the lives of families,
students, and their inter-relationships with the college choice process. Understanding
the differing experiences of students, for instance the difference between wealthy
students who never really consider whether or not to go to college, just where to go and
the first-generation, low-income student who must make a more active choice in
55
whether to attend or not, can help institutions increase access (Tierney & Venegas,
2009).
Research from NCES (2015) shows that ‘nontraditional’ students are the majority
of all college students today at 74%. However, our long held cultural construction of
college students does not often include them in the picture. Popular culture, through
the silver screen, glossy magazines, and TV shows, consistently portray the college
choice process as the high school senior checking the mailbox daily for the ‘fat envelope’
indicating acceptance to their first-choice college (Morrison, 2016). The picture can be
much different for the majority of today’s college students – nontraditional learners
who have been known to make concurrent decisions of if, when, and where to attend or
return to college (Bers & Smith, 1987; Morrison, 2016; NCES, 2015; NPEC, 2007). Career
needs (Kortesoja, 2009; Laanan, 2003; Somers, et.al, 2006; Wilsey, 2013) or personal
aspirations often spur the need for adult learners to pursue higher education (Laanan,
2003; Somers, et.al, 2006). The key factors for adult learners are location (Broekemier,
2002; Hillman & Weichman, 2016; NPEC, 2007; Roszkowski & Reilly, 2005; Somers, et.al,
2006) and convenience (Bers & Smith, 1987; Broekemier, 2002; NPEC, 2007; Peek &
Goldstein, 1991). As is noted by Bergerson (2009), the body of research on adult
learners is scant and does not include their college choice process. The research reflects
their experiences once enrolled, and as such Bergerson (2009) did not include them in
her monograph. This study highlights one college choice model specifically developed
56
about adult learners (Southerland, 2006), and one which was written for disadvantaged
students but makes a relevant proxy to adult learners (Perna, 2006).
Three decision-points drive Southerland’s 2006 model for college choice and
persistence which can be broken down into whether their life situation supports
attendance, followed by when and where to attend, and finally adult learners
continually reevaluate their enrollment and persistence to a credential (Morrison, 2016;
Southerland, 2006). In contrast to traditional models such as Hossler & Gallagher,
Southerland’s model is pragmatic in considering options for learning, career
advancement, availability of data, and location (Broekemier, 2002; Morrison, 2016;
NPEC, 2007; Roszkowski & Reilly, 2005; Somers, et.al, 2006; Southerland, 2006).
The work of Peek and Goldstein (1991) features the importance of employee
benefit programs as a driver and enabling circumstance for adult learner choice in
higher education (Morrison, 2016).
An additional conceptual model that helps explain adult learners’ college choice,
while written for disadvantaged populations, is Perna’s 2006 model which hosts
elements from human capital investment and socio-cultural models such as status
attainment models. In Perna’s (2006) nested model, layers build upon and influence
each other. Habitus, encompassing not only demographic characteristics but the social
and cultural capital a student brings to the college choice process forms the first layer.
This layer applies to non-traditional, adult learners as well as their traditional
counterparts, and these factors are not age-dependent.
57
The second layer focused on school and community context is a bit different for
the traditional student who, as Perna (2006) notes, are influenced by teachers,
counselors, and peers in their high school, than adult learners. However, if we consider
the work of Peek and Goldstein (1991) who found in their research that adult learners
tended to turn to non-college professionals who they trusted to help them choose their
higher education option. These professionals ranged from parole officers to welfare
agents and even their children’s high school guidance counselors. Some adult learners
turn to family, friends, and significant others as sources of information in making a
college choice (Peek & Goldstein, 1991). These trusted relationships fit in the “school
and community context” (Perna, 2006, p. 117) layer, bringing its relevance to adult
learners, as some of those trusted non-college professionals fit within the school
context (children’s guidance counselors) and others into the community context (parole
officers, welfare agents, friends, and family).
The third layer looks at higher education context. NPEC research found that
adults are more autonomous in their college choice process (2007), as was shown in
Southerland’s (2006) research, availability of data on the institution is important, which
rests in this layer.
The final layer looks at the broader socio-political climate and how it affects
students’ college choice process. Things such as the unemployment rate, public policy
and demographic shifts influence this layer, as well as influence adult learners, and
supply context to learners’ decisions (Perna, 2006).
58
Based on these two concepts, practitioners looking to assist adult learners in
making their college choice would be advised to appeal to their pocketbooks and their
career aspirations through marketing materials and interactions with potential students.
Creating advocates out of local members of the adult learners’ communities and having
graduates model their success for potential students will encourage them in the process
of choosing a college. From Southerland, (2006) perhaps the most relevant piece for
student affairs practitioners and faculty is the fact that adult students are continuously
reevaluating their enrollment. If institutions are not providing them what they perceive
they need, they will, as the idiom goes, ‘vote with their feet’.
To understand the context of their educational opportunities, adults are
presumed to undertake a process to choose the way they will pursue higher education.
Competency-based education presents one method for adult learners to gain access to
higher education. This study investigates the college choice process of competency-
based education enrollees to inform institutions in their recruitment efforts and
learners in how to choose the correct program for their needs.
Summary
Competency-based education has evolved from its roots in outcomes-based
learning approaches to modern, technologically-enhanced learning. Competency-based
education provides a pathway through higher education for learners who cannot attend
traditional, face-to-face higher education. Through this literature review, we have seen

59
that learners make choices in different manners – with non-traditional learners having a
greater focus on the end outcome of higher education rather than the process to gain
the credential. To provide access to this modality of learning, we must first understand
the process through which these learners make decisions so we can communicate with
them effectively and at the right time.
60
CHAPTER THREE – METHODOLOGY
Introduction
To increase access to postsecondary education, institutions must first
understand why and how leaners choose their learning opportunities. The extant
literature on the college choices of adult learners tends to be focused on community
college enrollees (Broekemier, 2002; Laanan, 2003; Peek & Goldstein, 1991; Somers,
et.al., 2006). However, there is a recognized paucity when it comes to exploring the
college choice experiences of non-traditional learners overall (Bergerson, 2009;
Kortesoja, 2009; Lansing, 2017; Morrison, 2016; NPEC, 2007; Peek & Goldstein, 1991;
Perna, 2006; Roszkowski & Reilly, 2005). This applies both for first-time learners and
those returning to higher education after some period away. Competency-based
education learners have been characterized as primarily adult learners (Kelchen, 2016;
Morrison, 2016).
Additionally, as highlighted by Kelly & Columbus (2016) there is little research on
who competency-based education learners are in the last 20 years. Their research
turned up just thirteen academic articles which look at characteristics of competency-
based education learners (Kelly & Columbus, 2016). However, my previous research,
published after Kelly & Columbus (2016), showed direct assessment competency-based
education learners are “professionals working in their field of study. Parents juggling
families, work, community, and school. Devoting concentrated time to their studies.
61
Price conscious & transfer credit savvy” (Morrison, 2016, p. 73). It is important to note
that study was a small (N=5), qualitative study however it was published in the Journal
of Competency-based Education. It did reinforce the need for further study both of
competency-based education learners’ characteristics and college choice process
(Morrison, 2016).
The societal factors which are driving the increased interest in higher education
include the perception of a bachelor’s degree as the modern-day ticket to the middle
class (Carnevale, Garcia, & Gulish, 2017; Selingo, 2013). With 20.6% of Americans over
age 25 possessing some college but no degree (U.S. Census Bureau, 2016), the
opportunity exists for increased enrollments in higher education. Carnevale,
Jayasundera, and Cheah (2012) outline the increases in enrollment higher education
sees when the economy declines. This was made evident by the 12% enrollment
increase over projections in 2010 (Carnevale et al., 2012). As these researchers
conclude, “In jobs at every skill level and in many different occupations, the better-
educated applicant has the edge” (Carnevale et al., 2012, p. 35).
In the United States, we are experiencing what has been called credential creep,
credential inflation, and upcredentialing (Burning Glass Technologies, 2014). In this
phenomenon positions that did not previously require a college education now have
that as a requirement. Burning Glass Technologies (2014) research “suggests that
employers may be relying on a B.A. as a broad recruitment filter that may or may not
correspond to specific capabilities needed to do the job” (p.2). Additionally, Carnevale
62
and Rose (2011) call this the “sheepskin effect” (p.30) but express that it is a logical
recruitment technique to maximize the chance of hiring a qualified candidate.
Regardless of what I, or any industry analyst may think of this phenomenon; the
bachelor’s filter is creating demand for higher education. This demand can be met, at
least in part by competency-based education, if we as an industry can articulate its value
to students and employers (Kamenetz, 2014).
Research Questions
The purpose of this secondary data analysis is to investigate the characteristics
of competency-based education program enrollees, their college choice process,
satisfaction with their enrollment choice, and whether enrollment motivators predict
satisfaction with enrollment choice. This study investigates the following questions:
1. What are the characteristics of competency-based education learners?
2. Do characteristics of competency-based education learners predict enrollment
motivators?
3. Do characteristics of competency-based education learners predict satisfaction
with their decision to enroll?
4. Do the enrollment motivators predict competency-based education learners’
satisfaction with their decision to enroll?
5. What is the college choice process for competency-based education learners?
63
Research Design and Rationale
This study employs a non-experimental, quantitative research design of
secondary data to investigate the learners’ characteristics, college choice process,
enrollment motivations, and satisfaction with choice for learners enrolled in a
competency-based education program. I utilized data I collected in 2016 for related
prior research regarding competency-based education enrollment motivators
(Morrison, 2017) in fulfillment of a grant from the University of Wisconsin – Milwaukee
National Research Center for Distance Education and Technological Advancement
(DETA).
The dataset includes responses from competency-based education enrollees
from four institutions (three public; one private/non-profit) and had a survey response
rate of 8.19%, which, while low, is characteristic of a web-based survey. Wengrzik,
Bosnjak, and Manfreda (2016) found in a meta-analysis of 108 experimental studies, a
mean response rate of 13%, including some studies which were incentivized. The final
sample and sampling procedures is discussed in further detail below.
These data contain untapped resources on competency-based education learner
characteristics as well as responses which may reveal the college choice process.
Secondary datasets have unique advantages over primary data collection, such as time
and cost savings (Anderson, Prause, & Silver, 2011). Research on secondary data also
“provides opportunities for the discovery of relationships not considered in the primary
research” (Smith, 2008, p. 328). Additionally, secondary data analysis has been noted
64
as being under-used in education (Smith, 2011). I have also chosen this dataset because
I have sole access to it. I expect this study to add to the literature on competency-based
education, the learners that choose this modality, and the college choice process.
Research Context
There is a renewed interest in competency-based education and how it can be
utilized by institutions as a tool to move a greater number of students toward the
completion of a degree (Fain, 2015; Lumina Foundation, 2009, 2015; Morrison, 2017;
U.S. Dept. of Education, 2014). With this renewed interest, has come a boom in the
number of institutions offering competency-based education − by some accounts over
500 institutions are exploring offering CBE − from every sector of higher education
(AACC, 2016; Fain, 2016; Fain, 2015; Fleming, 2015; Kelchen, 2016; Mitchell, 2015;
Morrison, 2017; Nodine, 2016; Public Agenda, 2015).
The distal factors which relate to an increased interest in competency-based
education are primarily economic, for learners and institutions. Although the economy
is improving, research from Burning Glass Technologies (2014), a job market analytics
company, shows that there has been a rise in the number of job postings requiring a
college degree that previously did not. This is leading to a credential gap, which, in
middle skill jobs is upward of 25%, for roles like executive assistant and other office
administration type positions (Burning Glass, 2014). The greater demand for
postsecondary credentials can increase enrollment at colleges and universities.
65
Competency-based education, especially in the direct assessment modality, is
potentially a faster pathway to degree completion (Camacho and Legare, 2016; Porter
and Reilly, 2014; Wang, 2015). The potential of graduating more learners more quickly
is a lure for institutions, as it could lead to potential cost savings (Porter and Reilly,
2014).
An additional distal factor contributing to the growth of competency-based
education opportunities is pressure from policymakers to contain higher education costs
while maintaining quality (Johnstone and Soares, 2014; Laine, Cohen, Nielson, and
Palmer, 2015). As Arne Duncan, former Secretary of Education said in a speech during
the 2011 Annual Federal Student Aid Conference:
States are also beginning to take on the challenge of accelerating attainment and containing costs as a statewide mission. Nationwide, 26 states have set goals for the educational attainment of the adult population. And a number of state strategic plans include language about containing college costs (para. 77).
Competency-based education has been noted as an option for institutions to help
contain cost (Daugherty, Davis, and Miller, 2015; Desrochers and Staisloff, 2016;
Ordonez, 2014; Weise and Christensen, 2014; Weise, 2014).
As for learners, my previous research (Morrison, 2016) showed the ability to
control their learning and adjust it to meet their other commitments was a key draw to
competency-based education. Others have noted students desire the economic
benefits of having a degree, the flexibility of competency-based education, and the
66
potential for cost savings through prior credit and accelerated learning (Camacho and
Legare, 2016; Wang, 2015; Weise, 2015).
It is important for institutions to understand the learners who may enroll in the
competency-based education programs they are designing. The analysis of these data
could help inform how programs attract learners to competency-based education
programs, thus aiding access to competency-based education programs for underserved
learners, such as those with non-traditional characteristics.
Survey Methodology
The data being utilized in this study were first collected in fulfillment of grant
requirements for The National Research Center for Distance Education and
Technological Advancement (DETA). This survey implemented a tailored design.
Dillman, Smyth, and Christian (2009) describe tailored design as “using multiple
motivational features in compatible and mutually supportive ways to encourage high
quantity and quality of response…” (p. 16). This methodology is supported by social
exchange theory − the perception that the rewards one will receive outweigh the costs
(Dillman et al., 2009). Social exchange is predicated on trust that the reward will be
realized, whether for the participant or society (Dillman et al., 2009). This theory was
supported by providing potential participants with information about the survey, asking
for help, showing positive regard, saying thank you, and making the questionnaire
interesting (Dillman et al., 2009). All the learners invited to participate attend college
67
online. Therefore, I reduced the cost of participation by making survey participation
convenient, hosting the survey online, and limiting the length and time to respond
(Dillman et al., 2009).
In alignment with this tailored design (Dillman et al., 2009) the survey was not
incentivized aside from a plea to participants in the survey request letter to ‘pay it
forward’ in the recognition they may also need survey respondents one day for their
educational pursuits. All participants were presented with the purpose of the research,
and their rights through informed consent procedures as a required step before
entering the survey. Participants were provided with the appropriate contacts to
withdraw should they, at any point, decide they would not like their data included in the
study. Participants were also informed of the anonymity of their responses, including
the de-identification of the institution in which they are enrolled.
Prior to distributing the survey, I obtained Institutional Review Board (IRB)
approval from the four participating institutions. Institution and learner samples will be
discussed in greater detail below. During the months of August, September, and
October 2016 a web-based survey request was distributed to 5,142 undergraduate
learners enrolled in a competency-based education program. The request was
distributed via email (Appendix A) and as an announcement containing the same text in
one institution’s learning management system.
At regional state institution 1, the survey request was distributed July 18, 2016
and a reminder was sent August 6, 2016. At regional state institution 2, the survey
68
request was distributed July 28, 2016 and a reminder sent on August 8, 2016. At the
public community college, the survey request was first sent as an announcement via the
learning management system on August 22, 2016. A reminder email was sent to this
group of learners on September 6, 2016. At the private/nonprofit institution the survey
request was distributed via email on October 5, 2016, no reminders were sent. The
spread in the timeframe the survey requests were distributed was due to the varying
time it took to get IRB approval. The survey (Appendix B) was housed in the web-based
platform Survey Monkey and was estimated to take learners approximately 30 minutes
to complete.
Population & Sample
For institutional sample selection in the original research project, I implemented
a cross-institutional sampling methodology and aimed to engage institutions offering
online, self-paced, mastery-based, competency-based education with faculty developed
curriculum. These criteria were set during the grant initiation call with the grantor as
the common criteria the UW-DETA was using for the competency-based education
programs the Center was investigating (T. Joosten, personal communication, April 12,
2016).
Institutions were identified utilizing criterion and snowball sampling. Criterion
sampling involves creating criteria and then identifying participants which fit that
criteria (Mertens, 1998). I also employed snowball sampling by asking identified
69
institution representatives to suggest others they thought fit the criteria (Gilner,
Morgan, & Leech, 2017; Mertens, 1998). Criterion and snowball sampling are both
types of convenience sampling (Gilner et al., 2017; Mertens, 1998). This convenience
sample was necessary to gather participants, which makes the results less generalizable.
Convenience sampling is commonly used in educational research (Gilner et al., 2017;
Mertens, 1998; Muijs, 2004). Time available for data collection and access to the
participants were contributing factors to utilizing a convenience sample to gather
institutional participants.
Participation invitations were sent to eighteen institutions across institutional
types (public; private/non-profit; private/proprietary). In addition to the criteria set by
the funder, criteria included membership in competency-based education focused
industry organizations, and recipients of federal experimental site status for
competency-based education projects. Considering these last two criteria only, there
are approximately 75 institutions in the population. However, not all institutions who
meet the last two criteria meet the funder’s criteria. I determined the most relevant
institutions through public search engines. Eighteen institutions were approached to
participate in the study. My professional relationships with others working in
competency-based education facilitated the snowball sampling. Not all institutions
invited to participate were able to/qualified. Examples of disqualifying features include
institutional policy; only offering their competency-based education programs at the
graduate level; and lack of time and personnel to distribute the survey. None of the
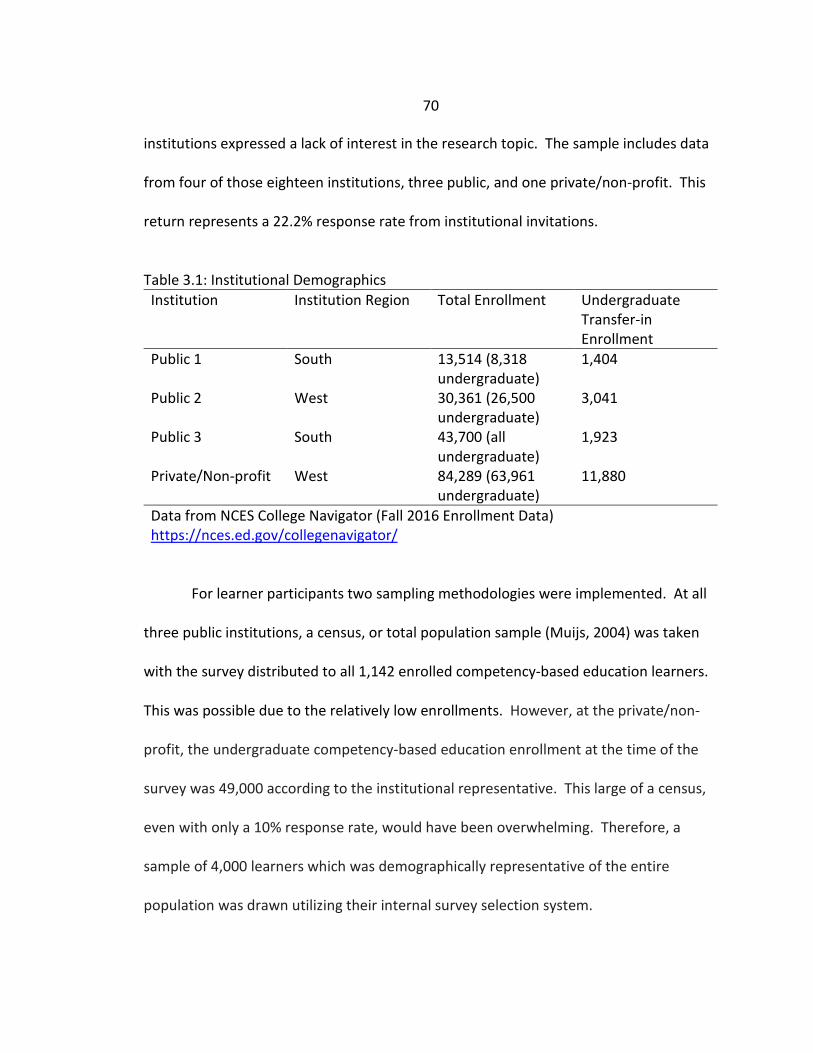
70
institutions expressed a lack of interest in the research topic. The sample includes data
from four of those eighteen institutions, three public, and one private/non-profit. This
return represents a 22.2% response rate from institutional invitations.
Table 3.1: Institutional Demographics Institution Institution Region Total Enrollment Undergraduate
Transfer-in Enrollment
Public 1 South 13,514 (8,318 undergraduate)
1,404
Public 2 West 30,361 (26,500 undergraduate)
3,041
Public 3 South 43,700 (all undergraduate)
1,923
Private/Non-profit West 84,289 (63,961 undergraduate)
11,880
Data from NCES College Navigator (Fall 2016 Enrollment Data) https://nces.ed.gov/collegenavigator/
For learner participants two sampling methodologies were implemented. At all
three public institutions, a census, or total population sample (Muijs, 2004) was taken
with the survey distributed to all 1,142 enrolled competency-based education learners.
This was possible due to the relatively low enrollments. However, at the private/non-
profit, the undergraduate competency-based education enrollment at the time of the
survey was 49,000 according to the institutional representative. This large of a census,
even with only a 10% response rate, would have been overwhelming. Therefore, a
sample of 4,000 learners which was demographically representative of the entire
population was drawn utilizing their internal survey selection system.
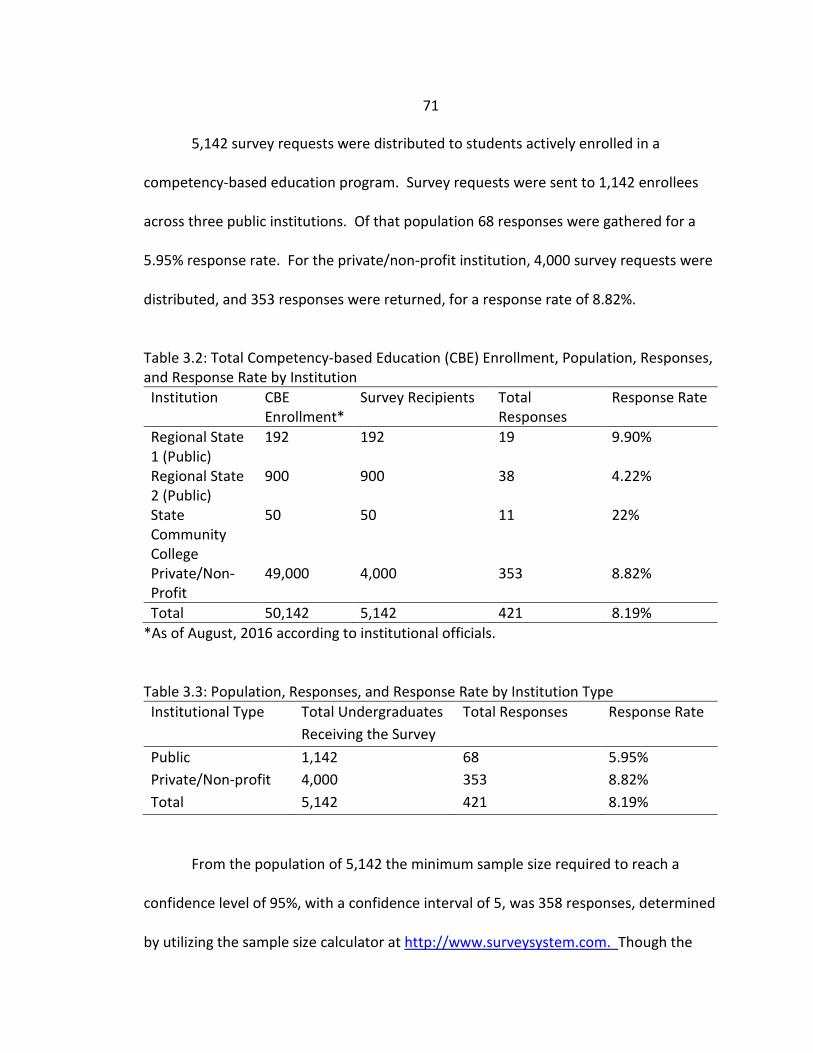
71
5,142 survey requests were distributed to students actively enrolled in a
competency-based education program. Survey requests were sent to 1,142 enrollees
across three public institutions. Of that population 68 responses were gathered for a
5.95% response rate. For the private/non-profit institution, 4,000 survey requests were
distributed, and 353 responses were returned, for a response rate of 8.82%.
Table 3.2: Total Competency-based Education (CBE) Enrollment, Population, Responses, and Response Rate by Institution Institution CBE
Enrollment* Survey Recipients Total
Responses Response Rate
Regional State 1 (Public)
192 192 19 9.90%
Regional State 2 (Public)
900 900 38 4.22%
State Community College
50 50 11 22%
Private/Non-Profit
49,000 4,000 353 8.82%
Total 50,142 5,142 421 8.19% *As of August, 2016 according to institutional officials. Table 3.3: Population, Responses, and Response Rate by Institution Type Institutional Type Total Undergraduates
Receiving the Survey Total Responses Response Rate
Public 1,142 68 5.95% Private/Non-profit 4,000 353 8.82% Total 5,142 421 8.19%
From the population of 5,142 the minimum sample size required to reach a
confidence level of 95%, with a confidence interval of 5, was 358 responses, determined
by utilizing the sample size calculator at http://www.surveysystem.com. Though the
72
survey garnered 421 responses, once the data were cleaned of responses with
incomplete data on the variables of interest for the original research, 381 responses
were analyzed. For the present study, 35 additional participant responses were
eliminated due to missing data on variables of interest. A total of 346 responses were
analyzed. This number does not meet the minimum required response (358) for the
confidence level of 95% with the confidence interval of 5. However, when calculated
from 346, the confidence interval is 5.09, which was determined to be an acceptable
level as it would round down to 5. Additionally, according to Tabachnick and Fidell
(2013), a substantial cases-to-IV ratio is important when utilizing multiple regression.
The standard Tabachnick and Fidell (2013) promote is “N ≥ 50 + 8m (where m is the
number of IVs) for testing multiple correlation and N ≥ 104 + m for testing individual
predictors” (p.123). By this standard, the N ≥ 226 for testing multiple correlation and N
≥ 126 for testing individual predictors.
It is important to note that a few variables had missing responses, which were
eligible for mean replacement. The largest of these (paid work hours) had 19 missing
responses equating to 5.49% of the data. Following behind that are student satisfaction
(4.91%), Age (4.34%), years of professional experience (3.47%), years from college start
(1.45%), and years from high school (0.58%). According to Downey & King (1998), when
utilizing item mean substitution method, the method provides a satisfactory
representation of the original data when the missing data did not exceed 20% of the
total (p. 189). Therefore prior to running the descriptive statistics, the mean replace
73
function was run in SPSS to create a compound variable which replaced missing data
with the mean. Tables 3.4 and 3.5 show the learners’ characteristics for public and
private/non-profit institutions. Pearson Chi Square were utilized to see if dependency
exists among the institutional types and key demographic data. The purpose of this
investigation is to determine whether the sample can be combined into one for analysis
to answer the research questions for this study.
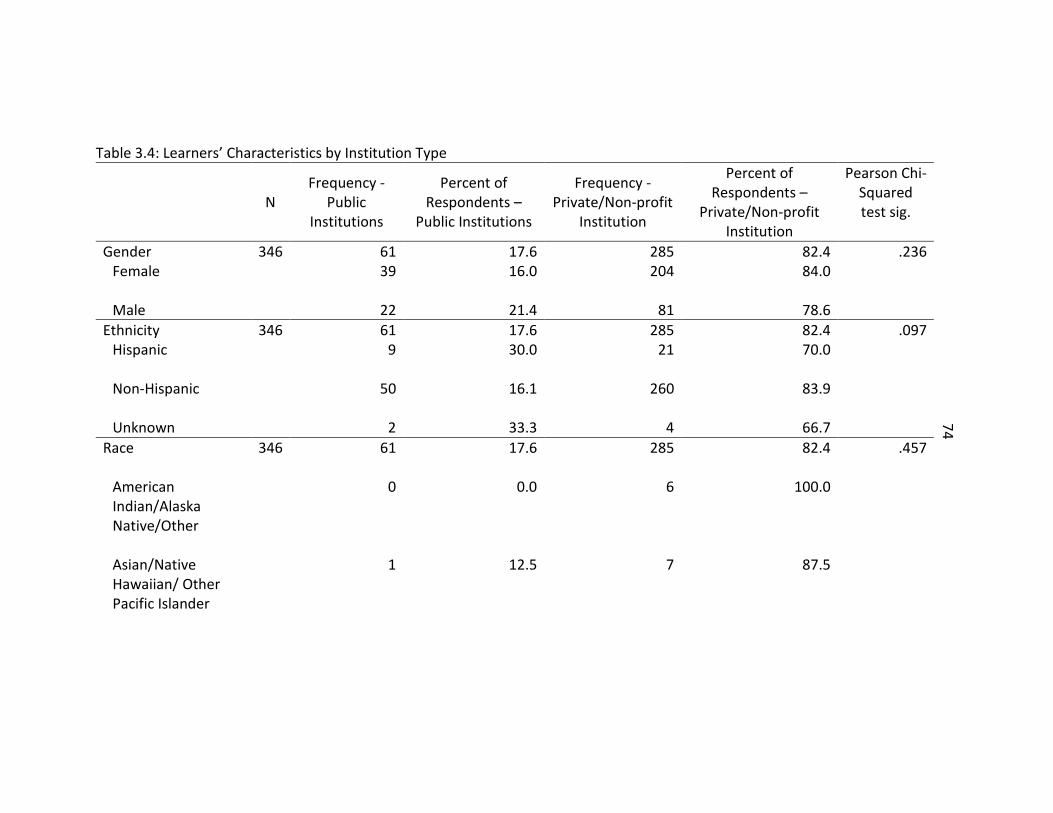
74
Table 3.4: Learners’ Characteristics by Institution Type
N Frequency -
Public Institutions
Percent of Respondents –
Public Institutions
Frequency - Private/Non-profit
Institution
Percent of Respondents –
Private/Non-profit Institution
Pearson Chi-Squared test sig.
Gender Female Male
346 61 39
22
17.6 16.0
21.4
285 204
81
82.4 84.0
78.6
.236
Ethnicity Hispanic Non-Hispanic Unknown
346 61 9
50
2
17.6 30.0
16.1
33.3
285 21
260
4
82.4 70.0
83.9
66.7
.097
Race
American Indian/Alaska Native/Other
346 61
0
17.6
0.0
285
6
82.4
100.0
.457
Asian/Native Hawaiian/ Other Pacific Islander
1 12.5 7 87.5
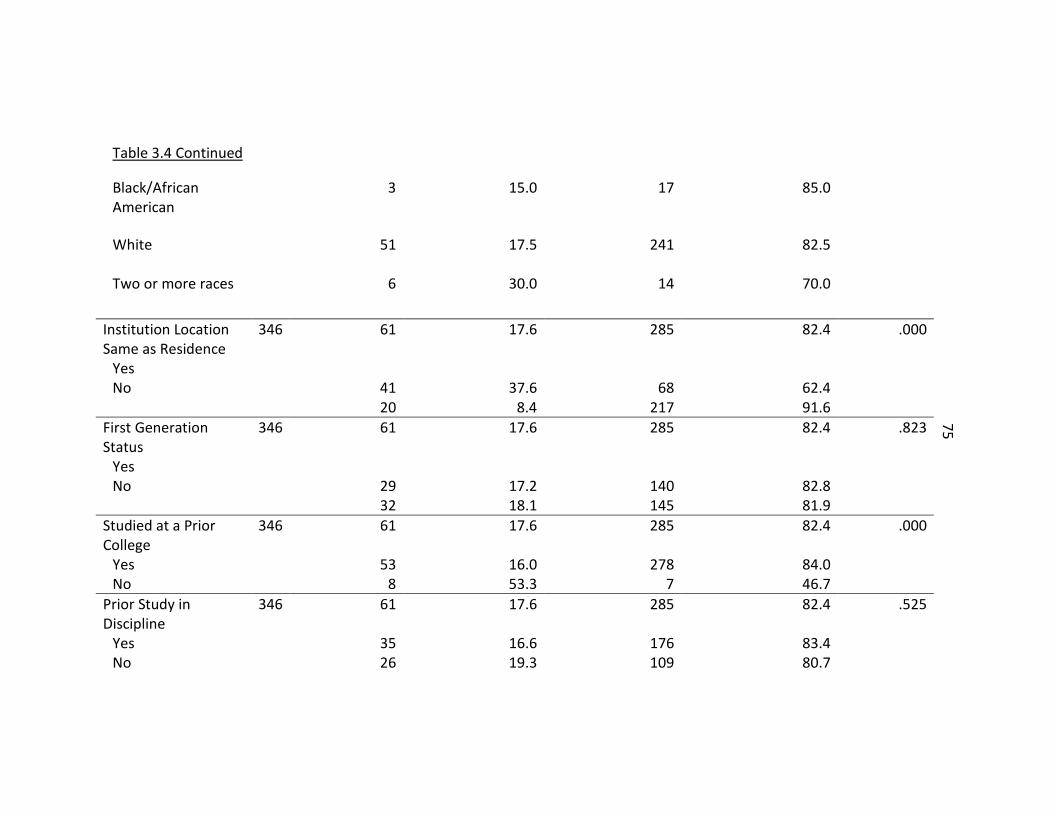
75
Table 3.4 Continued
Black/African American
3 15.0 17 85.0
White
51 17.5 241 82.5
Two or more races
6 30.0 14 70.0
Institution Location Same as Residence
Yes No
346 61
41 20
17.6
37.6 8.4
285
68 217
82.4
62.4 91.6
.000
First Generation Status
Yes No
346 61
29 32
17.6
17.2 18.1
285
140 145
82.4
82.8 81.9
.823
Studied at a Prior College
Yes No
346 61
53 8
17.6
16.0 53.3
285
278 7
82.4
84.0 46.7
.000
Prior Study in Discipline
Yes No
346 61
35 26
17.6
16.6 19.3
285
176 109
82.4
83.4 80.7
.525
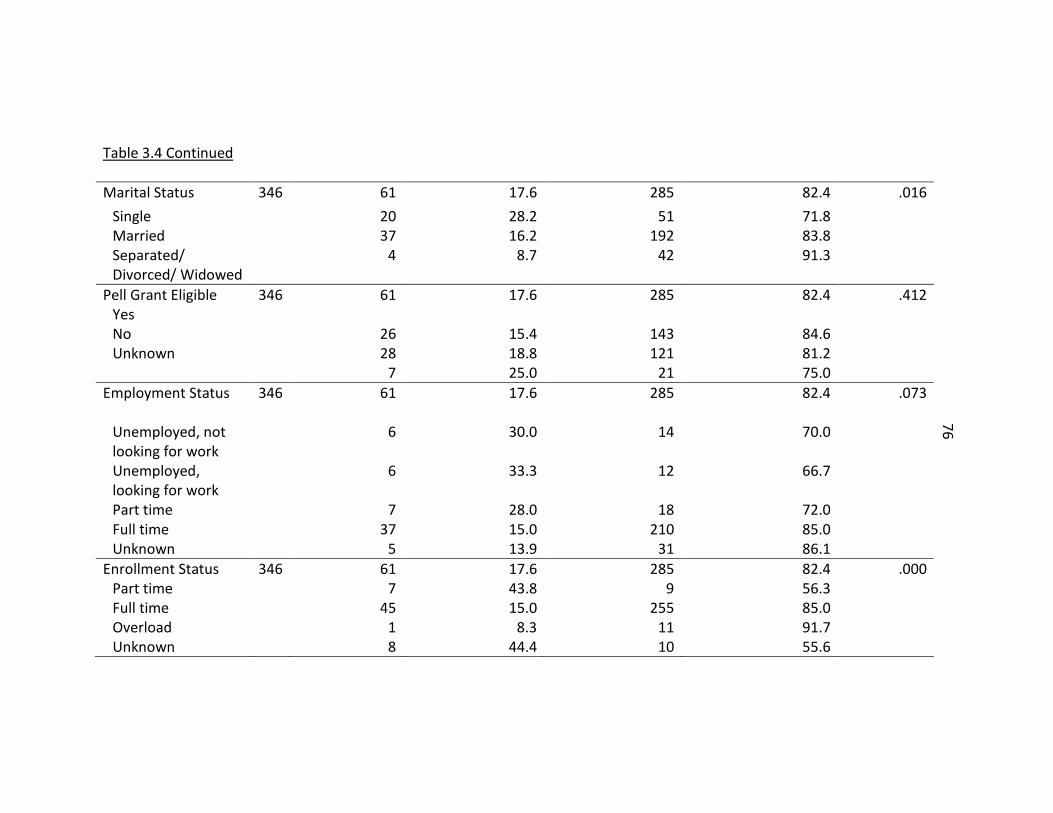
76
Table 3.4 Continued Marital Status 346 61 17.6 285 82.4 .016
Single 20 28.2 51 71.8 Married 37 16.2 192 83.8 Separated/ Divorced/ Widowed
4 8.7 42 91.3
Pell Grant Eligible Yes No Unknown
346 61
26 28
7
17.6
15.4 18.8 25.0
285
143 121
21
82.4
84.6 81.2 75.0
.412
Employment Status 346 61 17.6 285 82.4 .073 Unemployed, not looking for work
6 30.0 14 70.0
Unemployed, looking for work
6 33.3 12 66.7
Part time 7 28.0 18 72.0 Full time 37 15.0 210 85.0 Unknown 5 13.9 31 86.1
Enrollment Status 346 61 17.6 285 82.4 .000 Part time 7 43.8 9 56.3 Full time 45 15.0 255 85.0 Overload 1 8.3 11 91.7 Unknown 8 44.4 10 55.6
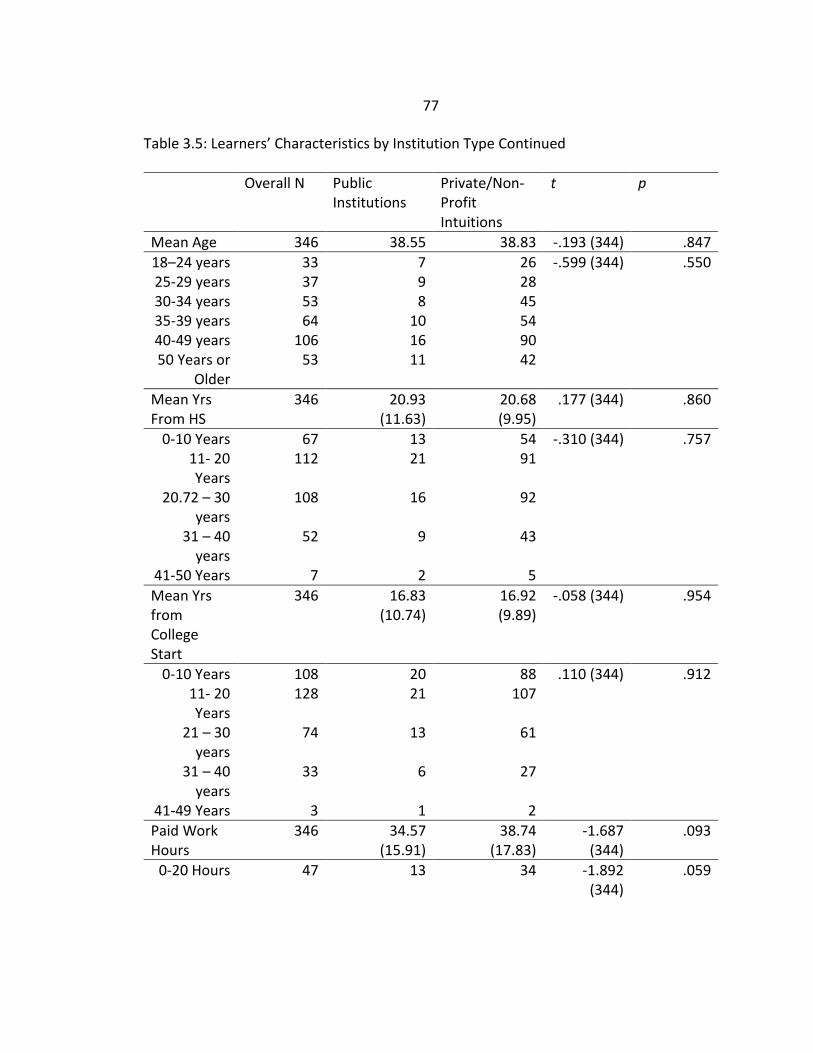
77
Table 3.5: Learners’ Characteristics by Institution Type Continued
Overall N Public Institutions
Private/Non-Profit Intuitions
t p
Mean Age 346 38.55 38.83 -.193 (344) .847 18–24 years 33 7 26 -.599 (344) .550 25-29 years 37 9 28 30-34 years 53 8 45 35-39 years 64 10 54 40-49 years 106 16 90 50 Years or
Older 53 11 42
Mean Yrs From HS
346 20.93 (11.63)
20.68 (9.95)
.177 (344) .860
0-10 Years 67 13 54 -.310 (344) .757 11- 20 Years
112 21 91
20.72 – 30 years
108 16 92
31 – 40 years
52 9 43
41-50 Years 7 2 5 Mean Yrs from College Start
346 16.83 (10.74)
16.92 (9.89)
-.058 (344) .954
0-10 Years 108 20 88 .110 (344) .912 11- 20 Years
128 21 107
21 – 30 years
74 13 61
31 – 40 years
33 6 27
41-49 Years 3 1 2 Paid Work Hours
346 34.57 (15.91)
38.74 (17.83)
-1.687 (344)
.093
0-20 Hours 47 13 34 -1.892 (344)
.059
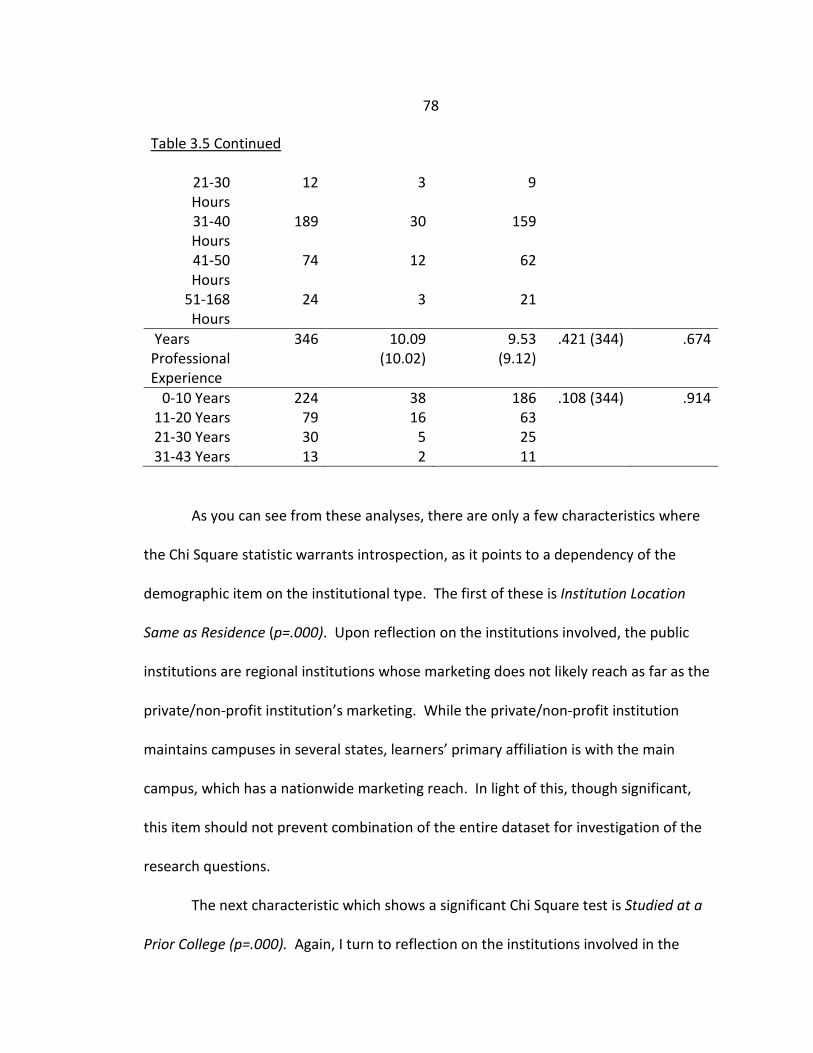
78
Table 3.5 Continued
21-30 Hours
12 3 9
31-40 Hours
189 30 159
41-50 Hours
74 12 62
51-168 Hours
24 3 21
Years Professional Experience
346 10.09 (10.02)
9.53 (9.12)
.421 (344) .674
0-10 Years 224 38 186 .108 (344) .914 11-20 Years 79 16 63 21-30 Years 30 5 25 31-43 Years 13 2 11
As you can see from these analyses, there are only a few characteristics where
the Chi Square statistic warrants introspection, as it points to a dependency of the
demographic item on the institutional type. The first of these is Institution Location
Same as Residence (p=.000). Upon reflection on the institutions involved, the public
institutions are regional institutions whose marketing does not likely reach as far as the
private/non-profit institution’s marketing. While the private/non-profit institution
maintains campuses in several states, learners’ primary affiliation is with the main
campus, which has a nationwide marketing reach. In light of this, though significant,
this item should not prevent combination of the entire dataset for investigation of the
research questions.
The next characteristic which shows a significant Chi Square test is Studied at a
Prior College (p=.000). Again, I turn to reflection on the institutions involved in the
79
study. The private/non-profit institution markets heavily to degree completion and
accepts a wide array of transfer credits. While the public institutions also have transfer
opportunities, when you look back at Table 3.1: Institutional Demographics, it is clear
the private/non-profit has far more transfer-in students than the other institutions.
Additionally, the public institutions offer additional modalities of learning (face-to-face,
traditional online) in addition to competency-based education whereas the private/non-
profit only offers competency-based education. Thus, the dependency of this variable
on institutional status should not prevent combination of the dataset for investigation
of the research questions.
Finally, Enrollment Status (p=.000) also shows a significant dependency on the
institutional type. Upon reflection of institutional policies, this question was not a fair
question to ask learners enrolled at the private/non-profit. Due to their subscription
pricing model, all learners are considered full-time by the institution, however, students
may judge their effort differently and therefore have reported it differently. Since there
was no true choice for students enrolled in the private/non-profit, this question will be
eliminated from further analyses.
Variables and Constructs
The survey had three sections with a total of thirty-four questions. Section one
focused on learners’ characteristics and contained twenty-five demographic questions.
Section two explored enrollment motivation and contained one question, with 21 items
80
to respond to regarding their relevance for the learners’ perception of how well each
statement fit them. Section three contained six open-ended questions regarding the
college choice process and one Likert scale to measure the learners’ satisfaction with
their decision to enroll in a competency-based education program. It was estimated to
take learners approximately 30 minutes to complete the survey.
Instrumentation
Table 3.6 contains the table of specifications. It aligns the research questions
with the survey questions which provide the data to answer the question.
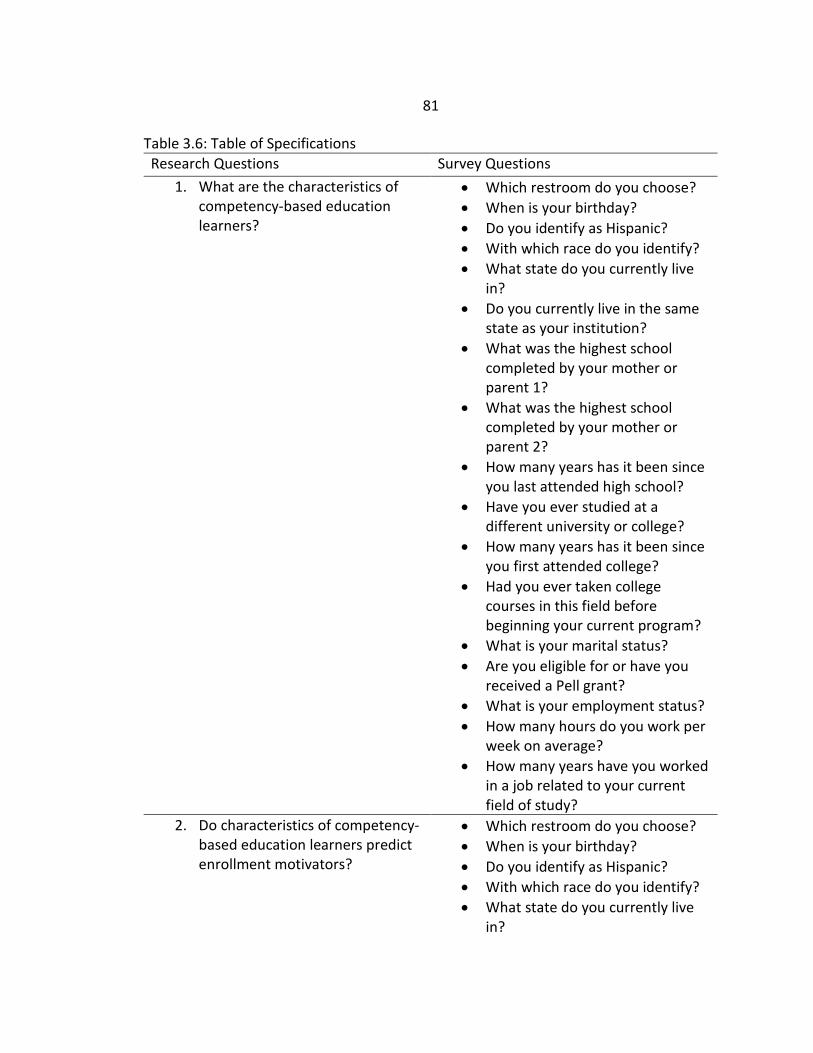
81
Table 3.6: Table of Specifications Research Questions Survey Questions
1. What are the characteristics of competency-based education learners?
• Which restroom do you choose? • When is your birthday? • Do you identify as Hispanic? • With which race do you identify? • What state do you currently live
in? • Do you currently live in the same
state as your institution? • What was the highest school
completed by your mother or parent 1?
• What was the highest school completed by your mother or parent 2?
• How many years has it been since you last attended high school?
• Have you ever studied at a different university or college?
• How many years has it been since you first attended college?
• Had you ever taken college courses in this field before beginning your current program?
• What is your marital status? • Are you eligible for or have you
received a Pell grant? • What is your employment status? • How many hours do you work per
week on average? • How many years have you worked
in a job related to your current field of study?
2. Do characteristics of competency-based education learners predict enrollment motivators?
• Which restroom do you choose? • When is your birthday? • Do you identify as Hispanic? • With which race do you identify? • What state do you currently live
in?
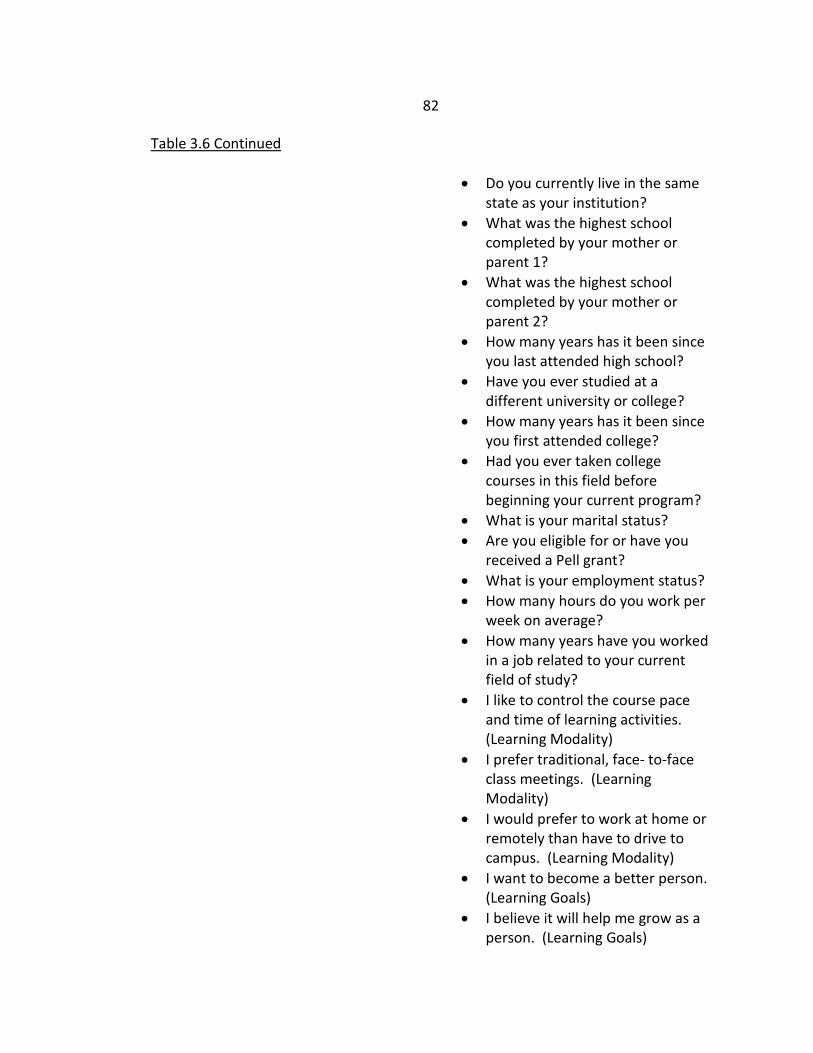
82
Table 3.6 Continued • Do you currently live in the same
state as your institution? • What was the highest school
completed by your mother or parent 1?
• What was the highest school completed by your mother or parent 2?
• How many years has it been since you last attended high school?
• Have you ever studied at a different university or college?
• How many years has it been since you first attended college?
• Had you ever taken college courses in this field before beginning your current program?
• What is your marital status? • Are you eligible for or have you
received a Pell grant? • What is your employment status? • How many hours do you work per
week on average? • How many years have you worked
in a job related to your current field of study?
• I like to control the course pace and time of learning activities. (Learning Modality)
• I prefer traditional, face- to-face class meetings. (Learning Modality)
• I would prefer to work at home or remotely than have to drive to campus. (Learning Modality)
• I want to become a better person. (Learning Goals)
• I believe it will help me grow as a person. (Learning Goals)
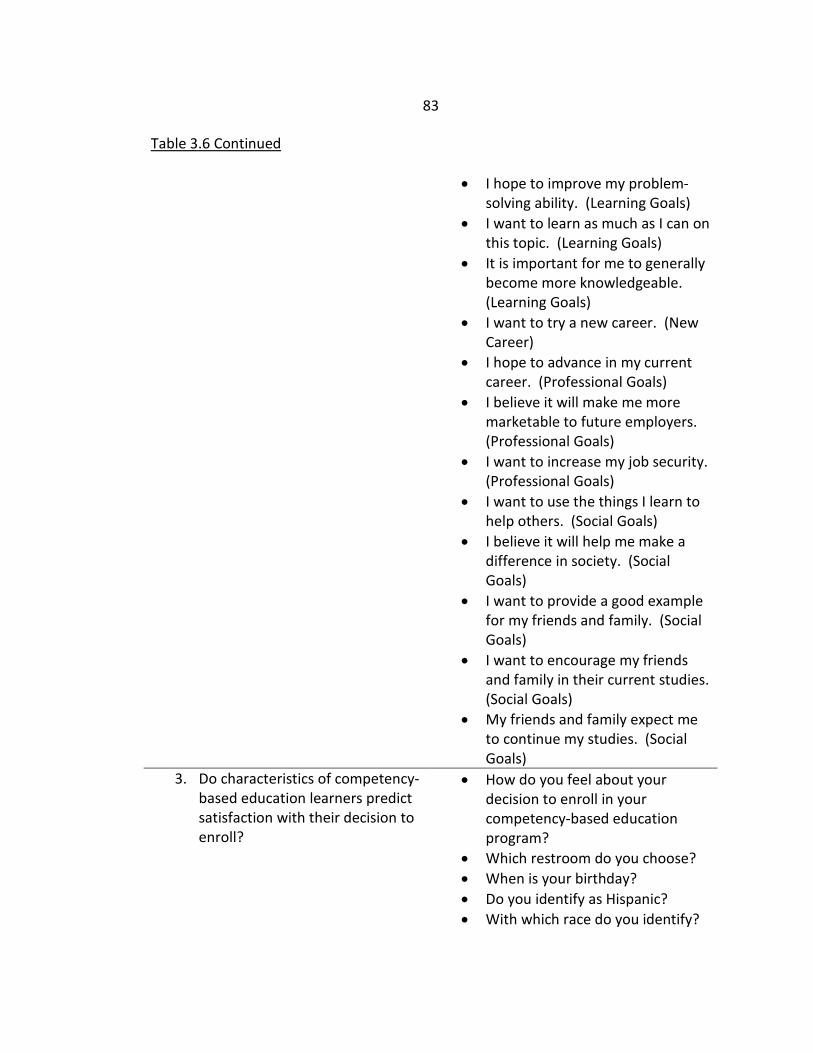
83
Table 3.6 Continued • I hope to improve my problem-
solving ability. (Learning Goals) • I want to learn as much as I can on
this topic. (Learning Goals) • It is important for me to generally
become more knowledgeable. (Learning Goals)
• I want to try a new career. (New Career)
• I hope to advance in my current career. (Professional Goals)
• I believe it will make me more marketable to future employers. (Professional Goals)
• I want to increase my job security. (Professional Goals)
• I want to use the things I learn to help others. (Social Goals)
• I believe it will help me make a difference in society. (Social Goals)
• I want to provide a good example for my friends and family. (Social Goals)
• I want to encourage my friends and family in their current studies. (Social Goals)
• My friends and family expect me to continue my studies. (Social Goals)
3. Do characteristics of competency-based education learners predict satisfaction with their decision to enroll?
• How do you feel about your decision to enroll in your competency-based education program?
• Which restroom do you choose? • When is your birthday? • Do you identify as Hispanic? • With which race do you identify?
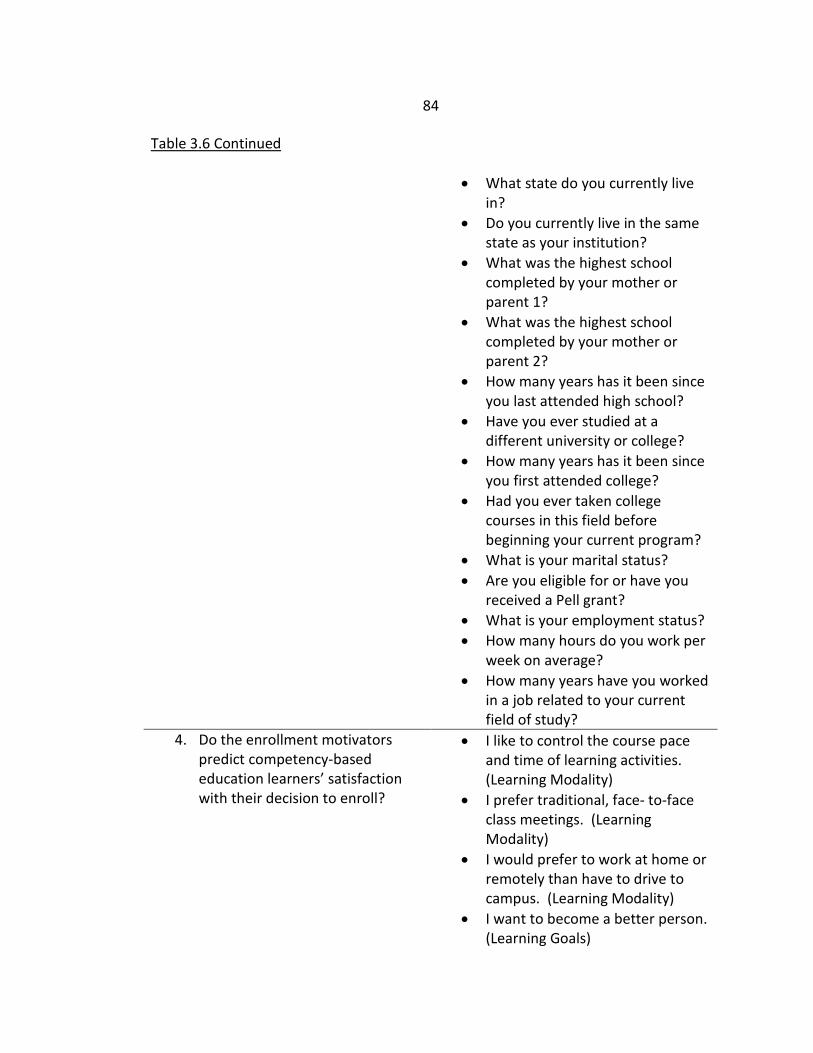
84
Table 3.6 Continued • What state do you currently live
in? • Do you currently live in the same
state as your institution? • What was the highest school
completed by your mother or parent 1?
• What was the highest school completed by your mother or parent 2?
• How many years has it been since you last attended high school?
• Have you ever studied at a different university or college?
• How many years has it been since you first attended college?
• Had you ever taken college courses in this field before beginning your current program?
• What is your marital status? • Are you eligible for or have you
received a Pell grant? • What is your employment status? • How many hours do you work per
week on average? • How many years have you worked
in a job related to your current field of study?
4. Do the enrollment motivators predict competency-based education learners’ satisfaction with their decision to enroll?
• I like to control the course pace and time of learning activities. (Learning Modality)
• I prefer traditional, face- to-face class meetings. (Learning Modality)
• I would prefer to work at home or remotely than have to drive to campus. (Learning Modality)
• I want to become a better person. (Learning Goals)
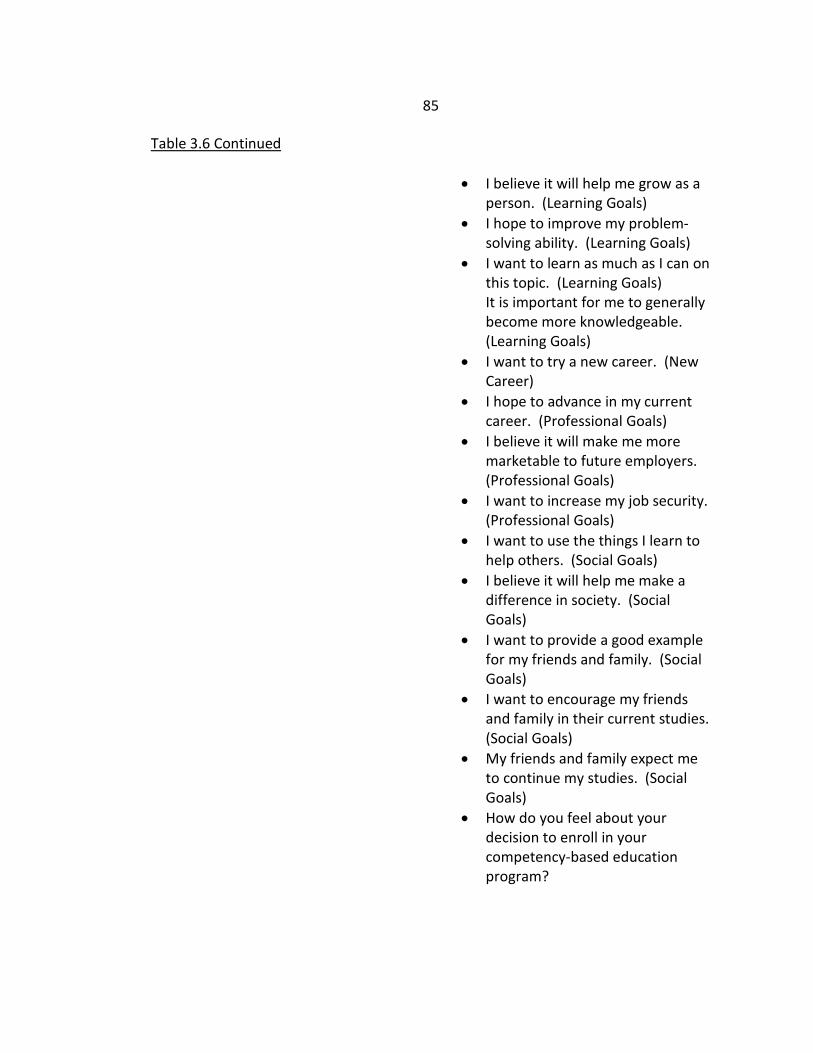
85
Table 3.6 Continued • I believe it will help me grow as a
person. (Learning Goals) • I hope to improve my problem-
solving ability. (Learning Goals) • I want to learn as much as I can on
this topic. (Learning Goals) It is important for me to generally become more knowledgeable. (Learning Goals)
• I want to try a new career. (New Career)
• I hope to advance in my current career. (Professional Goals)
• I believe it will make me more marketable to future employers. (Professional Goals)
• I want to increase my job security. (Professional Goals)
• I want to use the things I learn to help others. (Social Goals)
• I believe it will help me make a difference in society. (Social Goals)
• I want to provide a good example for my friends and family. (Social Goals)
• I want to encourage my friends and family in their current studies. (Social Goals)
• My friends and family expect me to continue my studies. (Social Goals)
• How do you feel about your decision to enroll in your competency-based education program?
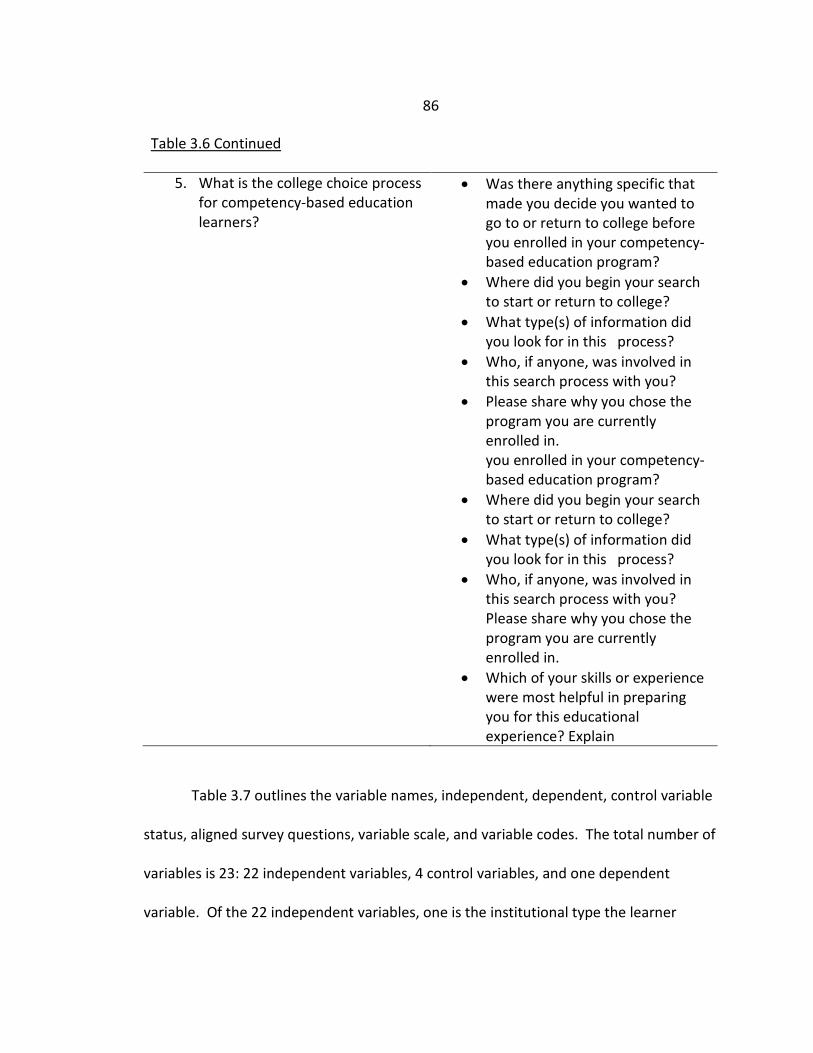
86
Table 3.6 Continued
5. What is the college choice process for competency-based education learners?
• Was there anything specific that made you decide you wanted to go to or return to college before you enrolled in your competency-based education program?
• Where did you begin your search to start or return to college?
• What type(s) of information did you look for in this process?
• Who, if anyone, was involved in this search process with you?
• Please share why you chose the program you are currently enrolled in.
you enrolled in your competency-based education program?
• Where did you begin your search to start or return to college?
• What type(s) of information did you look for in this process?
• Who, if anyone, was involved in this search process with you? Please share why you chose the program you are currently enrolled in.
• Which of your skills or experience were most helpful in preparing you for this educational experience? Explain
Table 3.7 outlines the variable names, independent, dependent, control variable
status, aligned survey questions, variable scale, and variable codes. The total number of
variables is 23: 22 independent variables, 4 control variables, and one dependent
variable. Of the 22 independent variables, one is the institutional type the learner
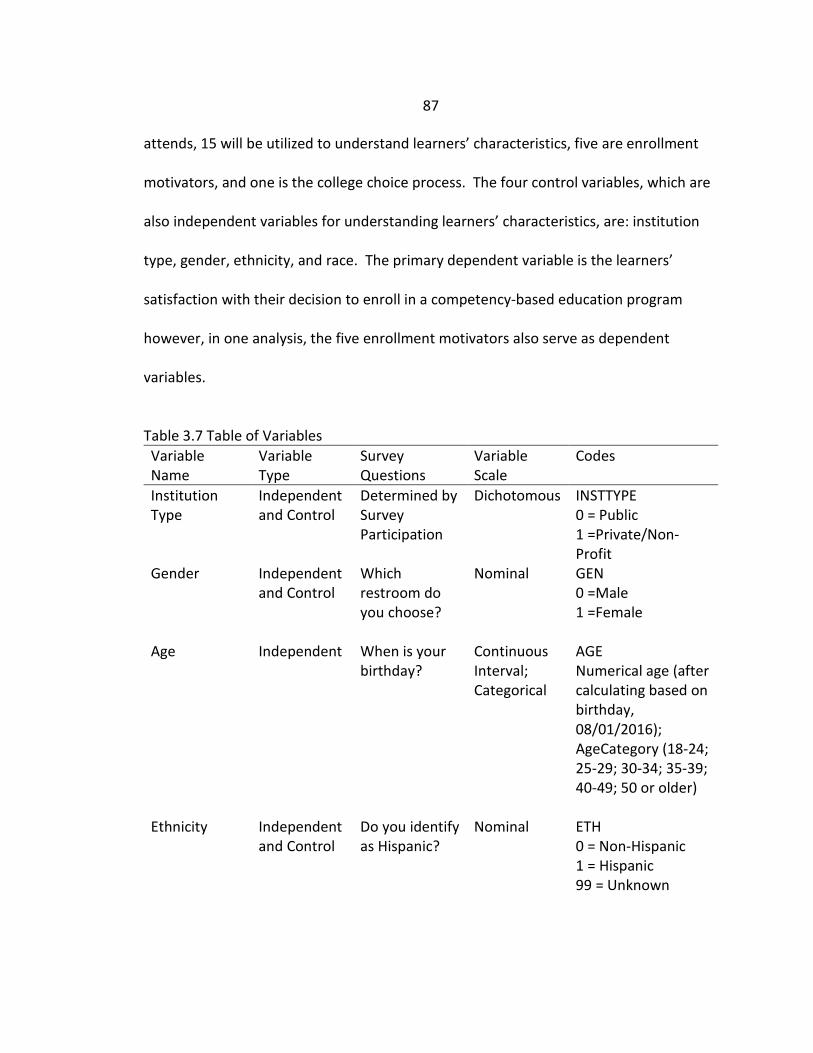
87
attends, 15 will be utilized to understand learners’ characteristics, five are enrollment
motivators, and one is the college choice process. The four control variables, which are
also independent variables for understanding learners’ characteristics, are: institution
type, gender, ethnicity, and race. The primary dependent variable is the learners’
satisfaction with their decision to enroll in a competency-based education program
however, in one analysis, the five enrollment motivators also serve as dependent
variables.
Table 3.7 Table of Variables Variable Name
Variable Type
Survey Questions
Variable Scale
Codes
Institution Type
Independent and Control
Determined by Survey Participation
Dichotomous INSTTYPE 0 = Public 1 =Private/Non-Profit
Gender Independent and Control
Which restroom do you choose?
Nominal GEN 0 =Male 1 =Female
Age Independent When is your birthday?
Continuous Interval; Categorical
AGE Numerical age (after calculating based on birthday, 08/01/2016); AgeCategory (18-24; 25-29; 30-34; 35-39; 40-49; 50 or older)
Ethnicity Independent and Control
Do you identify as Hispanic?
Nominal ETH 0 = Non-Hispanic 1 = Hispanic 99 = Unknown
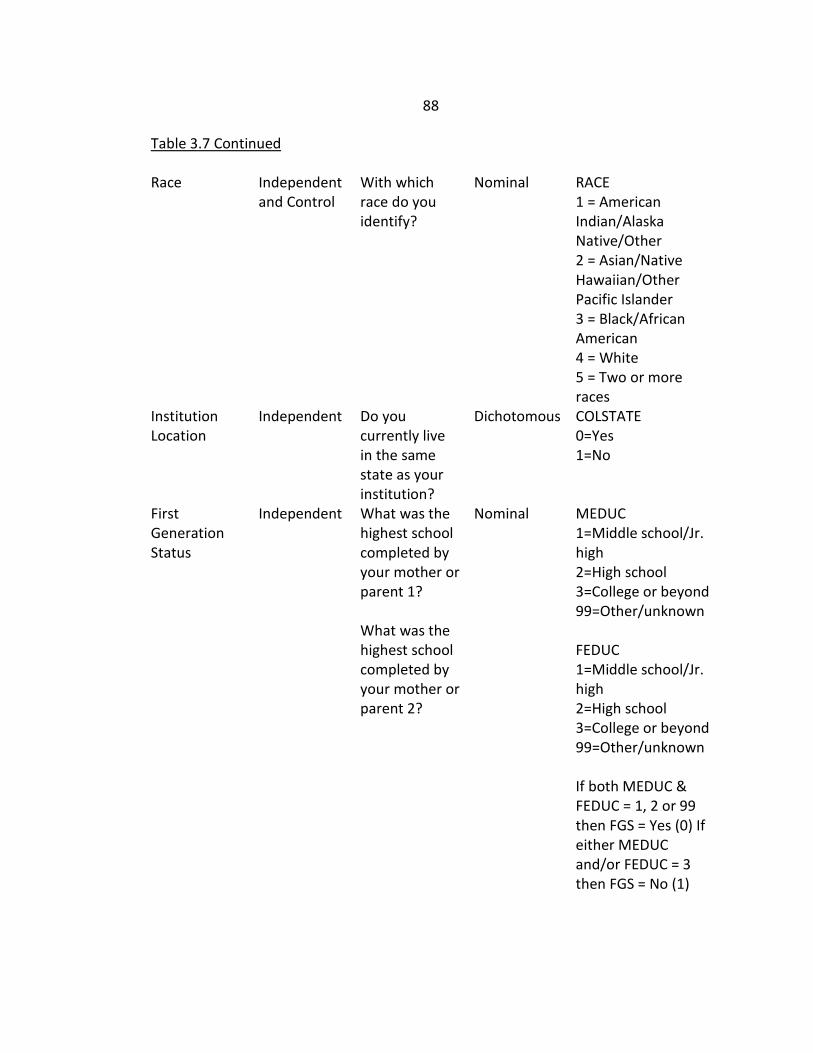
88
Table 3.7 Continued Race Independent
and Control With which race do you identify?
Nominal RACE 1 = American Indian/Alaska Native/Other 2 = Asian/Native Hawaiian/Other Pacific Islander
3 = Black/African American 4 = White 5 = Two or more races
Institution Location
Independent Do you currently live in the same state as your institution?
Dichotomous COLSTATE 0=Yes 1=No
First Generation Status
Independent What was the highest school completed by your mother or parent 1? What was the highest school completed by your mother or parent 2?
Nominal MEDUC 1=Middle school/Jr. high 2=High school 3=College or beyond 99=Other/unknown FEDUC 1=Middle school/Jr. high 2=High school 3=College or beyond 99=Other/unknown If both MEDUC & FEDUC = 1, 2 or 99 then FGS = Yes (0) If either MEDUC and/or FEDUC = 3 then FGS = No (1)
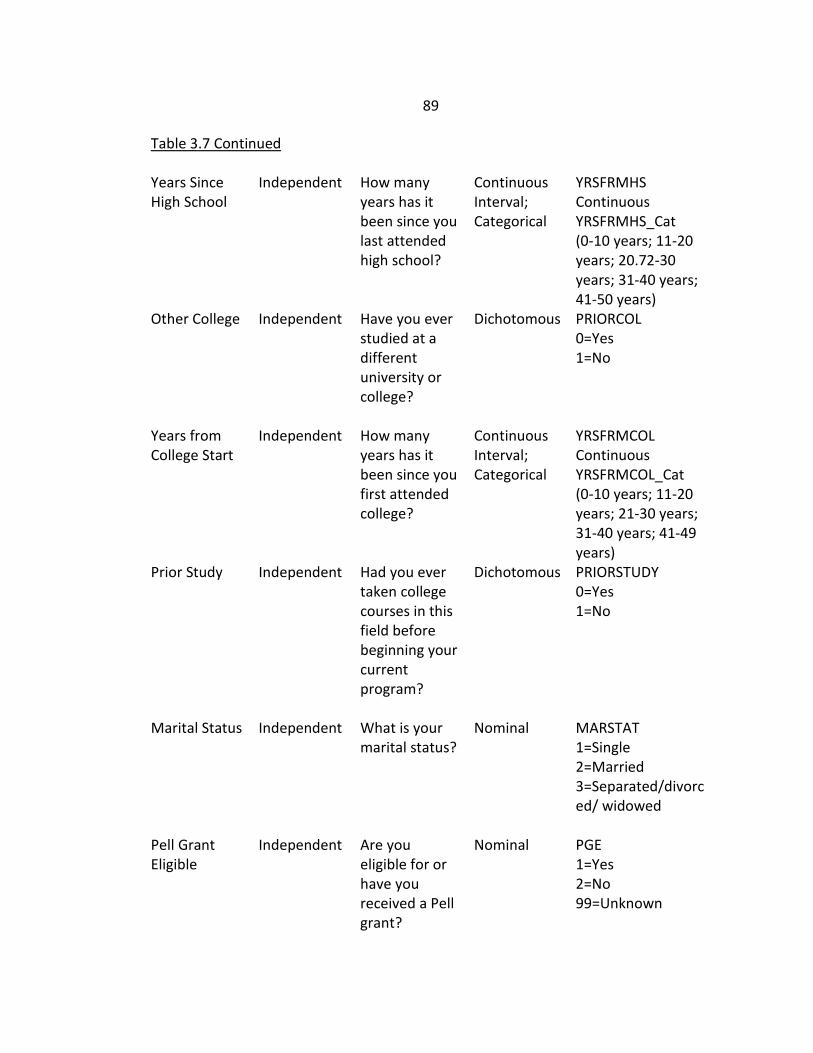
89
Table 3.7 Continued Years Since High School
Independent How many years has it been since you last attended high school?
Continuous Interval; Categorical
YRSFRMHS Continuous YRSFRMHS_Cat (0-10 years; 11-20 years; 20.72-30 years; 31-40 years; 41-50 years)
Other College Independent Have you ever studied at a different university or college?
Dichotomous PRIORCOL 0=Yes 1=No
Years from College Start
Independent How many years has it been since you first attended college?
Continuous Interval; Categorical
YRSFRMCOL Continuous YRSFRMCOL_Cat (0-10 years; 11-20 years; 21-30 years; 31-40 years; 41-49 years)
Prior Study Independent Had you ever taken college courses in this field before beginning your current program?
Dichotomous PRIORSTUDY 0=Yes 1=No
Marital Status Independent What is your marital status?
Nominal MARSTAT 1=Single 2=Married 3=Separated/divorced/ widowed
Pell Grant Eligible
Independent Are you eligible for or have you received a Pell grant?
Nominal PGE 1=Yes 2=No 99=Unknown
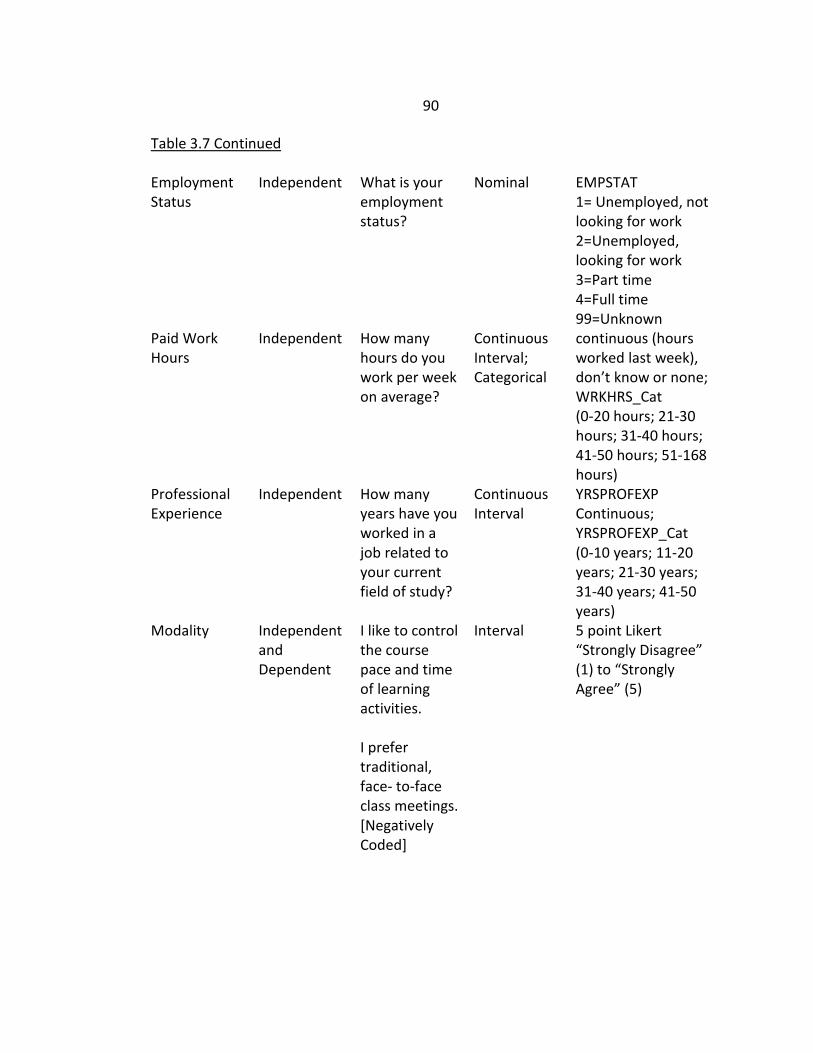
90
Table 3.7 Continued Employment Status
Independent What is your employment status?
Nominal EMPSTAT 1= Unemployed, not looking for work 2=Unemployed, looking for work 3=Part time 4=Full time 99=Unknown
Paid Work Hours
Independent How many hours do you work per week on average?
Continuous Interval; Categorical
continuous (hours worked last week), don’t know or none; WRKHRS_Cat (0-20 hours; 21-30 hours; 31-40 hours; 41-50 hours; 51-168 hours)
Professional Experience
Independent How many years have you worked in a job related to your current field of study?
Continuous Interval
YRSPROFEXP Continuous; YRSPROFEXP_Cat (0-10 years; 11-20 years; 21-30 years; 31-40 years; 41-50 years)
Modality Independent and Dependent
I like to control the course pace and time of learning activities. I prefer traditional, face- to-face class meetings. [Negatively Coded]
Interval 5 point Likert “Strongly Disagree” (1) to “Strongly Agree” (5)
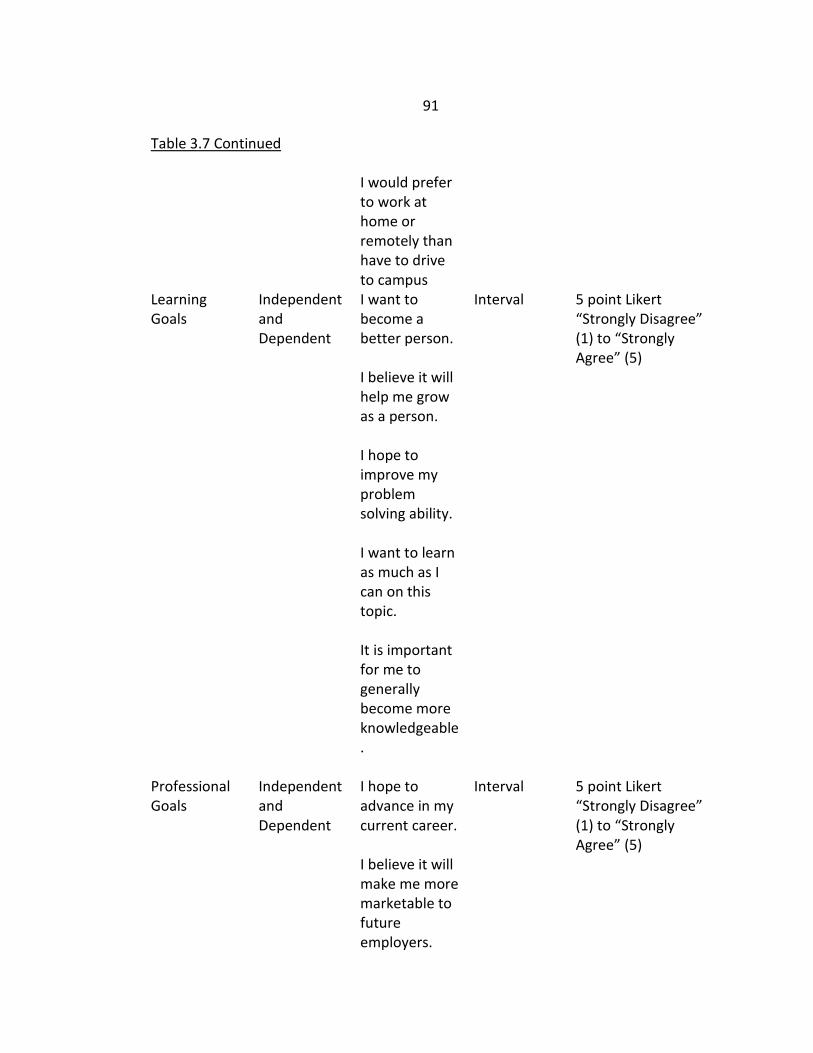
91
Table 3.7 Continued I would prefer
to work at home or remotely than have to drive to campus
Learning Goals
Independent and Dependent
I want to become a better person. I believe it will help me grow as a person. I hope to improve my problem solving ability. I want to learn as much as I can on this topic. It is important for me to generally become more knowledgeable.
Interval 5 point Likert “Strongly Disagree” (1) to “Strongly Agree” (5)
Professional Goals
Independent and Dependent
I hope to advance in my current career. I believe it will make me more marketable to future employers.
Interval 5 point Likert “Strongly Disagree” (1) to “Strongly Agree” (5)
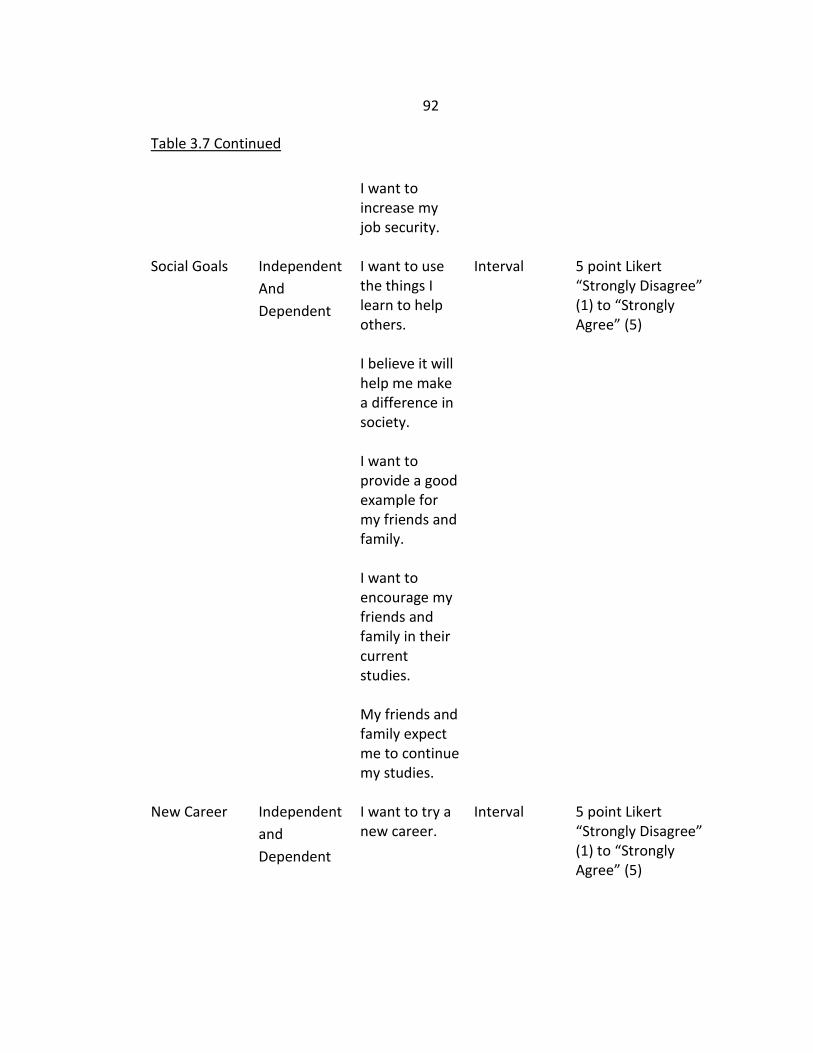
92
Table 3.7 Continued I want to
increase my job security.
Social Goals Independent And Dependent
I want to use the things I learn to help others. I believe it will help me make a difference in society. I want to provide a good example for my friends and family. I want to encourage my friends and family in their current studies. My friends and family expect me to continue my studies.
Interval 5 point Likert “Strongly Disagree” (1) to “Strongly Agree” (5)
New Career Independent and Dependent
I want to try a new career.
Interval 5 point Likert “Strongly Disagree” (1) to “Strongly Agree” (5)
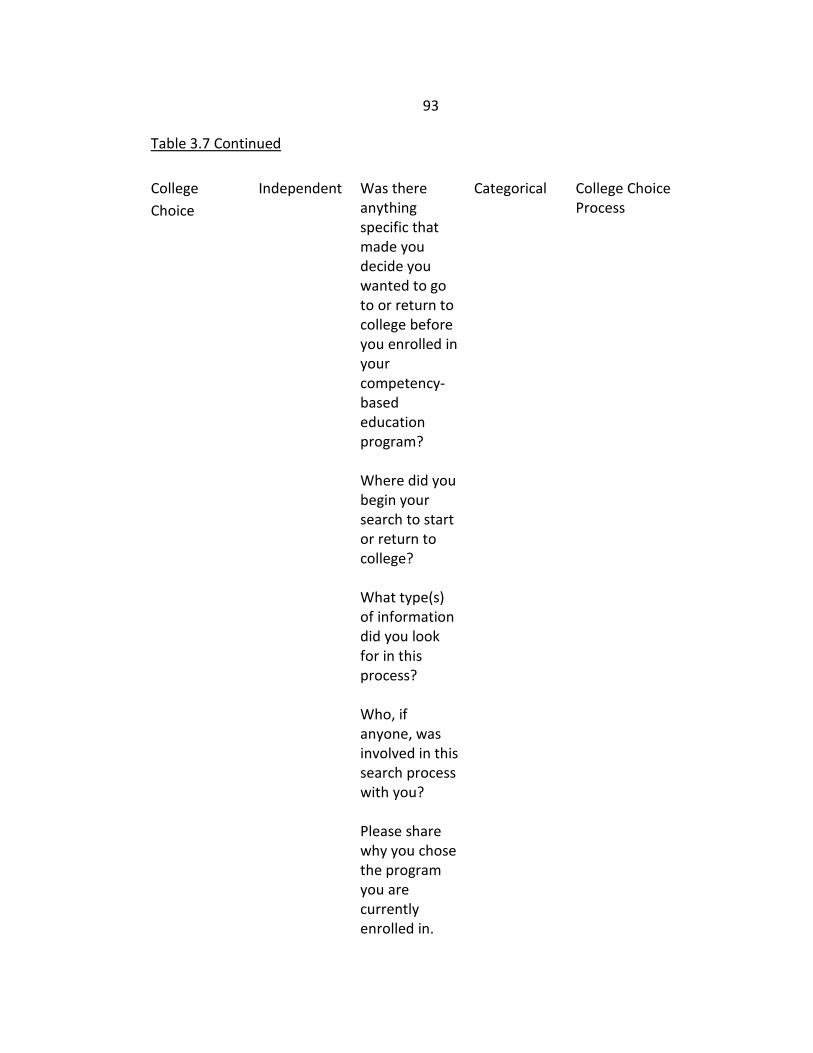
93
Table 3.7 Continued College Choice
Independent Was there anything specific that made you decide you wanted to go to or return to college before you enrolled in your competency-based education program? Where did you begin your search to start or return to college? What type(s) of information did you look for in this process? Who, if anyone, was involved in this search process with you? Please share why you chose the program you are currently enrolled in.
Categorical College Choice Process
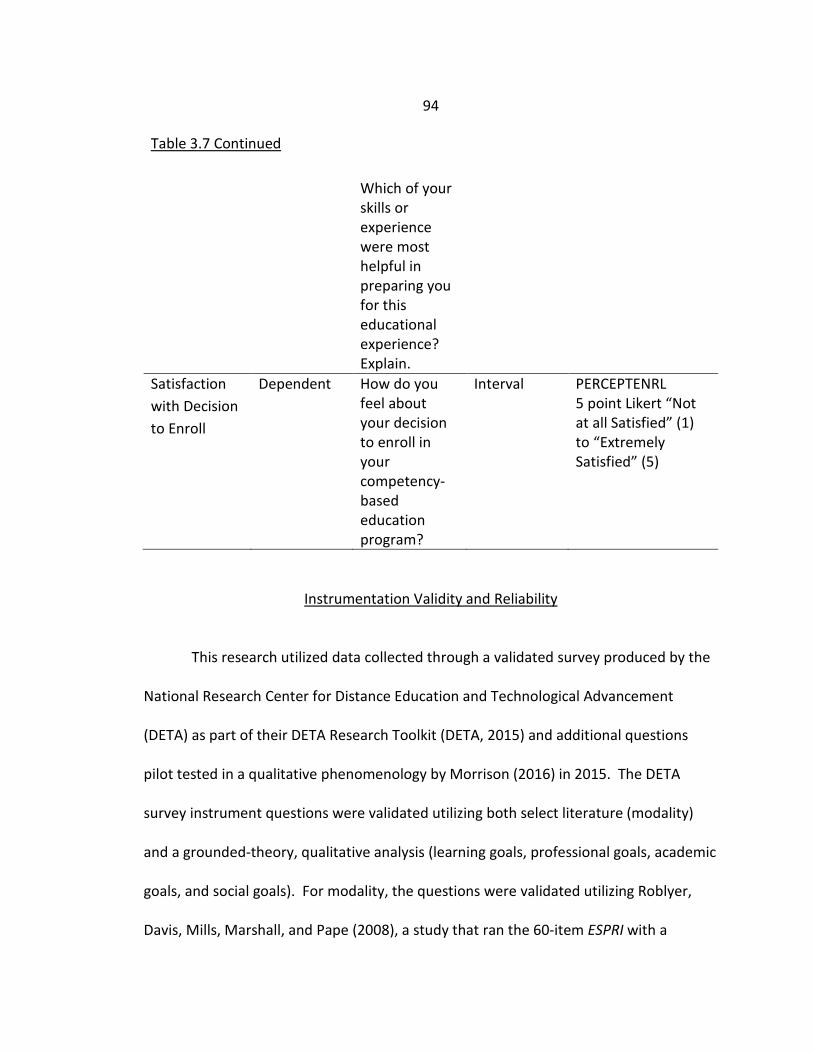
94
Table 3.7 Continued Which of your
skills or experience were most helpful in preparing you for this educational experience? Explain.
Satisfaction with Decision to Enroll
Dependent How do you feel about your decision to enroll in your competency-based education program?
Interval PERCEPTENRL 5 point Likert “Not at all Satisfied” (1) to “Extremely Satisfied” (5)
Instrumentation Validity and Reliability
This research utilized data collected through a validated survey produced by the
National Research Center for Distance Education and Technological Advancement
(DETA) as part of their DETA Research Toolkit (DETA, 2015) and additional questions
pilot tested in a qualitative phenomenology by Morrison (2016) in 2015. The DETA
survey instrument questions were validated utilizing both select literature (modality)
and a grounded-theory, qualitative analysis (learning goals, professional goals, academic
goals, and social goals). For modality, the questions were validated utilizing Roblyer,
Davis, Mills, Marshall, and Pape (2008), a study that ran the 60-item ESPRI with a
95
population of 2,880 online learners. This study had a reported “total scale reliability for
the sixty-item version of the instrument was found to be alpha = .92…” (Roblyer, Davis,
Mills, Marshall, & Pape, 2008, p.98). For learning goals, professional goals, academic
goals, and social goals the items were validated utilizing the following procedure:
“The items in this instrument were developed based on a grounded-theory, qualitative analysis of student goals recorded during the recruitment and application process for the University of Wisconsin (UW) Flexible Option, a fully online, competency-based, direct assessment program offered as a collaboration among UW-Extension, UW Colleges, UW-Milwaukee, and UW-Parkside. The responses were collected as part of the normal recruitment process when students were asked about their “Career Goals” during a phone interview with recruitment staff. The responses were then recorded and stored as part of their file and retrieved for this analysis. After initial analysis was complete, the research team validated and identified constructs during a focus group with program success coaches, who are the staff that have the most interaction with enrolled students on a day-to-day basis” (DETA, 2015, p. 139-140).
Although these motivation categories were the basis of the prior research, a
primary factor analysis of the actual responses to this implementation of the survey
reveals factor loadings that differ from those the DETA Toolkit reported. Table 3.8
outlines the factor loadings, which eliminates one of UW DETA’s factors, academic goals,
and adds an additional factor – New Career. The factor, academic goals, was eliminated
because the questions associated with this category did not load on any one factor, but
rather weakly loaded on several factors. The level of loading was determined based on
the work of Comrey and Lee (1992) which states that factor loading hits the acceptable
level at .55 (p.243).
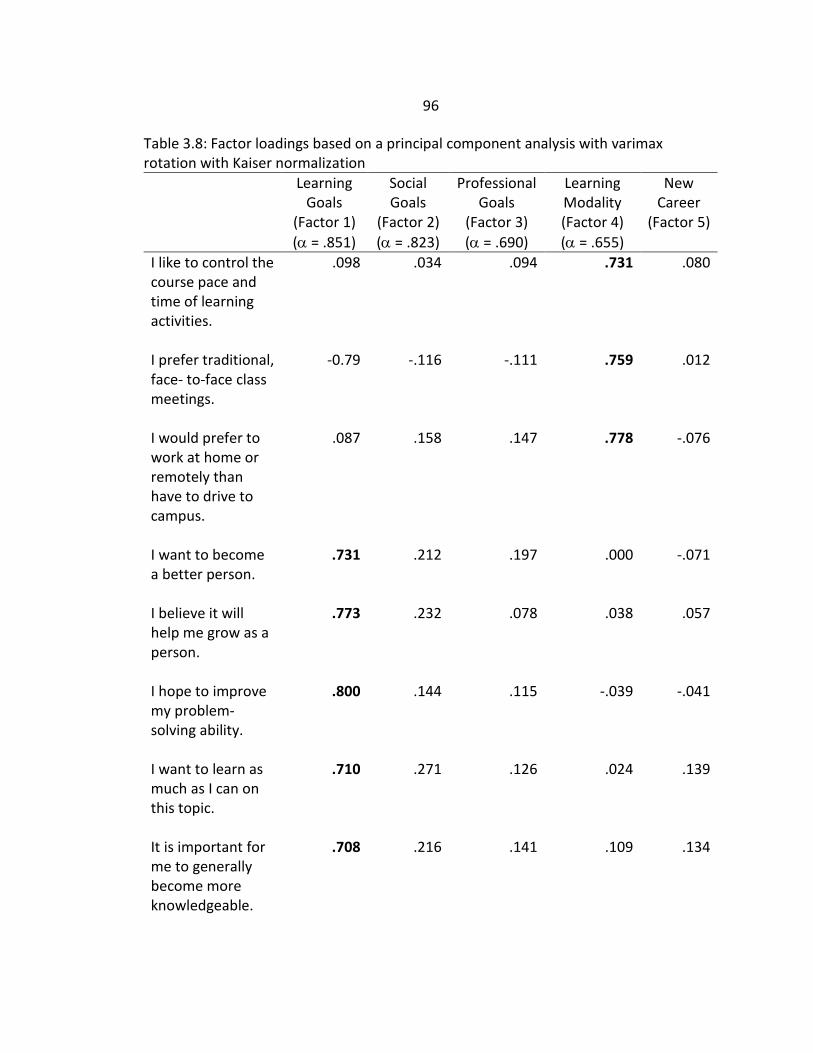
96
Table 3.8: Factor loadings based on a principal component analysis with varimax rotation with Kaiser normalization Learning
Goals (Factor 1) (α = .851)
Social Goals
(Factor 2) (α = .823)
Professional Goals
(Factor 3) (α = .690)
Learning Modality (Factor 4) (α = .655)
New Career
(Factor 5)
I like to control the course pace and time of learning activities.
.098 .034 .094 .731 .080
I prefer traditional, face- to-face class meetings.
-0.79 -.116 -.111 .759 .012
I would prefer to work at home or remotely than have to drive to campus.
.087 .158 .147 .778 -.076
I want to become a better person.
.731 .212 .197 .000 -.071
I believe it will help me grow as a person.
.773 .232 .078 .038 .057
I hope to improve my problem-solving ability.
.800 .144 .115 -.039 -.041
I want to learn as much as I can on this topic.
.710 .271 .126 .024 .139
It is important for me to generally become more knowledgeable.
.708 .216 .141 .109 .134
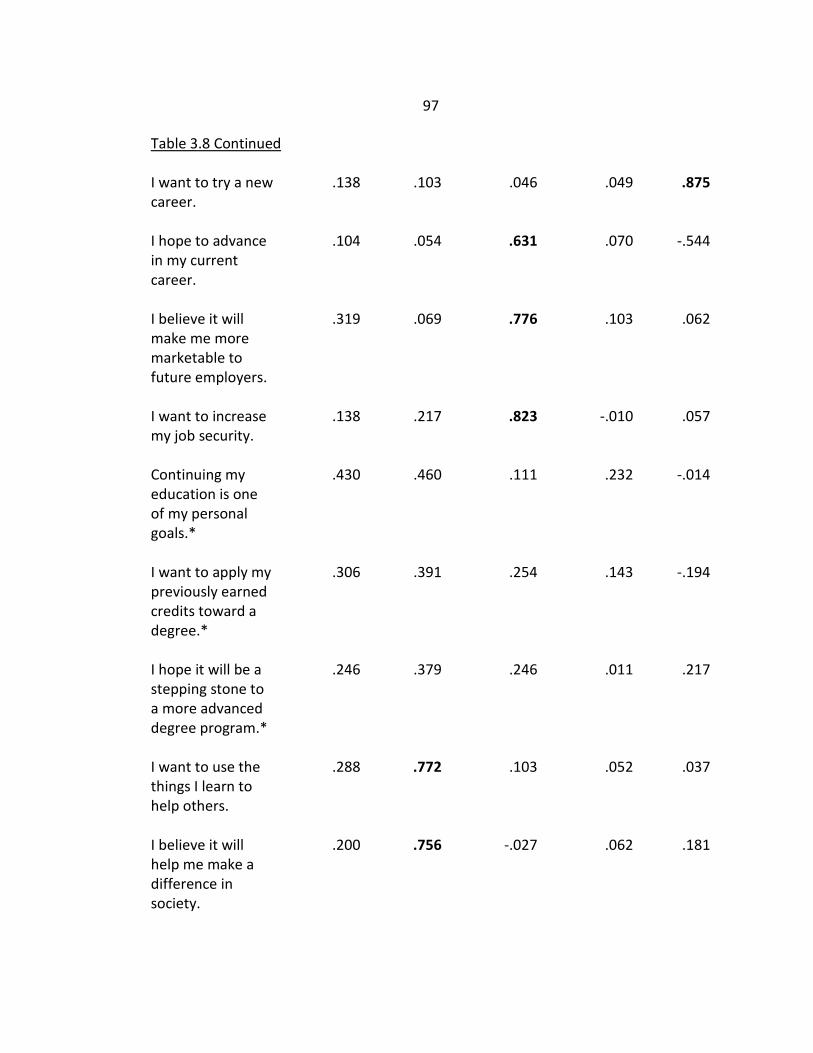
97
Table 3.8 Continued I want to try a new career.
.138 .103 .046 .049 .875
I hope to advance in my current career.
.104 .054 .631 .070 -.544
I believe it will make me more marketable to future employers.
.319 .069 .776 .103 .062
I want to increase my job security.
.138 .217 .823 -.010 .057
Continuing my education is one of my personal goals.*
.430 .460 .111 .232 -.014
I want to apply my previously earned credits toward a degree.*
.306 .391 .254 .143 -.194
I hope it will be a stepping stone to a more advanced degree program.*
.246 .379 .246 .011 .217
I want to use the things I learn to help others.
.288 .772 .103 .052 .037
I believe it will help me make a difference in society.
.200 .756 -.027 .062 .181
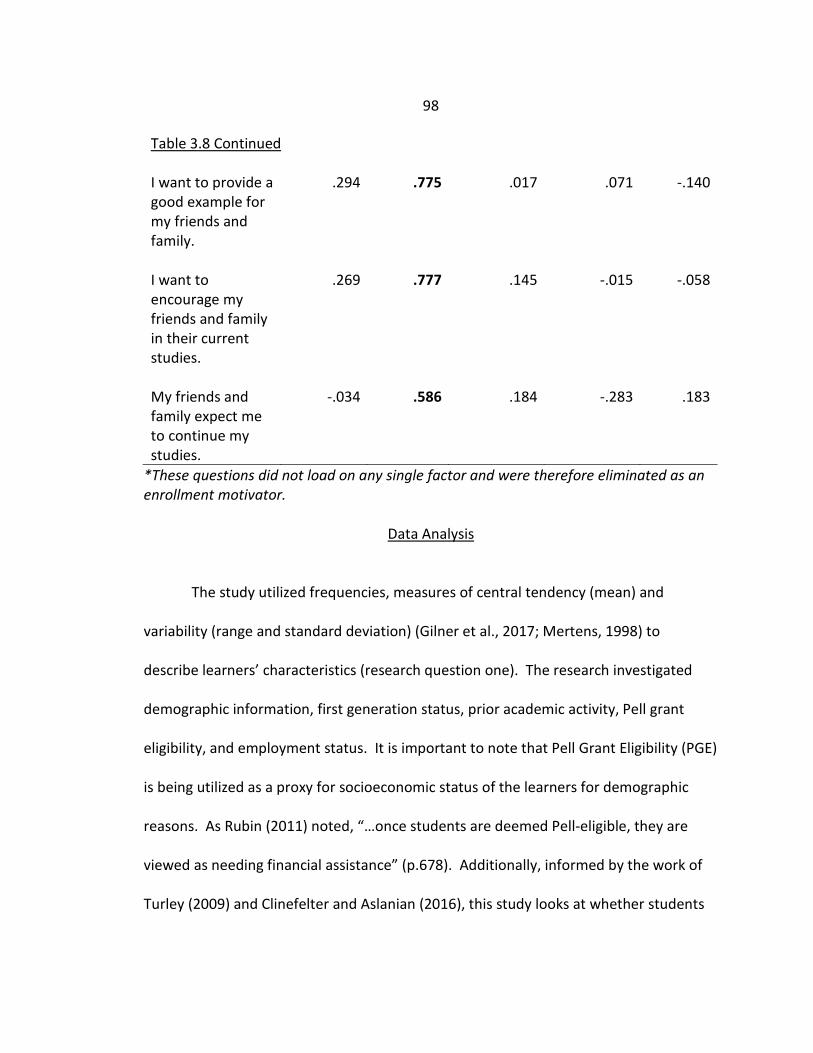
98
Table 3.8 Continued I want to provide a good example for my friends and family.
.294 .775 .017 .071 -.140
I want to encourage my friends and family in their current studies.
.269 .777 .145 -.015 -.058
My friends and family expect me to continue my studies.
-.034 .586 .184 -.283 .183
*These questions did not load on any single factor and were therefore eliminated as an enrollment motivator.
Data Analysis
The study utilized frequencies, measures of central tendency (mean) and
variability (range and standard deviation) (Gilner et al., 2017; Mertens, 1998) to
describe learners’ characteristics (research question one). The research investigated
demographic information, first generation status, prior academic activity, Pell grant
eligibility, and employment status. It is important to note that Pell Grant Eligibility (PGE)
is being utilized as a proxy for socioeconomic status of the learners for demographic
reasons. As Rubin (2011) noted, “…once students are deemed Pell-eligible, they are
viewed as needing financial assistance” (p.678). Additionally, informed by the work of
Turley (2009) and Clinefelter and Aslanian (2016), this study looks at whether students
99
live in the same state as the institution in which they are enrolled as a proxy for location
being a factor in the college choice process.
For characteristics associated with variables which contained open responses
(age, years from high school, years from college start, work hours, and years
professional experience) the data have been analyzed in two ways, to provide a depth of
view into the data. First, the mean, standard deviation and range are shared for each of
these variables. Then to facilitate additional analysis, each variable was broken down
into meaningful categories for the data (Abbott & McKinney, 2013). For age categories,
the data use the work of Kelchen (2016) and the 2017-2018 IPEDS Data Collection for
Fall Enrollment for 4-year Degree Granting Institutions (NCES, 2018). However, based
on initial analysis of the data, several categories were collapsed to separate the
traditional age students (18-24 years) from the non-traditional age students (25 and
older).
The next three research questions implemented a correlational research design
utilizing a series of ordinary least squares regression models to estimate the
relationships outlined in the research questions above. Exploratory analyses were
conducted to test the assumptions of ordinary least squares regression. The
assumptions of multiple regression include an interval dependent variable that is
normally distributed; the relationship between the predictor, or independent, variables
and dependent variable is linear (Gilner et al., 2017). This was tested by evaluating the
skewness and kurtosis of the variables through the frequencies command in SPSS
100
(Leech, Barrett, & Morgan, 2011). Collinearity of independent variables can present an
issue in analysis (Gilner et al., 2017; Leech et al., 2011; Tabachnick & Fidell, 2013).
Correlation matrices were implemented to investigate the collinearity of the
independent variables, including enrollment motivators and learners’ characteristics. All
enrollment motivators were found to be weakly correlated except for Learning Goals
and Social Goals which were low-moderately correlated (.522). Learners’ characteristics
were also all found to be weakly correlated except Years from College Start and Age
Category (.685) which was moderately correlated and Years from High School and Age
Category (.865) and Years from High School and Years from College Start (.710) which
were highly correlated. Tabachnick & Fidell (2013) suggest eliminating one of the
variables in any bivariate correlation over .70 before implementing the multiple linear
regression. For this reason, Years from High School, Years from College Start, and Age
Category were eliminated from the regression analyses. The many low correlations are
a positive outcome for the independence of the enrollment motivators and learners’
characteristics. Analysis of collinearity statistics show this assumption has been met as
VIF scores were all below 10 and tolerance scores were all above 0.2. Additionally, the
values of residuals are shown to be independent as all Durbin-Watson scores were
above 1 and below 3, with a range of 1.682 to 2.049. The assumption of variance of
residuals was investigated via a plot of standardized residuals versus standardized
predicted values. The resulting scatterplots showed no overt funneling, suggesting this
assumption has been met. Finally, Cook’s distance values were calculated to test the
101
assumption that there were no influential cases biasing the models. As no values were
over 1, this suggests no cases inordinately influenced the models.
To address research question two, multiple linear regression was employed to
determine if the characteristics of competency-based education learners predict the
enrollment motivators. Research question two utilized the following models for each
enrollment motivator (Modality, Learning Goals, Professional Goals, Social Goals, New
Career):
Model 1: Enrollment Motivator = First Generation Status +
(Controls: Ethnicity + Race + Gender + Institutional Type)
Model 2: Enrollment Motivator = First Generation Status + Other College
+ Prior Study + Years Professional Experience + Pell Grant Eligibility +
Employment Type + (Controls: Ethnicity + Race + Gender + Institutional Type)
Research question three employed both descriptive statistics and multiple linear
regression analysis to investigate if learners’ characteristics are predictors of learners’
satisfaction. Research question three utilized the following models:
Model 1: Satisfaction with decision to enroll = First Generation Status +
(Controls: Ethnicity + Race + Gender + Institutional Type)
Model 2: Satisfaction with decision to enroll = First Generation Status +
Other College + Prior Study + Years Professional Experience + Pell Grant Eligibility
+ Employment Type (Controls: Ethnicity + Race + Gender + Institutional Type)
102
A correlational research design was utilized to investigate whether enrollment
motivators predict learners’ satisfaction with their enrollment decision (research
question four). A multiple linear regression was calculated to predict satisfaction with
decision to enroll based on enrollment motivators (modality, learning goals, professional
goals, social goals, new career). Research question four utilized the following models
for each enrollment motivator:
Model 1: Satisfaction with decision to enroll = Enrollment Motivator
Model 2: Satisfaction with decision to enroll = Enrollment Motivator +
First Generation Status + (Controls: Ethnicity + Race + Gender + Institutional
Type)
Model 3: Satisfaction with decision to enroll = Enrollment Motivator +
First Generation Status + Other College + Prior Study + Years Professional
Experience + Pell Grant Eligibility + Employment Type (Controls: Ethnicity + Race
+ Gender + Institutional Type)
Once each enrollment motivator was investigated individually, all significant
enrollment motivators were combined in a multiple regression utilizing the following
models:
Model 1: Satisfaction with decision to enroll = Significant Enrollment
Motivators
103
Model 2: Satisfaction with decision to enroll = Significant Enrollment
Motivators + First Generation Status + (Controls: Ethnicity + Race + Gender +
Institutional Type)
Model 3: Satisfaction with decision to enroll = Significant Enrollment
Motivators + First Generation Status + Other College + Prior Study + Years
Professional Experience + Pell Grant Eligibility + Employment Type
(Controls: Ethnicity + Race + Gender + Institutional Type)
In exploring research question five, the college choices process, this study
quantified the six open-ended questions included in the original survey utilizing a
quantitative content analysis. All six of these questions were designed to uncover the
process learners took in making their enrollment choice. This quantitative content
analysis applied conceptual analysis to establish what concepts are mentioned and their
frequency (Busch, et al., 2012). The first step in quantitative content analysis was to
determine the code book (Neuendorf, 2017). The code book was developed from the
determining decision factors from Southerland’s (2006) “new model for college choice &
persistence” (p. 14). Manual coding utilized this code book but the flexibility to allow
emergent concepts was incorporated into the coding process. This raises an issue of
reliability by introducing subjectivity, therefore reducing replicability (Busch, et al.,
2012; Neuendorf, 2017). In addition to the manual coding process, the answers were
imported into NVivo to determine word frequencies and create corresponding word art
to increase the validity of the coding. Hoover and Koerber (2011) cite the benefits of
104
utilizing NVivo as contributing to the “efficiency, multiplicity, and transparency” (p.73)
of the analysis of qualitative data. Computer coding utilizing NVivo of word frequencies
was utilized for its ease and effectiveness but also to support ecological validity by
processing the data in the same modality it was collected (Neuendorf, 2017).
Study Reliability and Validity
Validity has many faces – internal, external, and measurement. Gilner et al.
(2017) state internal validity is “the degree to which the researcher can infer that a
relationship between independent and dependent variables is causal” (“Evaluating
Internal Validity,” para.2). For this study, which is associational (meaning there is only
one group of participants), Gilner et al. (2017) state that it will not be able to “provide
evidence of causation no matter how strong the statistical association” (“Equivalence in
Associational Studies,” para.1). Even if the study will not be able to claim direct
causation, the associations between variables hold much information about the study
participants. Threats to internal validity include the inherent bias in having one group of
participants as well as control of extraneous variables. As this is a one-time survey,
threats such as maturation, history, testing, and instrumentation do not apply (Gilner et
al., 2017). An additional threat to internal validity is ambiguous temporal precedence.
Gilner, Morgan, and Leech, (2017) define this as “when it is unclear if the independent
variable precedes the dependent variable” (“Ambiguous Temporal Precedence,” para.2).
For this study, in research question four, it is assumed that the independent variable
105
(enrollment motivators) proceed the dependent variable (satisfaction with decision to
enroll).
External validity concerns the generalizability of the study, or if the measures
and results can be applied outside of the study (Gilner et al., 2017). Population validity
and ecological validity are the two contributing factors to external validity (Gilner et al.,
2017). As the sampling methodology utilized for learner participants in the study was
census and a representative sample, the population validity may be rated medium.
However, the response rates were fairly low, which may downgrade the population
validity. Ecological validity is the “degree to which the research environment is similar
to the natural environment” (Gilner et al., 2017, “Ecological External Validity,” para. 1).
For this study, the natural environment of these competency-based education enrollees
is an online learning environment. As the survey was also administered in an online
survey tool, the study environment is like the natural environment.
Reliability is “the consistency of a series of measurements” (Gilner et al., 2017,
“Reliability,” para. 1). While this measurement is extremely important in instrument
development, this study utilized a secondary data analysis. As the data have already
been collected, performing reliability tests is out of the scope of this study. However,
the instrument validity and reliability were discussed in an earlier section.
106
Summary
In this chapter, I explored the research design, the context for the research, the
variables, and specifications as well as the data analysis.
107
CHAPTER FOUR – RESULTS
Introduction
This study investigates college choice and competency-based education learners’
enrollment motivators. As covered in detail in chapter one, the purpose of the study is
to help the field better understand the characteristics of competency-based education
learners and why they choose to study in this modality. This study employed descriptive
and correlational statistics as well as quantitative content analysis. Utilizing this range
of analysis methods gives a broad view into the data.
Specifically, this chapter provides the data addressing the following research
questions:
1. What are the characteristics of competency-based education learners?
2. Do characteristics of competency-based education learners predict enrollment
motivators?
3. Do characteristics of competency-based education learners predict satisfaction
with their decision to enroll?
4. Do the enrollment motivators predict competency-based education learners’
satisfaction with their decision to enroll?
5. What is the college choice process for competency-based education learners?
108
Analysis
This analysis is arranged by research question to streamline understanding of the
findings. In research question one, the study employed descriptive statistical
techniques to investigate the demographic and work-life related characteristics of
competency-based education enrollees. In research questions two, three, and four a
series of ordinary least squared regression models were used to estimate the
relationships described in each question above. The assumptions for the regression
models were tested utilizing correlation matrices, collinearity statistics, Durbin-Watson
scores, scatterplots of standardized residuals versus standardized predicted values,
Cook’s distance values, and by evaluating skewness & kurtosis of variables. These
analyses indicate that the assumptions for regression were met. A full discussion of the
assumptions can be found in Chapter 3. In research question five, the method utilized is
quantitative content analysis which is “a numerically based summary of a chosen
message set” (Neuendorf, 2017, p. 21). However, to add color to the categories
determined in the analysis, I have included a quote of support directly from the words
of participants.
Characteristics of Competency-based Education Learners
In response to research question 1, descriptive statistics were generated to
determine the composite characteristics across competency-based enrollees. For this
analysis, the two samples from the institutional types described in chapter three were
109
combined represent an overall sample. In chapter three the results of a series of t-tests
are outlined which provide justification for the characteristics of the two groups being
similar enough to analyze as one group. It was important to combine the samples for
greater generalizability. Table 4.1 outlines the descriptive statistics including N,
percentage of respondents, mean, standard deviation and range for each of the
characteristics as appropriate to the level of measurement.
The overall sample of 346 learners had a mean age of 38.78 and a range of 18-
70. The range is important as it shows competency-based education learners do not fit
only in the popular conception of a college student as the traditional aged student (18-
24) but rather encompass a much broader range of learner. To further support this, in
the age category breakdown, you can see the traditional age (18-24) is the smallest
group (9.5%) while the largest group of learners are 40-49 year olds (30.6). Closely
related to age are both the number of years since the learner last attended high school
and the number of years since the learner started college. The largest group for each of
these categories is 11-20 years ago with years from high school at 32.4% and years from
college start at 37.0%. When looking at the next largest percentage in each of these
categories, they diverge with years from high school increasing to 20.72 – 30 years
(31.2%) while years from college start decreases to 0-10 years (31.2%). These data
suggest that divergence as indication that more learners delayed their college start than
started right out of high school and returned later.
110
The overall sample of 346 learners had a mean paid work hours of 38 hours per
week, with a range between 0 – 168. This range may look surprising because some
learners reported they worked every hour possible in a week. However, in their
responses many of these learners indicated that they were stay-at-home parents
therefore were ‘on the clock’ 24/7. While perhaps not the intent of the question, the
learners’ response is their interpretation of ‘paid work.’ In the categories of work hours,
the majority of learners (54.6%) work between 31 – 40 hours a week, followed by those
who work 41-50 hours a week (21.4%), leading to the conclusion that the majority of the
learners work full time. This is consistent with the variable which asked learners to
categorize their employment status. 71.4% indicated they work full time. Only 7.2% of
learners in the sample reported working part time, which is close to the 13.6% who
indicated they work 0-20 hours a week in the paid work hours category. It is also
interesting to note that 5.8% of these learners indicated they are unemployed and not
looking for work.
These learners indicate they have worked between 0-10 years (64.7%) in their
current field of study with mean years worked being 9.63 with a range of 0-43. The
percentage of learners in each category of years of professional experience decreases as
the years increase with only 3.8% of learners indicating they have 31-43 years of
professional experience.
The majority of the respondents were female (70.2%). The majority of the
respondents were also white (84.4%), with the next largest categories of race being two
111
or more races (5.8%) and black (5.8%). The combined category of Asian/Native
Hawaiian/Other Pacific Islander was 2.3% while the American Indian/Alaska
Native/Other was the smallest racial category at 1.7%. The majority of these learners
were Non-Hispanic (89.6%) however, 8.7% claim Hispanic ethnicity and 1.7% of learners
are of unknown ethnicity.
The majority of these 346 learners do not live in the same location as their
institution (68.5%). This has implications related to prior literature which will be
discussed in chapter five. These learners were nearly evenly split on first generation to
attend college status with 51.2% reporting they are not first-generation college students
and 48.8% reporting they are the first in their family to attend college.
An overwhelming majority of these 346 learners indicated they have studied at a
prior college (95.7%), while only 61% indicated they have previously studied in their
current discipline. This is interesting because it indicates that those who return to
college may change discipline at a fairly high rate.
The majority of these learners are married (66.2%) while just 20.5% are single
and 13.3% categorize themselves as separated/divorced/widowed. The overall sample
of 346 learners had a close split on those who are eligible for a Pell grant (48.8%) and
those who are not (43.1%). Those who indicated they do not know if they are eligible to
receive a Pell grant (8.1%) are interesting to consider as completing the Free Application
for Federal Student Aid (FAFSA) would provide this information so either these students
have never completed one or never paid attention to their Pell grant eligibility.
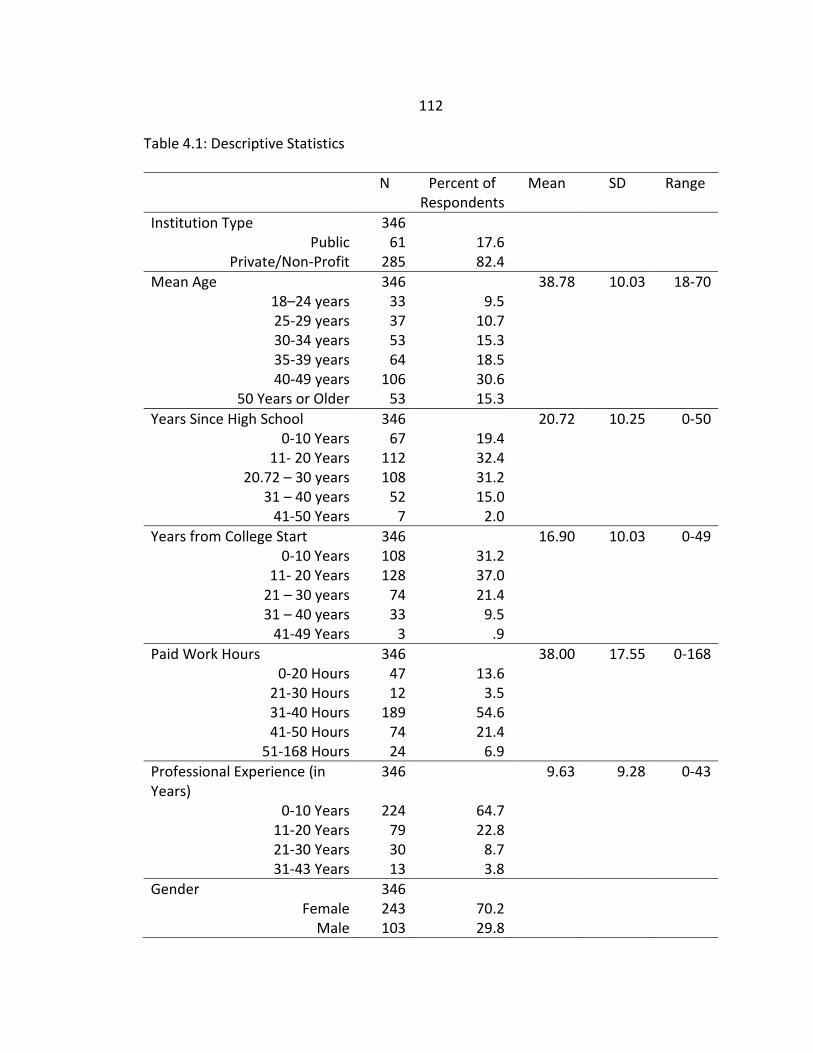
112
Table 4.1: Descriptive Statistics
N Percent of Respondents
Mean SD Range
Institution Type 346 Public 61 17.6
Private/Non-Profit 285 82.4 Mean Age 346 38.78 10.03 18-70
18–24 years 33 9.5 25-29 years 37 10.7 30-34 years 53 15.3 35-39 years 64 18.5 40-49 years 106 30.6
50 Years or Older 53 15.3 Years Since High School 346 20.72 10.25 0-50
0-10 Years 67 19.4 11- 20 Years 112 32.4
20.72 – 30 years 108 31.2 31 – 40 years 52 15.0
41-50 Years 7 2.0 Years from College Start 346 16.90 10.03 0-49
0-10 Years 108 31.2 11- 20 Years 128 37.0
21 – 30 years 74 21.4 31 – 40 years 33 9.5
41-49 Years 3 .9 Paid Work Hours 346 38.00 17.55 0-168
0-20 Hours 47 13.6 21-30 Hours 12 3.5 31-40 Hours 189 54.6 41-50 Hours 74 21.4
51-168 Hours 24 6.9 Professional Experience (in Years)
346 9.63 9.28 0-43
0-10 Years 224 64.7 11-20 Years 79 22.8 21-30 Years 30 8.7 31-43 Years 13 3.8
Gender 346 Female 243 70.2
Male 103 29.8
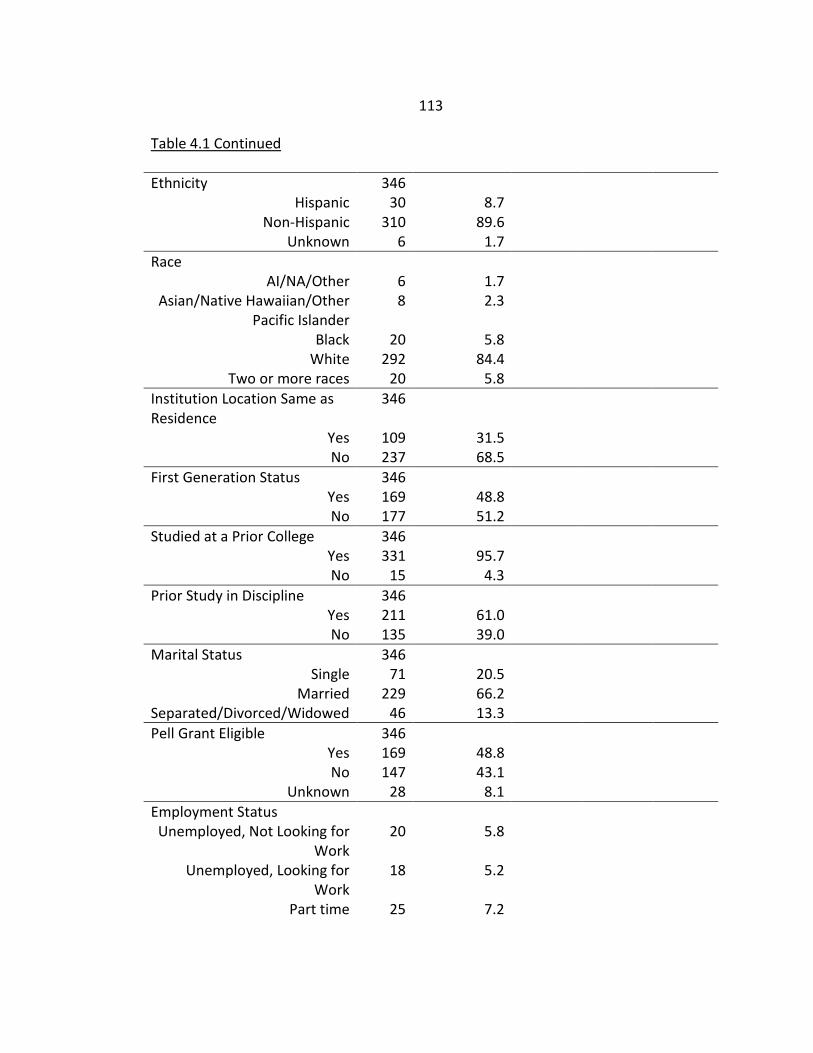
113
Table 4.1 Continued
Ethnicity 346 Hispanic 30 8.7
Non-Hispanic 310 89.6 Unknown 6 1.7
Race AI/NA/Other 6 1.7
Asian/Native Hawaiian/Other Pacific Islander
8 2.3
Black 20 5.8 White 292 84.4
Two or more races 20 5.8 Institution Location Same as Residence
346
Yes 109 31.5 No 237 68.5
First Generation Status 346 Yes 169 48.8 No 177 51.2
Studied at a Prior College 346 Yes 331 95.7 No 15 4.3
Prior Study in Discipline 346 Yes 211 61.0 No 135 39.0
Marital Status 346 Single 71 20.5
Married 229 66.2 Separated/Divorced/Widowed 46 13.3 Pell Grant Eligible 346
Yes 169 48.8 No 147 43.1
Unknown 28 8.1 Employment Status Unemployed, Not Looking for
Work 20 5.8
Unemployed, Looking for Work
18 5.2
Part time 25 7.2
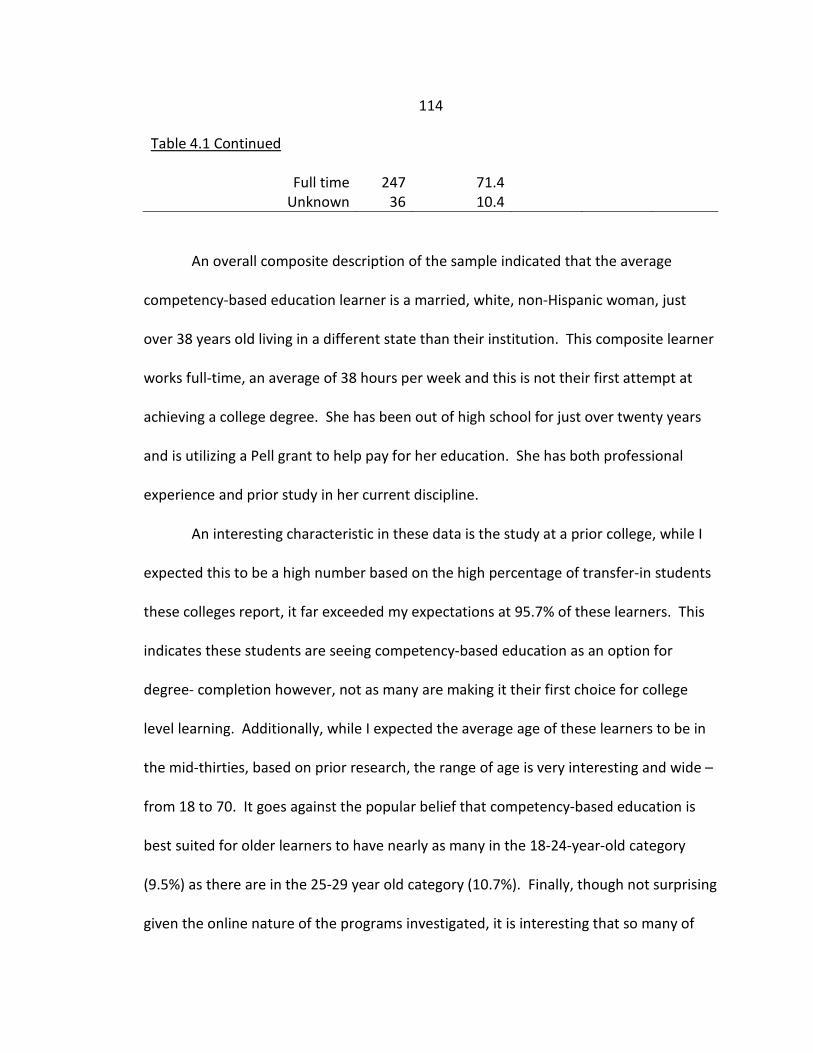
114
Table 4.1 Continued
Full time 247 71.4 Unknown 36 10.4
An overall composite description of the sample indicated that the average
competency-based education learner is a married, white, non-Hispanic woman, just
over 38 years old living in a different state than their institution. This composite learner
works full-time, an average of 38 hours per week and this is not their first attempt at
achieving a college degree. She has been out of high school for just over twenty years
and is utilizing a Pell grant to help pay for her education. She has both professional
experience and prior study in her current discipline.
An interesting characteristic in these data is the study at a prior college, while I
expected this to be a high number based on the high percentage of transfer-in students
these colleges report, it far exceeded my expectations at 95.7% of these learners. This
indicates these students are seeing competency-based education as an option for
degree- completion however, not as many are making it their first choice for college
level learning. Additionally, while I expected the average age of these learners to be in
the mid-thirties, based on prior research, the range of age is very interesting and wide –
from 18 to 70. It goes against the popular belief that competency-based education is
best suited for older learners to have nearly as many in the 18-24-year-old category
(9.5%) as there are in the 25-29 year old category (10.7%). Finally, though not surprising
given the online nature of the programs investigated, it is interesting that so many of
115
these learners do not live in the same location as their institution (68.5%) as prior
literature indicates that location is a determining factor, even for non-traditional
students.
Learners’ Characteristics Predict Enrollment Motivators
Question two asks if learners’ characteristics predict enrollment motivators.
These analyses used a total of ten models - two for each of the enrollment motivators –
to investigate the relationships between learners’ characteristics and enrollment
motivators. A full explanation of the models can be found in chapter three. Each
enrollment motivator was explored separately to avoid over specificity of the model and
to allow practitioners to develop techniques based on the motivator. While this does
increase the possibility for type I error, it is important for practice.
To increase understanding of the enrollment motivators (dependent variables),
descriptive statistics can be found in Table 4.2.
Table 4.2: Descriptive Statistics of Enrollment Motivators (Dependent Variables)
Enrollment Motivator N Mean SD Range Modality 346 4.16 .67 1.67-5
Learning Goals 346 4.41 .60 1-5 New Career 346 3.23 1.32 1-5
Professional Goals 346 4.36 .73 1-5 Social Goals 346 4.15 .73 1-5
Modality. The modality enrollment motivator is related to the learners’
preference to learn in an online or face-to-face environment. The results of the
116
regression for model 1 were not significant (R2= .037, F(9,336)= 1.421, p=.178). However,
the results indicate that Blacks are less likely to be motivated by modality than are
whites (β=-.361, p=.020). The results of the regression for model 2 were not significant
(R2= .044, F(18,327)= .829, p=.665). Again, the results indicate that Blacks are less likely
to be motivated by modality than are whites (β=-.340, p=.033).
Learning Goals. The learning goals motivator relates to a learners’ desire to
become more knowledgeable both in general and in their specific area of study. The
results of the regression for model 1 were not significant (R2= .014, F(9,336)= .517,
p=.862). The results of the regression for model 2 were not significant (R2= .023,
F(18,327)= .436, p=.980). There were no variables which showed a significant
contribution to the learning goals enrollment motivator in either model.
New Career. The new career motivator is a learners’ wish to try a new career.
The results of the regression for model 1 were significant (R2= .051, F(9,336)= 2.025,
p=.036) and one variable was said to explain 5.1% of the new career enrollment
motivator. Asian/Native Hawaiian/Other Pacific Islanders were more likely to be
motivated by new career than were whites (β= 1.091, p=.020). The results of the
regression for model 2 were significant (R2= .188, F(18,327)= 4.201, p=.000) and three
variables were said to explain 18.8% of the new career enrollment motivator.
Asian/Native Hawaiian/Other Pacific Islanders were more likely to be motivated by new
career than were whites (β= .931, p=.040) Those without prior study in the subject area
117
are more likely be motivated by new career than those with prior study in the subject
area (β= .380, p=.007). Years of professional experience (β= -.451, p=.000) has a
negative effect on the new career motivator.
Professional Goals. The professional goals motivator focuses on advancing
learners’ current career, being more marketable to future employers, and increasing
their job security. The results of the regression for model 1 were not significant (R2=
.026, F(9,336)= 1.101, p=.439). There were no variables which showed a significant
contribution to the professional goals enrollment motivator. The results of the
regression for model 2 were significant (R2= .109, F(18,327)= 2.214, p=.003) and one
variable (employment status) explains 10.9% of the professional goals enrollment
motivator. Those learners who are unemployed and not looking for work (β= -.672,
p=.000), unemployed and looking for work (β= -.396, p=.028), and those whose
employment status is unknown (β= -.320, p=.015) were less likely to be motivated by
professional goals than were those who are employed full time.
Social Goals. The social goals motivator relates to learners’ inclination to make a
difference in society and to encourage their friends and family in educational pursuits by
being an example. The results of the regression for model 1 were significant (R2= .089,
F(9,336)= 3.658, p=.000) and three variables were said to explain 8.9% of the social goals
enrollment motivator. Hispanics were more likely to be motivated by social goals than
were Non-Hispanics (β= .401, p=.004). Females are more likely to be motivated by
118
social goals than males (β= .259, p=.002). Additionally, those learners enrolled in a
private/non-profit institution are more likely to be motivated by social goals than are
those learners enrolled in a public institution (β= .302, p=.003). The results of the
regression for model 2 were significant (R2= .139, F(18,327)= 2.927, p=.000) and five
variables were said to explain 13.9% of the social goals enrollment motivator. Hispanics
were more likely to be motivated by social goals than were Non-Hispanics (β= .400,
p=.004). Females are more likely to be motivated by social goals than males (β= .240,
p=.005). Additionally, those learners enrolled in a private/non-profit institution are
more likely to be motivated by social goals than are those learners enrolled in a public
institution (β= .279, p=.007). Years of professional experience (β= -.107, p=.034) has a
negative effect on the social goals motivator. Additionally, those who are not eligible
for a Pell Grant are less likely to be motivated by social goals than are those who are
eligible for a Pell Grant (β= -.227, p=.007).
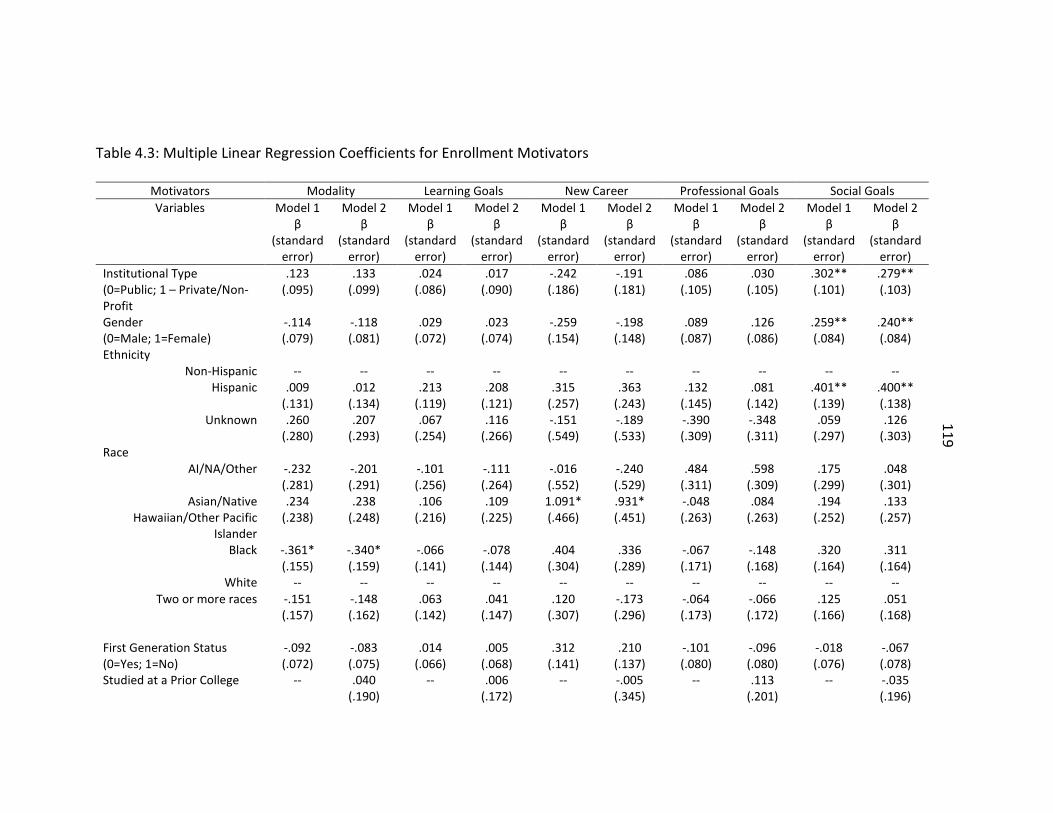
119
Table 4.3: Multiple Linear Regression Coefficients for Enrollment Motivators
Motivators Modality Learning Goals New Career Professional Goals Social Goals Variables Model 1
β (standard
error)
Model 2 β
(standard error)
Model 1 β
(standard error)
Model 2 β
(standard error)
Model 1 β
(standard error)
Model 2 β
(standard error)
Model 1 β
(standard error)
Model 2 β
(standard error)
Model 1 β
(standard error)
Model 2 β
(standard error)
Institutional Type (0=Public; 1 – Private/Non-Profit
.123 (.095)
.133 (.099)
.024 (.086)
.017 (.090)
-.242 (.186)
-.191 (.181)
.086 (.105)
.030 (.105)
.302** (.101)
.279** (.103)
Gender (0=Male; 1=Female)
-.114 (.079)
-.118 (.081)
.029 (.072)
.023 (.074)
-.259 (.154)
-.198 (.148)
.089 (.087)
.126 (.086)
.259** (.084)
.240** (.084)
Ethnicity Non-Hispanic -- -- -- -- -- -- -- -- -- --
Hispanic .009 (.131)
.012 (.134)
.213 (.119)
.208 (.121)
.315 (.257)
.363 (.243)
.132 (.145)
.081 (.142)
.401** (.139)
.400** (.138)
Unknown .260 (.280)
.207 (.293)
.067 (.254)
.116 (.266)
-.151 (.549)
-.189 (.533)
-.390 (.309)
-.348 (.311)
.059 (.297)
.126 (.303)
Race AI/NA/Other -.232
(.281) -.201 (.291)
-.101 (.256)
-.111 (.264)
-.016 (.552)
-.240 (.529)
.484 (.311)
.598 (.309)
.175 (.299)
.048 (.301)
Asian/Native Hawaiian/Other Pacific
Islander
.234 (.238)
.238 (.248)
.106 (.216)
.109 (.225)
1.091* (.466)
.931* (.451)
-.048 (.263)
.084 (.263)
.194 (.252)
.133 (.257)
Black -.361* (.155)
-.340* (.159)
-.066 (.141)
-.078 (.144)
.404 (.304)
.336 (.289)
-.067 (.171)
-.148 (.168)
.320 (.164)
.311 (.164)
White -- -- -- -- -- -- -- -- -- -- Two or more races -.151
(.157) -.148 (.162)
.063 (.142)
.041 (.147)
.120 (.307)
-.173 (.296)
-.064 (.173)
-.066 (.172)
.125 (.166)
.051 (.168)
First Generation Status (0=Yes; 1=No)
-.092 (.072)
-.083 (.075)
.014 (.066)
.005 (.068)
.312 (.141)
.210 (.137)
-.101 (.080)
-.096 (.080)
-.018 (.076)
-.067 (.078)
Studied at a Prior College -- .040 (.190)
-- .006 (.172)
-- -.005 (.345)
-- .113 (.201)
-- -.035 (.196)
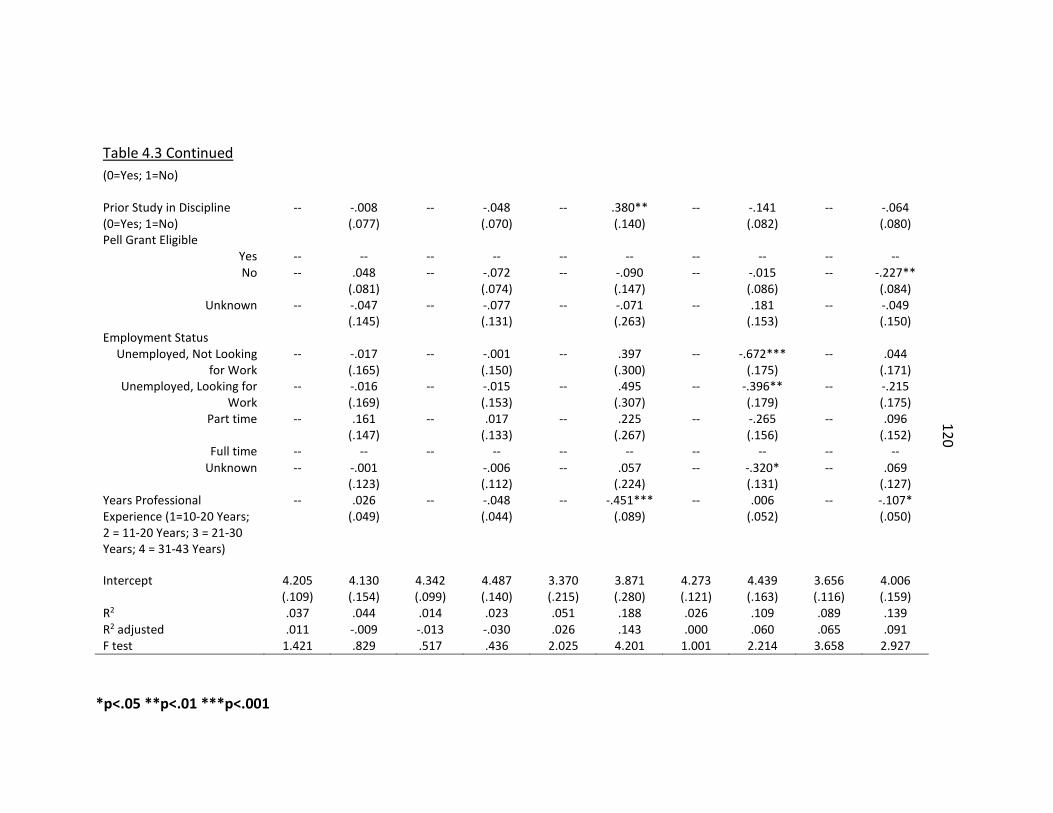
120
*p<.05 **p<.01 ***p<.001
Table 4.3 Continued (0=Yes; 1=No)
Prior Study in Discipline (0=Yes; 1=No)
-- -.008 (.077)
-- -.048 (.070)
-- .380** (.140)
-- -.141 (.082)
-- -.064 (.080)
Pell Grant Eligible Yes -- -- -- -- -- -- -- -- -- -- No -- .048
(.081) -- -.072
(.074) -- -.090
(.147) -- -.015
(.086) -- -.227**
(.084) Unknown -- -.047
(.145) -- -.077
(.131) -- -.071
(.263) -- .181
(.153) -- -.049
(.150) Employment Status
Unemployed, Not Looking for Work
-- -.017 (.165)
-- -.001 (.150)
-- .397 (.300)
-- -.672*** (.175)
-- .044 (.171)
Unemployed, Looking for Work
-- -.016 (.169)
-- -.015 (.153)
-- .495 (.307)
-- -.396** (.179)
-- -.215 (.175)
Part time -- .161 (.147)
-- .017 (.133)
-- .225 (.267)
-- -.265 (.156)
-- .096 (.152)
Full time -- -- -- -- -- -- -- -- -- -- Unknown -- -.001
(.123) -.006
(.112) -- .057
(.224) -- -.320*
(.131) -- .069
(.127) Years Professional Experience (1=10-20 Years; 2 = 11-20 Years; 3 = 21-30 Years; 4 = 31-43 Years)
-- .026 (.049)
-- -.048 (.044)
-- -.451*** (.089)
-- .006 (.052)
-- -.107* (.050)
Intercept 4.205 (.109)
4.130 (.154)
4.342 (.099)
4.487 (.140)
3.370 (.215)
3.871 (.280)
4.273 (.121)
4.439 (.163)
3.656 (.116)
4.006 (.159)
R2 .037 .044 .014 .023 .051 .188 .026 .109 .089 .139 R2 adjusted .011 -.009 -.013 -.030 .026 .143 .000 .060 .065 .091 F test 1.421 .829 .517 .436 2.025 4.201 1.001 2.214 3.658 2.927
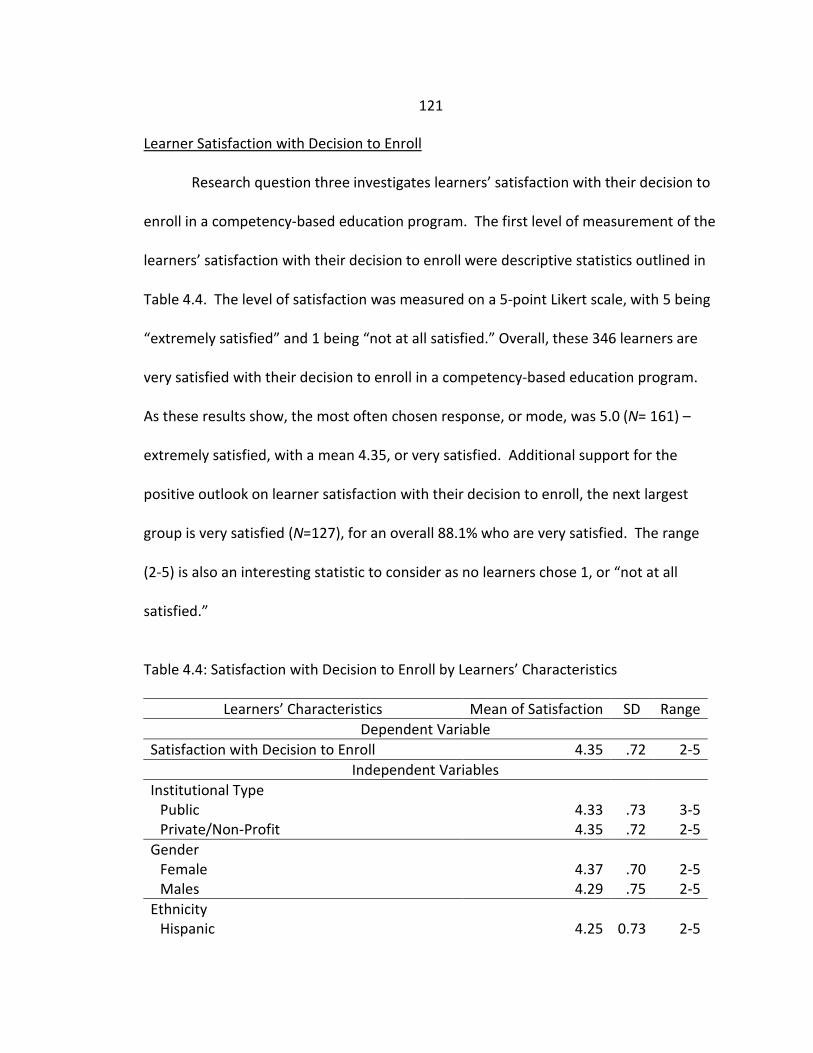
121
Learner Satisfaction with Decision to Enroll
Research question three investigates learners’ satisfaction with their decision to
enroll in a competency-based education program. The first level of measurement of the
learners’ satisfaction with their decision to enroll were descriptive statistics outlined in
Table 4.4. The level of satisfaction was measured on a 5-point Likert scale, with 5 being
“extremely satisfied” and 1 being “not at all satisfied.” Overall, these 346 learners are
very satisfied with their decision to enroll in a competency-based education program.
As these results show, the most often chosen response, or mode, was 5.0 (N= 161) –
extremely satisfied, with a mean 4.35, or very satisfied. Additional support for the
positive outlook on learner satisfaction with their decision to enroll, the next largest
group is very satisfied (N=127), for an overall 88.1% who are very satisfied. The range
(2-5) is also an interesting statistic to consider as no learners chose 1, or “not at all
satisfied.”
Table 4.4: Satisfaction with Decision to Enroll by Learners’ Characteristics
Learners’ Characteristics Mean of Satisfaction SD Range Dependent Variable
Satisfaction with Decision to Enroll 4.35 .72 2-5 Independent Variables
Institutional Type Public 4.33 .73 3-5 Private/Non-Profit 4.35 .72 2-5
Gender Female 4.37 .70 2-5 Males 4.29 .75 2-5
Ethnicity Hispanic 4.25 0.73 2-5
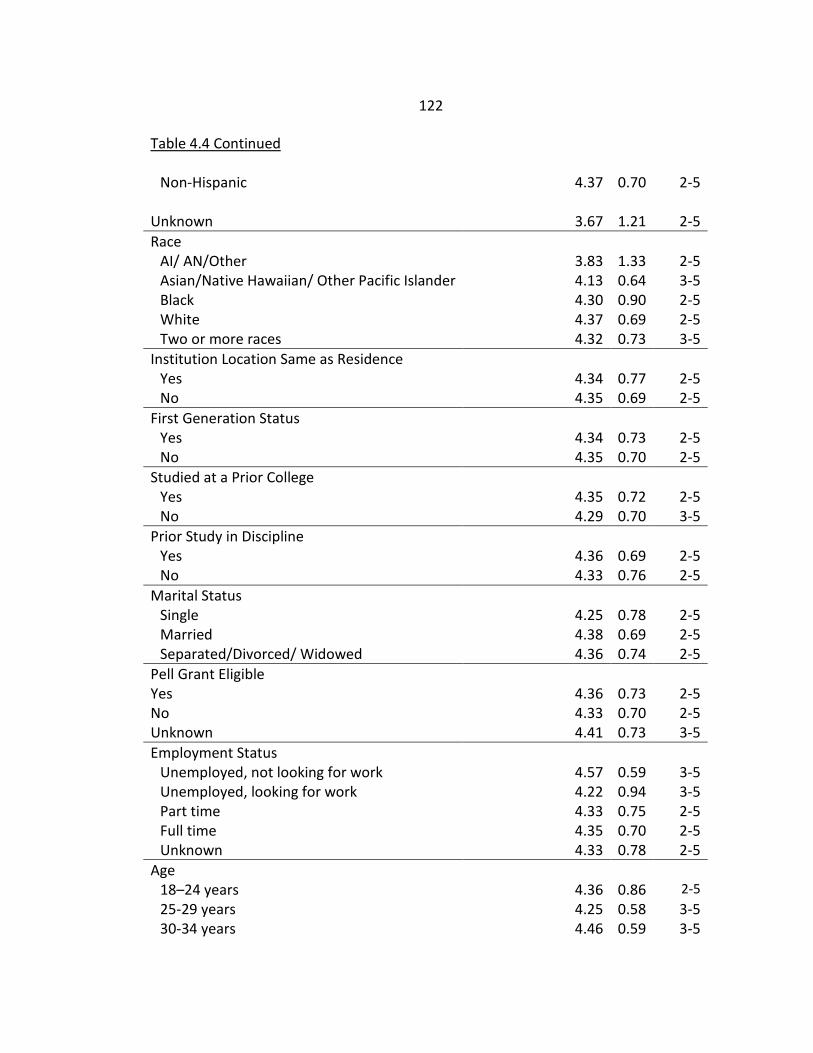
122
Table 4.4 Continued Non-Hispanic 4.37 0.70 2-5
Unknown 3.67 1.21 2-5 Race
AI/ AN/Other 3.83 1.33 2-5 Asian/Native Hawaiian/ Other Pacific Islander 4.13 0.64 3-5 Black 4.30 0.90 2-5 White 4.37 0.69 2-5 Two or more races 4.32 0.73 3-5
Institution Location Same as Residence Yes 4.34 0.77 2-5 No 4.35 0.69 2-5
First Generation Status Yes 4.34 0.73 2-5 No 4.35 0.70 2-5
Studied at a Prior College Yes 4.35 0.72 2-5 No 4.29 0.70 3-5
Prior Study in Discipline Yes 4.36 0.69 2-5 No 4.33 0.76 2-5
Marital Status Single 4.25 0.78 2-5 Married 4.38 0.69 2-5 Separated/Divorced/ Widowed 4.36 0.74 2-5
Pell Grant Eligible Yes 4.36 0.73 2-5 No 4.33 0.70 2-5 Unknown 4.41 0.73 3-5 Employment Status
Unemployed, not looking for work 4.57 0.59 3-5 Unemployed, looking for work 4.22 0.94 3-5 Part time 4.33 0.75 2-5 Full time 4.35 0.70 2-5 Unknown 4.33 0.78 2-5
Age 18–24 years 4.36 0.86 2-5 25-29 years 4.25 0.58 3-5 30-34 years 4.46 0.59 3-5
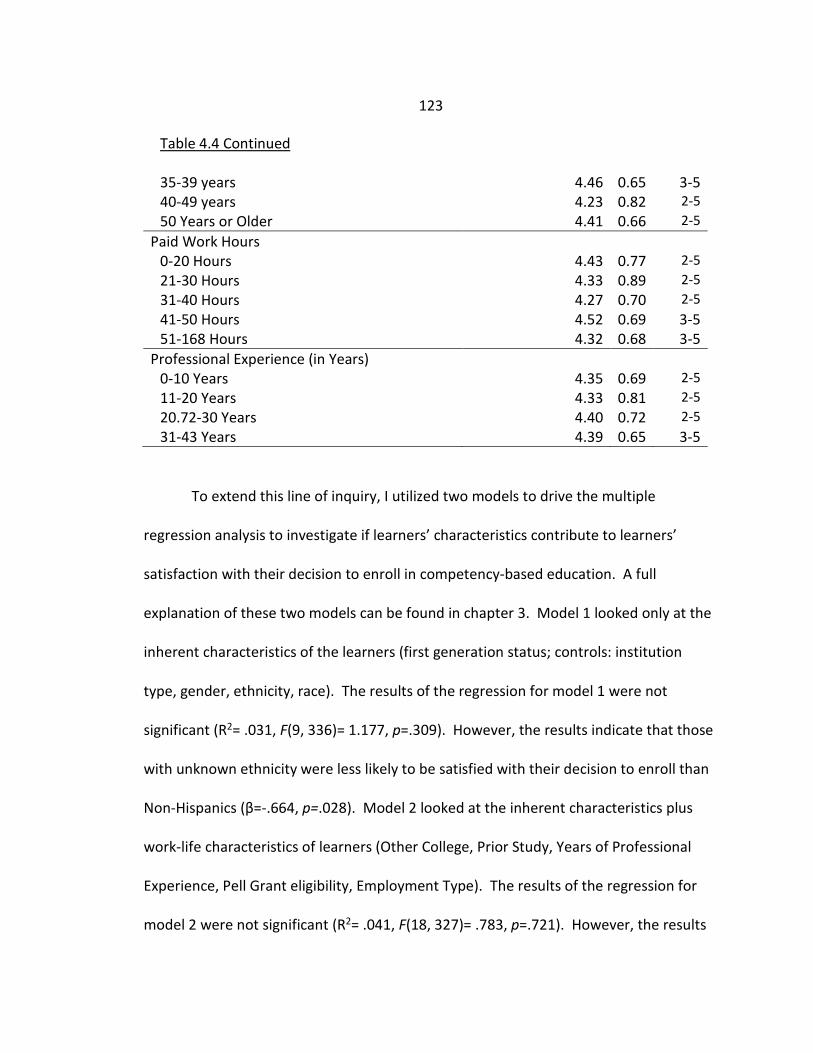
123
Table 4.4 Continued 35-39 years 4.46 0.65 3-5 40-49 years 4.23 0.82 2-5 50 Years or Older 4.41 0.66 2-5
Paid Work Hours 0-20 Hours 4.43 0.77 2-5 21-30 Hours 4.33 0.89 2-5 31-40 Hours 4.27 0.70 2-5 41-50 Hours 4.52 0.69 3-5 51-168 Hours 4.32 0.68 3-5
Professional Experience (in Years) 0-10 Years 4.35 0.69 2-5 11-20 Years 4.33 0.81 2-5 20.72-30 Years 4.40 0.72 2-5 31-43 Years 4.39 0.65 3-5
To extend this line of inquiry, I utilized two models to drive the multiple
regression analysis to investigate if learners’ characteristics contribute to learners’
satisfaction with their decision to enroll in competency-based education. A full
explanation of these two models can be found in chapter 3. Model 1 looked only at the
inherent characteristics of the learners (first generation status; controls: institution
type, gender, ethnicity, race). The results of the regression for model 1 were not
significant (R2= .031, F(9, 336)= 1.177, p=.309). However, the results indicate that those
with unknown ethnicity were less likely to be satisfied with their decision to enroll than
Non-Hispanics (β=-.664, p=.028). Model 2 looked at the inherent characteristics plus
work-life characteristics of learners (Other College, Prior Study, Years of Professional
Experience, Pell Grant eligibility, Employment Type). The results of the regression for
model 2 were not significant (R2= .041, F(18, 327)= .783, p=.721). However, the results
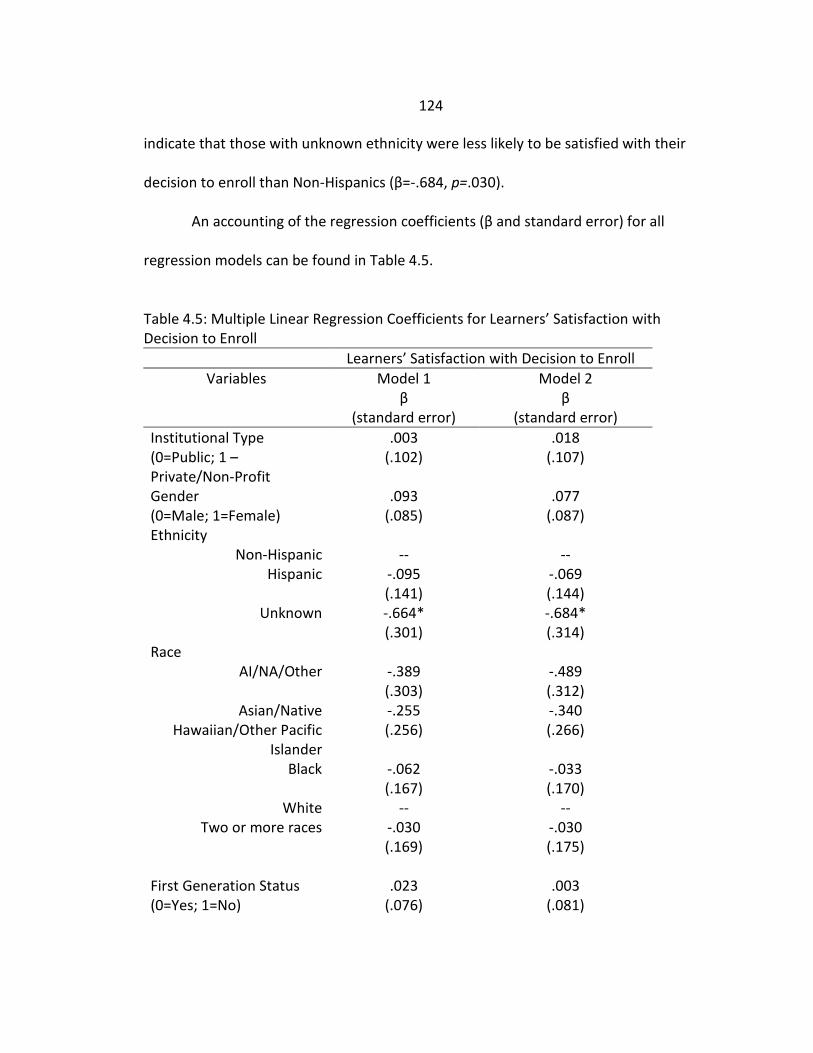
124
indicate that those with unknown ethnicity were less likely to be satisfied with their
decision to enroll than Non-Hispanics (β=-.684, p=.030).
An accounting of the regression coefficients (β and standard error) for all
regression models can be found in Table 4.5.
Table 4.5: Multiple Linear Regression Coefficients for Learners’ Satisfaction with Decision to Enroll
Learners’ Satisfaction with Decision to Enroll Variables Model 1
β (standard error)
Model 2 β
(standard error) Institutional Type (0=Public; 1 – Private/Non-Profit
.003 (.102)
.018 (.107)
Gender (0=Male; 1=Female)
.093 (.085)
.077 (.087)
Ethnicity Non-Hispanic -- --
Hispanic -.095 (.141)
-.069 (.144)
Unknown -.664* (.301)
-.684* (.314)
Race AI/NA/Other -.389
(.303) -.489 (.312)
Asian/Native Hawaiian/Other Pacific
Islander
-.255 (.256)
-.340 (.266)
Black -.062 (.167)
-.033 (.170)
White -- -- Two or more races -.030
(.169) -.030 (.175)
First Generation Status (0=Yes; 1=No)
.023 (.076)
.003 (.081)
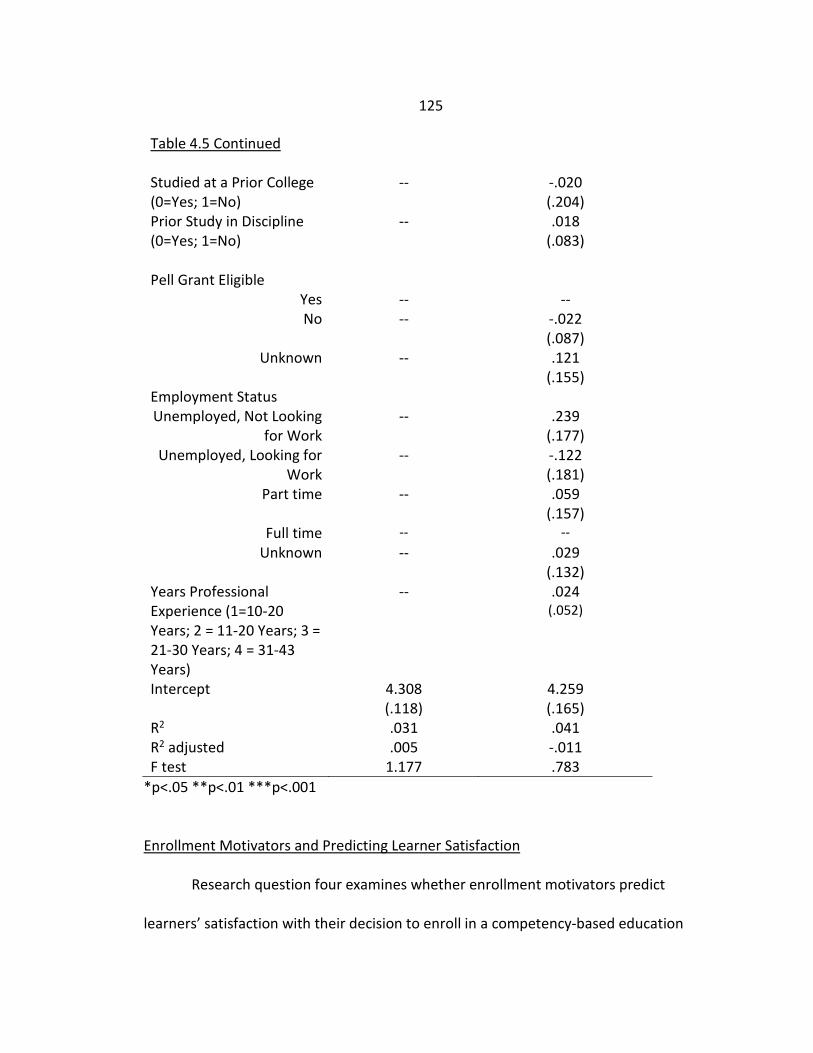
125
Table 4.5 Continued Studied at a Prior College (0=Yes; 1=No)
-- -.020 (.204)
Prior Study in Discipline (0=Yes; 1=No)
-- .018 (.083)
Pell Grant Eligible
Yes -- -- No -- -.022
(.087) Unknown -- .121
(.155) Employment Status Unemployed, Not Looking
for Work -- .239
(.177) Unemployed, Looking for
Work -- -.122
(.181) Part time -- .059
(.157) Full time -- --
Unknown -- .029 (.132)
Years Professional Experience (1=10-20 Years; 2 = 11-20 Years; 3 = 21-30 Years; 4 = 31-43 Years)
-- .024 (.052)
Intercept 4.308 (.118)
4.259 (.165)
R2 .031 .041 R2 adjusted .005 -.011 F test 1.177 .783
*p<.05 **p<.01 ***p<.001
Enrollment Motivators and Predicting Learner Satisfaction
Research question four examines whether enrollment motivators predict
learners’ satisfaction with their decision to enroll in a competency-based education
126
program. These analyses utilized three regression models which were each applied to
the enrollment motivators to investigate the effect of each enrollment motivator on
learners’ satisfaction individually. Additionally, all significant enrollment motivators
were run through the three models together. A full explanation of the models can be
found in chapter 3.
Modality. The results of the regression for model 1 indicated one predictor
explained 4.4% of the variance (R2= .044, F(1, 344)= 15.985, p=.000). It was found that
the modality enrollment motivator significantly predicted, with a positive effect,
learners’ satisfaction with their decision to enroll (β=.226, p=.000). The results of the
regression for model 2 indicated two predictors explained 8.0% of the variance (R2=
.080, F(10, 335)= 2.899, p=.002). The results point to modality (β=.242, p=.000) having a
positive effect while those whose ethnicity in unknown maintain a negative effect as
compared with Non-Hispanics (β=-.728, p=.014) on learners’ satisfaction. The results of
the regression for model 3 indicated two predictors explained 9.1% of the variance (R2=
.091, F(19, 326)= 1.722, p=.031). The results point to modality (β=.245, p=.000) having a
positive effect while those whose ethnicity in unknown maintains a negative effect as
compared with Non-Hispanics (β=-.735, p=.017) on learners’ satisfaction.
Learning Goals. The results of the regression for model 1 indicated one predictor
explained 7.3% of the variance (R2= .073, F(1, 344)= 26.962, p=.000). It was found that
the learning goals enrollment motivator significantly predicted, with a positive effect,
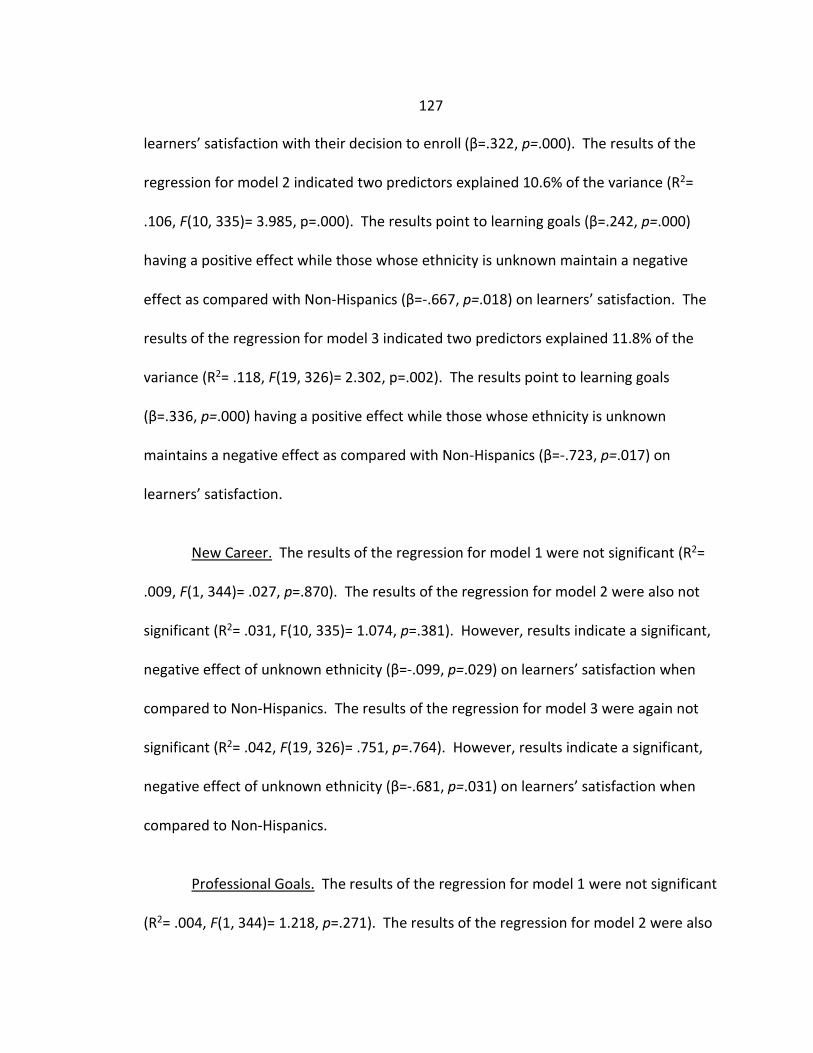
127
learners’ satisfaction with their decision to enroll (β=.322, p=.000). The results of the
regression for model 2 indicated two predictors explained 10.6% of the variance (R2=
.106, F(10, 335)= 3.985, p=.000). The results point to learning goals (β=.242, p=.000)
having a positive effect while those whose ethnicity is unknown maintain a negative
effect as compared with Non-Hispanics (β=-.667, p=.018) on learners’ satisfaction. The
results of the regression for model 3 indicated two predictors explained 11.8% of the
variance (R2= .118, F(19, 326)= 2.302, p=.002). The results point to learning goals
(β=.336, p=.000) having a positive effect while those whose ethnicity is unknown
maintains a negative effect as compared with Non-Hispanics (β=-.723, p=.017) on
learners’ satisfaction.
New Career. The results of the regression for model 1 were not significant (R2=
.009, F(1, 344)= .027, p=.870). The results of the regression for model 2 were also not
significant (R2= .031, F(10, 335)= 1.074, p=.381). However, results indicate a significant,
negative effect of unknown ethnicity (β=-.099, p=.029) on learners’ satisfaction when
compared to Non-Hispanics. The results of the regression for model 3 were again not
significant (R2= .042, F(19, 326)= .751, p=.764). However, results indicate a significant,
negative effect of unknown ethnicity (β=-.681, p=.031) on learners’ satisfaction when
compared to Non-Hispanics.
Professional Goals. The results of the regression for model 1 were not significant
(R2= .004, F(1, 344)= 1.218, p=.271). The results of the regression for model 2 were also
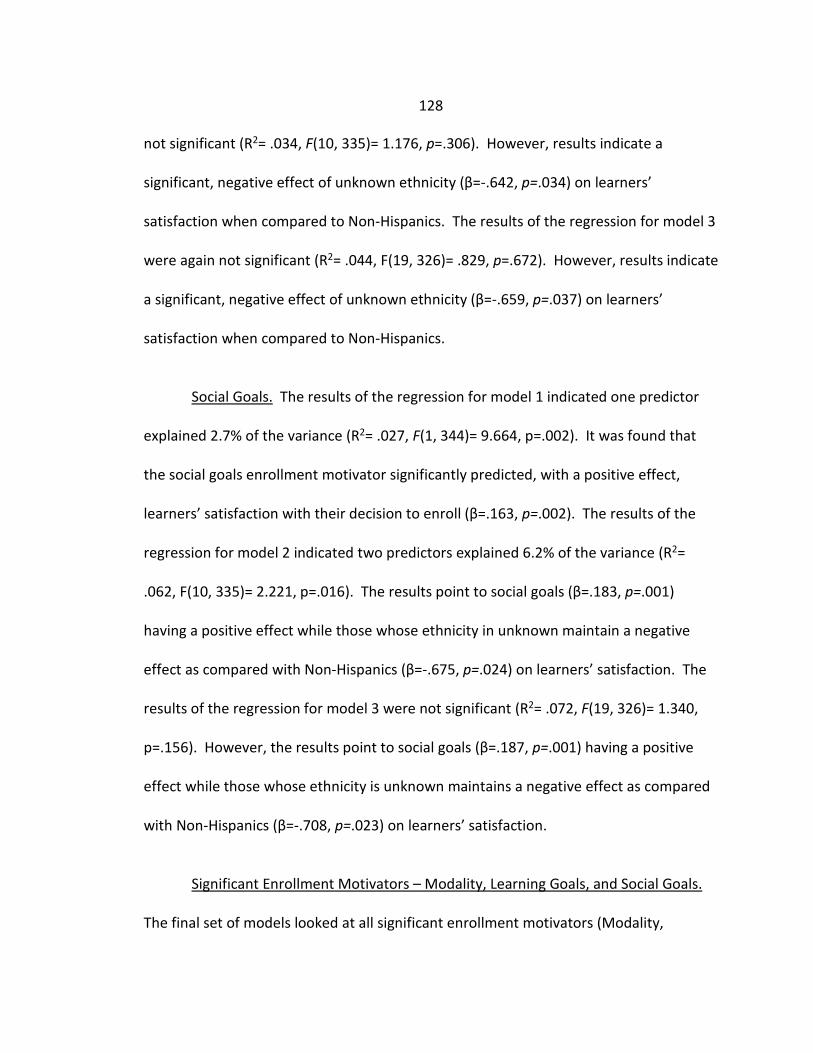
128
not significant (R2= .034, F(10, 335)= 1.176, p=.306). However, results indicate a
significant, negative effect of unknown ethnicity (β=-.642, p=.034) on learners’
satisfaction when compared to Non-Hispanics. The results of the regression for model 3
were again not significant (R2= .044, F(19, 326)= .829, p=.672). However, results indicate
a significant, negative effect of unknown ethnicity (β=-.659, p=.037) on learners’
satisfaction when compared to Non-Hispanics.
Social Goals. The results of the regression for model 1 indicated one predictor
explained 2.7% of the variance (R2= .027, F(1, 344)= 9.664, p=.002). It was found that
the social goals enrollment motivator significantly predicted, with a positive effect,
learners’ satisfaction with their decision to enroll (β=.163, p=.002). The results of the
regression for model 2 indicated two predictors explained 6.2% of the variance (R2=
.062, F(10, 335)= 2.221, p=.016). The results point to social goals (β=.183, p=.001)
having a positive effect while those whose ethnicity in unknown maintain a negative
effect as compared with Non-Hispanics (β=-.675, p=.024) on learners’ satisfaction. The
results of the regression for model 3 were not significant (R2= .072, F(19, 326)= 1.340,
p=.156). However, the results point to social goals (β=.187, p=.001) having a positive
effect while those whose ethnicity is unknown maintains a negative effect as compared
with Non-Hispanics (β=-.708, p=.023) on learners’ satisfaction.
Significant Enrollment Motivators – Modality, Learning Goals, and Social Goals.
The final set of models looked at all significant enrollment motivators (Modality,
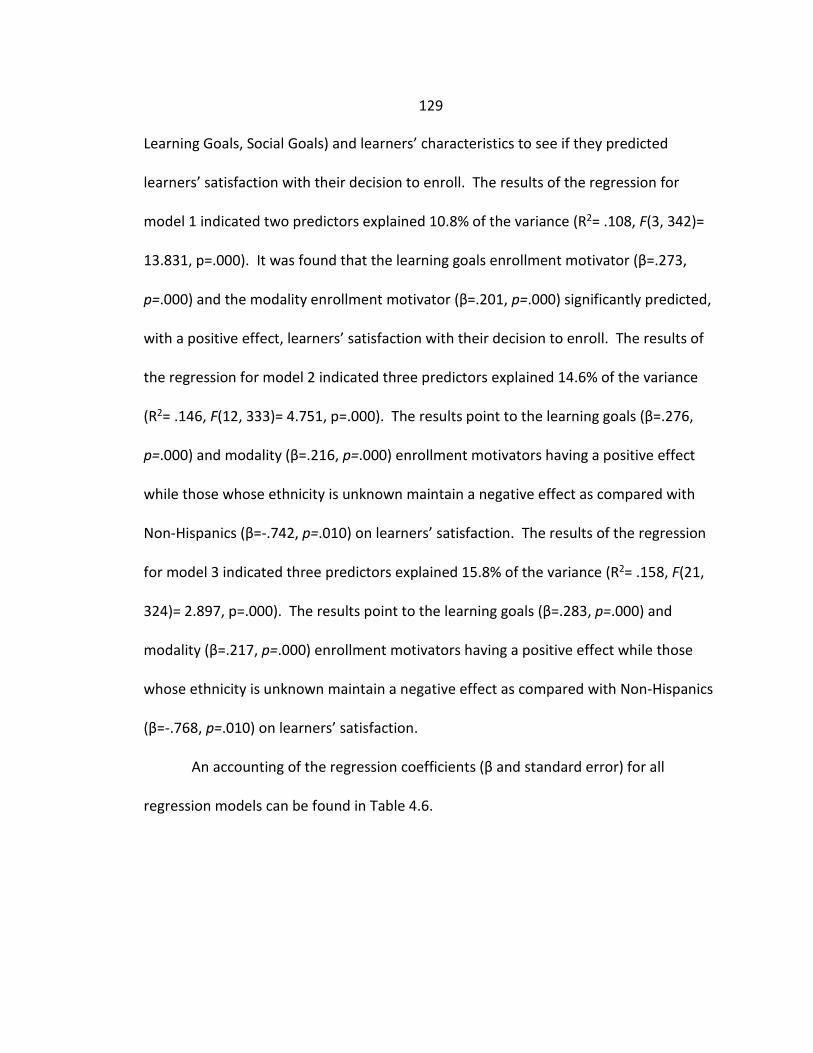
129
Learning Goals, Social Goals) and learners’ characteristics to see if they predicted
learners’ satisfaction with their decision to enroll. The results of the regression for
model 1 indicated two predictors explained 10.8% of the variance (R2= .108, F(3, 342)=
13.831, p=.000). It was found that the learning goals enrollment motivator (β=.273,
p=.000) and the modality enrollment motivator (β=.201, p=.000) significantly predicted,
with a positive effect, learners’ satisfaction with their decision to enroll. The results of
the regression for model 2 indicated three predictors explained 14.6% of the variance
(R2= .146, F(12, 333)= 4.751, p=.000). The results point to the learning goals (β=.276,
p=.000) and modality (β=.216, p=.000) enrollment motivators having a positive effect
while those whose ethnicity is unknown maintain a negative effect as compared with
Non-Hispanics (β=-.742, p=.010) on learners’ satisfaction. The results of the regression
for model 3 indicated three predictors explained 15.8% of the variance (R2= .158, F(21,
324)= 2.897, p=.000). The results point to the learning goals (β=.283, p=.000) and
modality (β=.217, p=.000) enrollment motivators having a positive effect while those
whose ethnicity is unknown maintain a negative effect as compared with Non-Hispanics
(β=-.768, p=.010) on learners’ satisfaction.
An accounting of the regression coefficients (β and standard error) for all
regression models can be found in Table 4.6.
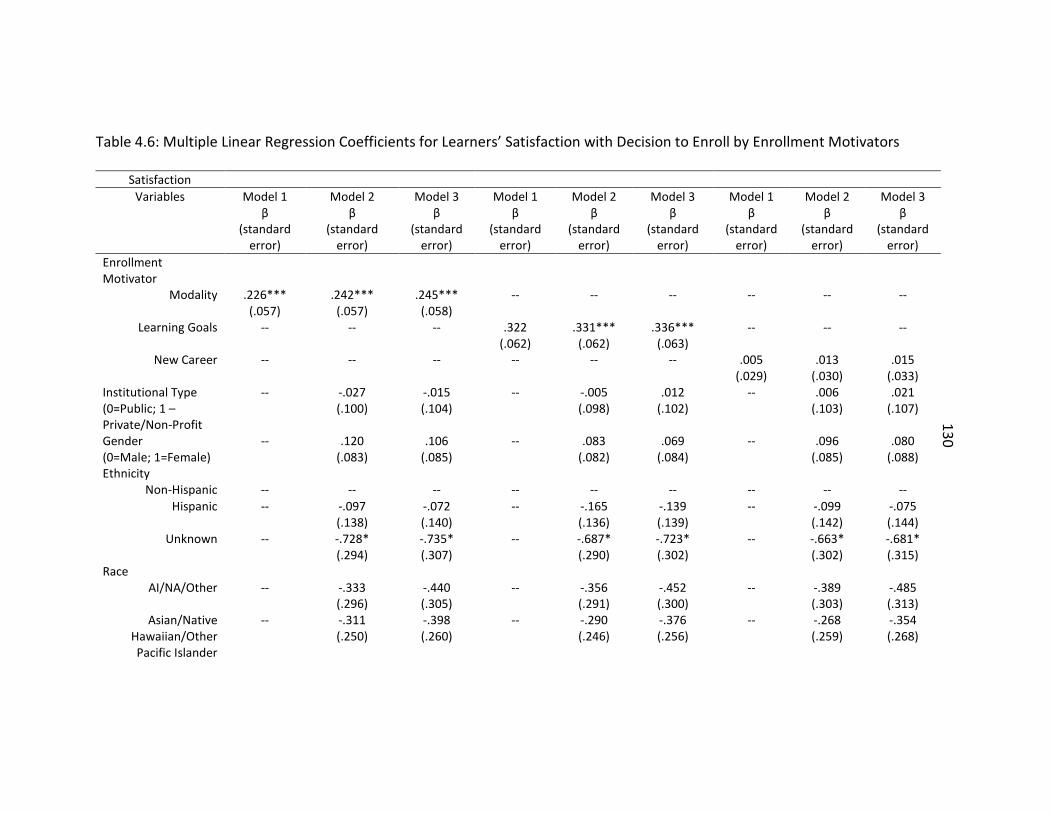
130
Table 4.6: Multiple Linear Regression Coefficients for Learners’ Satisfaction with Decision to Enroll by Enrollment Motivators
Satisfaction Variables Model 1
β (standard
error)
Model 2 β
(standard error)
Model 3 β
(standard error)
Model 1 β
(standard error)
Model 2 β
(standard error)
Model 3 β
(standard error)
Model 1 β
(standard error)
Model 2 β
(standard error)
Model 3 β
(standard error)
Enrollment Motivator
Modality .226*** (.057)
.242*** (.057)
.245*** (.058)
-- -- -- -- -- --
Learning Goals -- -- -- .322 (.062)
.331*** (.062)
.336*** (.063)
-- -- --
New Career -- -- -- -- -- -- .005 (.029)
.013 (.030)
.015 (.033)
Institutional Type (0=Public; 1 – Private/Non-Profit
-- -.027 (.100)
-.015 (.104)
-- -.005 (.098)
.012 (.102)
-- .006 (.103)
.021 (.107)
Gender (0=Male; 1=Female)
-- .120 (.083)
.106 (.085)
-- .083 (.082)
.069 (.084)
-- .096 (.085)
.080 (.088)
Ethnicity Non-Hispanic -- -- -- -- -- -- -- -- --
Hispanic -- -.097 (.138)
-.072 (.140)
-- -.165 (.136)
-.139 (.139)
-- -.099 (.142)
-.075 (.144)
Unknown -- -.728* (.294)
-.735* (.307)
-- -.687* (.290)
-.723* (.302)
-- -.663* (.302)
-.681* (.315)
Race AI/NA/Other -- -.333
(.296) -.440 (.305)
-- -.356 (.291)
-.452 (.300)
-- -.389 (.303)
-.485 (.313)
Asian/Native Hawaiian/Other Pacific Islander
-- -.311 (.250)
-.398 (.260)
-- -.290 (.246)
-.376 (.256)
-- -.268 (.259)
-.354 (.268)
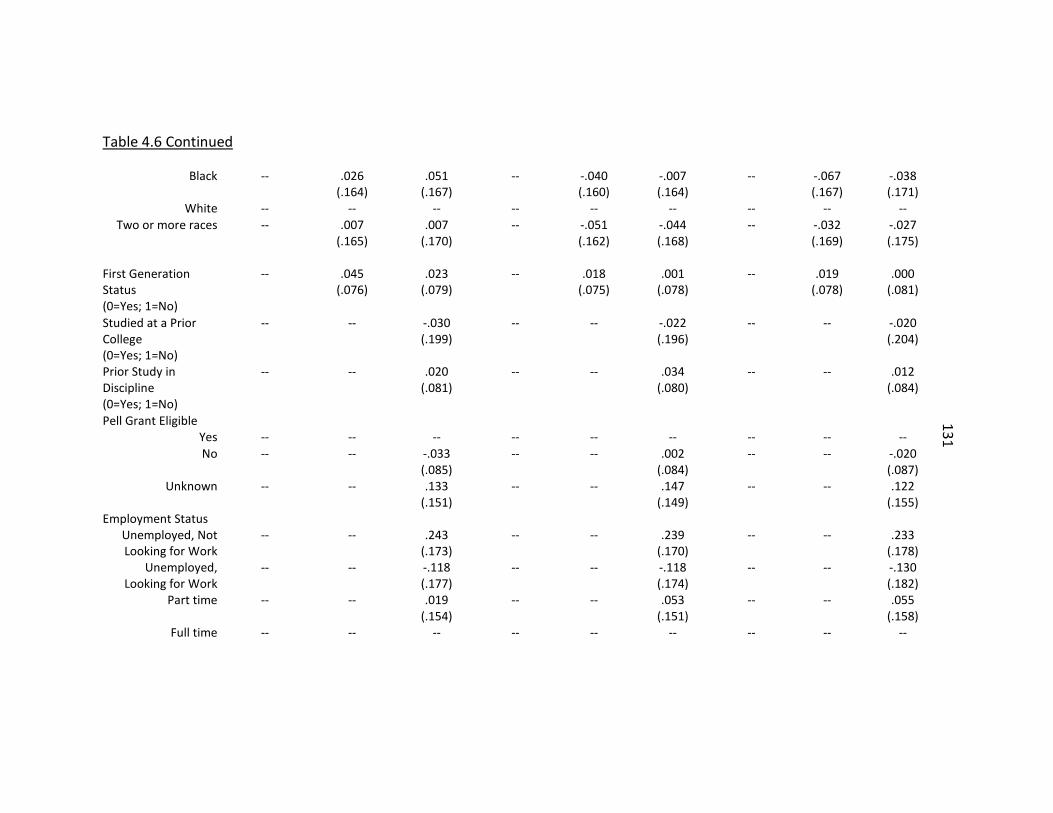
131
Table 4.6 Continued
Black -- .026 (.164)
.051 (.167)
-- -.040 (.160)
-.007 (.164)
-- -.067 (.167)
-.038 (.171)
White -- -- -- -- -- -- -- -- -- Two or more races -- .007
(.165) .007
(.170) -- -.051
(.162) -.044 (.168)
-- -.032 (.169)
-.027 (.175)
First Generation Status (0=Yes; 1=No)
-- .045 (.076)
.023 (.079)
-- .018 (.075)
.001 (.078)
-- .019 (.078)
.000 (.081)
Studied at a Prior College (0=Yes; 1=No)
-- -- -.030 (.199)
-- -- -.022 (.196)
-- -- -.020 (.204)
Prior Study in Discipline (0=Yes; 1=No)
-- -- .020 (.081)
-- -- .034 (.080)
-- -- .012 (.084)
Pell Grant Eligible Yes -- -- -- -- -- -- -- -- -- No -- -- -.033
(.085) -- -- .002
(.084) -- -- -.020
(.087) Unknown -- -- .133
(.151) -- -- .147
(.149) -- -- .122
(.155) Employment Status
Unemployed, Not Looking for Work
-- -- .243 (.173)
-- -- .239 (.170)
-- -- .233 (.178)
Unemployed, Looking for Work
-- -- -.118 (.177)
-- -- -.118 (.174)
-- -- -.130 (.182)
Part time -- -- .019 (.154)
-- -- .053 (.151)
-- -- .055 (.158)
Full time -- -- -- -- -- -- -- -- --
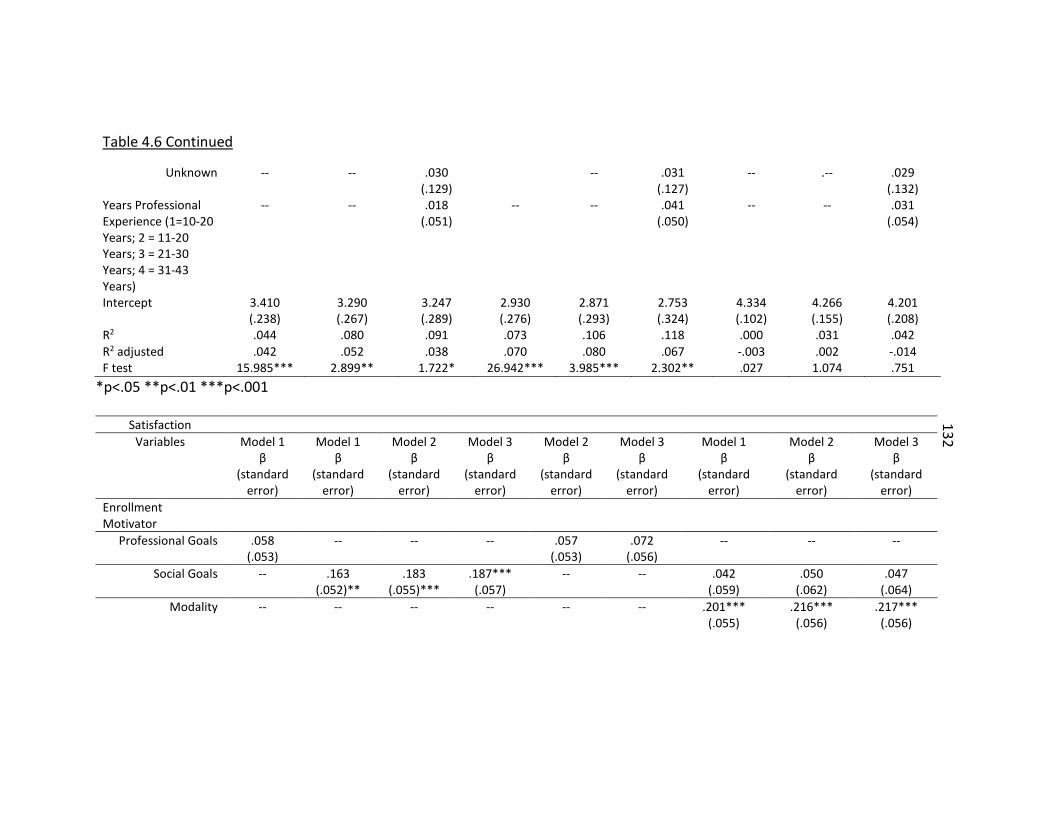
132
Table 4.6 Continued
Unknown -- -- .030 (.129)
-- .031 (.127)
-- .-- .029 (.132)
Years Professional Experience (1=10-20 Years; 2 = 11-20 Years; 3 = 21-30 Years; 4 = 31-43 Years)
-- -- .018 (.051)
-- -- .041 (.050)
-- -- .031 (.054)
Intercept 3.410 (.238)
3.290 (.267)
3.247 (.289)
2.930 (.276)
2.871 (.293)
2.753 (.324)
4.334 (.102)
4.266 (.155)
4.201 (.208)
R2 .044 .080 .091 .073 .106 .118 .000 .031 .042 R2 adjusted .042 .052 .038 .070 .080 .067 -.003 .002 -.014 F test 15.985*** 2.899** 1.722* 26.942*** 3.985*** 2.302** .027 1.074 .751
*p<.05 **p<.01 ***p<.001
Satisfaction Variables Model 1
β (standard
error)
Model 1 β
(standard error)
Model 2 β
(standard error)
Model 3 β
(standard error)
Model 2 β
(standard error)
Model 3 β
(standard error)
Model 1 β
(standard error)
Model 2 β
(standard error)
Model 3 β
(standard error)
Enrollment Motivator
Professional Goals .058 (.053)
-- -- -- .057 (.053)
.072 (.056)
-- -- --
Social Goals -- .163 (.052)**
.183 (.055)***
.187*** (.057)
-- -- .042 (.059)
.050 (.062)
.047 (.064)
Modality -- -- -- -- -- -- .201*** (.055)
.216*** (.056)
.217*** (.056)
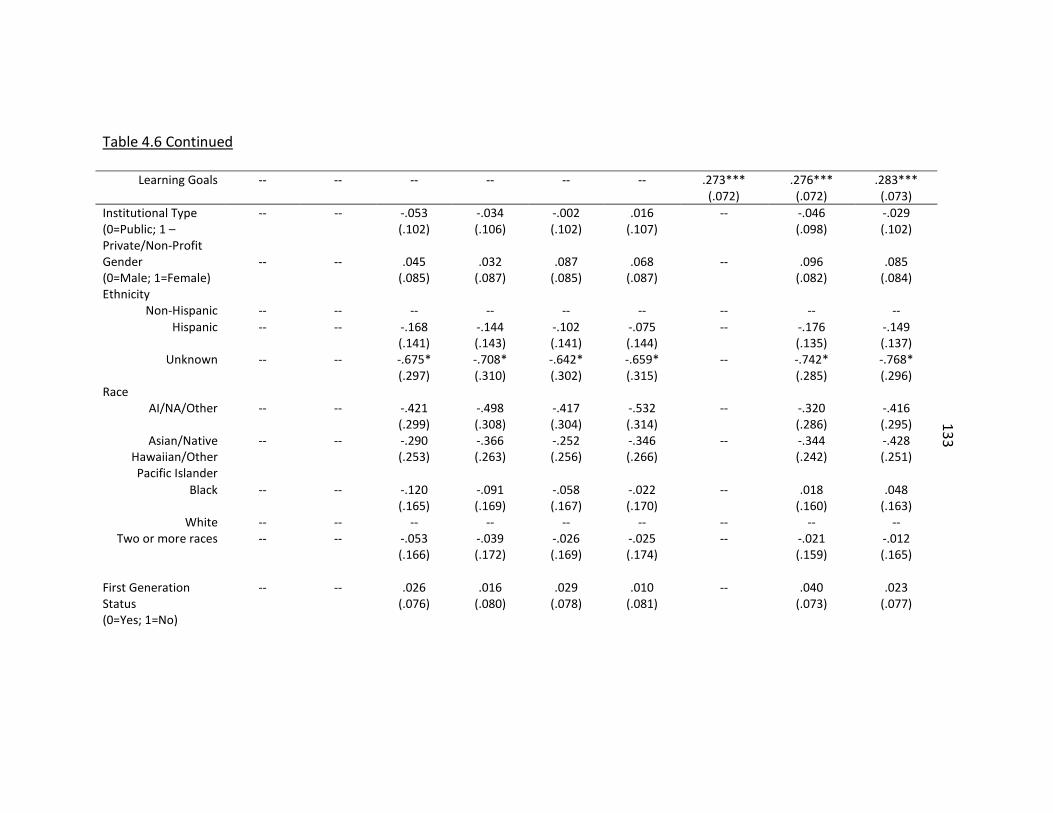
133
Table 4.6 Continued
Learning Goals -- -- -- -- -- -- .273*** (.072)
.276*** (.072)
.283*** (.073)
Institutional Type (0=Public; 1 – Private/Non-Profit
-- -- -.053 (.102)
-.034 (.106)
-.002 (.102)
.016 (.107)
-- -.046 (.098)
-.029 (.102)
Gender (0=Male; 1=Female)
-- -- .045 (.085)
.032 (.087)
.087 (.085)
.068 (.087)
-- .096 (.082)
.085 (.084)
Ethnicity Non-Hispanic -- -- -- -- -- -- -- -- --
Hispanic -- -- -.168 (.141)
-.144 (.143)
-.102 (.141)
-.075 (.144)
-- -.176 (.135)
-.149 (.137)
Unknown -- -- -.675* (.297)
-.708* (.310)
-.642* (.302)
-.659* (.315)
-- -.742* (.285)
-.768* (.296)
Race AI/NA/Other -- -- -.421
(.299) -.498 (.308)
-.417 (.304)
-.532 (.314)
-- -.320 (.286)
-.416 (.295)
Asian/Native Hawaiian/Other Pacific Islander
-- -- -.290 (.253)
-.366 (.263)
-.252 (.256)
-.346 (.266)
-- -.344 (.242)
-.428 (.251)
Black -- -- -.120 (.165)
-.091 (.169)
-.058 (.167)
-.022 (.170)
-- .018 (.160)
.048 (.163)
White -- -- -- -- -- -- -- -- -- Two or more races -- -- -.053
(.166) -.039 (.172)
-.026 (.169)
-.025 (.174)
-- -.021 (.159)
-.012 (.165)
First Generation Status (0=Yes; 1=No)
-- -- .026 (.076)
.016 (.080)
.029 (.078)
.010 (.081)
-- .040 (.073)
.023 (.077)
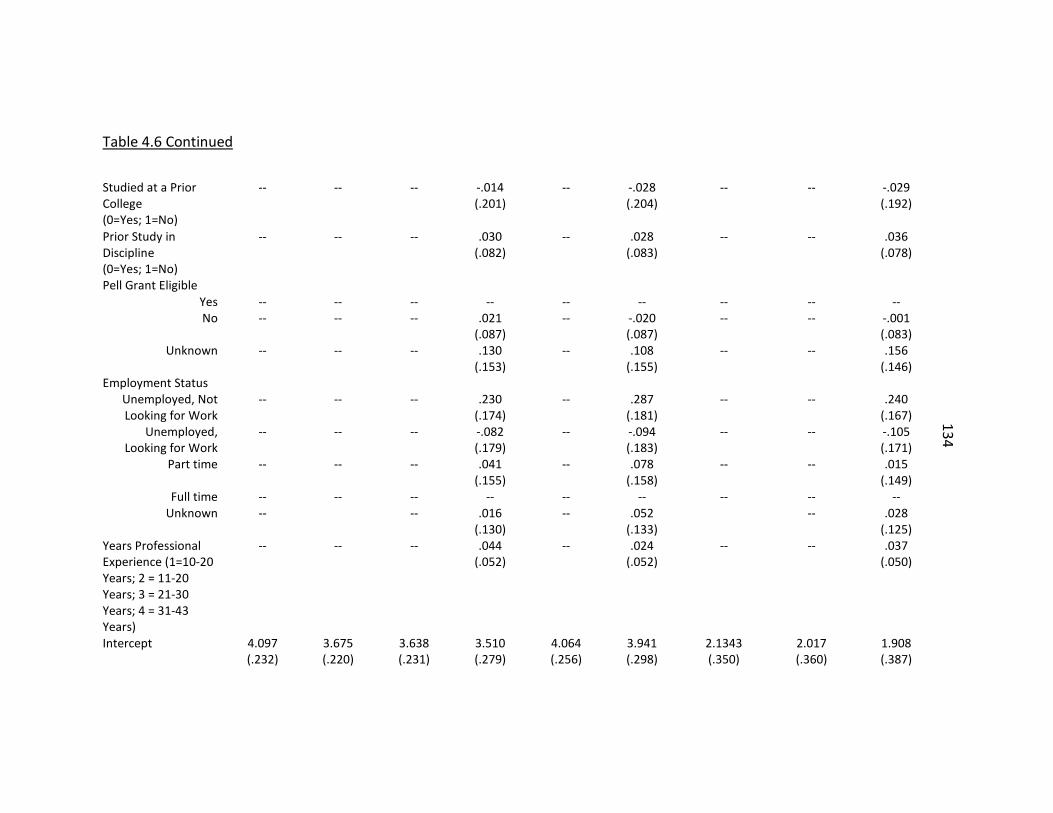
134
Table 4.6 Continued
Studied at a Prior College (0=Yes; 1=No)
-- -- -- -.014 (.201)
-- -.028 (.204)
-- -- -.029 (.192)
Prior Study in Discipline (0=Yes; 1=No)
-- -- -- .030 (.082)
-- .028 (.083)
-- -- .036 (.078)
Pell Grant Eligible Yes -- -- -- -- -- -- -- -- -- No -- -- -- .021
(.087) -- -.020
(.087) -- -- -.001
(.083) Unknown -- -- -- .130
(.153) -- .108
(.155) -- -- .156
(.146) Employment Status
Unemployed, Not Looking for Work
-- -- -- .230 (.174)
-- .287 (.181)
-- -- .240 (.167)
Unemployed, Looking for Work
-- -- -- -.082 (.179)
-- -.094 (.183)
-- -- -.105 (.171)
Part time -- -- -- .041 (.155)
-- .078 (.158)
-- -- .015 (.149)
Full time -- -- -- -- -- -- -- -- -- Unknown -- -- .016
(.130) -- .052
(.133) -- .028
(.125) Years Professional Experience (1=10-20 Years; 2 = 11-20 Years; 3 = 21-30 Years; 4 = 31-43 Years)
-- -- -- .044 (.052)
-- .024 (.052)
-- -- .037 (.050)
Intercept 4.097 (.232)
3.675 (.220)
3.638 (.231)
3.510 (.279)
4.064 (.256)
3.941 (.298)
2.1343 (.350)
2.017 (.360)
1.908 (.387)
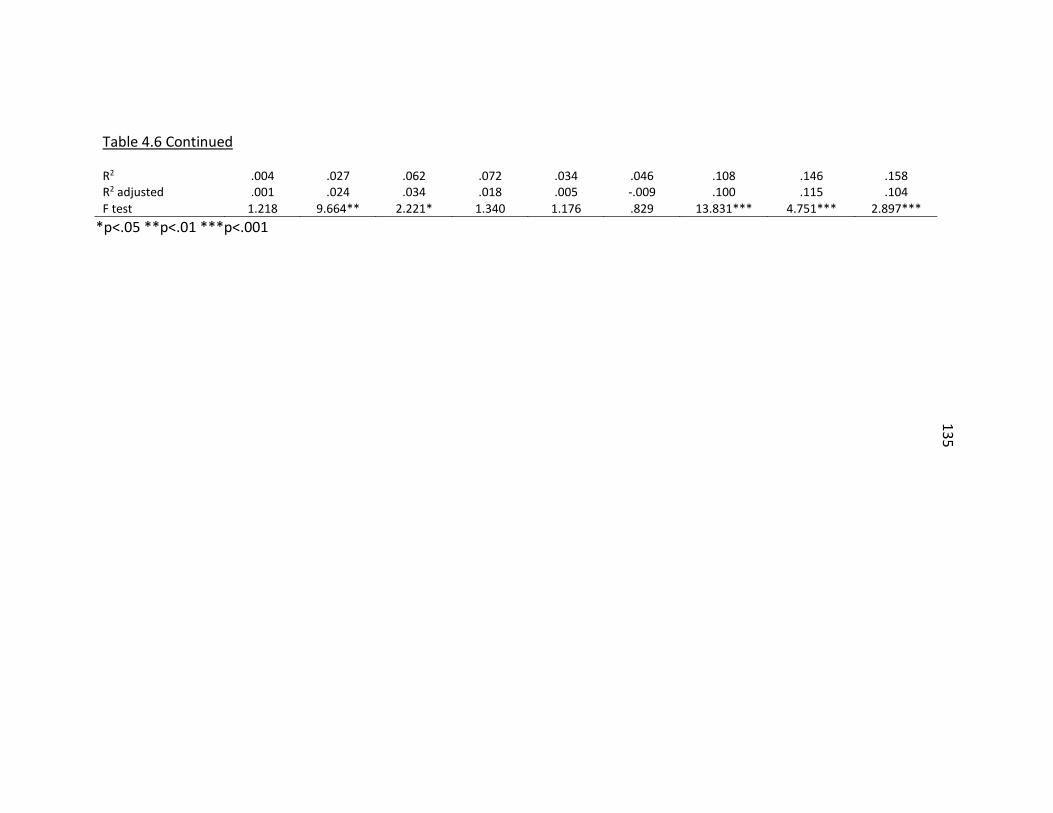
135
Table 4.6 Continued R2 .004 .027 .062 .072 .034 .046 .108 .146 .158 R2 adjusted .001 .024 .034 .018 .005 -.009 .100 .115 .104 F test 1.218 9.664** 2.221* 1.340 1.176 .829 13.831*** 4.751*** 2.897***
*p<.05 **p<.01 ***p<.001
136
College Choice Process
Research question five seeks to understand the college choice process for those
who chose a competency-based education program. This question was answered
through six open-ended survey questions, designed to explore the stages of the college
choice process including the search process and the decision factors which influenced
learners’ enrollment in a competency-based education program. I coded the learners’
responses manually and then ran word frequency queries utilizing Nvivo, a software
program that analyzes unstructured data, to increase the validity of the results. Owning
to the open-ended nature of these six questions, learners’ responses could appear in
multiple categories, therefore the frequency counts will not add up to the study N (346).
The first open-ended question asked students to explain if there was anything
specific that made them decide they wanted to go to or return to college before they
enrolled in their competency-based education program. The top reason uncovered in
the coding process was career advancement (199), followed by personal goals (77), and
the desire to have a degree (50). A full frequency listing from the manual coding can be
found in Table 4.7.
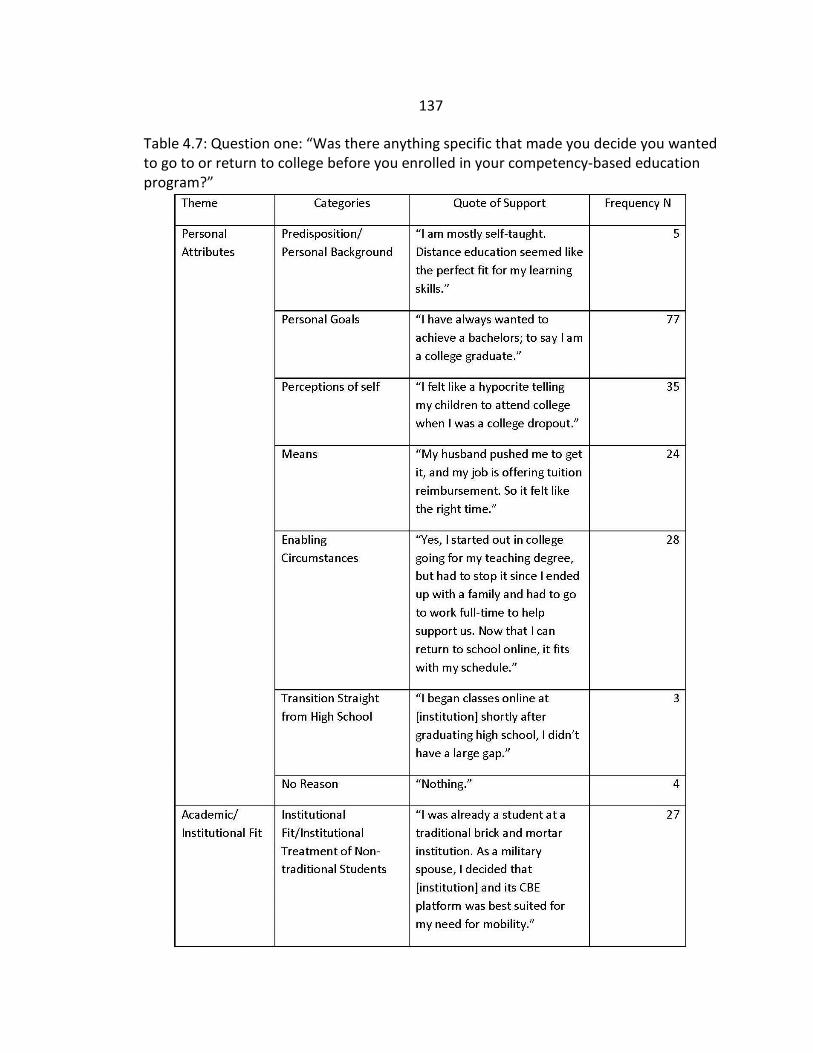
137
Table 4.7: Question one: “Was there anything specific that made you decide you wanted to go to or return to college before you enrolled in your competency-based education program?”
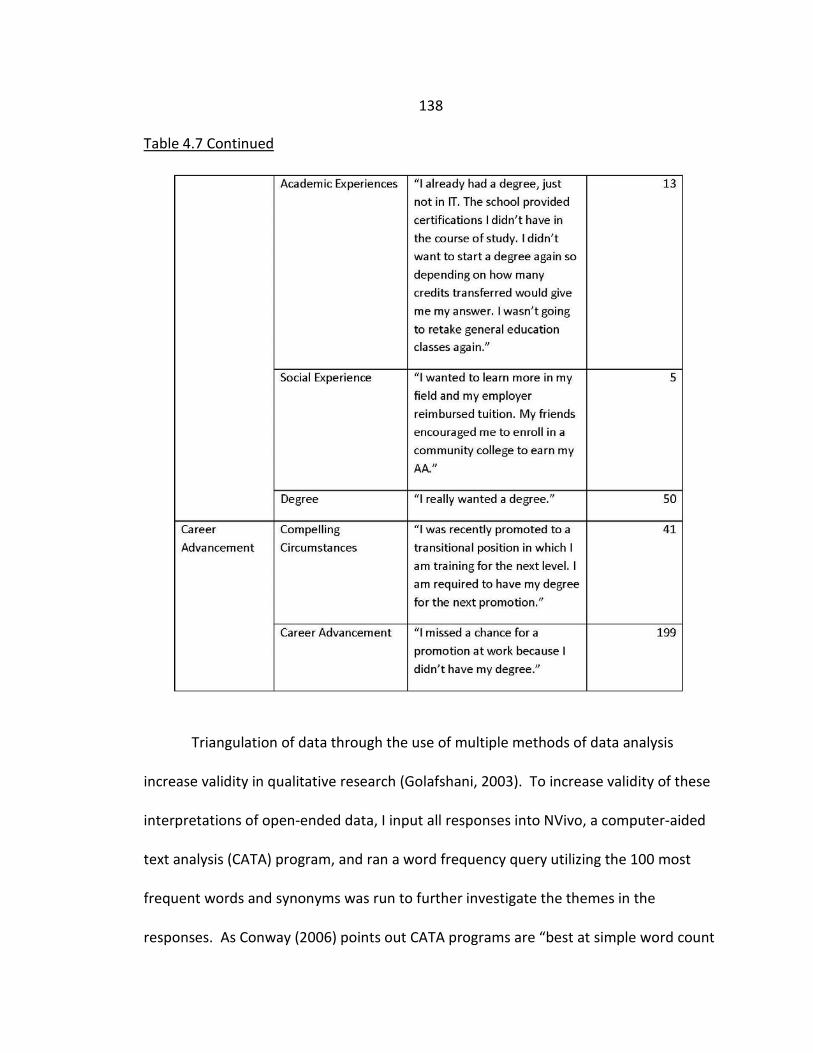
138
Table 4.7 Continued
Triangulation of data through the use of multiple methods of data analysis
increase validity in qualitative research (Golafshani, 2003). To increase validity of these
interpretations of open-ended data, I input all responses into NVivo, a computer-aided
text analysis (CATA) program, and ran a word frequency query utilizing the 100 most
frequent words and synonyms was run to further investigate the themes in the
responses. As Conway (2006) points out CATA programs are “best at simple word count
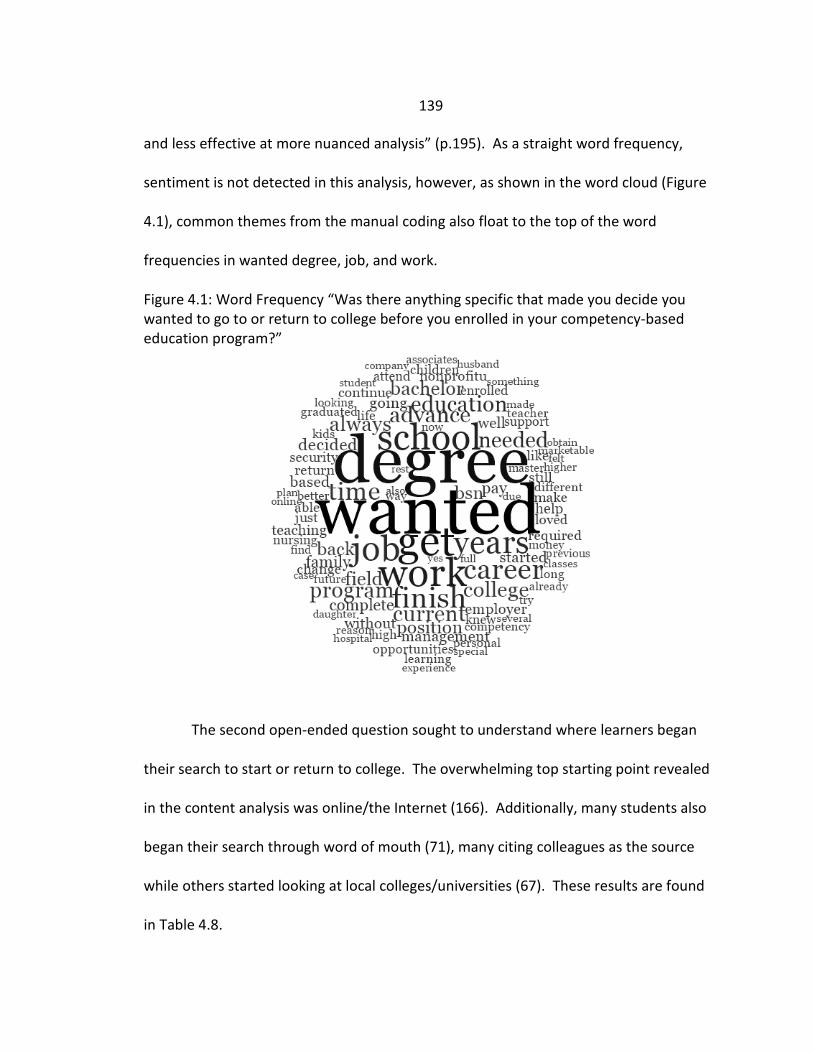
139
and less effective at more nuanced analysis” (p.195). As a straight word frequency,
sentiment is not detected in this analysis, however, as shown in the word cloud (Figure
4.1), common themes from the manual coding also float to the top of the word
frequencies in wanted degree, job, and work.
Figure 4.1: Word Frequency “Was there anything specific that made you decide you wanted to go to or return to college before you enrolled in your competency-based education program?”
The second open-ended question sought to understand where learners began
their search to start or return to college. The overwhelming top starting point revealed
in the content analysis was online/the Internet (166). Additionally, many students also
began their search through word of mouth (71), many citing colleagues as the source
while others started looking at local colleges/universities (67). These results are found
in Table 4.8.
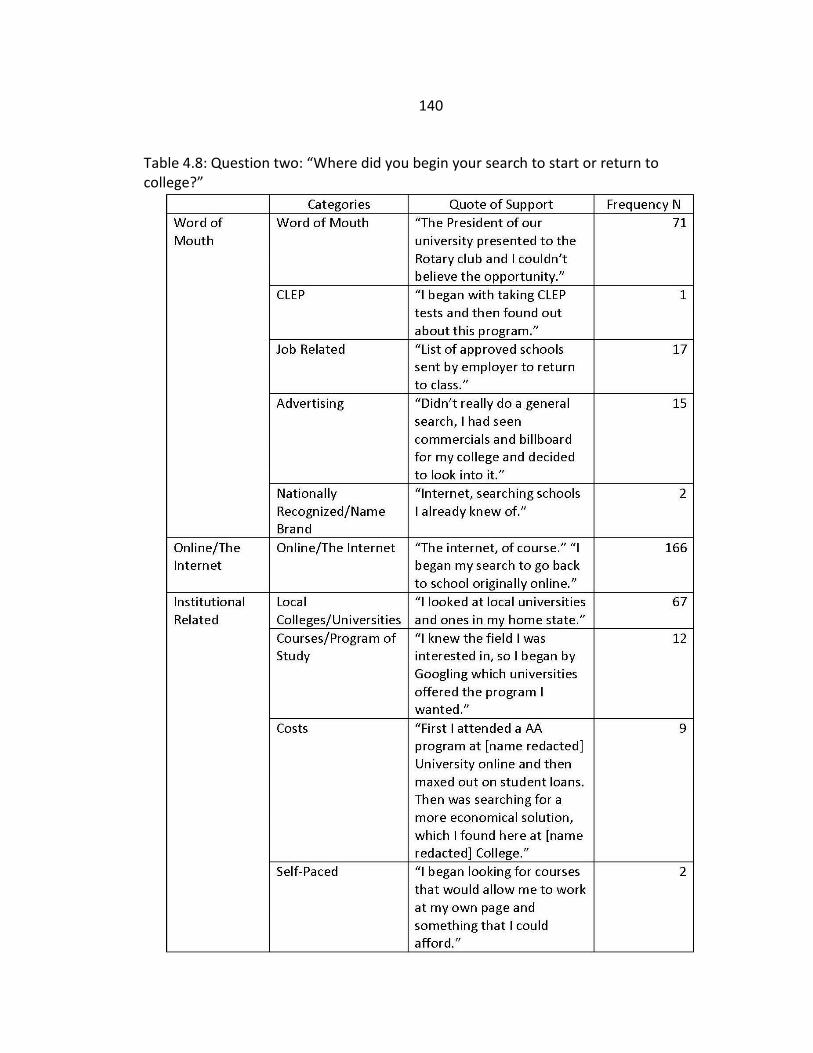
140
Table 4.8: Question two: “Where did you begin your search to start or return to college?”
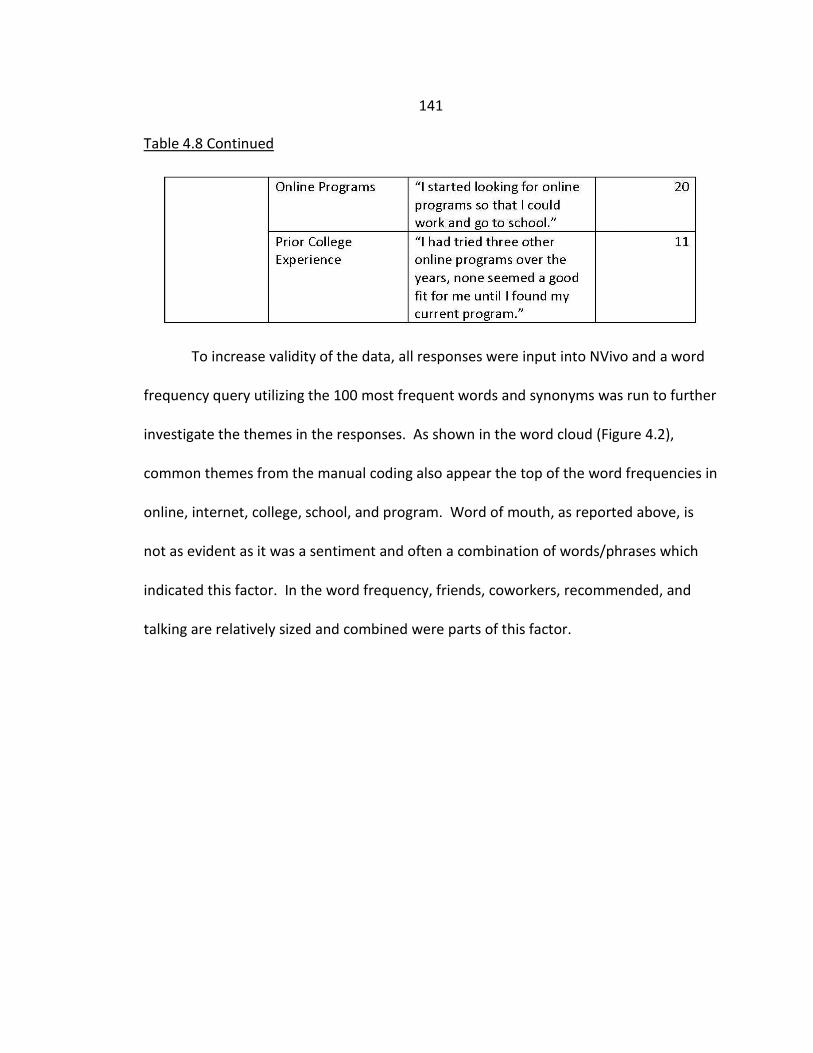
141
Table 4.8 Continued
To increase validity of the data, all responses were input into NVivo and a word
frequency query utilizing the 100 most frequent words and synonyms was run to further
investigate the themes in the responses. As shown in the word cloud (Figure 4.2),
common themes from the manual coding also appear the top of the word frequencies in
online, internet, college, school, and program. Word of mouth, as reported above, is
not as evident as it was a sentiment and often a combination of words/phrases which
indicated this factor. In the word frequency, friends, coworkers, recommended, and
talking are relatively sized and combined were parts of this factor.
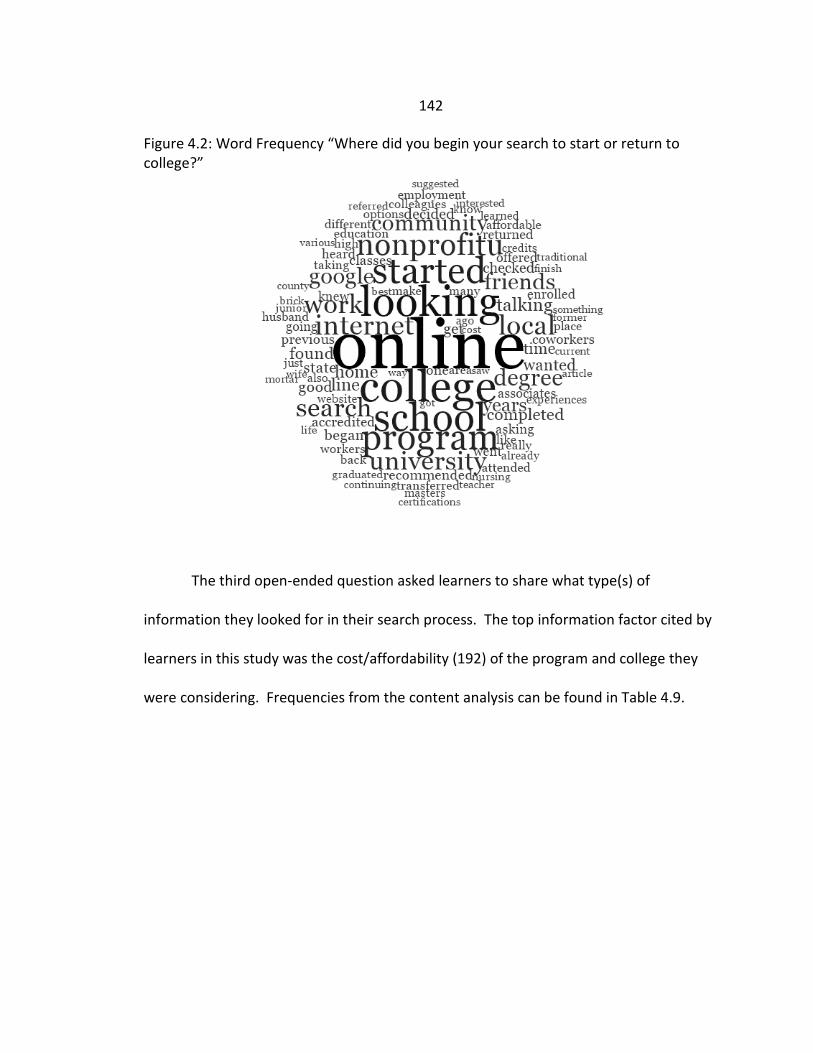
142
Figure 4.2: Word Frequency “Where did you begin your search to start or return to college?”
The third open-ended question asked learners to share what type(s) of
information they looked for in their search process. The top information factor cited by
learners in this study was the cost/affordability (192) of the program and college they
were considering. Frequencies from the content analysis can be found in Table 4.9.
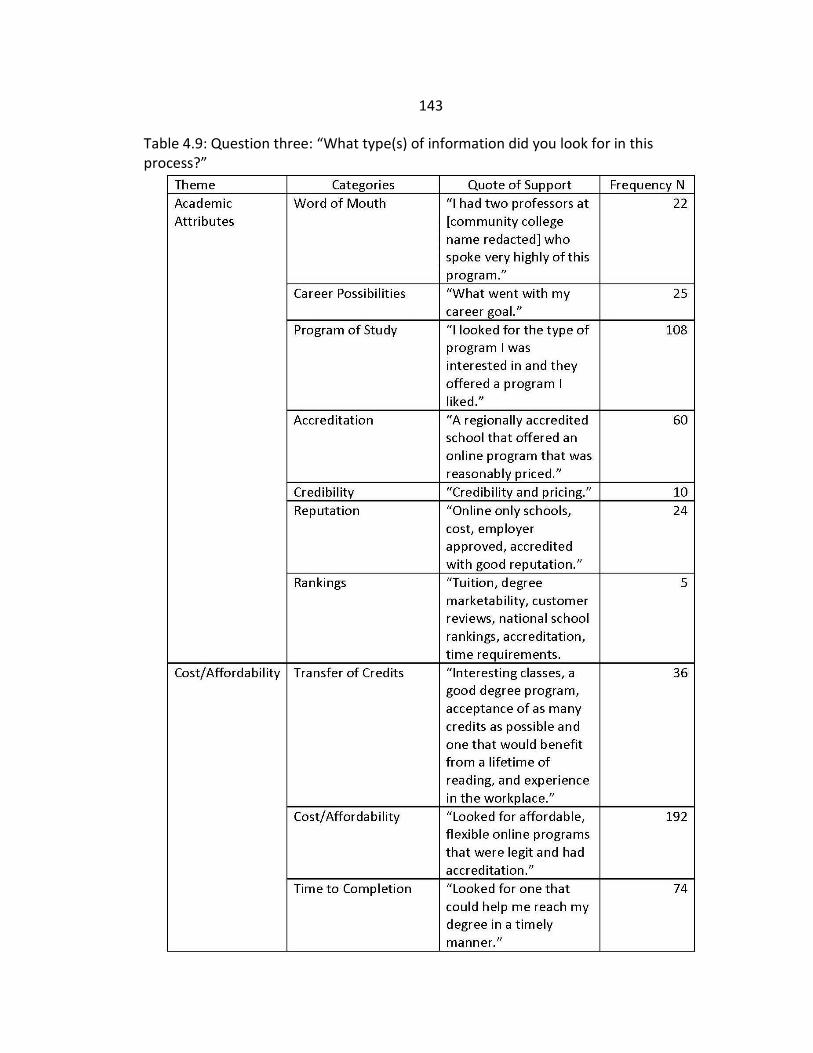
143
Table 4.9: Question three: “What type(s) of information did you look for in this process?”
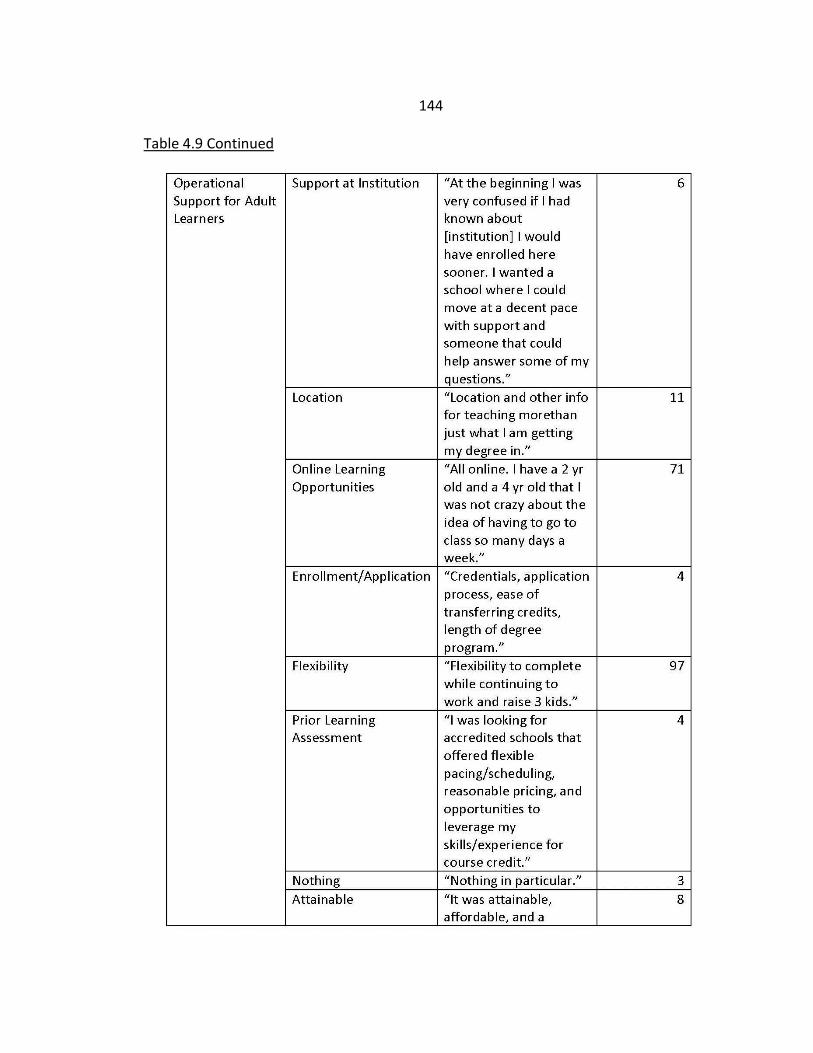
144
Table 4.9 Continued
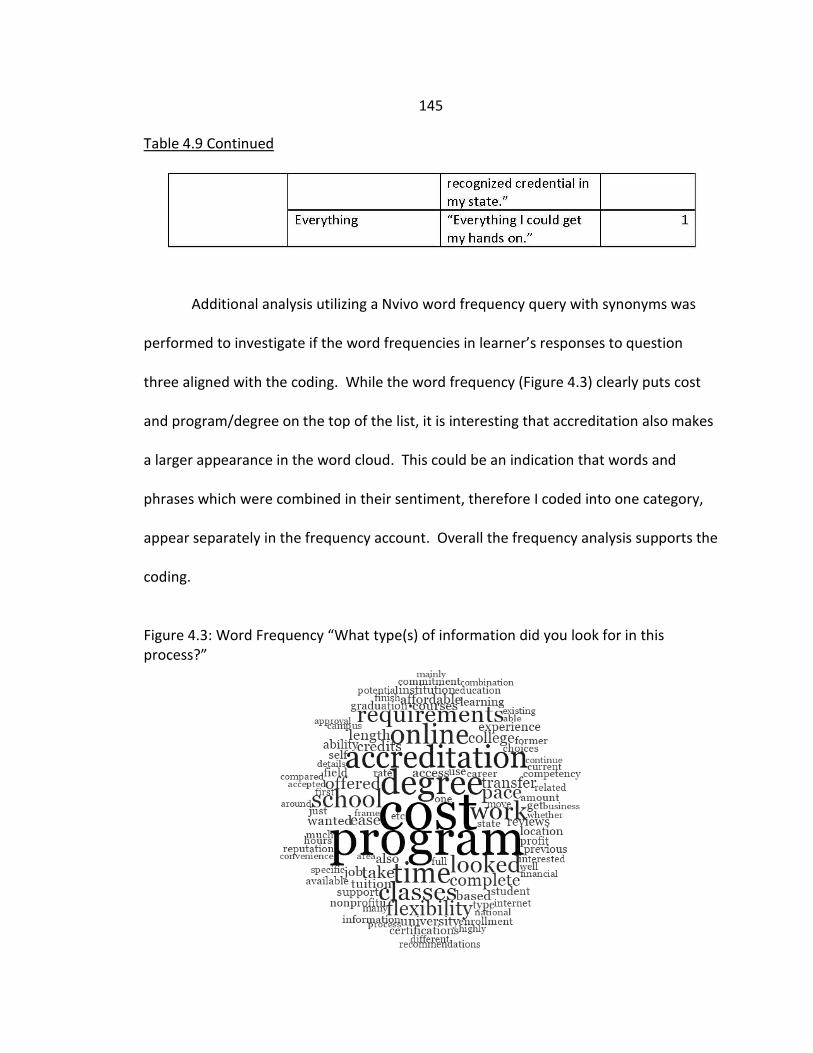
145
Table 4.9 Continued
Additional analysis utilizing a Nvivo word frequency query with synonyms was
performed to investigate if the word frequencies in learner’s responses to question
three aligned with the coding. While the word frequency (Figure 4.3) clearly puts cost
and program/degree on the top of the list, it is interesting that accreditation also makes
a larger appearance in the word cloud. This could be an indication that words and
phrases which were combined in their sentiment, therefore I coded into one category,
appear separately in the frequency account. Overall the frequency analysis supports the
coding.
Figure 4.3: Word Frequency “What type(s) of information did you look for in this process?”
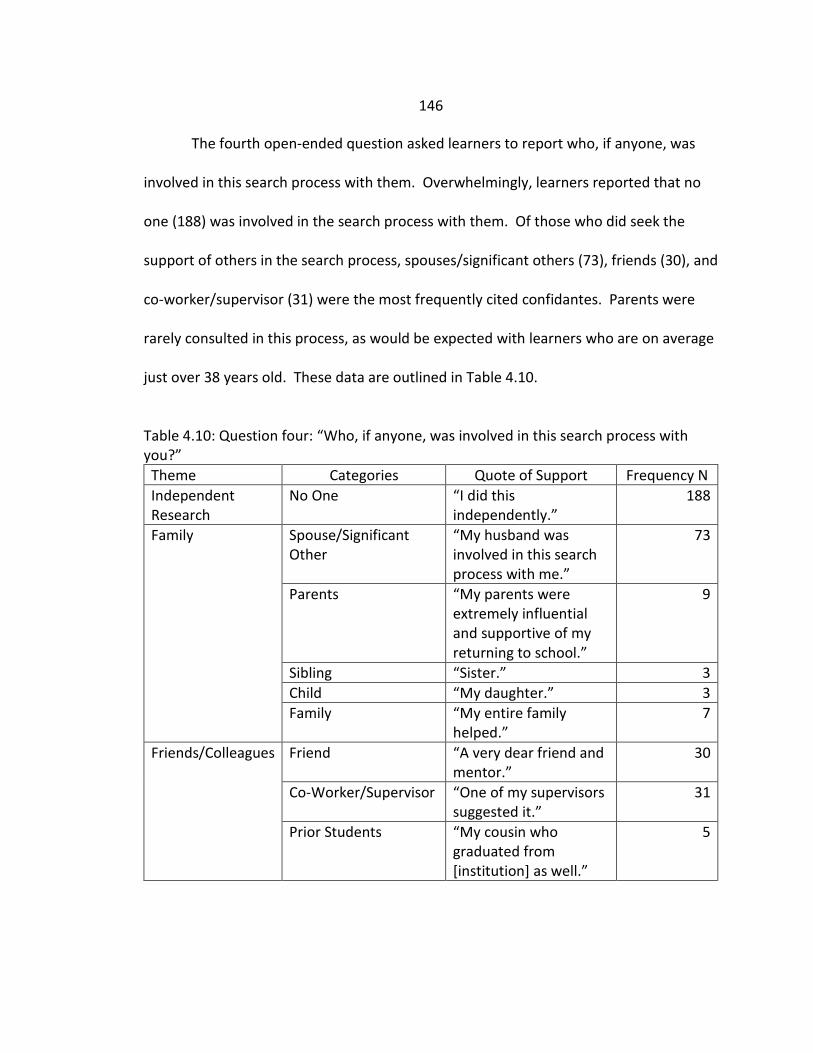
146
The fourth open-ended question asked learners to report who, if anyone, was
involved in this search process with them. Overwhelmingly, learners reported that no
one (188) was involved in the search process with them. Of those who did seek the
support of others in the search process, spouses/significant others (73), friends (30), and
co-worker/supervisor (31) were the most frequently cited confidantes. Parents were
rarely consulted in this process, as would be expected with learners who are on average
just over 38 years old. These data are outlined in Table 4.10.
Table 4.10: Question four: “Who, if anyone, was involved in this search process with you?”
Theme Categories Quote of Support Frequency N Independent Research
No One “I did this independently.”
188
Family Spouse/Significant Other
“My husband was involved in this search process with me.”
73
Parents “My parents were extremely influential and supportive of my returning to school.”
9
Sibling “Sister.” 3 Child “My daughter.” 3 Family “My entire family
helped.” 7
Friends/Colleagues Friend “A very dear friend and mentor.”
30
Co-Worker/Supervisor “One of my supervisors suggested it.”
31
Prior Students “My cousin who graduated from [institution] as well.”
5
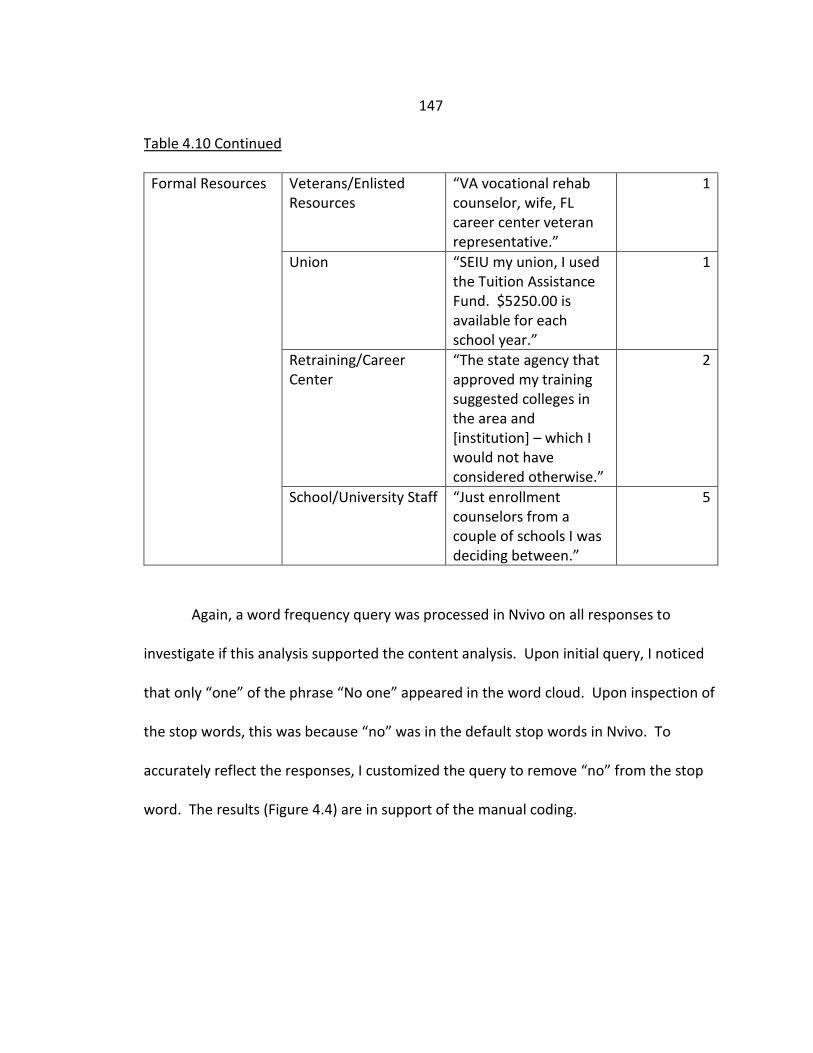
147
Table 4.10 Continued Formal Resources Veterans/Enlisted
Resources “VA vocational rehab counselor, wife, FL career center veteran representative.”
1
Union “SEIU my union, I used the Tuition Assistance Fund. $5250.00 is available for each school year.”
1
Retraining/Career Center
“The state agency that approved my training suggested colleges in the area and [institution] – which I would not have considered otherwise.”
2
School/University Staff “Just enrollment counselors from a couple of schools I was deciding between.”
5
Again, a word frequency query was processed in Nvivo on all responses to
investigate if this analysis supported the content analysis. Upon initial query, I noticed
that only “one” of the phrase “No one” appeared in the word cloud. Upon inspection of
the stop words, this was because “no” was in the default stop words in Nvivo. To
accurately reflect the responses, I customized the query to remove “no” from the stop
word. The results (Figure 4.4) are in support of the manual coding.
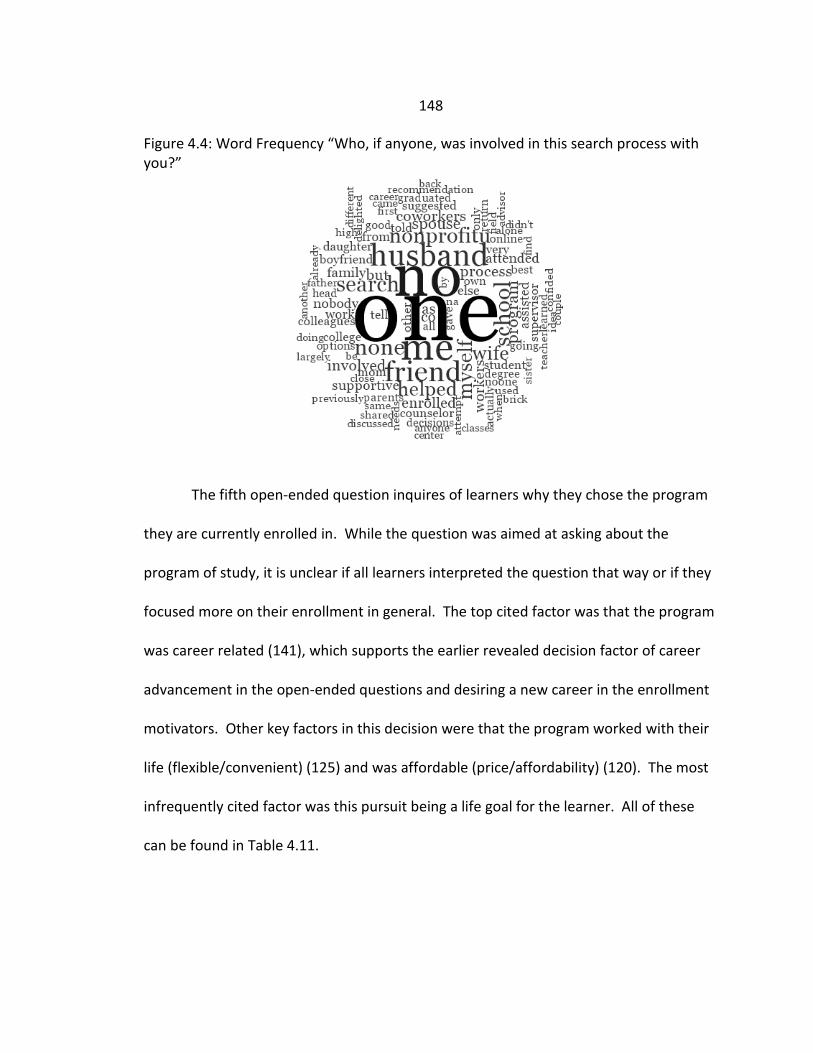
148
Figure 4.4: Word Frequency “Who, if anyone, was involved in this search process with you?”
The fifth open-ended question inquires of learners why they chose the program
they are currently enrolled in. While the question was aimed at asking about the
program of study, it is unclear if all learners interpreted the question that way or if they
focused more on their enrollment in general. The top cited factor was that the program
was career related (141), which supports the earlier revealed decision factor of career
advancement in the open-ended questions and desiring a new career in the enrollment
motivators. Other key factors in this decision were that the program worked with their
life (flexible/convenient) (125) and was affordable (price/affordability) (120). The most
infrequently cited factor was this pursuit being a life goal for the learner. All of these
can be found in Table 4.11.
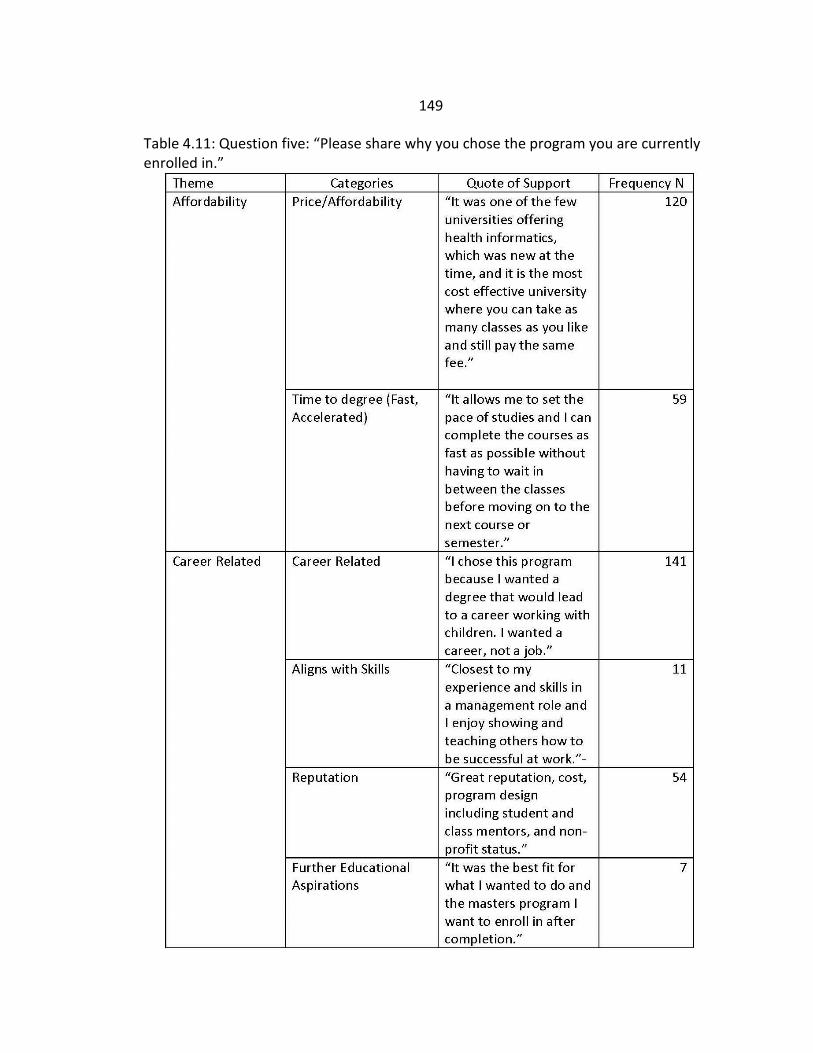
149
Table 4.11: Question five: “Please share why you chose the program you are currently enrolled in.”
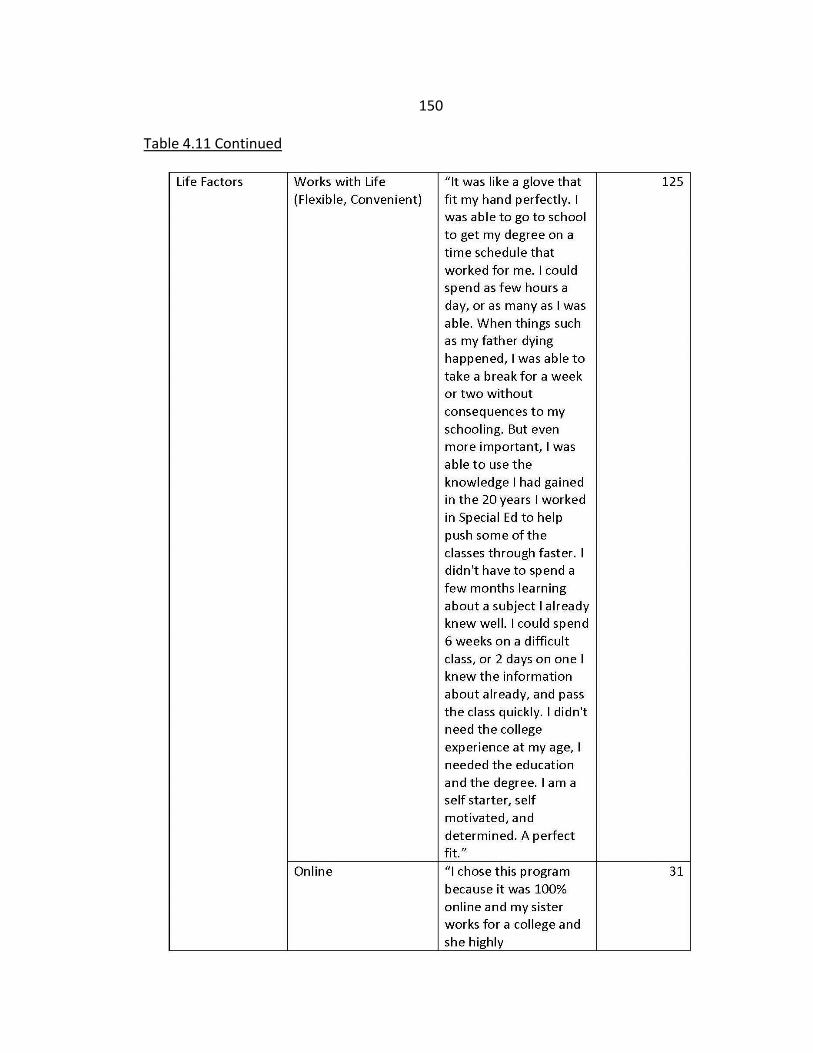
150
Table 4.11 Continued
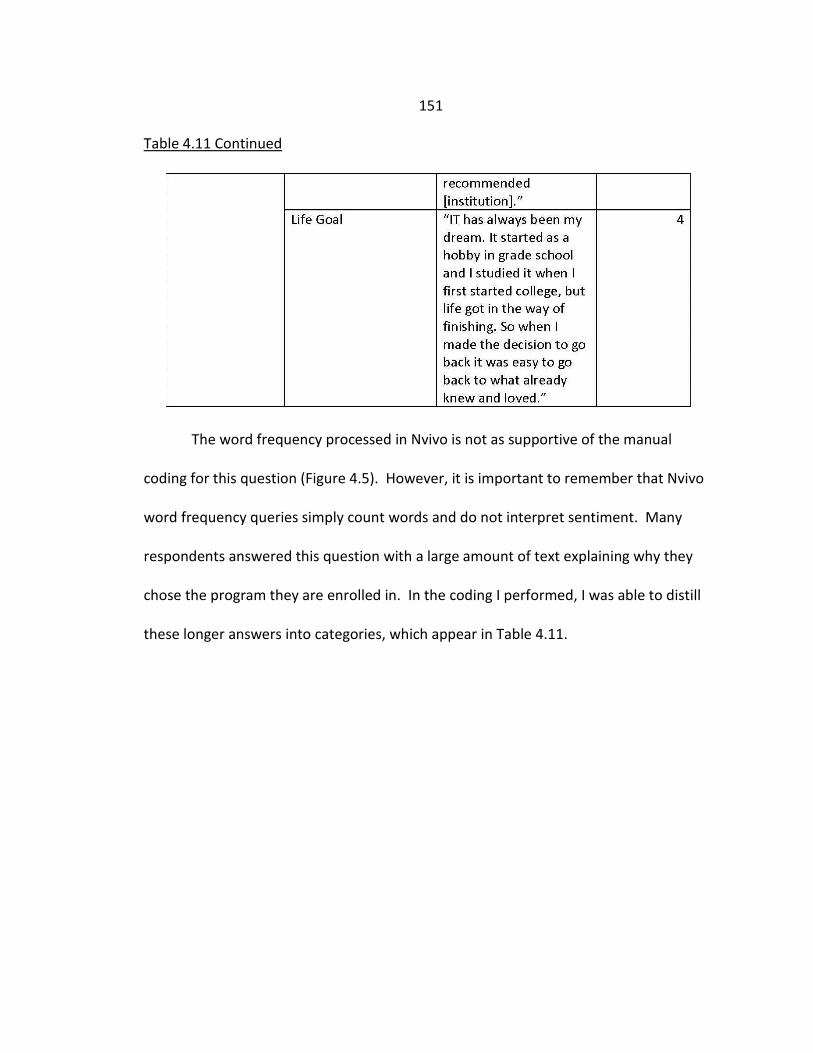
151
Table 4.11 Continued
The word frequency processed in Nvivo is not as supportive of the manual
coding for this question (Figure 4.5). However, it is important to remember that Nvivo
word frequency queries simply count words and do not interpret sentiment. Many
respondents answered this question with a large amount of text explaining why they
chose the program they are enrolled in. In the coding I performed, I was able to distill
these longer answers into categories, which appear in Table 4.11.
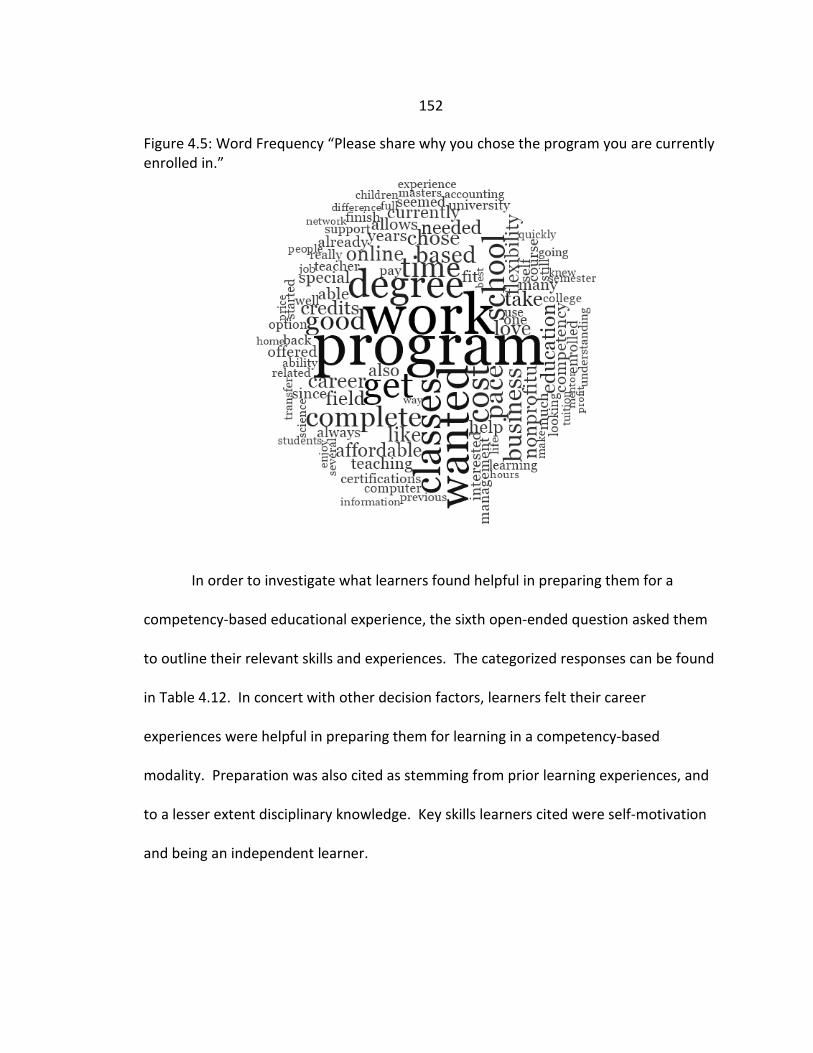
152
Figure 4.5: Word Frequency “Please share why you chose the program you are currently enrolled in.”
In order to investigate what learners found helpful in preparing them for a
competency-based educational experience, the sixth open-ended question asked them
to outline their relevant skills and experiences. The categorized responses can be found
in Table 4.12. In concert with other decision factors, learners felt their career
experiences were helpful in preparing them for learning in a competency-based
modality. Preparation was also cited as stemming from prior learning experiences, and
to a lesser extent disciplinary knowledge. Key skills learners cited were self-motivation
and being an independent learner.
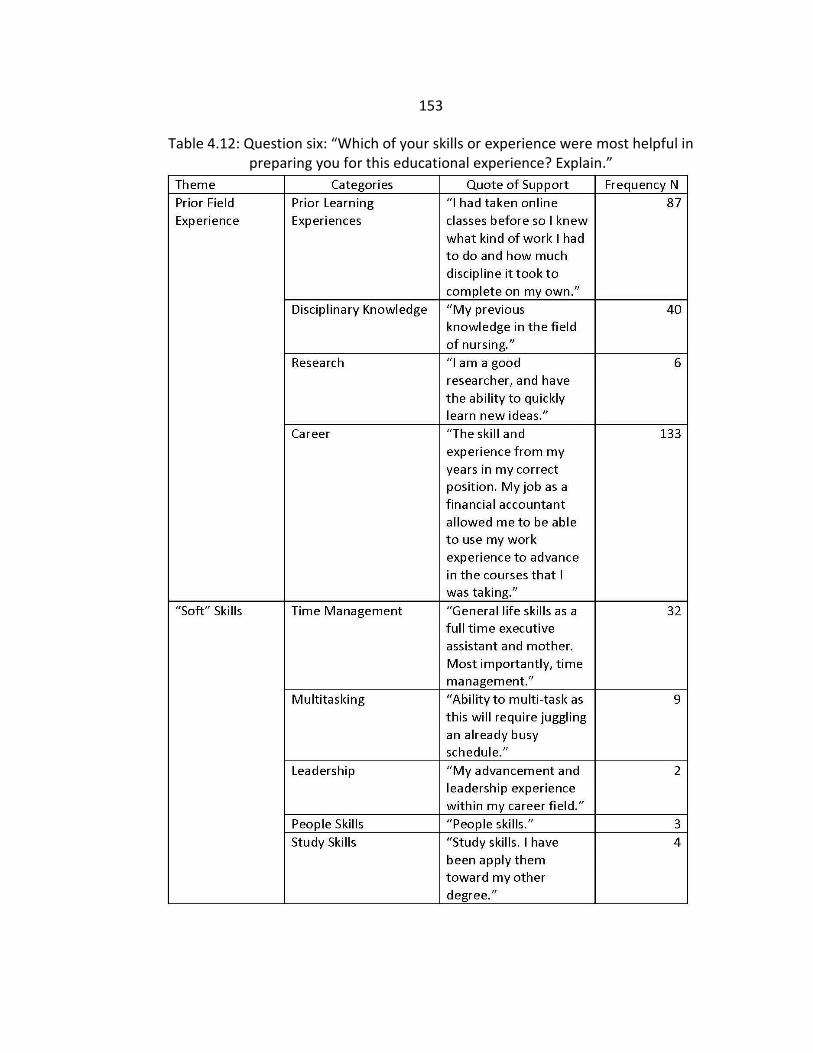
153
Table 4.12: Question six: “Which of your skills or experience were most helpful in preparing you for this educational experience? Explain.”
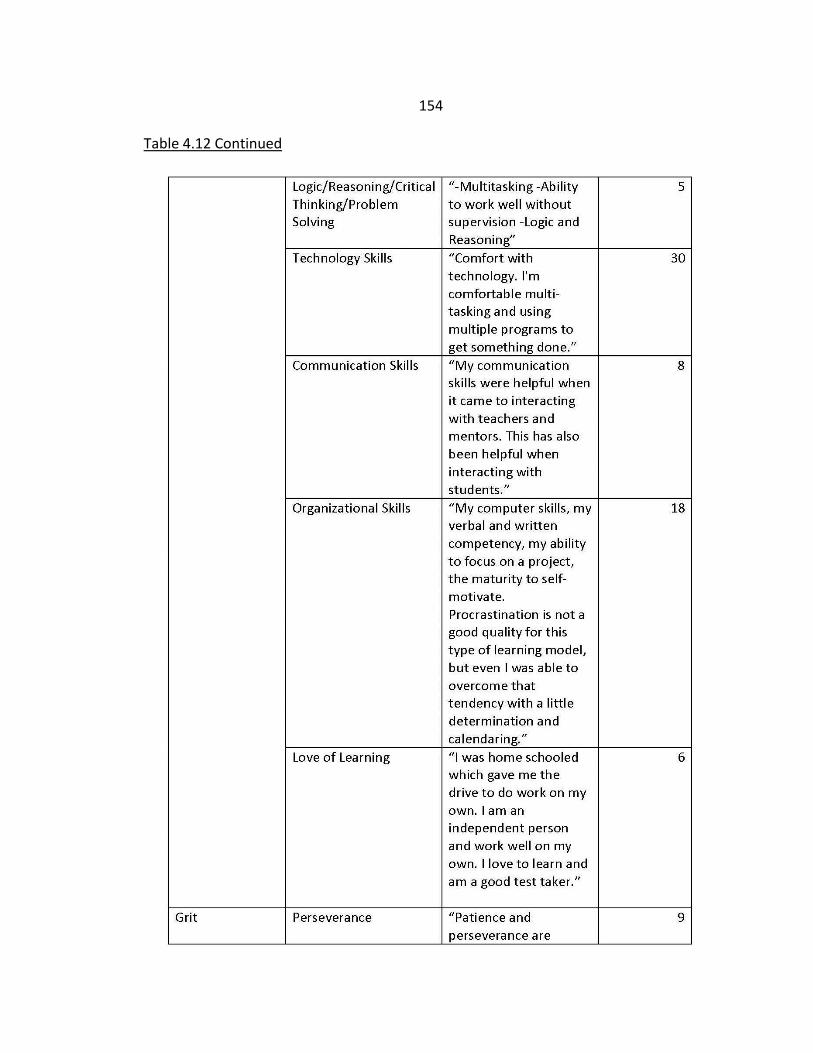
154
Table 4.12 Continued
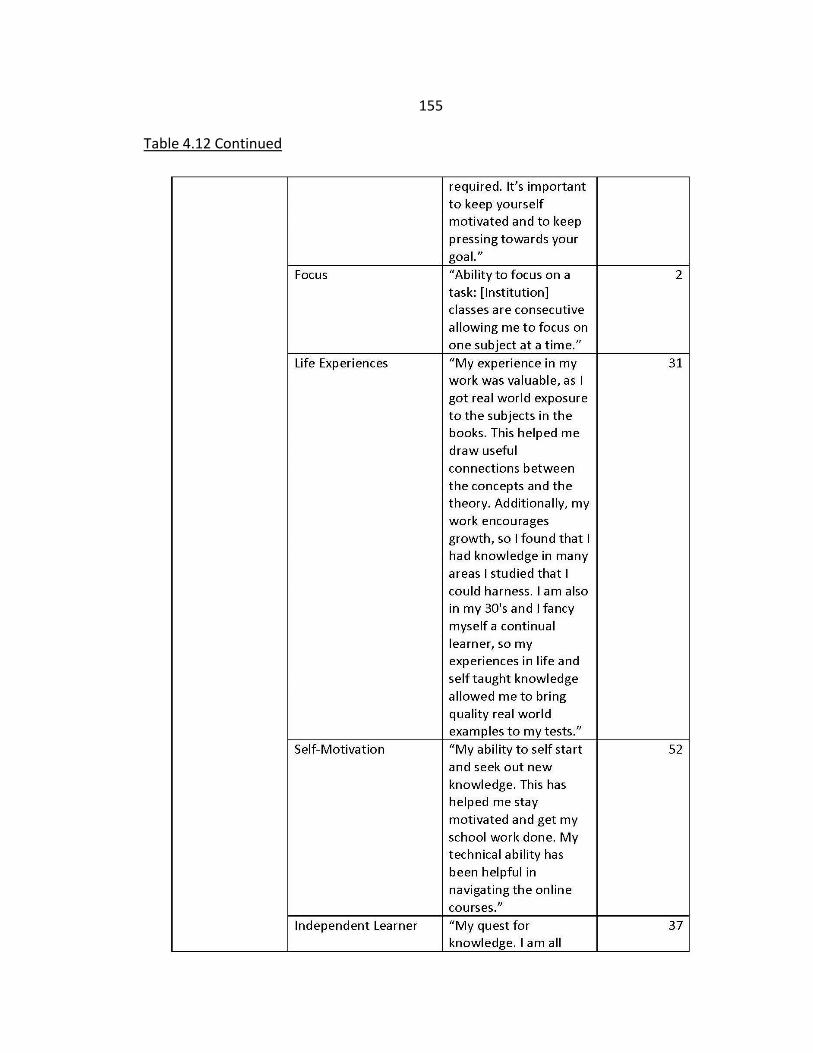
155
Table 4.12 Continued
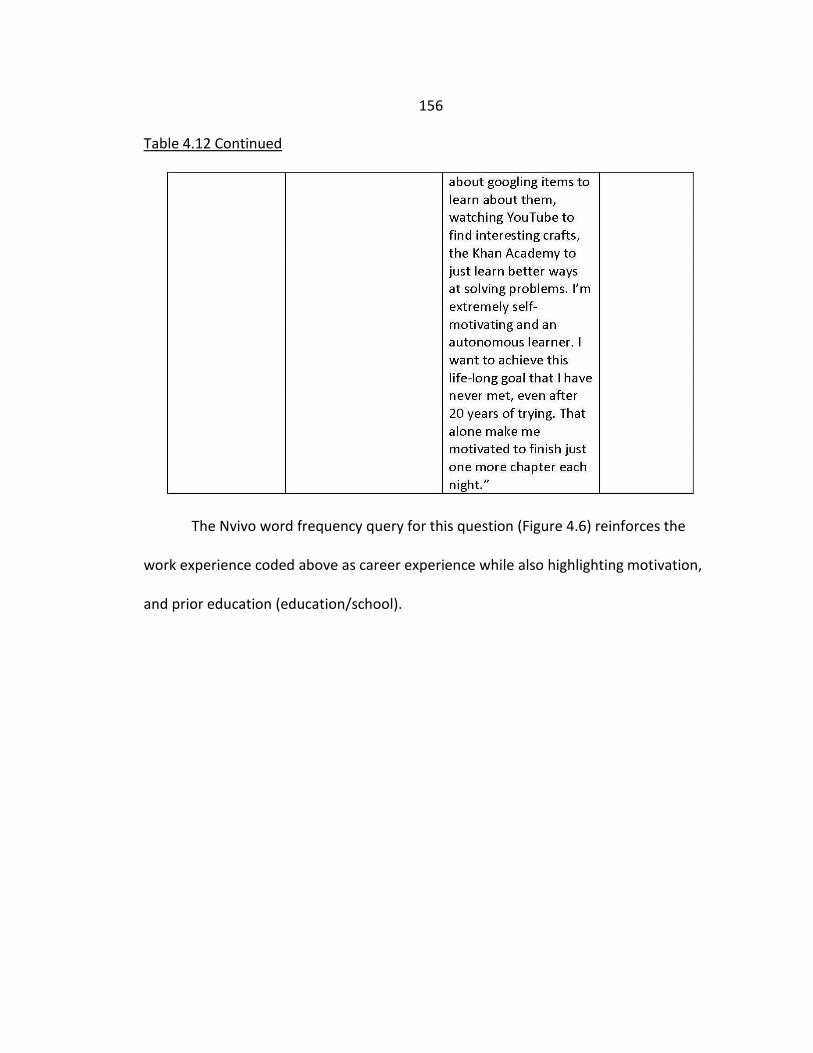
156
Table 4.12 Continued
The Nvivo word frequency query for this question (Figure 4.6) reinforces the
work experience coded above as career experience while also highlighting motivation,
and prior education (education/school).
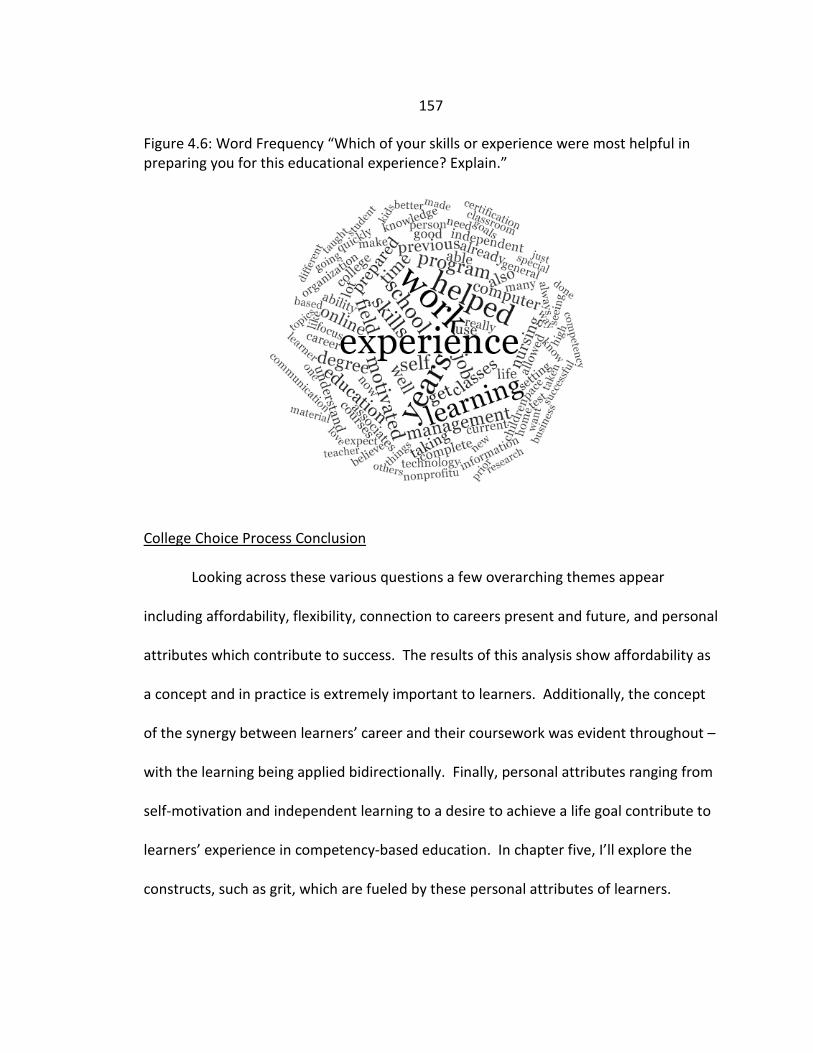
157
Figure 4.6: Word Frequency “Which of your skills or experience were most helpful in preparing you for this educational experience? Explain.”
College Choice Process Conclusion
Looking across these various questions a few overarching themes appear
including affordability, flexibility, connection to careers present and future, and personal
attributes which contribute to success. The results of this analysis show affordability as
a concept and in practice is extremely important to learners. Additionally, the concept
of the synergy between learners’ career and their coursework was evident throughout –
with the learning being applied bidirectionally. Finally, personal attributes ranging from
self-motivation and independent learning to a desire to achieve a life goal contribute to
learners’ experience in competency-based education. In chapter five, I’ll explore the
constructs, such as grit, which are fueled by these personal attributes of learners.
158
CHAPTER FIVE – CONCLUSIONS
Introduction
The purpose of this study was to investigate the learners’ demographic and
work-life characteristics, college choice process, and these learners’ satisfaction with
their decision to enroll in competency-based education. This study utilized a secondary
analysis of survey data. This chapter will outline the overview of the study, a brief
review of the methodology, discussion of the research results, practical
recommendations from the study, limitations, recommendations for further research
and conclusions.
Overview of the Study
Competency-based education is on the rise as a renewed modality of higher
education. First implemented in the 1970s but built on principles centuries older, the
contemporary implementations of competency-based education take advantage of
technological advances for delivery (Nodine, 2016). As with implementations of the
practice, research regarding competency-based education has also been cyclical, with a
greater focus on design and policy than on learners’ characteristics (Kelly & Columbus,
2016). There is little research on the college choice process of adult or non-traditional
learners, even less so for competency-based education enrollees and much of what has
been published focuses on community colleges (Bergerson, 2009; Broekemier, 2002;
159
Kortesoja, 2009; Laanan, 2003; Lansing, 2017; Morrison, 2016; NPEC, 2007; Peek &
Goldstein, 1991; Perna, 2006; Roszawki & Reilly, 2005; Somers, et.al., 2006;
Southerland, 2006). Competency-based education is unique in placing the focus on
mastery of learning rather than the time it takes to develop that mastery (Cuckler, 2016;
Everhart, Bushway, & Schejbal, 2016; Gervais, 2016; Kelchen, 2015, Sebesta, 2016,
Thackaberry, 2016). In relation to college choice, while there have been institutions
offering competency-based education since the 1970s, only in the last five years has it
regained national attention (Fain, 2016; Fain, 2015; Fleming, 2015; Kelchen, 2016;
Mitchell, 2015; Nodine, 2016; Public Agenda, 2015), thus it is a growing field. A full
discussion of the history of competency-based education, including its many definitions,
as well as the construct of college choice can be found in the literature review in
Chapter Two.
Methodology
This study utilized a quantitative analysis of secondary survey data I collected in
2016. The survey consisted of 27 close-ended questions and 6 open-ended questions
regarding a range of topics from learner demographics to work experiences and the
learners’ college search process. The survey was distributed via a Survey Monkey
(www.surveymonkey.com) link to 5,142 learners across four higher education
institutions (three public, one private/non-profit). The survey was distributed to all
learners enrolled in the programs at participating public institutions (1,142) and
160
garnered a 5.95% response rate (68 responses). The survey was distributed to a
demographically representative sample of learners at the private/nonprofit institution
(4,000) and garnered an 8.82% response rate (353 responses). The surveys were
distributed between July 2016 – October 2016 due to varying approval times by the
Institutional Research Boards at the participating institutions. A full discussion of the
survey methodology can be found in Chapter 3.
The analyses were run utilizing SPSSTM, NVivo, and human coding. Descriptive
statistics, ordinary least squares regressions, and quantitative content analysis were
conducted to explore the following research questions:
1. What are the characteristics of competency-based education learners?
2. Do characteristics of competency-based education learners predict enrollment
motivators?
3. Do characteristics of competency-based education learners predict satisfaction
with their decision to enroll?
4. Do the enrollment motivators predict competency-based education learners’
satisfaction with their decision to enroll?
5. What is the college choice process for competency-based education learners?
A full discussion of the statistical techniques utilized can be found in chapter 3.
161
Discussion of the Research Results
This section will focus on a discussion of the results of conducted analyses and
how they answer each of the research questions. The discussion will be arranged by
research question, as chapter 4 was, for continuity of format. Relevant literature will be
highlighted as it relates to the analysis of these data.
Research Question #1
What are the characteristics of competency-based education learners?
This research question was explored via descriptive statistics. A full discussion of
the results can be found in chapter 4 however in this section I will highlight a few salient
points. Taking a composite view of these data, the typical competency-based education
learner is a nearly 39-year-old (M=38.78, SD = 10.03), married (66.2%), white (84.4%),
Non-Hispanic (89.6%) female (70.2%) who has been out of high school for just over 20
years (M=20.72, SD=10.25). She lives in a different location than her current institution
(68.5%) and has studied at a prior college (95.7%), including study in her current
discipline (61%). She is slightly less likely to be a first-generation student (51.2%) than
she is to be the first in her family to go to college. She is also more likely to be eligible
for a Pell Grant (48.8%) than not. She is employed full time (71.4%), works an average
of 38 hours a week and has worked for nearly 10 years (M=9.63, SD=9.28) in her field of
study. A visual representation of this composite profile can be found in Figure 5.1.
162
Many of these data are consistent with Clinefelter and Aslanian’s 2017 study of
online college students. They found their students to be a majority white (63%), a
majority female (75%), and enroll full-time in college (64%) while also working full-time
(49%) (Clinefelter & Aslanian, 2017). Additionally, in his 2016 study of enrollment in
competency-based education programs, Kelchen (2016) found that 65% of the
undergraduate students in his nine institutions were white, and 55% were female. This
is comparable to the findings of the current study. The fact that many of the students,
in all of these studies, were female could be indicative of the actual population of
competency-based education enrollees, or it could be that females are more likely to
respond to online surveys as was found by Smith (2008).
Parsons, Mason & Soldner (2016) found that 70% of competency-based
education enrollees in the institutions they studied had prior college experience. The
results of this study indicate an increase in this, which may be due to difference in the
institutions studied or could be due to increased marketing to learners promoting
degree completion for those with some college and no degree.
Additionally, these results indicate that the majority of the learners work full-
time while attending school. Carnevale, Smith, Melton, and Price (2015) note that the
“contemporary “average” student works” (p. 20) and though this was written right as
the economy was making a recovery, the authors do not feel more students working is a
“response to cyclical economic factors” (p.20). Stevens (2014) also found that 81% of
the learners in his study of perceptions, attitudes, and preferences of adult learners
163
report they work 40 hours a week or more. Working while learning signals the flexibility
of competency-based education and the ability to apply their experiential learning to
their academic studies as important. This finding is supported by the internal campus
/academic environment elements outlined in Bergman’s (2012, p.20) model of adult
learner persistence in degree completion programs which include flexible course
options and prior learning assessment. Bergman, Rose, and Shuck (2015) further
support these elements as important to adult learners through an examination of
relevant literature in validating Bergman’s 2012 model. This finding is additionally
reinforced, and discussed further, by learners’ responses in research question five.
Another interesting finding from this analysis is that 8.1% of respondents do not
know if they are eligible for a Pell Grant. A possible explanation for this is that the
complexity of completing the Free Application for Federal Student Aid (FAFSA) has been
shown to prevent learners from applying and even attending college (Dynarski &
Wiederspan, 2012). The process and benefits of Pell Grants and other financial aid are
not well communicated to adult learners according to Bowers and Bergman (2016),
which could also be a contributing factor to those students not knowing and/or applying
for federal financial aid. The data on Pell Grant recipients (48.8%) in this study is slightly
higher than that which Kelchen (2016) reported for several institutions (ranging
between 42-44%) but is not alarmingly higher, especially considering the data he used
were from 2013, therefore collected three years prior to these data.
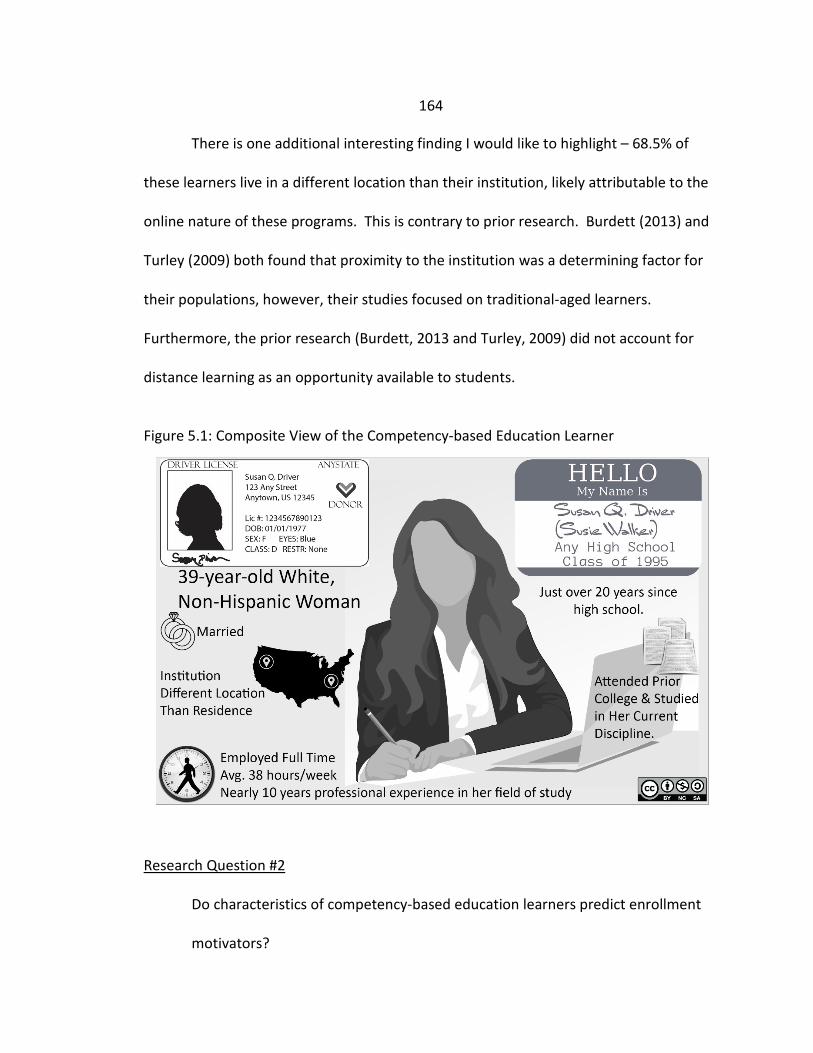
164
There is one additional interesting finding I would like to highlight – 68.5% of
these learners live in a different location than their institution, likely attributable to the
online nature of these programs. This is contrary to prior research. Burdett (2013) and
Turley (2009) both found that proximity to the institution was a determining factor for
their populations, however, their studies focused on traditional-aged learners.
Furthermore, the prior research (Burdett, 2013 and Turley, 2009) did not account for
distance learning as an opportunity available to students.
Figure 5.1: Composite View of the Competency-based Education Learner
Research Question #2
Do characteristics of competency-based education learners predict enrollment
motivators?
165
A series of multiple linear regression models were estimated to examine the
relationships between learners’ characteristics and work-life experiences on each of five
enrollment motivators. The motivators included modality, learning goals, new career,
professional goals, and social goals. The first model looked only at demographic
characteristics inherent to the student, whereas, the second model added the work-life
characteristics of these learners. For the modality, or learners’ preference to learn
online or face-to-face, enrollment motivator, neither model was significant, indicating
that the learners’ characteristics do not predict this motivator. Learning goals, or a
learners’ desire to become more knowledgeable, was also not significant for either
model, indicating the learners’ characteristics were not predictive.
For the new career motivator which focuses on a learners’ wish to try a new
career, both models were significant. In both models, it was found that those
identifying in the Asian/Native Hawaiian/Other Pacific Islander race category were more
likely to be motivated by new career possibilities than whites. Perhaps more interesting
though are the other variables which influence the new career motivator – prior study in
the discipline and years of professional experience. Those with prior study in the
discipline are more likely to be motivated by a new career. This aligns with Thomas
(2001) who found that reentry college women, those who had not completed their
higher education in the traditional timeframe and are pursuing it later, were motivated
to return by career advancement possibilities. Years of professional experience was
found to have a negative relationship with the new career motivator. I interpret this as
166
the longer the professional experience, the less likely the learner is to be motivated to
enroll in competency-based education by the possibility of trying a new career. This
may be attributable to the ability of learners to apply college-level learning gained
outside the classroom, through work or other experiences, to pursuit of a competency-
based education degree (Tate & Klein-Collins, 2015).
Next, we will explore the professional goals motivator which focuses on one’s
current career and job security. Results indicate that demographic characteristics were
not significant predictors of the professional goals motivator. The results of the second
model, exploring the work-life characteristics was significant. Given the nature of this
motivator, it is unsurprising the unemployed were not as motivated as those employed
full time by professional goals.
The social goals motivator focuses on learners’ inclination to make a difference
in society and set an example by which to encourage their friends and family to pursue
higher education. These results show that women are more likely to be motivated by
social goals, or the desire to be the example, than are men. This desire aligns with the
extant research that shows a mother’s educational attainment is indicative of the
educational success of their children (Atwell et al., 2007; Haleman, 2004; Yakaboski,
2010). As we build outreach regarding competency-based education, it will be
important to highlight the ripple effect a mother’s educational attainment has on their
children, thereby reinforcing their motivation to enroll.
167
Additionally, Hispanics are more likely to be motivated by social goals than their
Non-Hispanic peers. Similarly Vega (2017) found that encouragement from friends and
family was an important factor for Latina/o transfer students. The findings that women
and Hispanics are more motivated by social goals is important for the field as they
indicate a pathway to increase attainment by underrepresented groups – through their
social networks. These learners are motivated to pursue higher education by setting an
example for those in their community, which has the dual effect of keeping these
learners enrolled and encouraging new learners to enroll. Practitioners should take
note of this finding and apply it in crafting programs to nurture those community
connections by providing current learners with the tools to share their
accomplishments.
Research Question #3
Do characteristics of competency-based education learners predict satisfaction
with their decision to enroll?
Descriptive statistics and ordinary least squares regressions were utilized to
investigate this research question. The descriptive statistics show that students are
very satisfied with their decision to enroll in competency-based education. 88.1% of the
respondents stated they are either very or extremely satisfied with their decision to
enroll in competency-based education. This is consistent with the results of Rivers &
Sebesta (2017) who found that 86% of graduates in the Texas Affordable Baccalaureate
(TAB) program at Texas A&M University – Commerce (a competency-based education
168
program) were very satisfied with their educational experience. Rivers & Sebesta’s
(2017) research was conducted with graduates of the program, however, their learners
also made a choice to enroll in the program and were ultimately satisfied with the
experience they chose. Satisfaction with their decision to enroll in competency-based
education is an important indicator of whether a learner will persist or not, which is
important to meeting the national attainment goals put forth by former President
Obama (2009) and educational investors such as Lumina Foundation (2009).
Two models of multiple regression analysis – one which investigated only
demographic characteristics, the other added work-life characteristics as well - were
utilized to investigate if learners’ characteristics contribute to their satisfaction with
their decision to enroll in competency-based education. Neither of the regression
models were significant, indicating that neither learners’ demographic or work-life
characteristics are predictors of their level of satisfaction. This finding could be related
to the fact that all learners were at least slightly satisfied, none of them indicated they
were not satisfied with their decision to enroll in competency-based education. This
finding is important for institutions to consider as they weigh whether or not to offer
programs via competency-based education.
Research Question #4
Do the enrollment motivators predict competency-based education learners’
satisfaction with their decision to enroll?
169
A series of ordinary least squares regression analyses were utilized to investigate
whether enrollment motivators predicted competency-based education learners’
satisfaction with their decision to enroll. Each enrollment motivator was investigated
individually, and then significant enrollment motivators were explored together. The
results indicate that the modality, learning goals, and social goals enrollment motivators
significantly, positively contribute to learners’ satisfaction with their decision to enroll in
competency-based education. This is interesting in contrast with findings that will be
discussed as part of research question five, where learners’ most cited reason for
returning to college as career advancement. Learners’ in Stevens (2014) study also
reported that “career advancement, promotion, and employability for school” (p.71)
were factors influencing their decision to attend higher education. Understanding the
enrollment motivators which significantly contribute to learners’ satisfaction with their
decision to enroll is important for competency-based education practice because
attracting learners with the correct motivators could contribute to satisfaction which
could lead to persistence to a degree.
Also intriguing in these analyses are the consistent appearance of unknown
ethnicity having a negative effect on learners’ satisfaction with their decision to enroll
when compared to Non-Hispanics. This could be due to the low response number in
this cell or it could have broader implications on learners’ satisfaction.
In the analyses which combined the three significant enrollment motivators to
determine their effect on learners’ satisfaction, only two of the motivators maintained
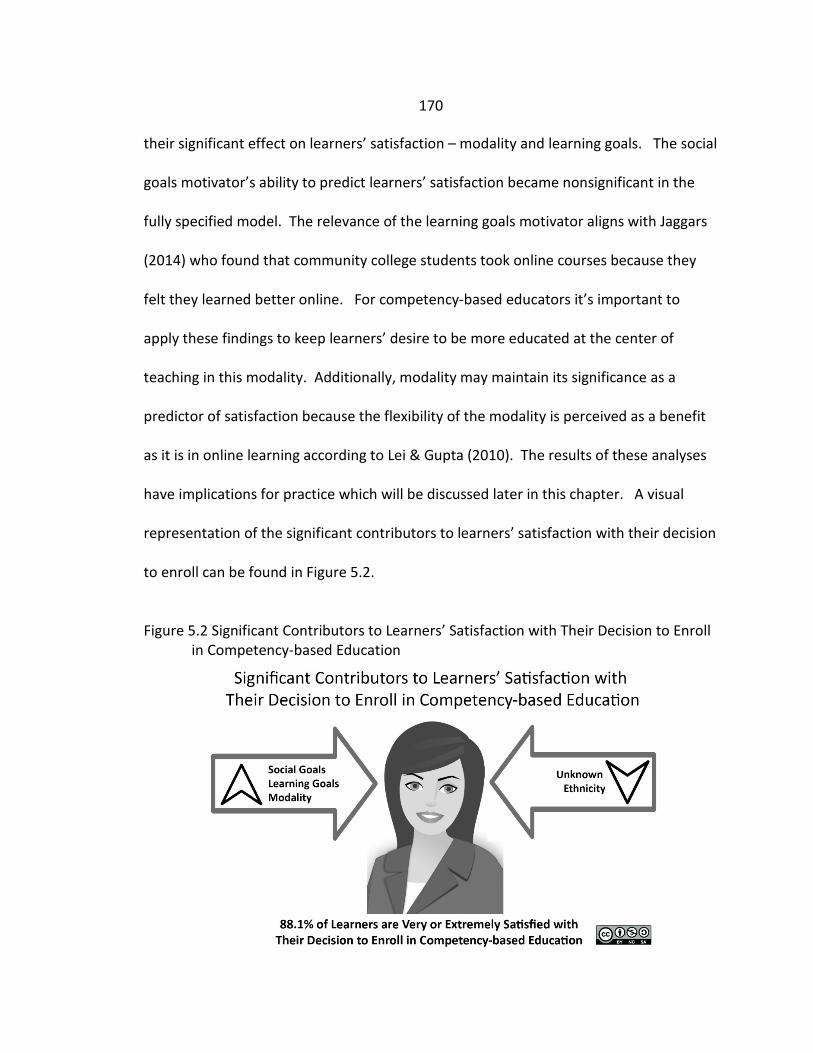
170
their significant effect on learners’ satisfaction – modality and learning goals. The social
goals motivator’s ability to predict learners’ satisfaction became nonsignificant in the
fully specified model. The relevance of the learning goals motivator aligns with Jaggars
(2014) who found that community college students took online courses because they
felt they learned better online. For competency-based educators it’s important to
apply these findings to keep learners’ desire to be more educated at the center of
teaching in this modality. Additionally, modality may maintain its significance as a
predictor of satisfaction because the flexibility of the modality is perceived as a benefit
as it is in online learning according to Lei & Gupta (2010). The results of these analyses
have implications for practice which will be discussed later in this chapter. A visual
representation of the significant contributors to learners’ satisfaction with their decision
to enroll can be found in Figure 5.2.
Figure 5.2 Significant Contributors to Learners’ Satisfaction with Their Decision to Enroll
in Competency-based Education
171
Research Question #5
What is the college choice process for competency-based education learners?
This question was investigated utilizing a quantitative content analysis which employed
human coding as well as computer-aided text analysis (CATA) to examine learners’
responses to six open-ended survey questions. As a methodological reminder,
responses to these questions could be coded in multiple categories. Some learners
gave very detailed responses that encompassed multiple categories. This section will be
arranged by question for cohesion with the prior formatting.
Survey Question 1: “Was there anything specific that made you decide you
wanted to go to or return to college before you enrolled in your competency-based
education program?”
The top reason uncovered in the coding process was career advancement,
followed by personal goals, and the desire to have a degree. In contrast to the
literature, which focuses on traditional aged college student choice processes such as
Hossler & Gallagher (1987), predisposition or personal background were mentioned
infrequently as a reason that made these learners decide to attend college. In the
present study both the quantitative and the qualitative data point to career
advancement as a reason learners’ chose to enroll in competency-based education. A
2016 report from the PAR Framework, a division of Hobsons, supports career
advancement as an enrollment factor for post-traditional learners (Watt & Wagner,
2016). Additionally, Merriam et al. (2007) found that when asked to indicate the main
172
reason for participating in adult education, learners “most commonly cite job-related
motives” (p. 62).
Survey Question 2: “Where did you begin your search to start or return to
college?”
The overwhelming top starting point revealed in the content analysis was
online/the Internet (166). This finding is unsurprising given that these programs all
operate online. This finding is supported by research from the Pew Research Center
which shows that 88% of adults in the U.S. utilize the internet (Pew Research Center,
2016). Prior research on web utilization and college selection (Burdett, 2013;
Christiansen, et al, 2003) also supports this study’s finding that many students utilize the
internet/web-based resources to gain a better understanding of the institution they are
considering.
Many students (71) began their search through word of mouth, many citing
colleagues as the source while others started looking at local colleges/universities (67).
Beginning a search locally is supported by the work of Clinefelter and Aslanian (2017)
who report that 72% of their participants live within 100 miles of a campus center for
the institution they attend. Though students reported starting their search at a local
college/university, this study also shows that 68.5% of respondents do not live in the
same location as their institution. The present study did not inquire if that was more or
less than 100 miles away – which could be an interesting question for further research.
173
Survey Question 3: “What type(s) of information did you look for in this
process?”
192 participants in this survey declared cost/affordability of the program was
what they looked for in their process. This is consistent with Clinefelter and Aslanian
(2017), who showed that 61% of their respondents ranked tuition/fee information in
their top three decision factors. Bergerson (2009) also indicated that learners’ college
decisions are shaped by the cost and return on investment they perceive in pursuing
college. Merriam et al. (2007) share “the two most often cited reasons for
nonparticipation are lack of time and lack of money” (p.65). These authors also note
these responses are seen as “socially acceptable reasons for not doing something”
(Merriam et al., 2007, p. 65).
True to research performed by Noel-Levitz and Council for Adult & Experiential
Learning (CAEL) (2011) and Ruffalo Noel Levitz (2016), 108 of the learners in the current
study (N=97) cited availability of the program of study in which they were interested as
an important factor, alongside the flexibility of the program. This desire to have a
flexible program could be related to positive effect of the modality motivator on
learners’ satisfaction with their decision to enroll. The flexibility they realize after
enrolling could signal alignment with their motivator and result in satisfaction with their
decision to enroll. Additionally, these learners sought out information on the time it will
take them to complete the degree. All these findings are supported by Kasworm (2003)
who found that adult undergraduates enroll in “a college that is readily accessible,
174
relevant to current life needs, cost-effective, flexible in course scheduling, and
supportive of adult lifestyle commitments” (p.7). In a finding that will be much to the
chagrin of U.S. News & World Report, few of these learners (N=5) cited consulting
rankings in their information gathering phase.
Survey Question 4: “Who, if anyone, was involved in this search process with
you?”
Participants in this research were overwhelmingly independent in their college
search process. 188 learners reported that no one helped them in their search process.
Those who did seek support in their college choice process most often sought the
guidance of their spouse/significant. Other confidantes noted in the responses are
friends and co-worker/supervisor. The average age of these students is over 38 years
old, therefore it is not surprising that only low numbers (N=9) reported seeking out the
help of a parent.
Survey Question 5: “Please share why you chose the program you are currently
enrolled in.”
This question was intended to garner responses about the academic program
the learners chose, however the learners’ responses indicate a different interpretation
of the question. The top cited reason for enrolling is career related (N=141). This result
could be aligned to the program of study but there is no direct evidence of this. Many
learners (N=120) reported price/affordability as their reason for enrolling, which also
175
seems to depart from the intention of the question. Another large group of learners
(N=125) reported their reason for choosing their program was because it works with
their life – it’s flexible and convenient which is consistent with findings in the extant
research (Porter & Reilly, 2014; Rivers & Sebesta, 2016).
Survey Question 6: “Which of your skills or experience were most helpful in
preparing you for this educational experience? Explain.”
A large proportion of respondents (N=133) shared career experiences, and the
knowledge, skills, and abilities built through those experiences are what prepared them
best for a competency-based education program. This is consistent with Tate and Klein-
Collins (2015) who shared that learners may be attracted to competency-based
education program because of the ability to apply their experiential learning for college
credit.
An additional theme of responses from these learners fall under grit –
encompassing the categories of perseverance, focus, life experiences, self-motivation,
and independence of learning. Duckworth, Peterson, Matthews, & Kelly define grit as
“perseverance and passion for long-term goals” (2007, p. 1087). A smaller number of
respondents reported a key trait in their enrollment decision is perseverance (9)
however, it would be quite difficult to imagine grit without self-motivation (52) the
highest category in this theme. Silver-Pacuill & Reder (2008) in their investigation of
skills required for independent online learning note that self-directed skills are not only
valuable for online learners but can promote success in these types of programs as well.
176
Since learners report self-motivation as an important skill in supporting their
participation in competency-based education, and the programs are independent,
online learning, it could be a signal for potential success in the program.
A Look at Themes from the Survey Questions. Cited in several of the responses
to open-ended questions, affordability is a key issue for these competency-based
education learners. It is also an issue higher education has actively been addressing
since at least the Spellings Commission on the Future of Higher Education report was
published in 2006 (U.S. Department of Education). Unfortunately, a decade later,
Soares, Steele, Wayt (2016) point out our continued struggle with affordability. They
define the root of the problem as “the absence of a convention, a widely accepted
algorithm, for constructing a metric that adequately reflects the concept” (p. 58, Soares
et al., 2016). From the present study, we can glean that keeping competency-based
education affordable makes it a viable opportunity for these adult learners. Thinking
back to Susan, whose story opened this paper, affordability was certainly a factor in her
choice to pursue higher education.
Another persistent theme relates to careers – both the pursuit of new or
improved careers through education or the ability of experience to support learning. In
the post-traditional world, students are less likely to take a straight path through
postsecondary education (McCormick, 2003). As these learners move in and out of
work and learning, the ability of institutions to review experiential learning, accept
177
transfer credit, and accommodate the ever-changing needs of the learners will be
crucial to their long-term success.
Recommendations from Study
This section will outline the recommendations stemming from the results of this
study and a review of the extant literature. Perhaps the most important take away
from this study is recognition that each learner’s path to competency-based education is
their own – they have different reasons for choosing this style of learning and the
specific program they are enrolled in. This aligns with a statement from Burdett (2013)
which states, “The college choice process is multi-faceted and unique to each person so
understanding how individuals make that choice is complicated” (p.36). For
practitioners I would recommend embracing the individuality of college choice process
and providing multiple entry points for learners to engage with competency-based
education. Personalization and flexibility is baked into the core of competency-based
education curriculum, technology, and student support. Adding the opportunity for
students to begin that mindset during their choice process will build the culture and
help learners see their own potential for success in competency-based education.
The findings demonstrate the learning goals and modality motivators are
predictive of learners’ satisfaction with their decision to enroll. Practitioners can use
this knowledge to reconsider the messaging they build around competency-based
education to put greater emphasis on this learning pathway as one that builds
178
knowledge – not just one which recognizes prior learning or is wholly vocationally
focused. As a community supporting competency-based education, we need to put
students desire to become a more knowledgeable person both in general and in their
discipline, at the center of our practice and promotion. As Jirgensons (2015) previously
expressed:
Criticism has been made of direct assessment that it is too business orientated. Its focus is on vocational skills, rather than on higher level cognitive skills that encourage creativity and innovation. While it makes sense to prepare students for the job market and for universities to form collaborative relationships with employers, students require more than just skills, they need to be flexible and creative to manage and stay on top of a dynamically changing society. We cannot foresee future job requirements, but we can help students to deal with change. (p. 145)
In the present study, learners’ responses regarding the importance of the new
career motivator are contradictory. In the descriptive statistics on enrollment
motivators, new career has the lowest mean score (M=3.23, SD=1.32) of all of the
motivators. There was also no statistical significance for the new career motivator
being predictive of a learners’ satisfaction with their decision to enroll. However, on
the open-ended responses it was the number one reason cited for their decision to start
or return to college in a competency-based education program. What this indicates for
practitioners is that the current developed messages which focus around competency-
based education being a tool to new career development are resonating with learners
and should not be jettisoned, but perhaps enhanced. Enhanced messages would blend
the importance of building a broad knowledgebase to level up or rise to a new level in
one’s career or to contribute to society in a new way. This is in accord with my prior
179
research on this data (Morrison, 2017) which recommended that practitioners include
allusions to the quality and rigor of the learning in addition to the potential for career
enhancement.
Another key element influencing these learners’ college choice process was the
affordability of the programs they enrolled in. Those costs are reflective not only of the
direct costs for tuition, fees and books, but also the opportunity costs which occur when
a learner pursues higher education. Liberal transfer policies which allow learners to
apply their earned credit and prior learning assessment toward their competency-based
education programs will help learners achieve completion in a timelier manner.
However, to make this happen practitioners need the sensible policy reform which
allows learners to mix enrollment types and be eligible for federal financial aid. It is my
recommendation that provisions for competency-based education operation, in all its
various formats, be considered in the next reauthorization of the Higher Education Act
of 1965.
Finally, it is important for practitioners to recognize competency-based
education learners are a diverse population – though on average these leaners were
nearly 39 years old, the range was from 18 – 70. They do not all fit into the bucket of
‘adult learners.’ The programs appeal to both those coming out of high school and those
with 20 or more years of experience in their profession. Making blanket statements
about these learners, and forming policies based on generalities which affect their
ability to access this modality of learning is harmful to the learner and to our
180
institutions. In order to promote a deeper understanding of the learner characteristics
of competency-based education learners, it is my recommendation that the National
Center for Education Statistics (NCES) update its data collection to allow institutions to
indicate which of their students are pursuing their degrees through competency-based
education as they did for online education within the last decade. This will not only
facilitate better practice, it will facilitate better research.
Limitations
There are several limitations to this study I will address in this section. First, as
mentioned in chapter one, this research is limited by being a secondary data analysis,
which negated the ability to change any of the survey methodology, recruitment of
participants or the survey instrument. Further, while participation of four institutions
produced compelling results, they are not generalizable to the entire ecosystem of
competency-based education.
The results of the survey may also have been influenced by individual
respondents’ interpretations of what the question was asking. For instance, the open-
ended question intended to understand the program of study, based on its responses,
may have been interpreted as the overarching program not their specific disciplinary
study. Additionally, there was a question contained in the survey which stated, “I prefer
student-instructor interaction.” The analysis of these data showed this item to be
nearly evenly bimodal for strongly disagree and strongly agree which indicated learners
181
had two distinct interpretations of what this was intended to measure. These responses
were excluded from further analysis.
Further, it is plausible that the learners at these four institutions were influenced
by the media climate regarding competency-based education. At the time the survey
was distributed there were messages in the popular media of positive reinforcement
that competency-based education is a wave of the future. Additionally, in prior
research (Morrison, 2016) through a content analysis of marketing materials and
promotional videos, I found the themes promoted were reflective of the learners in that
study. It is conceivable that though only a small number cite advertising/marketing in
their open-ended responses, these learners were influenced by the marketing messages
of the institutions they enrolled in, both prior to enrolling and as matriculated students.
Recommendations for Further Research
The first recommendation for further research relates to the earlier mentioned
recommendation that the National Center for Education Statistics (NCES) add
functionality to the Integrated Postsecondary Education Data System (IPEDS) that would
allow for institutions to track their competency-based education learners separately, as
they do their online learners. Once this data is collected, I would recommend there be
annual evaluations of demographics, enrollments patterns and degree completions akin
to the work that the Online Learning Consortium, WCET, and Babson Research Group
have done previously.
182
Additionally, future research should extend the application of the enrollment
motivation survey to a greater number of competency-based education enrollees to
strengthen the model. Developed at the University of Wisconsin – Milwaukee National
Research Center for Distance Education and Technological Advancements (DETA), this
research is the first to validate it through student surveys and analysis.
Finally, to more fully understand competency-based education learners, their
motivations for going or returning to college in this format, and how they made their
college choice, deeper qualitative research is warranted. Understanding the stories,
the use cases and purpose learners possess supports better curricular design, better
policy implementation and helps us, as practitioners, remember that our students have
lives outside our virtual classrooms – they have stories. Quantitative data regarding that
which can be captured in 0s and 1s draws the outlines, but qualitative data adds the
color. As Lewis (2011) stated, “Story is central to human understanding—it makes life
livable, because without a story, there is no identity, no self, no other” (p. 505).
Conclusions
Results from this study show that competency-based education learners choose
to enroll in this type of program for a variety of reasons, including a strong proclivity to
launching new careers and a desire to find an affordable program. They are motivated
to enroll by learning goals, or their desire to become more knowledgeable both in
general and in their specific area of study, as well as professional goals which focus on
183
advancing learners’ current career, being more marketable to future employers, and
increasing their job security. However, only the learning goals and modality (preference
to learn online or face-to-face) enrollment motivators influence learners’ satisfaction
with their decision to enroll.
This study adds to the growing literature regarding competency-based
education, the learners who chose this method of learning, as well as the literature
around college choice processes for students who fall outside of the traditional-aged
student parameters. As an advocate of the power of story, I will conclude this
manuscript with a quote from a participant as s/he explains why s/he chose
competency-based education:
“It was like a glove that fit my hand perfectly. I was able to go to school to get my degree on a time schedule that worked for me. I could spend as few hours a day, or as many as I was able. When things such as my father dying happened, I was able to take a break for a week or two without consequences to my schooling. But even more important, I was able to use the knowledge I had gained in the 20 years I worked in Special Ed to help push some of the classes through faster. I didn't have to spend a few months learning about a subject I already knew well. I could spend 6 weeks on a difficult class, or 2 days on one I knew the information about already, and pass the class quickly. I didn't need the college experience at my age, I needed the education and the degree. I am a self starter, self motivated, and determined. A perfect fit.”

184
REFERENCES CITED
185
Abbott, M., & McKinney, J. (2013). Understanding and Applying Research Design. Hoboken, NJ: John Wiley & Sons, Inc.
Access. (n.d.). in Dictionary.com. Retrieved from:
http://www.dictionary.com/browse/access?s=t Access. (2014, March 10). In The Glossary of Education Reform. Retrieved October 5,
2014 from: http://edglossary.org/access/ American Association of Community Colleges (AACC). (2016, February). Data Points:
Competency-based Education. Retrieved from: http://www.aacc.nche.edu/Publications/datapoints/Documents/DP_Feb.3.pdf
Andersen, J.P., Prause, J., and Silver, R.C. (2011). A Step-by-Step Guide to Using
Secondary Data for Psychological Research. Social and Personality Psychology Compass, 5(1), 56-75. doi: 10.1111/j.1751-9004.2010.00329.x
Apprenticeship. (2015). In Columbia University & P. Lagasse, The Columbia Encyclopedia.
New York, NY: Columbia University Press. Retrieved from http://search.credoreference.com/content/entry/columency/apprenticeship/0
Apprenticeship programs. (2013). In G. Kurian, The AMA Dictionary of business and
management. New York, NY: AMACOM, Publishing Division of the American Management Association. Retrieved from http://proxybz.lib.montana.edu/login?qurl=http%3A%2F%2Fsearch.credoreference.com.proxybz.lib.montana.edu%2Fcontent%2Fentry%2Famadictbm%2Fapprenticeship_programs%2F0
Atwell, P., Lavin, D., Domina, T., & Levey, T. (2007). Passing the Torch: Does Higher
Education for the Disadvantaged Pay Off Across Generations? New York: Russell Sage Foundation.
Bell, S. (2012, March 8). Nontraditional Students Are The New Majority. Library Journal.
Retrieved from: http://lj.libraryjournal.com/2012/03/opinion/steven-bell/nontraditional-students-are-the-new-majority-from-the-bell-tower/#_
Bergerson, A. A. (2009). Special Issue: College Choice and Access to College: Moving
Policy, Research, and Practice to the 21st Century. ASHE Higher Education Report, 35(4), 1-141. doi:10.1002/aehe.3504
186
Bergman, M. (2012). An examination of factors that impact persistence among adult students in a degree completion program at a four-year university. (Doctoral dissertation) (Order No. 3531455). Available from ProQuest Dissertations & Theses Global. (1152022306). Retrieved from https://search-proquest-com.proxybz.lib.montana.edu:3443/docview/1152022306?accountid=28148
Bergman, M., Rose, K., & Shuck, M. (2015). Adult Degree Programs Factors Impacting
Student Persistence. In Holtz, J., Springer, S., & Boden-McGill, C. (Eds.), Building Sustainable Futures for Adult Learners (pp. 27-50). Charlotte, NC: Information Age Publishing, Inc.
Bers, T.H. and Smith, K. (1987). College Choice and the Nontraditional Student.
Community College Review, 15(1), 39-45. B Fleming. (2015, February 17). Mapping the Competency-based Education Universe.
Wake Up Call. Retrieved from: http://www.eduventures.com/2015/02/mapping-the-competency-based-education-universe/
Birnbaum, R. (2004). The End of Shared Governance: Looking Ahead or Looking Back.
New Directions For Higher Education, 2004(127), 5-22. Bok, D. (2013). Higher Education in America. Princeton: Princeton University Press. Book, P. (2014). All Hands On Deck: Ten Lessons From Early Adopters of Competency-
Based Education. Boulder, CO: WICHE Cooperative for Educational Technologies. Retrieved from: http://www.wcet.wiche.edu/wcet/docs/summit/AllHandsOnDeck-Final.pdf
Bounds, H. (2015, June 9). Letter to Accrediting Agency Presidents. Retrieved from:
https://www.insidehighered.com/sites/default/server_files/files/ED%20letter%20to%20accreditors(1).pdf
Bowers, A. & Bergman, M. (2016). Affordability and the Return on Investment of College
Completion: Unique Challenges and Opportunities for Adult Learners. The Journal of Continuing of Higher Education, 64 (3), 144-151. doi: 10.1080/07377363.2016.1229102
Brock, T. (2010). Young Adults and Higher Education: Barriers and Breakthroughs to
Success. The Future of Children, 20(1), 109-132. doi: 10.2307/27795062
187
Broekemier, G.M. (2002). A Comparison of Two-Year and Four-Year Adult Students: Motivations to Attend College and the Importance of Choice Criteria. Journal of Marketing in Higher Education, 12 (1), 31-48. DOI: 10.1300/J05v12n0103.
Brower, A. (2014, November 10). Flexible Option: A Direct-Assessment Competency-
Based Education Model. EDUCAUSE Review Online. Retrieved from: http://www.educause.edu/ero/article/flexible-option-direct-assessment-competency-based-education-model
Burning Glass Technologies. (2014). Moving the GoalPosts: How Demand for a
Bachelor’s Degree is Reshaping the Workforce. Retrieved from: http://burning-glass.com/wp-content/uploads/Moving_the_Goalposts.pdf
Burdett, K.R. (2013). How Students Choose a College: Understanding the Role of Internet
Based Resources in the College Choice Process. (Doctoral Dissertation). Retrieved from ProQuest. (UMI 3590306)
Busch,C., De Maret, P.S., Flynn,T., Kellum,R., Le,S., Meyers,B., Saunders,M., White,R.,
and Palmquist,M. (1994 - 2012). Content Analysis. Writing@CSU. Colorado State University. Retrieved from: https://writing.colostate.edu/guides/guide.cfm?guideid=61.
BZ Sutton. (2016, June 20). Higher Education’s Public Purpose [web log post]. Retrieved
from: https://www.aacu.org/leap/liberal-education-nation-blog/higher-educations-public-purpose
Cabrera, A. F., & La Nasa, S. M. (2000). Understanding the College-Choice Process. New
Directions for Institutional Research, 2000(107), 5-22. doi:10.1002/ir.10701 Camacho, D.J. & Legare, J.M. (2016). Shifting gears in the classroom—movement toward
personalized learning and competency-based education. The Journal of Competency-based Education, 2016 (1), 151-156. doi:10.1002/cbe2.1032
Capella University. (2013) Capella’s FlexPath Receives DOE Approval. Retrieved from:
http://www.capella.edu/blogs/educationmatters/2013/08/14/capellas-flexpath-receives-doe-approval/
188
Carnevale, A., Garcia, T., & Gulish, A. (2017). Career Pathways: Five Ways to Connect College and Careers. Georgetown University Center on Education and the Workforce. Retrieved from: https://cew.georgetown.edu/cew-reports/careerpathways/
Carnevale, A., Smith, N., Melton, M., Price, E. (2015). Learning While Earning: The New
Normal. Georgetown University Center on Education and the Workforce. Retrieved from: https://cew.georgetown.edu/cew-reports/workinglearners/
Carnevale, A., Jayasundera, T., & Cheah, B. (2012). The College Advantage: Weathering
the Economic Storm. Georgetown University Center on Education and the Workforce. Retrieved from: https://cew.georgetown.edu/cew-reports/the-college-advantage/
Carnevale, A. & Rose, S. (2011). The Undereducated American. Georgetown University
Center on Education and the Workforce. Retrieved from: https://cew.georgetown.edu/cew-reports/the-undereducated-american/
Choy, S. (2002). Nontraditional Undergraduates (NCES 2002-012). National Center for
Educational Statistics, U.S. Department of Education. Washington, DC. Retrieved from: https://nces.ed.gov/pubs2002/2002012.pdf
Christensen, C. (2017). Key Concepts: Disruptive Innovation. Retrieved from:
http://www.claytonchristensen.com/key-concepts/ Christiansen, D.L., Davidson, C.J., Roper, C.D., Sprinkles, M.C., & Thomas, J.C. (2003).
Getting Personal with today’s prospective students: Use of the web in the college selection process. College & University, 79(1), 9-14.
CLASP. (2011). Yesterday's Nontraditional Student is Today's Traditional Student.
Retrieved from: http://www.clasp.org/resources-and-publications/publication-1/Nontraditional-Students-Facts-2011.pdf
189
Clerkin, K. and Simon, Y. (2014). College for America: Student-Centered, Competency-Based Education. Change: The Magazine of Higher Learning. November-December 2014. Retrieved from: http://www.changemag.org/Archives/Back%20Issues/2014/November-December%202014/college_full.html
Clinefelter, D. L. & Aslanian, C. B., (2016). Online college students 2016: Comprehensive
data on demands and preferences. Louisville, KY: The Learning House, Inc. Cohen, A. (2014). The Evolution of Institutions in the Westward Expansion. In Goodchild,
L.F., Jonsen, R., Limerick, P., Longanecker, D. (Eds). Higher Education in the American West Regional History and State Contexts. (39-68) New York: Palgrave MacMillan.
College for America (2013). A Milestone for Competency-Based Higher Ed. Retrieved
from: http://collegeforamerica.org/latest/entry/a-milestone-for-competency-based-higher-ed
Competence. (n.d.). in Dictionary.com. Retrieved from:
http://dictionary.reference.com/browse/competence?s=t Competency-based Education Network (C-BEN) (2016). What is Competency-based
Education? Retrieved from: http://www.cbenetwork.org/competency-based-education/
Comrey, A. L. & Lee, H.B. (1992). A First Course in Factor Analysis Second Edition.
Hillsdale, NJ: Lawrence Erlbaum Associates, Publishers. Council of Regional Accrediting Commissions (C-RAC). (2015, June 2). Regional
Accreditors Announce Common Framework for Defining and Approving Competency-Based Education Programs. Retrieved from: http://www.nwccu.org/Standards%20and%20Policies/Policies/PolicyDocs/C-RAC%20CBE%20Statement%20Press%20Release%206_2.pdf
Creswell, J. W. (2013). Qualitative Inquiry & Research Design Choosing Among Five
Approaches. Los Angeles: SAGE Publications, Inc. Cross, P.K. (1978). The Adult Learner. In Cross, P.K. and others, Current Issues in Higher
Education (pp. 1-8). Washington, DC: American Association of Higher Education.
190
Cross, P. K. (1979). Adult Learners: Characteristics, Needs, and Interests. In Peterson, R.E. and Associates (Eds.), Lifelong Learning in America (pp. 75-141). San Francisco, CA: Jossey-Bass, Inc.
Cuckler, I. (2016). Competency-based Education (Re)-Defined: Trends and Implications in
Scholarly Discourses of Higher Education (Doctoral dissertation). Retrieved from ProQuest. (Number 10002589)
Darling-Hammond, L., & Snyder, J. (2000). Authentic Assessment of Teaching in Context.
Teaching and Teacher Education, 16. 523-545. Desrochers, D.M., & Staisloff, R.L. (2016, October). Competency-based Education A
Study of Four New Models and Their Implications for Bending the Higher Education Cost Curve. Retrieved from rpkGROUP at: http://rpkgroup.com/wp-content/uploads/2016/10/rpkgroup_cbe_business_model_report_20161018.pdf
Downey, R.G., & King, C.V. (1998). Missing Data in Likert Ratings: A Comparison of
Replacement Methods. The Journal of General Psychology, 125(2). 175-191. Duckworth, A., Peterson, C., Matthews, M.D. & Kelly, D.R. (2007). Grit: Perserverance
and Passion for Long-Term Goals. Journal of Personality and Social Psychology, 92 (6).
Duncan, A. (2011). Beyond the iron triangle: Containing the cost of college and student
debt. Proceedings from The Annual Federal Student Aid Conference, Las Vegas, NV. Retrieved from http://www.ed.gov/news/speeches/beyond-iron-triangle-containing-cost-college-and-student-debt
Dynarski, S. & Wiederspan, M. (2012). Student Aid Simplification: Looking Back and
Looking Ahead. National Tax Journal, 65 (1), 211-234. Ebersole, J. and Stewart, W. (2011). Courageous Learning. Albany, NY: Hudson Whitman
Publishing. Education. (n.d.). in Dictionary.com. Retrieved from:
http://www.dictionary.com/browse/education?s=t Everhart, D., Bushway, D., Schejbal, D. (2016). Communicating the Value of
Competencies. The American Council on Education. Retrieved from: https://www.acenet.edu/news-room/Pages/Communicating-the-Value-of-Competencies.aspx
191
Fain, P. (2013a, March 19). Beyond the Credit Hour. Inside Higher Ed. Retrieved from: https://www.insidehighered.com/news/2013/03/19/feds-give-nudge-competency-based-education
Fain, P. (2013b, April 22). Credit Without Teaching. Inside Higher Ed. Retrieved from:
https://www.insidehighered.com/news/2013/04/22/competency-based-educations-newest-form-creates-promise-and-questions
Fain, P. (2014a, February 21). Taking the Direct Path. Inside Higher Ed. Retrieved from:
https://www.insidehighered.com/news/2014/02/21/direct-assessment-and-feds-take-competency-based-education
Fain, P. (2014b, October 3). Confusion on Competency. Inside Higher Ed. Retrieved from:
https://www.insidehighered.com/news/2014/10/03/federal-regulators-debate-how-handle-direct-assessment-programs
Fain, P. (2015a, January 13). Experimenting with Competency. Inside Higher Ed.
Retrieved from:https://www.insidehighered.com/news/2015/01/13/feds-move-ahead-experimental-sites-competency-based-education
Fain, P. (2015b, April 15). Education Dept. Approves Two More Direct Assessment
Programs. Inside Higher Ed. Retrieved from: https://www.insidehighered.com/quicktakes/2015/04/15/education-dept-approves-two-more-direct-assessment-programs
Fain, P. (2016, March 30). Competency for the Traditional Student. Inside Higher Ed.
Retrieved from: https://www.insidehighered.com/news/2016/03/30/purdue-u-gets-competency-based-education-new-bachelors-degree?width=775&height=500&iframe=true
Finch, W. (2016). The Adult Learner: A Critical Ally for Economic Development. Lexington,
KY: The Council of State Governments. Retrieved from: http://knowledgecenter.csg.org/kc/content/adult-learner-critical-ally-state-economic-development
Fortino, A. (2012, June 26). “The Purpose of Higher Education: To Create Prepared
Minds.” The EvoLLLution. Retrieved from: https://evolllution.com/opinions/the-purpose-of-higher-education-to-create-prepared-minds/
Gallagher, C. W. (2014). "Disrupting the Game-Changer: Remembering the History of
Competency-Based Education." Change: The Magazine of Higher Learning 46(6): 16-23. doi: 10.1080/00091383.2014.969177
192
Gervais, J. (2016). The operational definition of competency-based education. The Journal of Competency-Based Education, 1(2), 98–106. doi: 10.1002/cbe2.1011
Gilner, J.A., Morgan, G.A., Leech, N.L. (2017) Research Methods in Applied Settings An
Integrated Approach to Design and Analysis. New York: Routledge. Golafshani, N. (2003). Understanding reliability and validity in qualitative research. The
Qualitative Report, 8(4). 597-606. Goodchild, L.F. and Wrobel, D.M. (2014). Western College Expansion: Churches and
Evangelization, States and Boosterism, 1818-1945. In Goodchild, L.F., Jonsen, R., Limerick, P., Longanecker, D. (Eds). Higher Education in the American West Regional History and State Contexts. (39-68) New York: Palgrave MacMillan.
Grant, G. (1979). Implications of Competence-Based Education. In G. Grant, P. Elbow, T.
Ewens, Z. Gamson, W. Neumann, V. Olesen, D. Riesman, On Competence A Critical Analysis of Competence-Based Reforms in Higher Education (p. 1 – 17). San Francisco: Jossey-Bass Publishers.
Gulikers, J., Bastiaens, T., Kirschner, P. (2004). A Five-Dimensional Framework for
Authentic Assessment. Educational Technology Research and Development. 52(3). 67-86.
Haleman, D. (2004). Great expectations: Single Mothers in Higher Education.
International Journal of Qualitative Studies in Education, 17 (6), 769-784. doi: 10.1080/0951839042000256448
Harasim, L. (2000). Shift Happens Online Education as a New Paradigm in Learning. The
Internet and Higher Education. 3(1-2). 41-61. The Hatcher Group. (2014, January). Experimental Sites Concept Paper: Competency-
based Education. Retrieved from: http://www.thehatchergroup.com/cbepaper/ Helmi, A. (2001). An analysis on the impetus of online education: Curtin University of
Technology, Western Australia. The Internet and Higher Education. 4(3-4). 243-253.
Hemsley-Brown, J. & Oplatka, I. (2016). Education Consumer Choice. Basingstoke:
Palgrave Macmillan. doi: 10.1057/9781137497208.0005
193
Hendrickson, L. (2002). Old Wine in a New Wineskin College Choice, College Access Using Agent-Based Modeling. Social Science Computer Review, 20(4), 400-419.
Higher Education Act of 1965. (n.d.) In Wikipedia. Retrieved September 26, 2015 from: Higher Education Act of 1965. (2009). In J. Sreenivasan, Poverty and the government in
America: A historical encyclopedia. Santa Barbara, CA: ABC-CLIO. Retrieved from: http://proxybz.lib.montana.edu/login?url=https://search.credoreference.com/content/entry/abcpga/higher_education_act_of_1965/0?institutionId=7751
Hillman, N., & Weichman, T. (2016). Education Deserts The Continued Significance of
“Place” in the Twenty First Century. American Council on Education. Retrieved from: http://www.acenet.edu/news-room/Documents/Education-Deserts-The-Continued-Significance-of-Place-in-the-Twenty-First-Century.pdf
Hoover, R., & Koerber, A. (2011). Using NVivo to Answer the Challenges of Qualitative
Research in Professional Communication: Benefits and Best Practices Tutorial. IEEE Transactions on Professional Communication, 54(1), 68-82.
Hossler, D., & Gallagher, K.S. (1987). Studying Student College Choice: A Three-Phase
Model and the Implications for Policymakers. College & University, 62 (3), 207-221.
Hossler, D., & Vesper, N. (1993). An Exploratory Study of the Factors Associated with
Parental Saving for Postsecondary Education. The Journal of Higher Education, 64(2), 140-165. doi:10.2307/2960027
Jaggars, S.S. (2014) Choosing Between Online and Face-to-Face Courses: Community
College Student Voices. American Journal of Distance Education, 28(1), 27-38, doi: 10.1080/08923647.2014.867697
Jackson, G. A. (1978). Financial Aid and Student Enrollment. The Journal of Higher
Education, 49(6), 548-574. doi:10.2307/1981139 Johndon, E.B. (2002). Contextual Teaching and Learning What it is and Why it’s Here to
Stay. Thousand Oaks, CA: Corwin Press, Inc.
194
Johnstone, S.M. & Boyd, J.R. (2014). Technology and Distance Education Challenges Facing the American West. In Goodchild, L.F., Jonsen, R. W., Limerick, P. & Longanecker, D. (Eds.) Public Policy Challenges Facing Higher Education in the American West. (143-158). New York: Palgrave MacMillan.
Johnstone, S. & Soares, L. (2014). Principles for Developing Competency-Based
Education Programs. Change: The Magazine of Higher Learning, 46 (2), 12-19, doi: 10.1080/00091383.2014.896705
Jirgensons, M. (2015). Direct Assessment Initiatives within a Lifelong Learning Context.
Procedia Computer Science, 43. 141-146. Kamenetz, A. (2014, October 7). Competency-based Education: No More Semesters?
NPRed. Retrieved from: http://www.npr.org/sections/ed/2014/10/07/353930358/competency-based-education-no-more-semesters
Kasworm, C. (2003). Setting the Stage: Adults in Higher Education. New Directions for
Student Success, 102, 3-10. doi:10.1002/ss.83. Kelchen, R. (2015). The Landscape of Competency-based Education Enrollments,
Demographics and Affordability. American Enterprise Institute. Retrieved from: https://www.aei.org/publication/landscape-competency-based-education-enrollments-demographics-affordability/
Kelchen, R. (2016). Who enrolls in competency-based education? An examination of the
demographics and finances of competency-based education programs. The Journal of Competency-based Education, 1: 48-59. doi: 10.1002/cbe2.1005
Kelly, A.P. & Columbus, R. (2016). Innovate and Evaluate Expanding the Research Base
for Competency-based Education. American Enterprise Institute. Retrieved from: https://www.aei.org/publication/innovate-and-evaluate-expanding-the-research-base-for-competency-based-education/
Key, S. (1996). The Establishment of American Land-Grant Universities. The Journal of
Higher Education, 67(2): 196-220. Klein-Collins, R. (2012). Competency-based Degree Programs in the U.S. Postsecondary
Credentials for Measurable Student Learning and Performance. Chicago, IL: Council for Adult and Experiential Learning.
195
Klein-Collins, R. (2013). Sharpening our focus on learning: The rise of competency-based approaches to degree completion (No. 20). National Institute for Learning Outcomes Assessment.
Kortesoja, S.L. (2009). Postsecondary Choices of Nontraditional-Age Students: Non-
Credit Courses or a Credential Program? The Review of Higher Education 33 (1), 37-65, doi: 10.1353/rhe.0.0109
Laanan, F. S. (2003). Older Adults in Community Colleges: Choices, Attitudes, and Goals.
Educational Gerontology, 29, 757-776, doi: 10.1080/03601270390231184 Lacey, A. & Murray, C. (2015). Rethinking the Regulatory Environment of Competency-
Based Education. American Enterprise Institute. Retrieved from: https://www.aei.org/publication/rethinking-the-regulatory-environment-of-competency-based-education/
Laine, R., Cohen, M., Nielson, K., & Palmer, I. (2015). Expanding student success: A
primer on competency-based education from kindergarten through higher education.
Laitinen, A. (2012). Cracking the Credit Hour. New American Foundation. Retrieved
from: http://newamerica.net/publications/policy/cracking_the_credit_hour Laitinen, A. (2015, August 12). Whatever Happened to the Department’s Competency-
Based Education Experiments? EdCentral. Retrieved from: http://www.edcentral.org/whatever-happened-cbe-experiments/
Lansing, J. (2017). A New Model of College Choice for Distance Learners. Journal of
Educational Technology Systems, 45 (3), 365-389. DOI: 10.1177/0047239516673183
Layne, M., Boston, W., & Ice, P. (2013). A longitudinal Study of Online Learners:
Shoppers, Swirlers, Stoppers, and Succeeders as a Function of Demographic Characteristics. Online Journal of Distance Learning Administration, 16 (2). Retrieved from: https://www.westga.edu/~distance/ojdla/summer162/layne_boston_ice162.html
Lederman, D. (2012, April 30). Credit Hour (Still) Rules. Inside Higher Ed. Retrieved from:
https://www.insidehighered.com/news/2012/04/30/wgu-example-shows-chilly-policy-climate-competency-based-education
196
Leech, N.L., Barrett, K.C., Morgan, G.A. (2011) IBM SPSS for Intermediate Statistics. Fourth Edition. New York: Routledge.
Lei, S. A., & Gupta, R. K. (2010). College distance education courses: Evaluating benefits
and costs from institutional, faculty and students' perspective. Distance Education, 130 (4), 616-631.
Litten, L. (1982). Different strokes in the applicant pool: Some refinements in a model of
student college choice. Journal of Higher Education, 53 (4), 383-402. Lumina Foundation. (2009). Goal 2025. Retrieved from:
http://www.luminafoundation.org/goal_2025 Lumina Foundation (2015). A Stronger Nation Through Higher Education. Retrieved
from:http://www.luminafoundation.org/files/publications/A_stronger_nation_through_higher_education-2015.pdf
Maxwell, J.A. (2012). A Realist Approach for Qualitative Research. Los Angeles, CA: SAGE
Publications, Inc. Merriam, S., Cafferella, R., & Baumgartner, L. (2007). Learning in Adulthood A
Comprehensive Guide Third Edition. San Francisco, CA: John Wiley & Sons, Inc. Mertens, D.M. (1998). Research Methods in Education and Psychology Integrating
Diversity with Quantitative & Qualitative Approaches. Thousand Oaks, CA: SAGE Publications, Inc.
McCants, J. (2003). The Early History of the Higher Education Act of 1965 (Do You Know
TRIO? No. 2). Retrieved from: http://www.pellinstitute.org/downloads/trio_clearinghouse-The_Early_History_of_the_HEA_of_1965.pdf
McCormick, A. (2003). Swirling and Double-Dipping: New Patterns of Student
Attendance and Their Implications for Higher Education. New Directions for Higher Education, 131, 13-24.
197
Mitchell, M., Leachman, M., & Masterson, K. (2016, August 15). Funding Down, Tuition Up State Cuts to Higher Education Threaten Quality and Affordability at Public Colleges. Retrieved from Center on Budget and Policy Priorities website: http://www.cbpp.org/research/state-budget-and-tax/funding-down-tuition-up
Morrison, C.M.K. (2015). [Finding the Right Fit: The Search and Selection Process for
Direct Assessment Program Enrollees]. Unpublished raw data. Morrison, C.M.K. (2015a, August 6). Three A’s Driving the Reauthorization of the Higher
Education Act. WCET Frontiers. Retrieved from: https://wcetfrontiers.org/2015/08/06/hea_hearings15/
Morrison, C.M.K. (2016). Finding the right fit: the search and selection process for direct
assessment program enrollees. The Journal of Competency-based Education. DOI: 10.1002/cbe2.1013
Morrison, C.M.K. (2017, February). What Motivated Students to Enroll in Competency-
based Education. Poster session presented at EDUCAUSE Learning Initiative (ELI) Annual Meeting, Houston, TX.
Muijs, D. (2004). Doing Quantitative Research in Education. London: Sage Publications,
Ltd. National Postsecondary Education Cooperative. Deciding on Postsecondary Education:
Final Report (NPEC 2008-850), prepared by Keith MacAllum, Denise M. Glover, Barbara Queen, and Angela Riggs. Washington, DC: 2007.
National Center for Education Statistics. (2013, January). Section 5. Enrollment in
Postsecondary Degree-granting Institutions: Enrollment by Selected Characteristics and Control of Institution. http://nces.ed.gov/programs/projections/projections2021/sec5c.asp
National Center for Educational Statistics, U.S. Department of Education. Web Tables
Demographic and Enrollment Characteristics of Nontraditional Undergraduates: 2011–12 (NCES 2015-025), prepared by Alexandria Walton Radford, Melissa Cominole, and Paul Skomsvold, RTI International. Washington, DC: 2015
National Center for Education Statistics. (2018, January 29). 2017-2018 Survey Materials
Fall Enrollment for 4-year degree granting institutions. Retrieved from: https://surveys.nces.ed.gov/IPEDS/Downloads/Forms/package_6_74.pdf
198
Neuendorf, K. A. (2017). The content analysis guidebook. Los Angeles: Sage publications. Nielsen, B. (2008, April 29). Stagflation, 1970s Style. Investopedia. Retrieved from:
http://www.investopedia.com/articles/economics/08/1970-stagflation.asp Noel-Levitz and Council for Adult & Experiential Learning (2011). National Adult Learners
Satisfaction-Priorities Report. Retrieved from: http://www.cael.org/pdfs/ali_report_2011
Nodine, T. & Johnstone, S.M. (2015). Competency-Based Education: Leadership
Challenges. Change: The Magazine of Higher Learning, 47:4, 61-66. DOI: 10.1080/00091383.2015.1060101
Nodine, T.R. (2016). How did we get here? A brief history of competency-based higher
education in the United States. The Journal of Competency-based Education, 1, 5-11. DOI: 10.1002/cbe2.1004
Obama, B. H. (2009, February 24). Remarks of President Barack Obama – As Prepared
for Delivery Address to Joint Session of Congress. Retrieved from: whitehouse.gov/the_press_offi… [Link was removed by Trump administration but can be accessed via: web.archive.org/web/2009022813…]
Ordonez, B. (2014). Perspectives in AE—Competency-Based Education: Changing the
Traditional College Degree Power, Policy, and Practice. New Horizons in Adult Education & Human Resource Development, 26 (4) 47-53.
Parsons, K., Mason, J., Soldner, M. (2016, October). On the Path To Succes: Early
Evidence About The Efficacy of Postsecondary Competency-based Education Programs. Washington, DC: American Institutes for Research.
Patton, M. Q. (1987). How to Use Qualitative Methods in Evaluation. Los Angeles, CA:
SAGE Publications, Inc. pp. 116-117. Retrieved from: http://www.southalabama.edu/coe/bset/johnson/oh_master/Ch6/Tab06-05.pdf
Peek, R.P. and Goldstein, A.S. (1991, October-November). Using Time-line Methodology
for Finding Adult student College Selection Information Behaviors: An exploratory study of the methodology. Paper presented at the Association for the Study of Higher Education Conference, Boston, MA.
199
Pell Institute. (2011, December 14). 6-Year Degree Attainment Rates For Students Enrolled in a Post-Secondary Institution. Retrieved from: http://www.pellinstitute.org/downloads/fact_sheets-6-Year_DAR_for_Students_Post-Secondary_Institution_121411.pdf
Perna, L.W. (2006). Studying College Access and Choice: A Proposed Conceptual Model.
In J.C. Smart (ed.), Higher Education: Handbook of Theory and Research, Vol. XXI (99-157). Netherlands: Springer.
Pew Research Center. (2017, January 12). Internet/Broadband Fact Sheet. Retrieved
from: http://www.pewinternet.org/fact-sheet/internet-broadband/ Pitre, P.E., Johnson, T.E., & Pitre, C.C. (2006). Understanding Predisposition in College
Choice: Toward an Integrated Model of College Choice and Theory of Reasoned Action. College and University Journal, 81(2), 35-42.
Porter, S. R., & Reilly, K. (2014). Competency-based education as a potential strategy to
increase learning and lower costs. Washington, DC: HCM Strategists. Poulin, R. and Straut, T. (2016). WCET Distance Education Enrollment Report 2016.
Retrieved from WICHE Cooperative for Educational Technologies website: http://wcet.wiche.edu/initiatives/research/WCET-Distance-Education-Enrollment-Report-2016
Public Agenda. (2015, December). The Competency-based Education Ecosystem
Framework. Retrieved from: http://www.publicagenda.org/media/the-competencybased-education-ecosystem-framework
Reauthorization of the Higher Education Act of 1965, 34 C.F.R. §668.10 (2006).
Retrieved from: http://www.ecfr.gov/cgi-bin/text-idx?c=ecfr&sid=c6dbf7953117d4ce6c48087ad7c495d5&rgn=div8&view=text&node=34:3.1.3.1.34.1.39.10&idno=34
Rivers, C. & Sebesta, J.A. (2017). “Right on the money”: CBE Student Satisfaction and
Postgraduation Outcomes. Journal of Competency-based Education, 2(2). doi: 10.1002/cbe2.1042
Roblyer, M.D., Davis, L., Mills, S.C., Marshall, J., & Pape, L. (2008). Toward Practical
Procedures for Predicting and Promoting Success in Virtual School Students. American Journal of Distance Education, 22(2), 90-109.
200
Roszkowski, M.J. and Reilly, P.J. (2005). At the End of the Day, I Want to Be Close to Home: Adult Students’ Preference for College Proximity to Work and Home. Journal of Marketing for Higher Education, 15 (1), 81-95.
Ruffalo Noel Levitz (2016). 2015-16 adult learners report. Cedar Rapids: Ruffalo Noel
Levitz. Ruffalo Noel Levitz (2015). 2015 Adult Learner Marketing and Recruitment Practices
Benchmark Report. Cedar Rapids: Ruffalo Noel Levitz. Rubin, R. (2011). The Pell and the Poor: A Regression-Discontinuity Analysis of On-Time
College Enrollment. Research In Higher Education, 52(7), 675-692. doi:10.1007/s11162-011-9215-6
Sebesta, J. (2016). Competency-based Education Defined. Retrieved from the Institute
for Competency-based Education website: http://www.tamuc.edu/research/icbe/Images%20ICBE/CBE%20Defined%20Brief%20Final.pdf
Selingo, J.J. (2013). College Unbound: The Future of Higher Education and What It Means
for Students. New York: Houghton Mifflin Harcourt Publishing Company. Shapiro, D., Dundar, A., Ziskin, M., Yuan, X., & Harrell, A. (2013, December). Completing
College: A National View of Student Attainment Rates-Fall 2007 Cohort (Signature Report No. 6). Herndon, VA: National Student Clearinghouse Research Center.
Silva, E. and White, T. (2015). The Carnegie Unit: Past, Present, and Future. Change: The
Magazine of Higher Learning, 47(2), 68-72. DOI: 10.1080/00091383.2015.1019321
Silva, E., White, T., and Toch, T. (2015). The Carnegie Unit A Century-old Standard in a
Changing Education Landscape. Retrieved from The Carnegie Foundation website: http://www.carnegiefoundation.org/resources/publications/carnegie-unit/
Silver-Pacuilla, H. & Reder, S. (2008). Investigating the Language and Literacy Skills
Required for Independent Online Learning. Washington, D.C.: National Institute for Literacy.
201
Sissel, P., Hansman, C., Kasworm, C. (2001). The Politics of Neglect: Adult Learners in Higher Education. New Directions for Adult and Continuing Education, 91, 17-28. doi: 10.1002/ace.27
Smith, W.P. (2008, June). Does Gender Influence Online Survey Participation?: A Record-
linkage Analysis of University Faculty Online Survey Response Behavior. Retrieved from: https://files.eric.ed.gov/fulltext/ED501717.pdf
Snowden, M.L. (2014). Learner-Centered SEM and Competency-Based Education:
Exploring the Learning Frontier of Graduate Enrollment Futures. Strategic Enrollment Management Quarterly, 2 p. 54-75. doi: 10.1002/sem3.20035
Soares, L. (2013, January). Post-traditional Learners and the Transformation of
Postsecondary Education: A Manifesto for College Leaders. Retrieved from the American Council on Education website: http://www.acenet.edu/news-room/Documents/Post-traditional-Learners.pdf
Soares, L., Steele,P., and Wayt, L. (2016). Evolving Higher Education Business Models:
Leading with Data to Deliver Results. Washington, DC: American Council on Education.
Somers, P., Haines, K., Keene, B., Bauer, J., Pfeiffer, M., McCluskey, J., Settle, J., and
Sparks, B. (2006). Towards a Theory of Choice for Community College Students. Community College Journal of Research and Practice, 30(1), 53-67, DOI: 10.1080/1066892050024886.
Southerland, J.N. (2006, November). Formulating a New Model of College Choice and
Persistence. Paper presented at ASHE Annual Conference, Anaheim, CA. Smith, E. (2008). Pitfalls and Promises: The Use of Secondary Data Analysis is
Educational Research. British Journal of Educational Studies, 56(3), 323-339. doi: 10.1111/j.1467-8527.2008.00405.x
Smith, E. (2011). Special issue on using secondary data in educational research.
International Journal of Research & Method in Education, 34(3), 219-221. doi: 10.1080/1743727X.2011.615976
Spady, W.G. (1977). Competency Based Education: A Bandwagon in Search of a
Definition. Educational Researcher, 6(1), 9-14.
202
Stevens, J. (2014). Perceptions, Attitudes, & Preferences of Adult Learners in Higher Education: A National Survey. Journal of Learning in Higher Education, 10(2),65-78.
T Mitchell (2015, Sept. 22). Guidance for Competency Based Education Experimental
Site Released [web log] Retrieved from: http://www.ed.gov/blog/2015/09/guidance-for-competency-based-education-experimental-site-released/
Tabachnick, B. & Fidell, L. (2013). Using Multivariate Statistics Sixth Edition. Boston:
Pearson Education, Inc. Tate, P. & Klein-Collins, R. (2015, October). PLA and CBE on the Competency Continuum.
Chicago, IL: Council for Adult and Experiential Learning. Thackaberry, A.S. (2016, Feb 29). A CBE Overview: The Recent History of CBE. The
Evolllution. Retrieved from: http://evolllution.com/programming/applied-and-experiential-learning/a-cbe-overview-the-recent-history-of-cbe/
The National Research Center for Distance Education and Technological Advancements
(DETA). (2015) DETA Research Toolkit Version 1.0. Retrieved from: http://uwm.edu/deta/toolkits/
Thelin, J. (2011). A History of American Higher Education Second Edition. Baltimore: The
Johns Hopkins University Press. Thomas, V. (2001). Educational Experiences and Transitions of Reentry College Women:
Special Considerationsfor African American Female Students. The Journal of Negro Education, 70 (3), 139-155.
Tierney, W.G. & Venegas, K.M. (2009). Finding money on the table: Information,
Financial Aid, and access to college. Journal of Higher Education, 80(4), 383-388. Turley, R. N. L. (2009). College Proximity: Mapping Access to Opportunity. Sociology of
Education, 82(2), 126-146. doi:10.1177/003804070908200202
203
University of Wisconsin System (2014) UW System receives approval to award federal financial aid for a competency-based UW Flexible Option program. Retrieved from: https://www.wisconsin.edu/news/archive/uw-system-receives-approval-to-award-federal-financial-aid-for-a-competency-based-uw-flexible-option-program/
U.S. Census Bureau. (2016). 2016 American Community Survey, 1-year estimates.
Retrieved from: https://factfinder.census.gov/faces/tableservices/jsf/pages/productview.xhtml?pid=ACS_16_1YR_S1501&prodType=table
U.S. Department of Education. (1999). Distance Education Demonstration Program.
Retrieved from: http://www2.ed.gov/programs/disted/index.html U.S. Department of Education, A Test of Leadership: Charting the Future of U.S. Higher
Education. Washington, D.C., 2006. U.S. Department of Education. (2011, March). College completion tool kit. Washington,
D.C. Retrieved from http://www.ed.gov/college-completion/governing-win. U.S. Department of Education. (2014). Experiments Announced in the July 31, 2014
Federal Register. Retrieved from: https://experimentalsites.ed.gov/exp/approved.html
U.S. Department of Education (2013, March 19). Applying for Title IV Eligibility for Direct
Assessment (Competency-Based) Programs DCL ID: GEN-13-10 Retrieved from: http://ifap.ed.gov/dpcletters/GEN1310.html
Vega, D. (2017). Navigating Postsecondary Pathways: The College Choice Experiences of
First-Generation Latina/o Transfer Students. Community College Journal of Research and Practice. doi: 10.1080/10668926.2017.1360219
Wang, J. (2015). The Student Perspective on Competency-Based Education. Retrieved
from: http://younginvincibles.org/wp-content/uploads/2015/10/CBE-Paper-3-2-2.pdf
Watt, C. & Wagner, E. (2016). Improving Post-Traditional Student Success. Cincinnati,
Oh: Hobsons.
204
Wax, D. & Klein-Collins, B. (2015, October 16). Competency-based Education: A Powerdul way to Link Learning and the Workplace. Evolllution. Retrived from: http://evolllution.com/programming/applied-and-experiential-learning/competency-based-education-a-powerful-way-to-link-learning-and-the-workplace/
Weise, M. R., & Christensen, C. M. (2014). Hire Education: Mastery, Modularization, and
the Workforce Revolution. Clayton Christensen Institute for Disruptive Innovation.
Weise, M. R. (2014). Got Skills. Why Online Competency-Based Education Is the
Disruptive Innovation for Higher Education. EDUCAUSE Review, 49(6), 27-35. Wengrzik, J., Bosnjak, M., Manfreda, K.L. (2016). Web Surveys versus Other Survey
Modes – A Meta-Analysis Comparing Response Rates. Unpublished. Retrieved from: https://doi.org/10.13140/RG.2.1.5166.0405
Wiggins, G. (2011). A True Test Toward More Authentic and Equitable Assessment.
Kappan, 92 (7), 81-93. Wilsey, S. (2013). Comparisons of Adult and Traditional College-Age Student Mothers:
Reasons for College Enrollment and Views of How Enrollment Affects Children. Journal of College Student Development, 54 (2), 209-214.
Yakaboski, T. (2010). Going At It Alone: Single-Mother Undergraduate's Experiences.
Journal of Student Affairs Research and Practice, 47:4, 463-481. DOI:10.2202/1949-6605.6185

205
APPENDICES

206
APPENDIX A
EMAIL REQUEST TO LEARNER PARTICIPANTS
207
APPENDIX A:
Subject Line: What Motivated You to Enroll in <Competency-based Education Institution>? Hello! My name is Cali and I’m working on an education doctorate. I’m really interested in how learners choose their college program, specifically competency-based ones like you’re enrolled in at <Competency-based Education Institution>. I’m writing today to ask you to take a survey about what motivated you to enroll at <Competency-based Education Institution> and how you searched for and ultimately chose that program. To be upfront, I think it will take you about 30 minutes to complete the survey, and due to restrictions of being a graduate student and a small grant I have, I am not able to offer financial incentive for participating in the survey. But, as I did many times as both an undergraduate and graduate student, I considered the time it took me to complete surveys both a form of ‘pay-it-forward’ knowing that I would possibly need people to participate for me later and a time to reflect on my own journey related to the survey questions. If you choose to participate, you will be asked to digitally sign an informed consent, which outlines all of the research procedures, before you can answer any survey questions. In short, it tells you that your participation is voluntary, I will protect any personally-identifiable information you provide and gives you the details to remove yourself from the research at any time. This research will be used for my dissertation and to help the higher education community understand why and how students like you chose a CBE program so that we can make changes to better serve you and students like you. If you choose to participate, here is the link: <Personalized Survey Monkey Link for Institution>. Thanks in advance for sharing your time and experience with me, Cali Cali M.K. Morrison, Doctoral Student Researcher Montana State University
208
APPENDIX B
COLLEGE CHOICE AND COMPETENCY-BASED EDUCATION
LEARNER MOTIVATIONS SURVEY
209
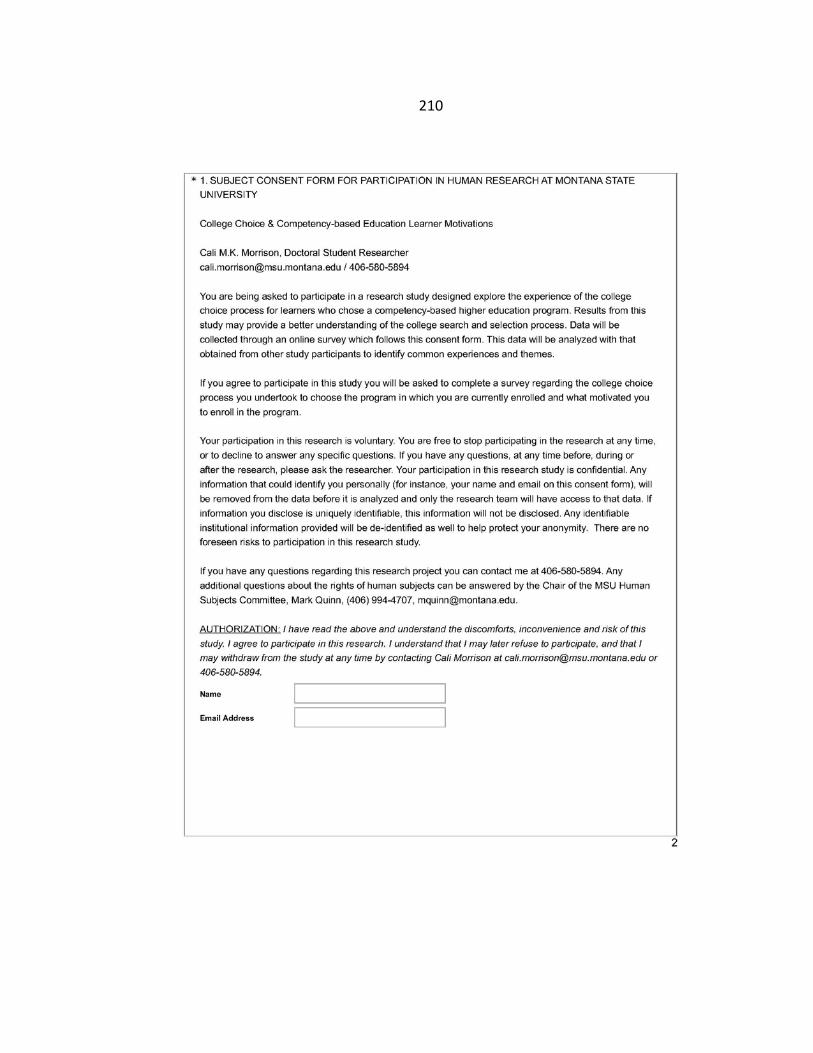
210
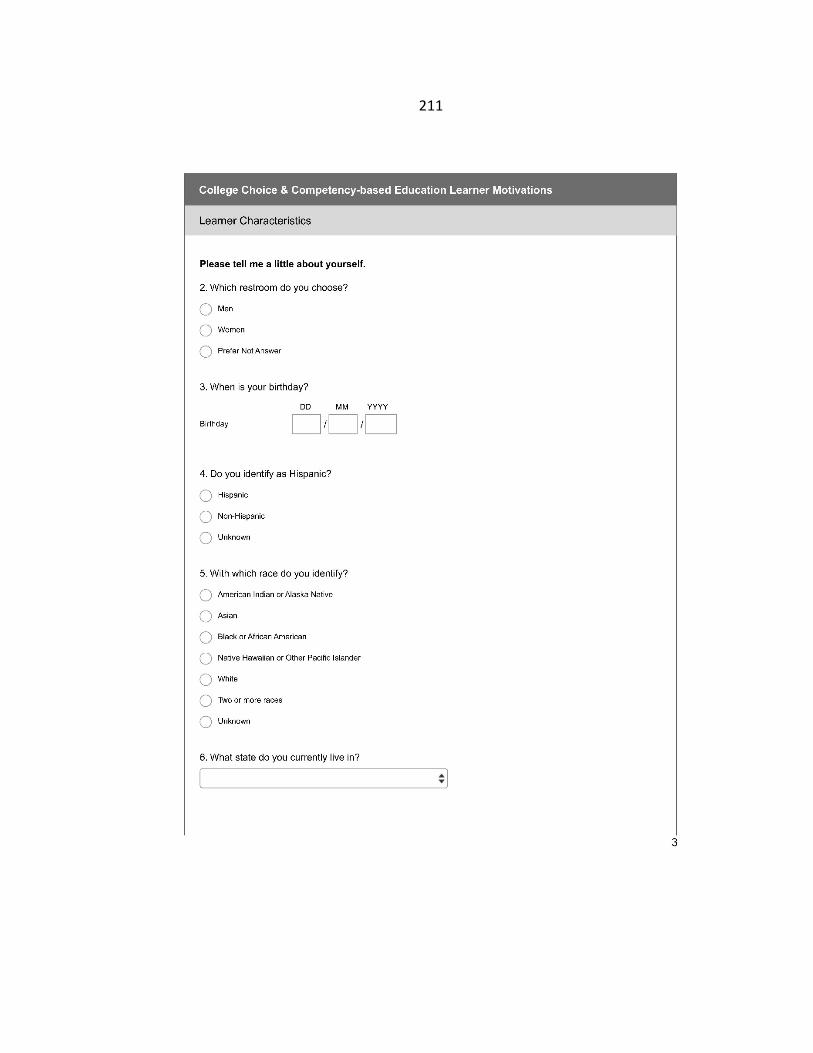
211
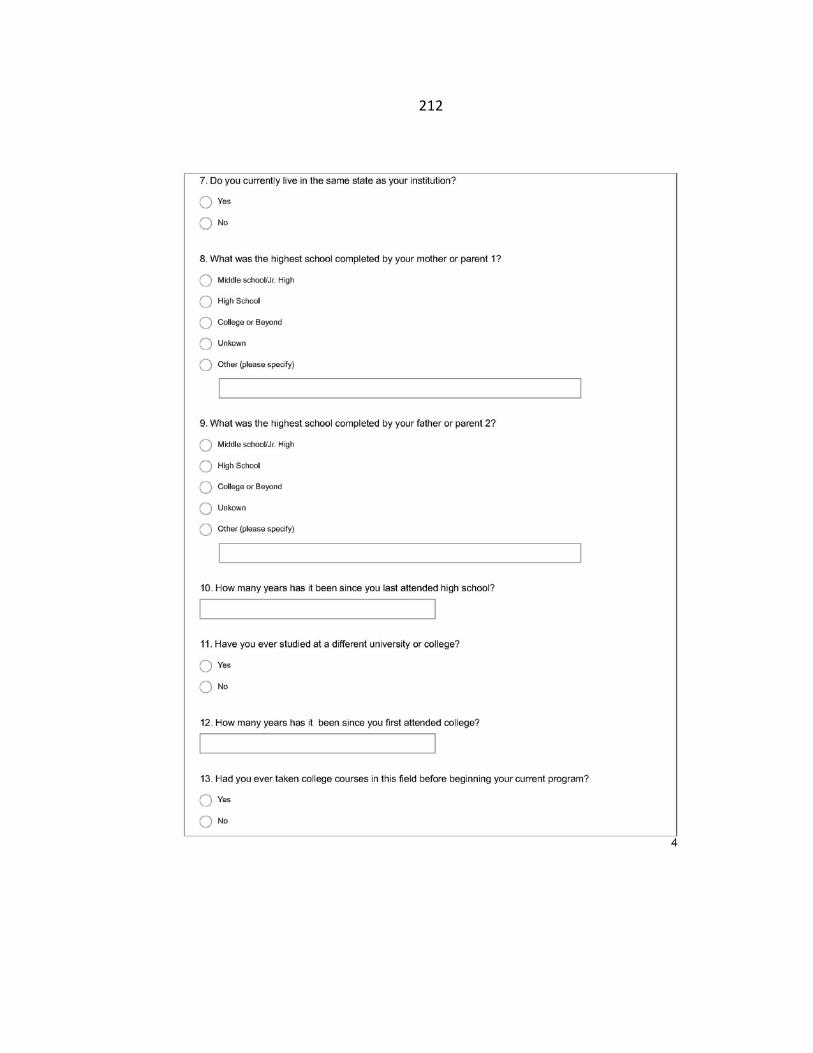
212
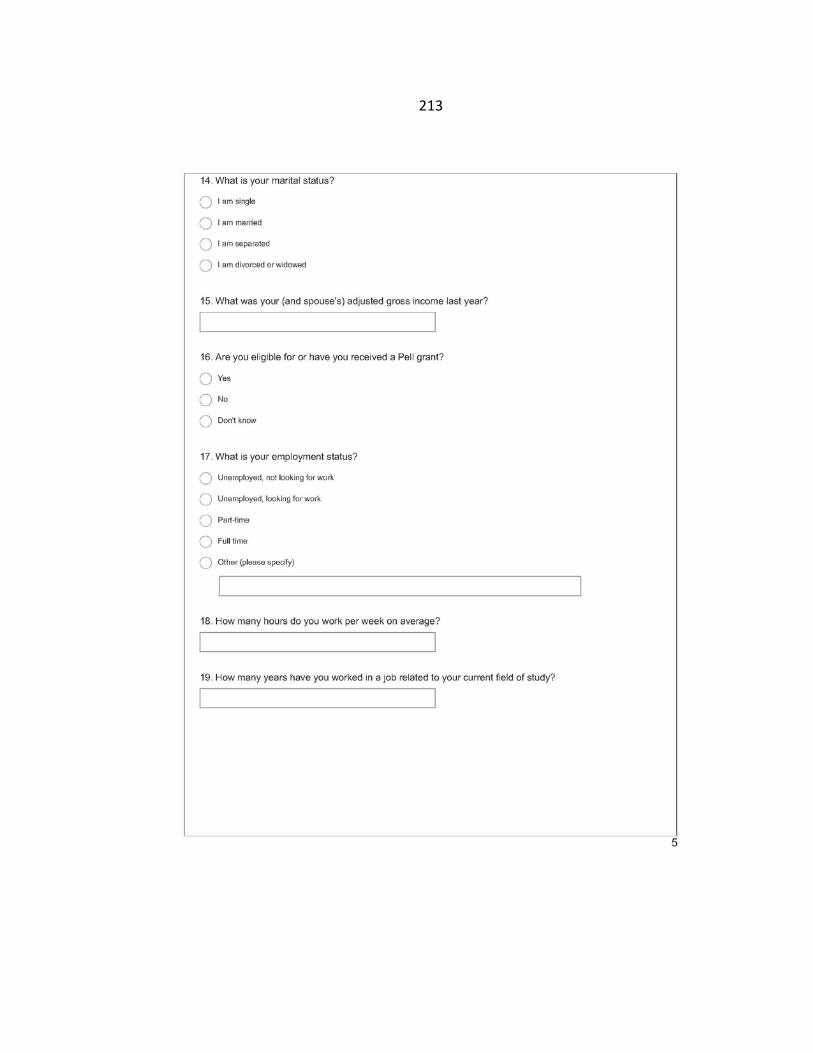
213
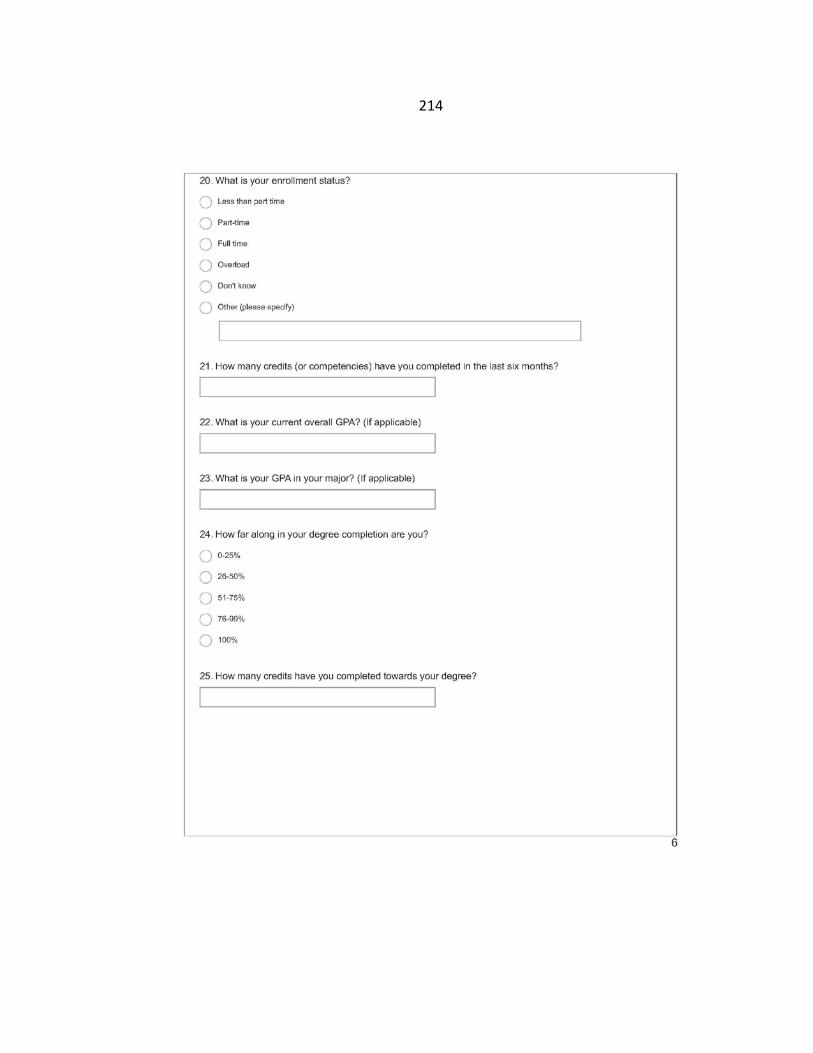
214
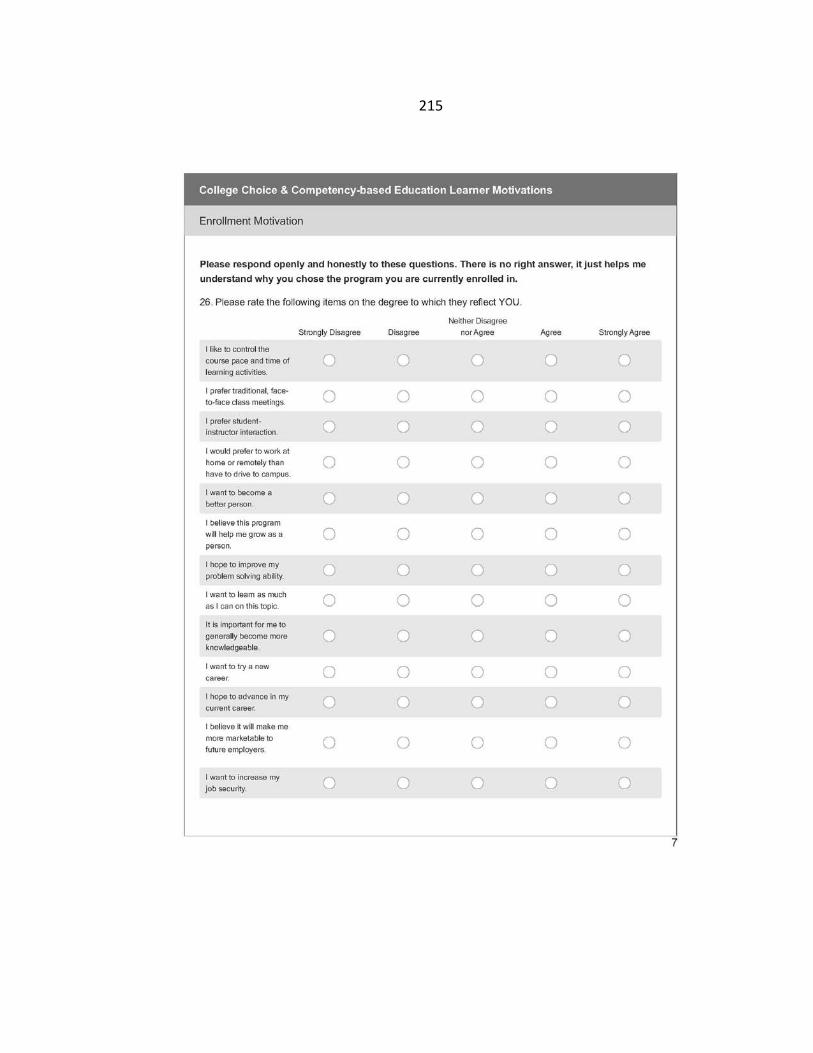
215
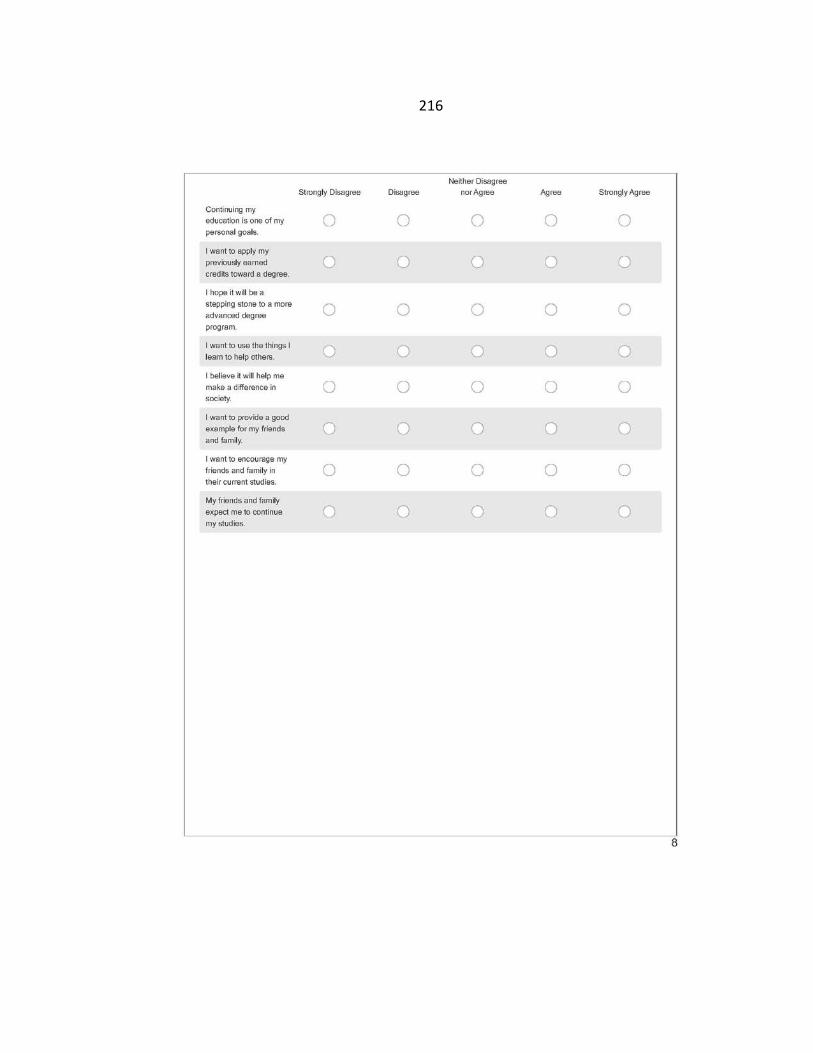
216
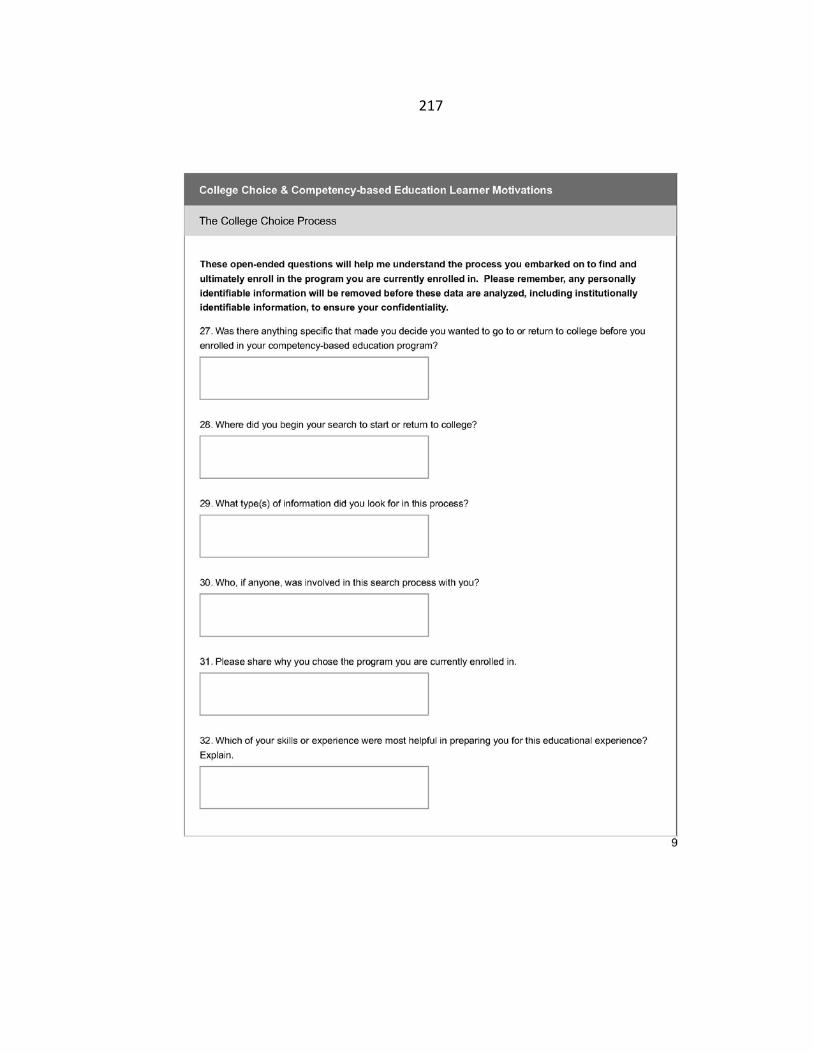
217
218
219