Embed Size (px)
Citation preview

Journal of College Access Journal of College Access
Volume 5 Issue 2 Article 3
12-19-2020
College Choice and Enrollment among Youth Formerly in Foster College Choice and Enrollment among Youth Formerly in Foster
Care Care
Jacob P. Gross University of Louisville, [email protected]
Ellen Stolzenberg University of California, Los Angeles
Alex Williams University of Louisville
Follow this and additional works at: https://scholarworks.wmich.edu/jca
Part of the Higher Education Commons
Recommended Citation Recommended Citation Gross, Jacob P.; Stolzenberg, Ellen; and Williams, Alex (2020) "College Choice and Enrollment among Youth Formerly in Foster Care," Journal of College Access: Vol. 5 : Iss. 2 , Article 3. Available at: https://scholarworks.wmich.edu/jca/vol5/iss2/3
This Article is brought to you for free and open access by the Western Michigan University at ScholarWorks at WMU. It has been accepted for inclusion in Journal of College Access by an authorized editor of ScholarWorks at WMU. For more information, please contact [email protected].
College Choice and Enrollment among Youth Formerly in Foster Care College Choice and Enrollment among Youth Formerly in Foster Care
Cover Page Footnote Cover Page Footnote A version of this article was presented at the 2017 Association for the Study of Higher Education Annual Conference.
This article is available in Journal of College Access: https://scholarworks.wmich.edu/jca/vol5/iss2/3
Volume 5 | December 2020 | Issue 2 8
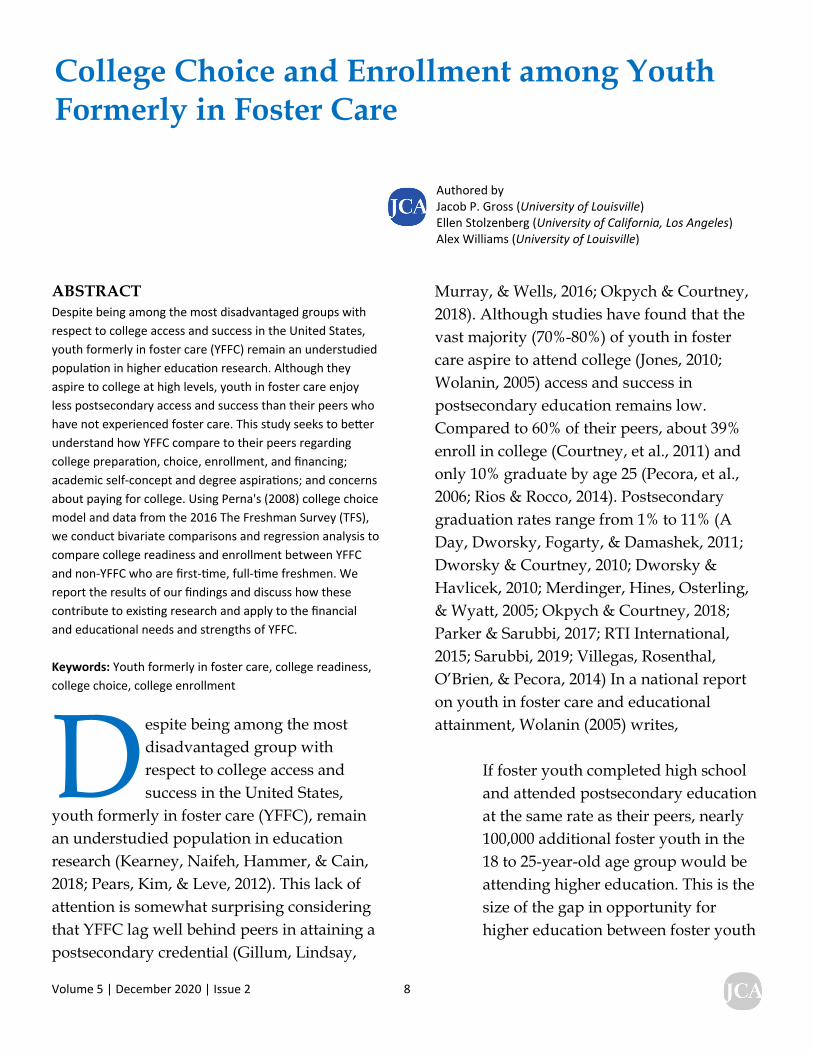
ABSTRACT Despite being among the most disadvantaged groups with respect to college access and success in the United States, youth formerly in foster care (YFFC) remain an understudied popula on in higher educa on research. Although they aspire to college at high levels, youth in foster care enjoy less postsecondary access and success than their peers who have not experienced foster care. This study seeks to be er understand how YFFC compare to their peers regarding college prepara on, choice, enrollment, and financing; academic self-concept and degree aspira ons; and concerns about paying for college. Using Perna's (2008) college choice model and data from the 2016 The Freshman Survey (TFS), we conduct bivariate comparisons and regression analysis to compare college readiness and enrollment between YFFC and non-YFFC who are first- me, full- me freshmen. We report the results of our findings and discuss how these contribute to exis ng research and apply to the financial and educa onal needs and strengths of YFFC. Keywords: Youth formerly in foster care, college readiness, college choice, college enrollment
D espite being among the most disadvantaged group with respect to college access and success in the United States,
youth formerly in foster care (YFFC), remain an understudied population in education research (Kearney, Naifeh, Hammer, & Cain, 2018; Pears, Kim, & Leve, 2012). This lack of attention is somewhat surprising considering that YFFC lag well behind peers in attaining a postsecondary credential (Gillum, Lindsay,
Murray, & Wells, 2016; Okpych & Courtney, 2018). Although studies have found that the vast majority (70%-80%) of youth in foster care aspire to attend college (Jones, 2010; Wolanin, 2005) access and success in postsecondary education remains low. Compared to 60% of their peers, about 39% enroll in college (Courtney, et al., 2011) and only 10% graduate by age 25 (Pecora, et al., 2006; Rios & Rocco, 2014). Postsecondary graduation rates range from 1% to 11% (A Day, Dworsky, Fogarty, & Damashek, 2011; Dworsky & Courtney, 2010; Dworsky & Havlicek, 2010; Merdinger, Hines, Osterling, & Wyatt, 2005; Okpych & Courtney, 2018; Parker & Sarubbi, 2017; RTI International, 2015; Sarubbi, 2019; Villegas, Rosenthal, O’Brien, & Pecora, 2014) In a national report on youth in foster care and educational attainment, Wolanin (2005) writes,
If foster youth completed high school and attended postsecondary education at the same rate as their peers, nearly 100,000 additional foster youth in the 18 to 25-year-old age group would be attending higher education. This is the size of the gap in opportunity for higher education between foster youth
College Choice and Enrollment among Youth Formerly in Foster Care
Authored by Jacob P. Gross (University of Louisville) Ellen Stolzenberg (University of California, Los Angeles) Alex Williams (University of Louisville)
Volume 5 | December 2020 | Issue 2 9
and their peers, and it is the magnitude of the policy problem to equalize opportunities for foster youth (p.7).
The objective of this study is to better understand the postsecondary attainment gap between YFFC and their peers who did not experience foster care (non-YFFC) by illuminating potential differences in college choice and enrollment behaviors between these two groups. Specifically, we ask the following research questions: How do YFFC compare to non-YFFC with respect to academic preparation, college choice, college enrollment behaviors, and finances/financial aid? To what extent does being a YFFC impact academic self-concept, highest planned academic degree (i.e., none to a professional degree or doctorate), and concerns about paying for college? Given the lack of empirical work in this area, these questions are intentionally broad, exploratory in nature, and intended to provide a foundation for future research.
Review of the Literature It is helpful to begin with a brief overview of foster care in the United States. Dependent children whose birth parents are unable to care for them may be temporarily placed in state licensed private homes or institutions. Children may be voluntarily surrendered by the birth parent, but may also be removed by
College Choice and Enrollment of YFFC
the state due to neglect, physical or emotional abuse, unsafe environments, and more. In 2019, the average length of stay in foster care was 19.6 months (Department of Health & Human Services, 2019). Since its inception in the United States in 1853, there has been debate about the structure and efficacy of foster care, with on-going concern about the long-term outcomes for children (McDonald, Allen, Westerfelt, & Piliavin, 1996). Youth in foster care face disproportionately high rates of incarceration (Barth, 1990; Pecora et al., 2003), mental illness, poverty, substance abuse, and low levels of educational attainment (Barth, 1990; Wolanin, 2005). The scope of this study is relatively narrow in terms of foster care outcomes, focusing on educational attainment. Collectively, existing empirical studies (Blome, 1997; Davis, 2006; Day, Dworsky, & Feng, 2013; Dworsky & Courtney, 2010; Harris, Jackson, O’Brien, & Pecora, 2009; Kahne & Bailey, 1999; Rassen, Cooper, & Mery, 2010; Wolanin, 2005) find that youth in foster care face a number of barriers to attaining a postsecondary credential. Youth in foster care are less likely than their peers to complete high school and less likely to be academically prepared for college. For example, Blome’s (1997) analysis of the 1980 High School and Beyond (HS&B) sophomore cohort found that 15% of youth in foster care were enrolled in a college preparatory track compared to 32% of the comparison group. Poor performance on standardized tests by youth in foster care lend further evidence that
Volume 5 | December 2020 | Issue 2 10
these youth face issues of access due to low levels of academic preparation (Frerer, et al., 2013). Once enrolled, youth in foster care may lack the necessary institutional (Dworsky & Perez, 2010; Emerson, 2007) as well as financial support (Merdinger, et al., 2005) necessary for them to graduate from college. Although some college and universities have implemented programs and policies to meet the needs of youth in foster care (Unrau, 2011), most student affairs educators remain unfamiliar with these students’ needs. Financial barriers include lack of support from family to pay for school (Wolanin, 2005) and lack of awareness of financial aid options (Davis, 2006). Collectively, these barriers contribute to low attainment rates. Using data from the National Postsecondary Student Aid Study 2004 (NPSAS:04) and Beginning Postsecondary Students 2001 (BPS:01) Davis (2006) found that 26% of former youth in foster care who entered college in 1995 had obtained a postsecondary credential by 2001 compared to 56% of their peers. Prior research has found similarly low graduation rates. For example, Barth (1990) reported that just three 3 out of 55 youth in foster care in his retrospective study had earned a postsecondary credential (1 AA and 2 BAs). There are no nationally representative datasets of youth in foster care in educational settings (Davis, 2006). Prior research has
College Choice and Enrollment of YFFC
relied on samples drawn from social service programs (e.g., McMillen, et al., 2003), agency records (e.g., Barth, 1990), or research studies aimed at broad understanding of their life course (e.g., the Midwest Evaluation of the Adult Functioning of Former Foster youth, i.e., the Midwest Study). While these studies offer a wealth of information about experience and outcomes of youth in foster care, in some cases the sample sizes (e.g., Barth’s 1990 study included just 55 participants) preclude certain statistical methods. Also, most of these studies were not intended to collect substantial information about students’ postsecondary educational experiences. Even the authors (Day, et al., 2013) of a more recent study using institutional data from a large Midwestern university acknowledge that they lack important variables such as academic performance and financial aid. In addition, no single federal dataset contains the data necessary to model longitudinal education outcomes for youth in foster care. The Children’s Bureau oversees collection of data on youth in foster care. However, these data systems were designed for policy monitoring and reporting purposes, not to provide detailed information about college access and success. The small sample sizes of youth in foster care in National Center for Education Statistics (NCES) datasets limit conclusion on their outcomes. For example, the proportion of youth in foster care in NPSAS:96 to NPSAS:08 ranges from 0.4% to 0.7%. The data analyzed here are the first of
Volume 5 | December 2020 | Issue 2 11
their kind nationally. Conceptual Framework The model of college choice proposed by Perna (2008) serves as the conceptual framework for this study. The model asserts that multiple layers of context, including social, economic, and policy contexts; higher education contexts; school and community contexts; and habitus influence college choice. Habitus, the focus of this study, was first articulated by Pierre Bourdieu (1990) as part of his theory of cultural capital. Habitus is the perceptions, habits, dispositions, and outlook held by individuals as a function of their cultural capital. Put another way, habitus is the feel for the game that individuals develop, with games being what Bourdieu referred to as fields, such as education, religion, law, and other social institutions. This habitus layer encompasses a person’s individual identity, including their demographics, cultural capital, and social capital. Perna’s (2008) model conceptualizes the relationships among habitus and the demand for higher education (e.g., academic preparation and achievement), supply of resources (e.g., family income), and the expectation of benefits and costs. These all influence the college choice process. Method The preceding conceptual framework guides our empirical analysis to answer our research questions about how YFFC compare to non-YFFC with respect to college readiness and college enrollment. First, we conducted
College Choice and Enrollment of YFFC
bivariate comparisons of YFFC to all first-time, full-time (FTFT) freshman that were never in foster care in terms of gender, race/ethnicity, value of college attainment, information about college, and assistance with college processes. Next, we ran a series of ordinary least squares regression models to better understand the relationship between habitus and college readiness and college enrollment. Habitus is operationalized as described above—demographic characteristics, access to information about college, and support in the college readiness and enrollment process. Our focal independent variable is whether a student said they were in foster care after age 13 (more detail below). As such, the variable identifying whether the students had been in foster care after age 13 was force entered first to determine whether there is a relationship between having been in foster care with the outcomes of interest: financial concern, , and academic self-concept. The other independent variables in the regression analyses were added in blocks, using forward entry such that only variables that added to the predictive power of the model would enter. After the foster care variable, a block of demographics and background characteristics associated with the particular outcome were included such as race/ethnicity, sex, summer bridge participation, and number of years studying various subjects in high school. The next block represents financial variables such as type of
Volume 5 | December 2020 | Issue 2 12
College Choice and Enrollment of YFFC
aid received and financial concern. The final block includes general reasons for attending college. Data Data for this study come from the Cooperative Institutional Research Program's (CIRP) Freshman Survey (TFS), administered by the Higher Education Research Institute at UCLA. The 2016 TFS was administered at 253 colleges and universities nationwide and was completed by 171,300 incoming freshmen. The 2016 TFS introduced a new item that asked students to indicate whether they had lived in foster care or as a dependent of the court at any time since they turned 13, and more than 1,000 students (n=1,147) responded in the affirmative to this question. Given that a student who has lived in foster care after age 13 can identify as independent on the FAFSA, analyses of students’ concerns about and strategies for paying for college underscore critical differences between former foster care youth and the national sample of FTFT first-year students. Including only FTFT students produced our sample of 156,608, of which 1,019 reported they had been in foster care or a dependent of the court since age 13. Sample Characteristics With respect to selected demographic characteristics, we found several differences between respondents who were YFFC and those who were not (see Table 1 on page 13). Women were overrepresented among YFFC
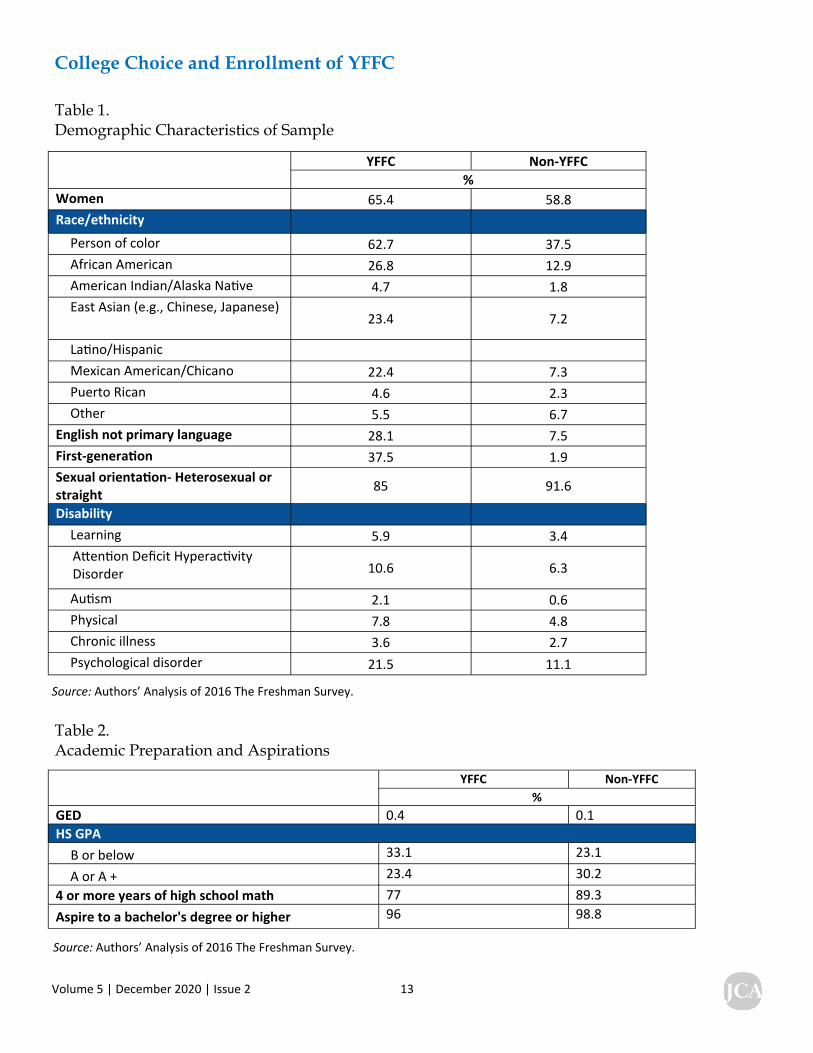
compared to non-YFFC peers. This is somewhat surprising given that according to the latest data from the Adoption and Foster Care Analysis and Reporting System (AFCARS, 2015), females comprised 48% of the youth in foster care in 2015. Students of color were overrepresented among YFFC: about 63% of YFFC in the sample self-identified as a person of color, compared to 37.5% of non-YFFC respondents. African American students represented 26.8% of the YFFC sample and East Asian students represented 23.4%, compared to 12.9% and 7.2% of non-YFFC. For reference, in 2015, 24% of youth in care identified as Black or African American, 22% as Hispanic (of any race), 42% as White, and 1% as Asian (AFCARS, 2015). A higher proportion of YFFC (28.1%) did not identify English as the primary language spoken at home relative to non-YFFC (7.3%). Youth formerly in foster care were also more likely to self-identify as first-generation students (38% compared to 2%). Finally, a lower proportion of YFFC identified as heterosexual or straight compared to non-YFFC (85% compared to 91.6%). See Table 1 on page 13 Respondents who identified as YFFC reported various forms of disability in greater proportion to non-YFFC. About 6% of YFFC reported a learning disability compared to 3.4% of non-YFFC. Attention deficit hyperactivity disorder, autism, physical disability, and chronic illness were also reported by a greater percent of YFFC compared to non-YFFC. Finally, about 22% of
Volume 5 | December 2020 | Issue 2 13
College Choice and Enrollment of YFFC
Table 2. Academic Preparation and Aspirations
Table 1. Demographic Characteristics of Sample
YFFC Non-YFFC %
Women 65.4 58.8 Race/ethnicity
Person of color 62.7 37.5 African American 26.8 12.9 American Indian/Alaska Na ve 4.7 1.8 East Asian (e.g., Chinese, Japanese)
23.4 7.2
La no/Hispanic Mexican American/Chicano 22.4 7.3 Puerto Rican 4.6 2.3 Other 5.5 6.7
English not primary language 28.1 7.5 First-genera on 37.5 1.9 Sexual orienta on- Heterosexual or straight
85 91.6
Disability Learning 5.9 3.4 A en on Deficit Hyperac vity Disorder 10.6 6.3
Au sm 2.1 0.6 Physical 7.8 4.8 Chronic illness 3.6 2.7 Psychological disorder 21.5 11.1
YFFC Non-YFFC
% GED 0.4 0.1
B or below 33.1 23.1
A or A + 23.4 30.2 4 or more years of high school math 77 89.3 Aspire to a bachelor's degree or higher 96 98.8
HS GPA
Source: Authors’ Analysis of 2016 The Freshman Survey.
Source: Authors’ Analysis of 2016 The Freshman Survey.
Volume 5 | December 2020 | Issue 2 14
College Choice and Enrollment of YFFC
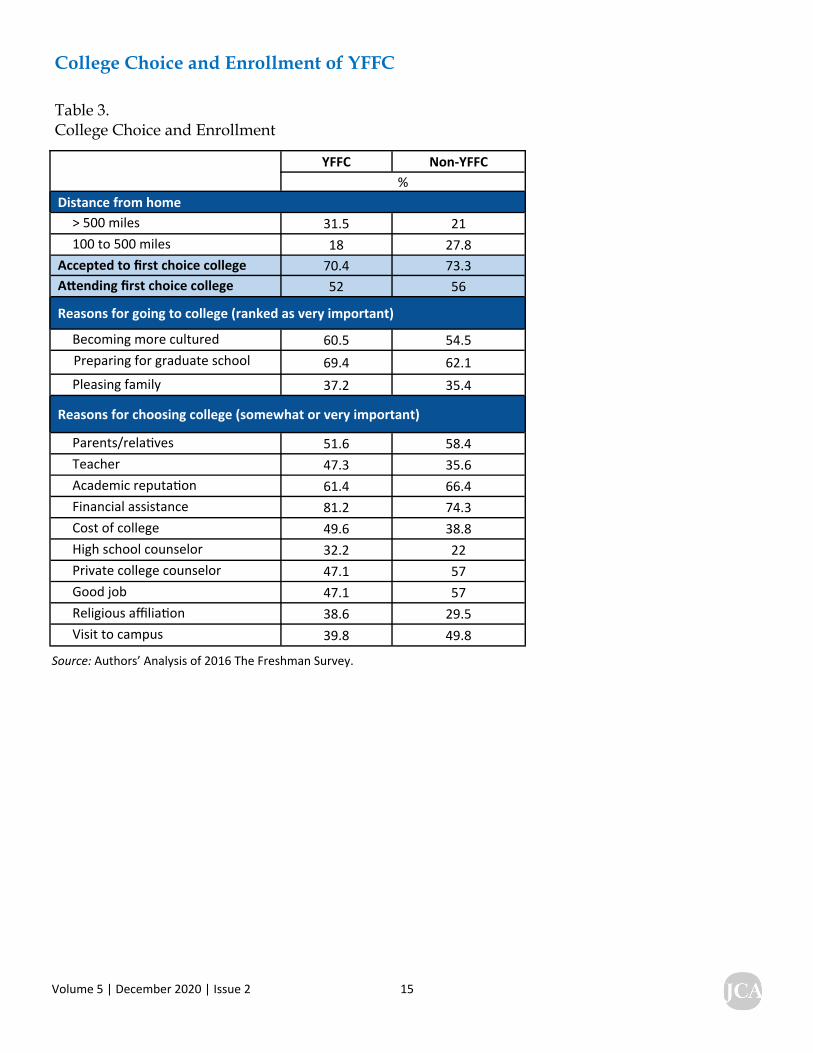
YFFC reported some form of psychological disorder (e.g., depression, anxiety), compared to 11% of non-YFFC. This is important to note given the higher incidence of mental health challenges reported among youth in foster care (Geenen et al., 2015). Findings Based on several characteristics, YFFC reported being less academically prepared for college than non-YFFC (see Table 2 on page 15). YFFC reported earned lower grades in high school than non-YFFC: about 23% of YFFC reported having an A or A+ cumulative GPA in high school compared to 30.25% of non-YFFC. Also, a lower proportion of YFFC reported taking four or more years of math compared to non-YFFC. Degree aspirations were high for both groups, with 96% of YFFC aspiring to a bachelor’s degree or higher compared to about 99% of non-YFFC. A number of differences in reasons for choosing and enrolling in college emerged in the responses from YFFC and non-YFFC. First, YFFC appeared to attend colleges that were further away from home than non-YFFC: 31.5% of YFFC reporting that their current institution was more than 500 miles from home, compared to 21% of non-YFFC. A greater proportion of youth formerly in foster care reported that becoming more cultured and preparing for graduate school was a very important reason for going to college relative to non-YFFC.
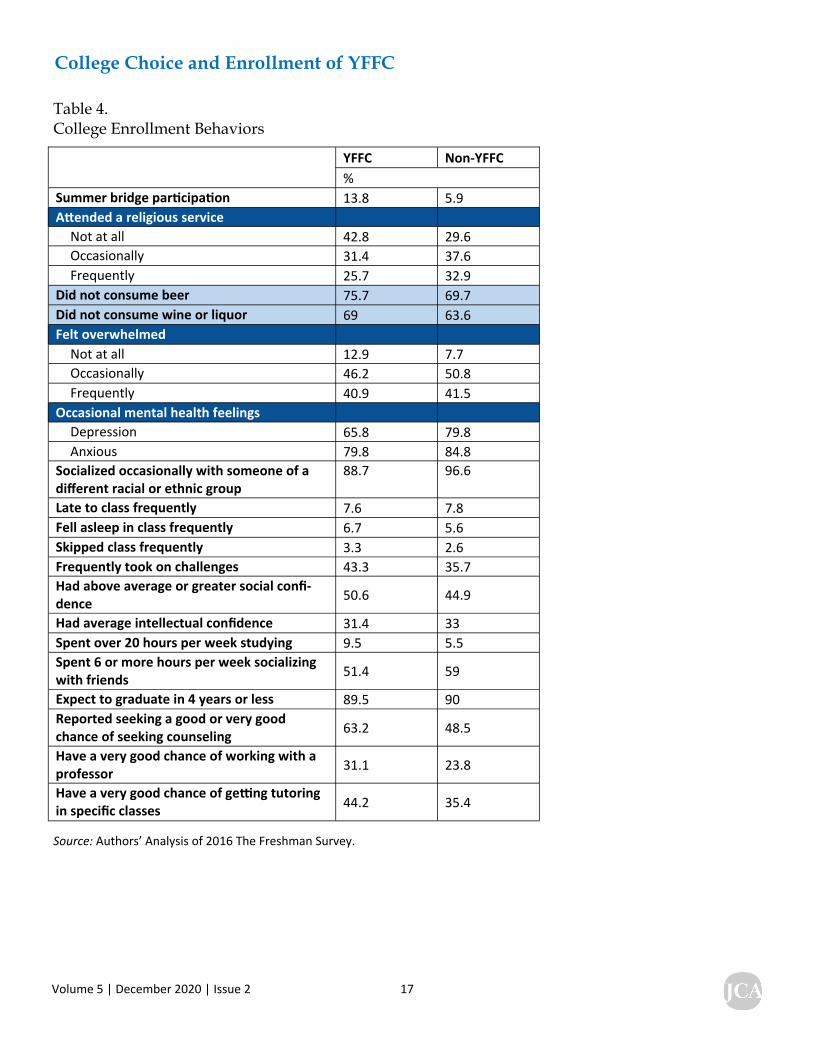
Some differences emerged between YFFC and non-YFFC with respect to who influenced their college choice decisions. Perhaps not surprisingly, higher proportions of YFFC reported being influenced in their college choice process by people other than parents or relatives. Although parents can play an important role in the information youth receive about their choice of college and career (Owen et al, 2020), youth in foster care likely have limited interaction with parents. About 52% of YFFC said parents or relatives were somewhat or very important in their choice of college compared to about 58% of non-YFFC. Teachers and high school counselors also seemed to be more influential in the college choice process for YFFC versus non-YFFC. Financial assistance was most often cited by both groups as somewhat or very important in the college choice process for both groups, but a greater proportion of YFFC (81.2%) felt this way compared to non-YFFC (74.3%). Interestingly, religious affiliation of the school seemed to hold greater influence on the college choice process for YFFC, although as shown in Table 4 (page 17), a smaller proportion of YFFC reported attending religious services once enrolled compared to non-YFFC. Behaviors in College Next, we consider self-reported activities and behaviors of YFFC compared to non-YFFC once they were enrolled in college. YFFC reported attending summer bridge programs in higher proportion compared to non-YFFC (see Table 4 on page 17). Consumption of
Volume 5 | December 2020 | Issue 2 15
College Choice and Enrollment of YFFC
Table 3. College Choice and Enrollment
Source: Authors’ Analysis of 2016 The Freshman Survey.
YFFC Non-YFFC %
Distance from home > 500 miles 31.5 21 100 to 500 miles 18 27.8
Accepted to first choice college 70.4 73.3 A ending first choice college 52 56
Reasons for going to college (ranked as very important)
Becoming more cultured 60.5 54.5 Preparing for graduate school 69.4 62.1 Pleasing family 37.2 35.4
Parents/rela ves 51.6 58.4 Teacher 47.3 35.6 Academic reputa on 61.4 66.4 Financial assistance 81.2 74.3 Cost of college 49.6 38.8 High school counselor 32.2 22 Private college counselor 47.1 57 Good job 47.1 57 Religious affilia on 38.6 29.5 Visit to campus 39.8 49.8
Reasons for choosing college (somewhat or very important)

Volume 5 | December 2020 | Issue 2 16
College Choice and Enrollment of YFFC
alcohol (beer, wine, or liquor) was reported by a smaller proportion of YFFC compared to non-YFFC. Interestingly, although a greater share of YFFC reported having psychological disorders, a smaller proportion of YFFC reported feeling overwhelmed and having occasional feelings of depression or anxiety than non-YFFC. YFFC seemed more likely to seek out counseling, however, with 63.2% reporting a good or very good chance of seeking out counseling, compared to 48.5% of non-YFFC. Academic Behaviors in College With respect to academic behaviors once enrolled, there appeared to be little difference between YFFC and non-YFFC in terms of going to class late, falling asleep in class, or skipping class. A greater proportion of YFFC reported frequently taking on challenges compared to non-YFFC (43.3% compared to 35.7%). YFFC reported studying more and socializing less than their non-YFFC peers. About 10% of YFFC reported spending over 20 hours per week studying compared to about 6% of non-YFFC, whereas 51.4% of YFFC reported socializing six or more hours per week with friends compared to 59% of non-YFFC. Both groups were similar in reporting expectations around time to graduate, with about 90% planning to do so in four years or less. Finally, YFFC reported having a very good chance of working with a professor in greater proportion than non-YFFC (31.1% compared to 23.8%). In sum, YFFC reported behaviors that would presumably lead to academic success at a
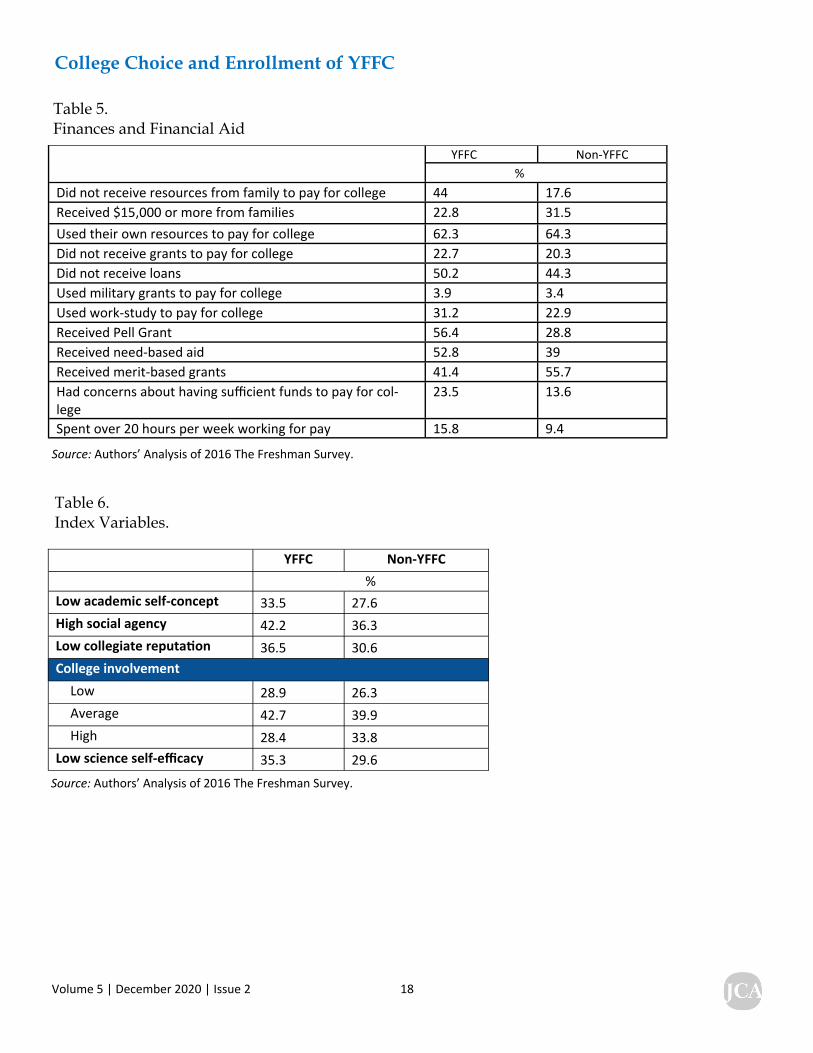
higher rate than their non-YFFC peers. Finances and Financial Aid A number of differences emerge between YFFC and non-YFFC with respect to finances and financial aid. About 44% of YFFC reported receiving no resources from families to pay for college, compared to 17.6% of non-YFFC. Among non-YFFC, about 32% reported receiving $15,000 or more from their families to pay for college compared to roughly 23% of YFFC. YFFC appeared to be less likely to report using loans to pay for college and more like to rely on work-study. About 56% of YFFC reported receiving a Pell Grant compared to 29% of non-YFFC. In addition, YFFC were more likely to report receiving need-based aid and less likely to receive merit-based aid. A greater proportion (23.55%) of YFFC reported having major concerns about paying for college compared to non-YFFC (13.6%). Working more than 20 hours per week was reported with greater frequency among YFFC. About 16% of YFFC reported working more than 20 hours per week compared to 9.4% of non-YFFC. Academic Self Concept Finally, we compared YFFC to non-YFFC on index variables related to academic self-concept, social agency, college involvement, and self-efficacy. A low score equates to at least one half of a standard deviation below the mean. An average score is within one half standard deviation above or below the mean. A high score equates to more than a half a standard deviation above the mean. We find
Volume 5 | December 2020 | Issue 2 17
College Choice and Enrollment of YFFC
Table 4. College Enrollment Behaviors
YFFC Non-YFFC %
Summer bridge par cipa on 13.8 5.9 A ended a religious service
Not at all 42.8 29.6 Occasionally 31.4 37.6 Frequently 25.7 32.9
Did not consume beer 75.7 69.7 Did not consume wine or liquor 69 63.6 Felt overwhelmed
Not at all 12.9 7.7 Occasionally 46.2 50.8 Frequently 40.9 41.5
Occasional mental health feelings Depression 65.8 79.8 Anxious 79.8 84.8
Socialized occasionally with someone of a different racial or ethnic group
88.7 96.6
Late to class frequently 7.6 7.8 Fell asleep in class frequently 6.7 5.6 Skipped class frequently 3.3 2.6 Frequently took on challenges 43.3 35.7 Had above average or greater social confi-dence 50.6 44.9
Had average intellectual confidence 31.4 33 Spent over 20 hours per week studying 9.5 5.5 Spent 6 or more hours per week socializing with friends 51.4 59
Expect to graduate in 4 years or less 89.5 90 Reported seeking a good or very good chance of seeking counseling 63.2 48.5
Have a very good chance of working with a professor 31.1 23.8
Have a very good chance of ge ng tutoring in specific classes 44.2 35.4
Source: Authors’ Analysis of 2016 The Freshman Survey.
Volume 5 | December 2020 | Issue 2 18
College Choice and Enrollment of YFFC
Table 5. Finances and Financial Aid
YFFC Non-YFFC %
Did not receive resources from family to pay for college 44 17.6 Received $15,000 or more from families 22.8 31.5 Used their own resources to pay for college 62.3 64.3 Did not receive grants to pay for college 22.7 20.3 Did not receive loans 50.2 44.3 Used military grants to pay for college 3.9 3.4 Used work-study to pay for college 31.2 22.9 Received Pell Grant 56.4 28.8 Received need-based aid 52.8 39 Received merit-based grants 41.4 55.7 Had concerns about having sufficient funds to pay for col-lege
23.5 13.6
Spent over 20 hours per week working for pay 15.8 9.4
Source: Authors’ Analysis of 2016 The Freshman Survey.
YFFC Non-YFFC % Low academic self-concept 33.5 27.6 High social agency 42.2 36.3 Low collegiate reputa on 36.5 30.6 College involvement
Low 28.9 26.3 Average 42.7 39.9 High 28.4 33.8
Low science self-efficacy 35.3 29.6
Table 6. Index Variables.
Source: Authors’ Analysis of 2016 The Freshman Survey.

Volume 5 | December 2020 | Issue 2 19
College Choice and Enrollment of YFFC
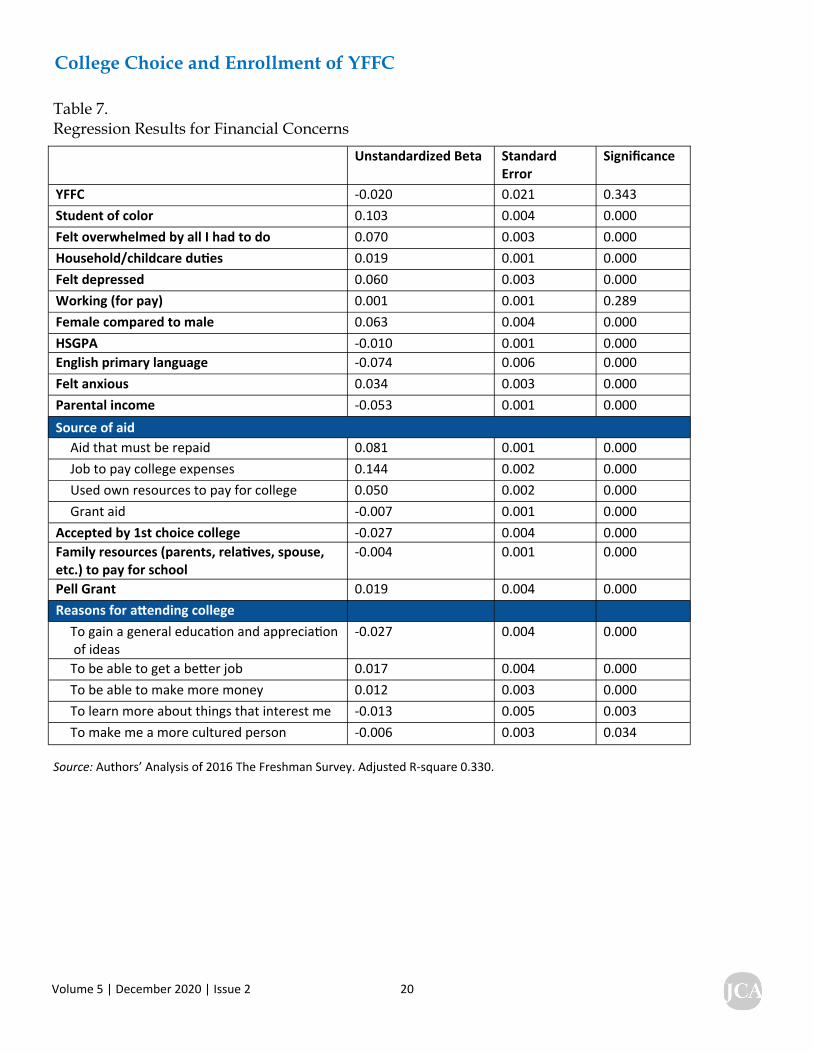
that a greater proportion of YFFC fell into the low academic self-concept category compared to non-YFFC (33.5% compared to 27.6%). YFFC had higher levels of social agency in greater proportion compared to non-YFFC. In addition, a greater proportion of YFFC were classified as having low science self-efficacy relative to non-YFFC. Finally, a greater proportion of YFFC were classified as having low or average college involvement compared to non-YFFC. Regression Results As described in our discussion of methods, we ran three regression models with outcomes focused on financial concern, degree aspirations, and academic self-concept. Variables in each model were entered in a step-wise fashion as blocks to ascertain the unique effect of each block on prior variables. We begin with results from our financial concern model. Financial Concern One-third of the variance in our financial concern was explained by the variables in this model (r2 = .330). At the beginning of the model, having been in foster care was associated with increased financial concern. This key independent variable remains significant until hours per week working for pay enters the model in step six. In the final model, while being in foster care nor hours per week working for pay were no longer significant predictors of financial concern, several demographic and background
characteristics remain significant. After controlling for all variables in the model, students of color and female students were more likely to be concerned about paying for college (see Table 7 on page 20). Emotional well-being was also a concern as those who more frequently felt depressed, overwhelmed by all they had to do, and anxious were also more likely to be concerned about finances. Even after controlling for merit support, those with higher high school grades were less likely to be concerned about paying for college. Further, students who were accepted into their first-choice college were less likely to be concerned about finances. Not surprisingly, in the final model, those who report higher income were less likely to be concerned about finances. Students who report more financial support from their family and merit support that does not have to be repaid are significantly less likely to be concerned about paying for college. On the other hand, students who reported using more of their own resources to pay for the first year of college, those taking out more loans, and those receiving Pell Grants were more likely to be concerned about paying for college. Finally, those who anticipated getting a job to help pay for college were more likely to report financial concern. With respect to reasons for attending college in general, after controlling for all other variables in the model, those who attended
Volume 5 | December 2020 | Issue 2 20
College Choice and Enrollment of YFFC
Table 7. Regression Results for Financial Concerns
Unstandardized Beta Standard
Error Significance
YFFC -0.020 0.021 0.343 Student of color 0.103 0.004 0.000 Felt overwhelmed by all I had to do 0.070 0.003 0.000 Household/childcare du es 0.019 0.001 0.000 Felt depressed 0.060 0.003 0.000 Working (for pay) 0.001 0.001 0.289 Female compared to male 0.063 0.004 0.000 HSGPA -0.010 0.001 0.000 English primary language -0.074 0.006 0.000 Felt anxious 0.034 0.003 0.000 Parental income -0.053 0.001 0.000
Aid that must be repaid 0.081 0.001 0.000 Job to pay college expenses 0.144 0.002 0.000 Used own resources to pay for college 0.050 0.002 0.000 Grant aid -0.007 0.001 0.000
Accepted by 1st choice college -0.027 0.004 0.000 Family resources (parents, rela ves, spouse, etc.) to pay for school
-0.004 0.001 0.000
Pell Grant 0.019 0.004 0.000 Reasons for a ending college
To gain a general educa on and apprecia on of ideas
-0.027 0.004 0.000
To be able to get a be er job 0.017 0.004 0.000 To be able to make more money 0.012 0.003 0.000 To learn more about things that interest me -0.013 0.005 0.003 To make me a more cultured person -0.006 0.003 0.034
Source of aid
Source: Authors’ Analysis of 2016 The Freshman Survey. Adjusted R-square 0.330.
Volume 5 | December 2020 | Issue 2 21
College Choice and Enrollment of YFFC
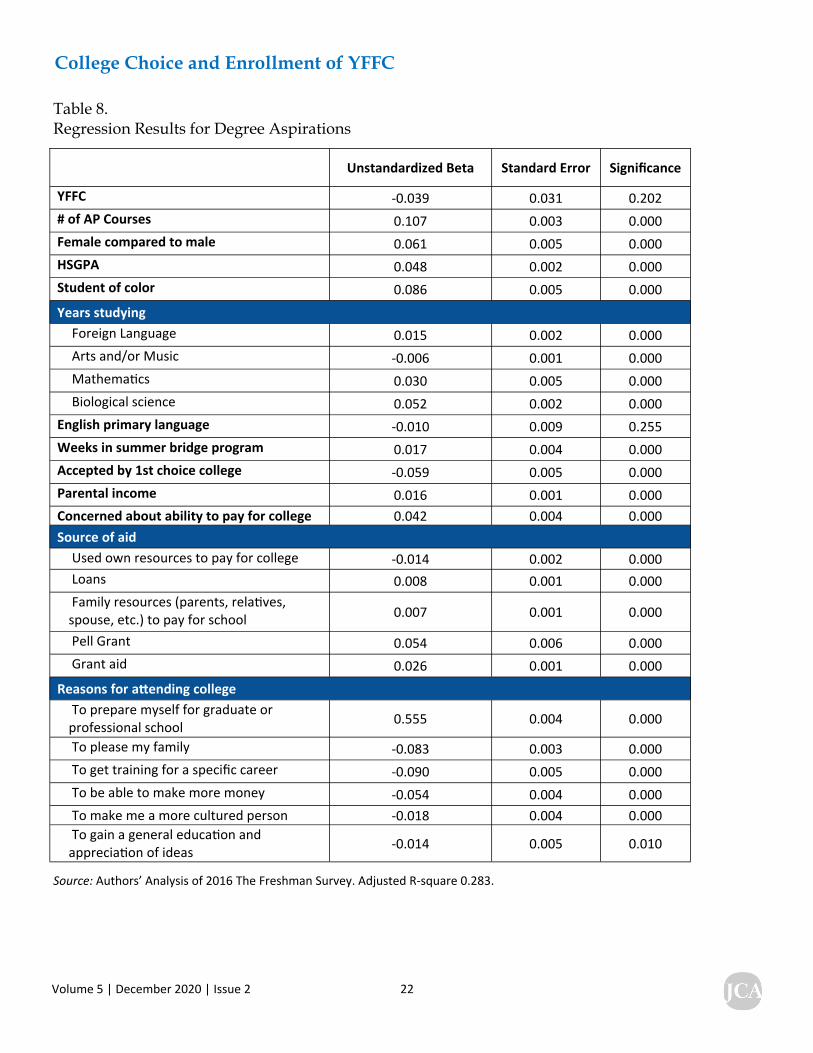
college to get a better job or to make more money were more concerned about finances. By contrast, those who considered gaining a general education, learning more about things that interest them, and making themselves more cultured showed less concern about funding their college education. Degree Aspirations Foster care status is not a significant predictor of degree aspirations in our sample. This model accounts for about 28% of the variance in degree aspirations (r2 = .284). Within the first block of demographics and high school experiences, the strongest predictor of degree aspirations is the number of AP courses taken in high school (see Table 8 on page 22). In terms of demographic characteristics, female students and students of color were more likely to have higher degree aspirations once all other variables entered in the final model. Other positive predictors of degree aspirations include high school grades; years of studying biological science, foreign language, and mathematics; and participating in a summer bridge program. Financially, students from higher income backgrounds have higher degree aspirations. However, all types of financial aid, including loans, merit and need-based aid are also significant, positive predictors of degree aspirations. The only financial variable that negatively impacts degree aspirations is the amount of expenses covered by the students' own resources.
The only general reason for attending college that is a positive predictor of degree aspirations was attending to prepare for graduate or professional school, which makes sense given the outcome of higher degree aspirations. The other general reasons for attending college that entered the model were associated with lower degree aspirations and included to please family, to get career training, to make more money, to become a more cultured person, and to gain a general education and appreciation of ideas. Academic Self-Concept Academic self-concept aggregates four self-ratings: academic ability, drive to achieve, mathematical ability, and intellectual self-confidence. This model accounts for about 37% of the variance in the academic self-concept construct (r2 = .365). Entered at step one, foster care status is a significant negative predictor of academic self-concept. That is, before accounting for any other independent variables, having been in foster care was associated with lower academic self-concept. However, at step two, when high school grades entered the equation, foster care status became not significant. That is, after accounting for grades, being a YFFC in and of itself was not a significant predictor of academic self-concept. Once aspects of students' emotional well-being entered the model, being a YFFC was actually associated with higher academic self-confidence. The key independent variable of interest remains significant and positive throughout the remainder of the model. This requires further
Volume 5 | December 2020 | Issue 2 22
College Choice and Enrollment of YFFC
Table 8. Regression Results for Degree Aspirations
Source: Authors’ Analysis of 2016 The Freshman Survey. Adjusted R-square 0.283.
Unstandardized Beta Standard Error Significance
YFFC -0.039 0.031 0.202 # of AP Courses 0.107 0.003 0.000 Female compared to male 0.061 0.005 0.000 HSGPA 0.048 0.002 0.000 Student of color 0.086 0.005 0.000
Foreign Language 0.015 0.002 0.000 Arts and/or Music -0.006 0.001 0.000 Mathema cs 0.030 0.005 0.000 Biological science 0.052 0.002 0.000
English primary language -0.010 0.009 0.255 Weeks in summer bridge program 0.017 0.004 0.000 Accepted by 1st choice college -0.059 0.005 0.000 Parental income 0.016 0.001 0.000 Concerned about ability to pay for college 0.042 0.004 0.000 Source of aid
Used own resources to pay for college -0.014 0.002 0.000 Loans 0.008 0.001 0.000 Family resources (parents, rela ves, spouse, etc.) to pay for school 0.007 0.001 0.000
Pell Grant 0.054 0.006 0.000 Grant aid 0.026 0.001 0.000
Reasons for a ending college To prepare myself for graduate or professional school 0.555 0.004 0.000
To please my family -0.083 0.003 0.000 To get training for a specific career -0.090 0.005 0.000 To be able to make more money -0.054 0.004 0.000 To make me a more cultured person -0.018 0.004 0.000 To gain a general educa on and apprecia on of ideas -0.014 0.005 0.010
Years studying
Volume 5 | December 2020 | Issue 2 23
College Choice and Enrollment of YFFC
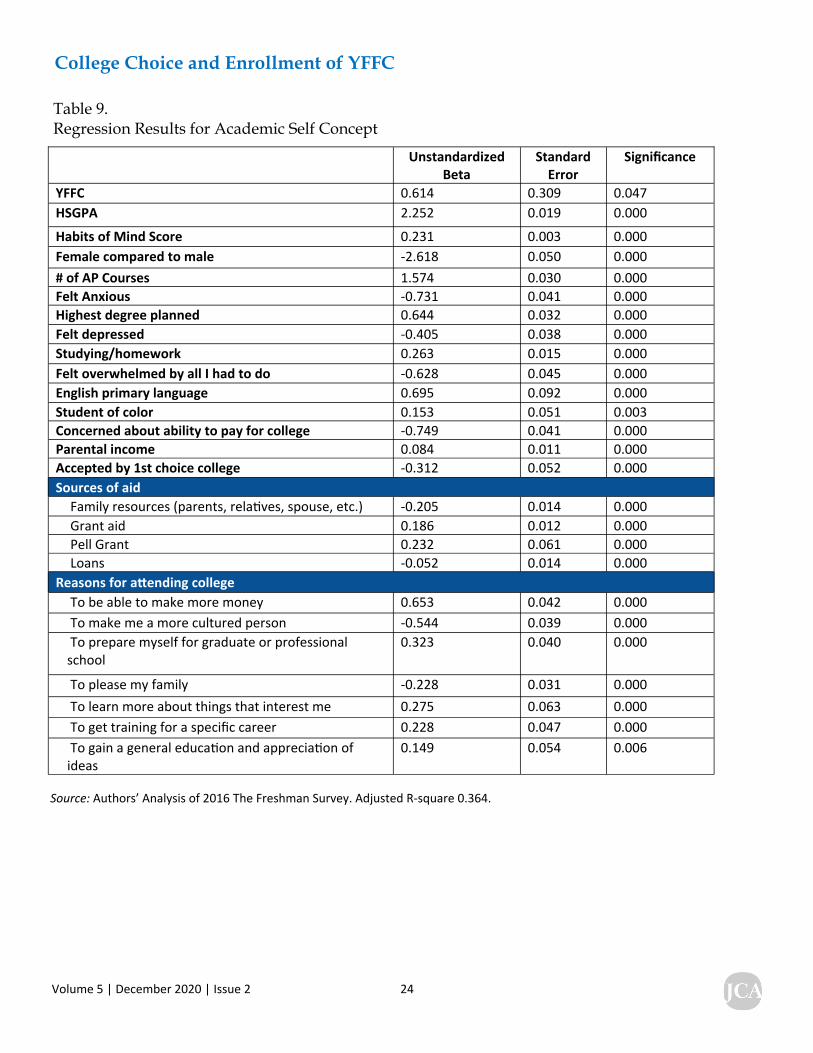
analysis to tease out the complex relationship between emotional well-being, foster care status, and academic self-concept (see Table 9 on page 24). After all the blocks of independent variables entered the model, women had lower academic self-concept, while students of color and native English speakers had a higher academic self-concept. High school behaviors (such as hours per week spent studying or doing homework, number of AP courses taken, high school grades, and displaying behaviors associated with habits of mind for lifelong learning) were all positive predictors of academic self-concept. Aspects of emotional well-being, such as feeling depressed, anxious, and overwhelmed were associated with lower academic self-concept. Several financial variables also remained significant at the end of the model. Students who reported higher income, increased merit support, and receiving a Pell Grant were all more likely to have higher academic self-concept. Students who showed increased financial concern and covered first-year expenses with loans were more likely to have lower academic self-concept. Attending college to make more money, prepare for graduate/professional school, or receive career training were associated with higher academic self-concept; attending to please family or to become a more cultured person were associated with lower academic self-concept.
Discussion A major contribution of this study is that it is the first nationally representative study exploring the college readiness and college enrollment processes of YFFC, as such datasets of youth in foster care in educational settings do not yet exist (Davis, 2006). Prior research has relied on samples drawn from social service programs (e.g., McMillen, et al., 2003), agency records (e.g., Barth, 1990), or research studies aimed at broad under-standing of youth in foster cares’ lives (e.g., the Midwest Evaluation of the Adult Functioning of Former Foster Youth). While these studies offer a wealth of information about youth in foster care, in some cases the sample sizes (e.g., Barth’s 1990 study included just 55 participants) preclude certain statistical methods. Most of these studies did not collect substantial information about students’ postsecondary educational experiences. A number of interesting findings emerge from this exploratory study. First, we find that the YFFC in this national sample mirror the demographics and academic preparation of youth who have experienced care: students of color were overrepresented among YFFC, as were first-generation students and lower-income students. As we might expect given the challenges youth in foster care may face in education (e.g., disruptions in school from placement changes), YFFC in this national sample appeared to be less prepared academically than their non-YFFC peers. Second, YFFC are also distinct from non-
Volume 5 | December 2020 | Issue 2 24
College Choice and Enrollment of YFFC
Table 9. Regression Results for Academic Self Concept
Source: Authors’ Analysis of 2016 The Freshman Survey. Adjusted R-square 0.364.
Unstandardized
Beta Standard
Error Significance
YFFC 0.614 0.309 0.047 HSGPA 2.252 0.019 0.000
Habits of Mind Score 0.231 0.003 0.000 Female compared to male -2.618 0.050 0.000 # of AP Courses 1.574 0.030 0.000 Felt Anxious -0.731 0.041 0.000 Highest degree planned 0.644 0.032 0.000 Felt depressed -0.405 0.038 0.000 Studying/homework 0.263 0.015 0.000 Felt overwhelmed by all I had to do -0.628 0.045 0.000 English primary language 0.695 0.092 0.000 Student of color 0.153 0.051 0.003 Concerned about ability to pay for college -0.749 0.041 0.000 Parental income 0.084 0.011 0.000 Accepted by 1st choice college -0.312 0.052 0.000 Sources of aid
Family resources (parents, rela ves, spouse, etc.) -0.205 0.014 0.000 Grant aid 0.186 0.012 0.000 Pell Grant 0.232 0.061 0.000 Loans -0.052 0.014 0.000
Reasons for a ending college To be able to make more money 0.653 0.042 0.000 To make me a more cultured person -0.544 0.039 0.000 To prepare myself for graduate or professional school
0.323 0.040 0.000
To please my family -0.228 0.031 0.000 To learn more about things that interest me 0.275 0.063 0.000 To get training for a specific career 0.228 0.047 0.000 To gain a general educa on and apprecia on of ideas
0.149 0.054 0.006
Volume 5 | December 2020 | Issue 2 25
College Choice and Enrollment of YFFC
YFFC in ways that may present challenges to their educational attainment. Consistent with other research (e.g., Geenen et al, 2015), YFFC in this sample reported various disabilities in greater proportion than non-YFFC. For example, about 22% of YFFC reported having psychological disorders (e.g., depression) compared to about 11% of non-YFFC. YFFC also more frequently reported concerns about college affordability and about having fewer resources to pay for college (especially from family). Relative to non-YFFC, YFFC reported relying on need-based aid, work-study, and money earned from their own employment to pay for college. Notably, affordability was a concern for all students in the sample. Finally, YFFC were more likely to be categorized as having a low academic self-concept, lower levels of involvement in college, and a low sense of science self-efficacy, decreasing their likelihood of earning a postsecondary credential despite high aspirations to finish a bachelor’s degree. However, a picture of strength also emerges from the data, one that challenges notions of YFFC operating from substantial educational deficits. As mentioned above, YFFC have high aspirations and expectations for themselves when it comes to earning a degree and the time in which they plan to do it. In the
possible absence of family or relatives to help guide their college choice process, YFFC relied on teachers and high school counselors. Once enrolled, YFFC reported similar behaviors around studying, going to class, and being engaged in their classes (e.g., a greater proportion of YFFC than non-YFFC reported studying more than 20 hours per week.) Also, a greater share of YFFC reported they were likely to work with a professor and
likely to seek tutoring for specific courses. Finally, in our exploratory regression
models looking at factors impacting academic self-confidence, we found a modest but positive relationship between being a YFFC and having higher academic self-confidence, controlling for all else. This paints a picture of YFFC who engage in positive behaviors with respect to academic success. In many ways, this is not surprising. Given the overall low rate of college-going among youth
who have experienced care, the YFFC in this sample likely have developed a number of skills and academic characteristics that made them successful in attending college in the first place. Recommendations A number of recommendations for research and practice stem from our findings. First, the
“YFFC were more likely to be categorized as having a low
academic self-concept, lower levels of involvement in college, and a low sense of science self-
efficacy, decreasing their likelihood of earning a
postsecondary credential despite high aspirations to finish a bachelor’s degree.”
Volume 5 | December 2020 | Issue 2 26
College Choice and Enrollment of YFFC
picture of strengths mentioned above warrants consideration by practitioners who work in student affairs, financial aid, academic advising, and other similar areas of campus life. YFFC are likely less academically prepared than peers who did not experience foster care and they are more likely to report mental health concerns, yet at the same time they are as likely or more likely than their peers to engage in success-oriented behaviors, such as working with faculty members. For youth formerly in foster care, services targeted toward overcoming their areas of relative weakness (e.g., academic preparation, ability to pay for college) that also capitalize on areas of strength (e.g., academic self-efficacy) may be especially impactful. Practitioners should look to the growing number of campus-support programs (e.g., Western Michigan University’s Seita Scholars Program) for YFFC as opportunities to learn about how we can provide support for YFFC (Geiger, Piel, Day, & Schelbe, 2018). Researchers should continue to partner with programs to evaluate their efficacy. This research invites changes to both policy, such as creating an environment that incentivizes engagement opportunities like summer bridge; and practice, by supporting educators who build such efforts (Unrau, 2011). Second, the relationships among foster care status, demographic characteristics, and paying for college merit additional research. Interestingly, we did not generally find a statistically significant relationship between being a YFFC and degree aspirations or
financial concern, once we controlled for other factors such as college choice, academic preparation, and financial aid. This lack of statistical significance may be a function of the relatively small sample size of YFFC compared to non-YFFC. Yet, recall that after controlling for all variables in the model, students of color and female students were more likely to be concerned about paying for college. Future research with these data will test for interaction effects and, if warranted, run separate models for groups. For example, interactions between gender and race/ethnicity, foster care status, and concerns about paying for college may illuminate the nuanced ways in which economics and sociocultural factors operate together. Future research on the topic of YFFC financing college should also utilize the National Postsecondary Student Aid Study (NPSAS). NPSAS is a readily available national postsecondary dataset that contains some information about students who were in care, although it does not contain as much information about behaviors in college. Finally, future research should look at educational outcomes to the extent possible, such as academic performance and degree completion. With the exception of a few studies (e.g., Okpych & Courtney, 2018), relatively little research has focused on persistence and degree completion for YFFC. This study does not focus on how college choice factors, academic preparation, ability to pay for school, and more impact year-to-year persistence and ultimately degree completion. Yet, such work is needed—for
Volume 5 | December 2020 | Issue 2 27
College Choice and Enrollment of YFFC
YFFC enrolled at four-year institutions as well as community colleges, where almost half of YFFC enroll (Gross, 2019). Conclusion This study sought to better understand how YFFC compare to their peers regarding college preparation, choice, enrollment, and financing; academic self-concept and degree aspirations; and concerns about paying for college. What emerges from our findings is a picture of strengths for youth who attend a four-year college and have experienced care. At the same time, we found a number of ways in which YFFC differ from non-YFFC, including academic preparation and mental health concerns—ways that may present barriers to ultimately attaining a degree. This study contributes to the research on YFFC by delving into college choice and college enrollment—areas that have not yet received a great deal of attention among researchers. As with most studies, we raise more questions than provide answers—yet when our findings are taken together with the work of others (e.g., A Day et al., 2011; Angelique Day, Geiger, Piel, & Schelbe, 2019; Geiger et al., 2018; Kirk & Day, 2011), we see specific areas (e.g., academic support) in which practitioners might begin to shape their work to better support YFFC and in which additional research must be done.
References Barth, R. P. (1990). On their own: The experiences of youth a er foster care. Child and Adolescent Social Work Journal, 7(5), 419-440. h ps://doi.org/10.1007/BF00756380 Berger, L., Cancian, M., Noyes, J., & Rios-Salas, V. (2015, October). Does foster care lower school achievement? Ins tute for Research on Poverty, University of Wisconsin. h ps://www.irp.wisc.edu/publica ons/policybriefs/pdfs/PB5-Foster-Care-School-Achievement.pdf Berger, L. M., Cancian, M., Han, E., Noyes, J., & Rios-Salas, V. (2015). Children's academic achievement and foster care. Pediatrics, 135(1), 109-116. h ps://doi.org/10.1542/peds.2014-2448 Blome, W. W. (1997). What happens to foster kids: Educa onal experiences of a random sample of foster care youth and a matched group of non-foster care youth. Child and Adolescent Social Work Journal, 14(1), 41-53. h ps://doi.org/10.1023/A:1024592813809 Buckles, K. S. (2013). Adop on subsidies and placement outcomes for children in foster care. Journal of Human Resources, 48(3), 596-627. h ps://doi.org/10.3368/jhr.48.3.596 Burley, M. (2007). Foster care to college partnership evalua on: Program overview and research design. Washington State Ins tute for Public Policy. h p://www.wsipp.wa.gov/ReportFile/995/Wsipp_Foster-Care-to-College-Partnership-Evalua on-Program-Overview-and-Research-Design_Preliminary-Report.pdf Casey Family Programs. (2006). It's my life: Postsecondary educa on and training. Cappriccioso, R. (2005, December 15). Fostering higher educa on success. Inside Higher Ed. h ps://www.insidehighered.com/news/2005/12/15/fostering-higher-educa on-success

Volume 5 | December 2020 | Issue 2 28
College Choice and Enrollment of YFFC
Courtney, M. E., Charles, P., Okpych, N. J., & Halsted, K. (2015). California Youth Transi ons to Adulthood Study (CalYOUTH): Early findings from the child welfare worker survey. Chapin Hall at the University of Chicago. h ps://www.issuelab.org/resources/24774/24774.pdf Courtney, M., Dworsky, A., Brown, A., Cary, C., Love, K., & Vorhies, V. (2011). Midwest evalua on of the adult func oning of former foster youth: Outcomes at age 26. Chapin Hall at the University of Chicago. Courtney, M. E., Roderick, M., Smithgall, C., Gladden, R. M., & Nagaoka, J. (2004). The educa onal status of foster children. h ps://www.researchgate.net/profile/Cheryl_Smithgall/publica on/268053940_The_ Educa onal_Status_of_Foster_Children/links/54e4c0320cf22703d5bf415e.pdf Davis, R. J. (2006). College access, financial aid, and college success for undergraduates from foster care. Na onal Associa on of Student Financial Aid Administrators (NJ1). Day, A, Dworsky, A., Fogarty, K., & Damashek, A. (2011). An examina on of post-secondary reten on and gradua on among foster care youth enrolled in a four-year university. Children and Youth Services Review, 33(11), 2335–2341. Day, A., Dworsky, A. L., & Feng, W. (2013). An analysis of foster care placement history and post-secondary gradua on rates. Research in Higher Educa on Journal, 19, 1-17. Day, A., Geiger, J. M., Piel, M. H., & Schelbe, L. (2019). The state of evalua ons of campus-based support programs serving foster care alumni in higher educa on. Child Welfare, 97(2), 23–41. Department of Health and Human Services. (2019). The AFCARS Report. US Department of Health and Human Services. h ps://www.acf.hhs.gov/sites/default/files/cb/afcarsreport27.pdf
Dworsky, A. L., & Courtney, M. E. (2010). Does extending foster care beyond age 18 promote postsecondary educa onal a ainment? Emerging findings from the Midwest Study. Chapin Hall Issue Brief. h ps://www.chapinhall.org/wp-content/uploads/Midwest_IB1_Educa onal_A ainment.pdf Dworsky, A. L., & Havlicek, J. (2010). Employment needs of foster youth in Illinois: Findings from the Midwest Study. h p://www.chapinhall.org/sites/default/files/Employment of Foster Youth_01_20_10.pdf Dworsky, A. L., & Perez, A. (2010). Helping former foster youth graduate from college through campus support programs. Children and Youth Services Review, 32(2), 255-263. h ps://doi.org/10.1016/j.childyouth.2009.09.004 Emerson, J. (2007). From foster care to college: Suppor ng independent students. Leadership Exchange, 4(4), 6-10. Eriamiatoe, O. R. (2011). Independent living services and the educa onal mo va on of foster youth. (Publica on No. 3487553) [Doctoral disserta on, Tennessee State University]. ProQuest Disserta ons and Theses Global. Frerer, K., Sosenko, L. D., Pellegrin, N., Manchik, V., & Horowitz, J. (2013). Foster youth stability: A study of California foster youths' school and residen al changes in rela on to educa onal outcomes. Ins tute for Evidence-Based Change. h p://hdl.voced.edu.au/10707/411439 Fried, T. (2008). Community colleges step up to support foster care students. Community College Journal, 78(4), 38. Geenen, S., Powers, L. E., Phillips, L. A., Nelson, M., McKenna, J., Winges-Yanez, N., Blanche e, L., Croskey, A., Dalton, L. D., Salazar, A., & Swank, P. (2015). Be er futures: A randomized field test of a model for suppor ng young people in foster care with mental health challenges to par cipate in higher educa on. Journal of Behavioral Health Services & Research, 42(2), 150-171. h ps://doi.org/10.1007/s11414-014-9451-6 Geiger, J. M., Hanrahan, J. E., Cheung, J. R., & Lietz, C. A. (2016). Developing an on-campus recruitment and reten on program for former foster youth. Children and Youth Services Review, 61, 271-280.
Volume 5 | December 2020 | Issue 2 29
College Choice and Enrollment of YFFC
Geiger, J. M., Piel, M. H., Day, A., & Schelbe, L. (2018). A descrip ve analysis of programs serving foster care alumni in higher educa on: Challenges and opportuni es. Children and Youth Services Review, 85, 287–294. George, R. M., Bilaver, L., Less, B. J., Needell, B., Brookhart, A., & Jackman, W. (2002). Employment outcomes for youth aging out of foster care. United States Department of Health and Human Services. h p://scholar.google.com/scholar?q=related:vbvlevsZ8sEJ:scholar.google.com/&hl=en&num=20&as_sdt=0,5 Gillum, N., Lindsay, T., Murray, F., & Wells, P. (2016). A review of research on college educa onal outcomes of students who experienced foster care. Journal of Public Child Welfare, 10(3), 291–309. Gross, J. P. (2019). Reaching Higher: Former Foster Youth in Postsecondary Educa on. Palgrave Macmillan. h ps://doi.org/10.1007/978-3-319-99459-8 Harris, M. S., Jackson, L. J., O’Brien, K., & Pecora, P. J. (2009). Dispropor onality in educa on and employment outcomes of adult former foster youth. Children and Youth Services Review, 31(11), 1150-1159. h ps://doi.org/10.1016/j.childyouth.2009.08.002 Huang, H., Fernandez, S., Rhoden, M-A., Joseph, R. (2018). Serving former foster youth and homeless students in college. Journal of Social Service Research, 44(2), 209-222. h ps://doi.org/10.1080/01488376.2018.1441096 Inkelas, K. K., Soldner, M., Longerbeam, S. D., & Leonard, J. B. (2008). Differences in student outcomes by types of living-learning programs: The development of an empirical typology. Research in Higher Educa on, 49(6), 495-512. h ps://doi.org/10.1007/s11162-008-9087-6 Jones, L. P. (2010). The educa onal experiences of former foster youth three years a er discharge. Child Welfare, 89(6), 7–22. Kahne, J., & Bailey, K. (1999). The role of social capital in youth development: The case of "I Have a Dream" programs. Educa onal Evalua on and Policy Analysis, 21(3), 321-343. h ps://doi.org/10.3102/01623737021003321
Kearney, K. S., Naifeh, Z., Hammer, T., & Cain, A. (2018). “Family” es for foster alumni in college: An open systems considera on. The Review of Higher Educa on, 42(2), 793–824. h ps://doi.org/10.1353/rhe.2019.0015 Keller, G. (2001). The new demographics of higher educa on. The Review of Higher Educa on, 24(3), 219-235. h ps://doi.org/10.1353/rhe.2001.0004 Kinarsky, A. R. (2017). Fostering success: Understanding the experience of foster youth undergraduates. Children and Youth Services Review, 81, 220-228. h ps://doi.org/10.1016/j.childyouth.2017.08.016 Kirk, R., & Day, A. (2011). Increasing college access for youth aging out of foster care: Evalua on of a summer camp program for foster youth transi oning from high school to college. Children and Youth Services Review, 33(7), 1173-1180. h ps://doi.org/10.1016/j.childyouth.2011.02.018 Lauen, D. L. (2009). To Choose or not to choose: High school choice and gradua on in Chicago. Educa onal Evalua on and Policy Analysis, 31(3), 179-199. doi: 10.3102/0162373709339058 Legal Center for Foster Care and Educa on. (2009). Federal laws that increase educa onal opportuni es for older youth in out-of-home-care. Legal Center for Foster Care & Educa on. h ps://www.americanbar.org/content/dam/aba/publica ons/center_on_children_and_the_law/educa on/qa_older_youth_final.authcheckdam.pdf McDonald, T. P., Allen, R. I., Westerfelt, A., & Piliavin, I. (1996). Assessing the long-term effects of foster care. Child Welfare League of America. McKernan, S. M., Bernstein, J., & Fender, L. (2005). Taming the beast: Categorizing state welfare policies: A typology of welfare policies affec ng recipient job entry. Journal of Policy Analysis and Management, 24(2), 443-460. h ps://doi.org/10.1002/pam.20102 McLeod, J. D., & Kaiser, K. (2004). Childhood emo onal and behavioral problems and educa onal a ainment. American Sociological Review, 69(5), 636-658. h ps://doi.org/10.1177/000312240406900502
Volume 5 | December 2020 | Issue 2 30
College Choice and Enrollment of YFFC
McMillen, C., Auslander, W., Elze, D., White, T., & Thompson, R. (2003). Educa onal experiences and aspira ons of older foster youth. Child Welfare, 82(4), 475-495. Merdinger, J. M., Hines, A. M., Osterling, K. L., & Wya , P. (2005). Pathways to college for former foster youth: Understanding factors that contribute to educa onal success. Child Welfare, 84(6), 867-896. h ps://pubmed.ncbi.nlm.nih.gov/16544569/ Miller, P. M. (2011). A cri cal analysis of the research on student homelessness. Review of Educa onal Research, 81(3), 308-337. h ps://doi.org/10.3102/0034654311415120 Napolitano, L., Sulimani-Aidan, Y., & Courtney, M. E. (2015). Extended foster care in California: Youth and caseworker perspec ves. Chapin Hall. h ps://www.chapinhall.org/wp-content/uploads/CY_EF_IB1015.pdf Okpych, N. J., & Courtney, M. E. (2018). Barriers to Degree Comple on for College Students With Foster Care Histories: Results From a 10-Year Longitudinal Study. Journal of College Student Reten on: Research, Theory and Prac ce. h ps://doi.org/10.1177/1521025118791776 Olson, S. (2011). Toward an integrated science of research on families: Workshop report. Na onal Ins tutes of Health. h ps://www.ncbi.nlm.nih.gov/books/NBK56249/ Owen, L., Poynton, T.A. and Moore, R. (2020). "Student Preferences for College and Career Informa on," Journal of College Access: Vol. 5 : Iss. 1 , Ar cle 7. Available at: h ps://scholarworks.wmich.edu/jca/vol5/iss1/7 Parker, E., & Sarubbi, M. (2017). Tui on assistance programs for foster youth pursuing postsecondary educa on. h ps://www.ecs.org/wp-content/uploads/Tui on-Assistance-Programs-for-Foster-Youth-in-Postsecondary-Educa on.pdf Pears, K. C., Kim, H. K., & Leve, L. D. (2012). Girls in foster care: Risk and promo ve factors for school adjustment across the transi on to middle school. Children and Youth Services Review, 34(1), 234–243.
Pecora, P. J. (2012). Maximizing educa onal achievement of foster youth and alumni: Factors associated with success. Children and Youth Services Review, 34(6), 1121-1129. doi:10.1016/j.childyouth.2012.01.044 Pecora, P. J., Kessler, R. C., O’Brien, K., White, C. R., Williams, J., Hiripi, E., English, D., White, J. & Herrick, M. A. (2006). Educa onal and employment outcomes of adults formerly placed in foster care: Results from the Northwest Former foster youth Study. Children and Youth Services Review, 28(12), 1459-1481. h ps://doi.org/10.1016/j.childyouth.2006.04.003 Pecora, P. J., Williams, J., Kessler, R., Downs, A. C., & O'Brien, K. (2003). Assessing the effects of foster care: Early results from the Casey Na onal Alumni Study. Casey Family Programs. Pecora, P. J., Williams, J., Kessler, R. C., Hiripi, E., O’Brien, K., Emerson, J., Herrick, M. A., Torres, D. (2006). Assessing the educa onal achievements of adults who were formerly placed in family foster care. Child & Family Social Work, 11(3), 220-231. h ps://doi.org/10.1111/j.1365-2206.2006.00429.x Perna, L. W. (2006). Understanding the rela onship between informa on about college prices and financial aid and students' college-related behaviors. American Behavioral Scien st, 49(12), 1620-1620. Perna, L. W., Rowan-Kenyon, H., Bell, A., & Thomas, S. L. (2008). A typology of federal and state programs designed to promote college enrollment. The Journal of Higher Educa on, 79(3), 243-267.. doi:10.2307/25144668 Rassen, E., Cooper, D. M., & Mery, P. (2010). Serving special popula ons: A study of former foster youth at California community colleges. Journal of Applied Research in the Community College, 17(2), 24-34. Reynolds, A. J., Temple, J. A., Robertson, D. L., & Mann, E. A. (2002). Age 21 cost-benefit analysis of the Title I Chicago child-parent centers. Educa onal Evalua on and Policy Analysis, 24(4), 267-303. h ps://doi.org/ 10.3102/01623737024004267
Volume 5 | December 2020 | Issue 2 31
College Choice and Enrollment of YFFC
Richards, C. E. (1988). A typology of educa onal monitoring systems. Educa onal Evalua on and Policy Analysis, 10(2), 106-116. h ps://doi.org/10.3102/01623737010002106 Rios, S. (2008). From foster care to college: Young adults' percep ons of factors that impaired their academic achievement. Florida Interna onal University. Rios, S. J., & Rocco, T. S. (2014) From foster care to college: Barriers and supports on the road to postsecondary educa on. Emerging Adulthood, 2(3), 227-237. h ps://doi.org/10.1177/2167696814526715 Rose, B. W. (2015, May). Policy analysis of California Fostering Connec ons to Success Act of 2010. School of Social Work, California State University, Long Beach. h p://web.csulb.edu/colleges/chhs/departments/social-work/documents/ePoster_Rose.Brian_AB12.pdf RTI Interna onal. (2015). Char ng the course: Using data to support foster youth success. California College Pathways website: h p://www. cacollegepathways.org/wp-content/uploads/2015/12/char ng_the_course_final.pdf Sarubbi, M. (2019). Stories of the 3%: Foster care alumni narra ves of resilience and postsecondary a ainment. University of Denver. Shagas, K. (2002). Promising prac ces: School to career and postsecondary educa on for foster care youth. Workforce Strategy Center. Smithgall, C., Gladden, R. M., Howard, E., George, R., & Courtney, M. E. (2004). Educa onal experiences of children in out-of-home care. Chapin Hall Center for Children. Tierney, W. G., & Venegas, K. M. (2009). Finding money on the table: Informa on, financial aid, and access to college. The Journal of Higher Educa on, 80(4), 363-388. h ps://doi.org/10.1080/00221546.2009.11779021 U.S. Government Accountability Office. (2016). Ac ons needed to improve access to federal financial assistance for homeless and foster youth. (GAO-16-343). Washington, DC.
Unrau, Y. A. (2011). From foster care to college: The Seita Scholars Program at Western Michigan University. Reclaiming Children and Youth, 20(2), 17-20. Wolanin, T. R. (2005). Higher educa on opportuni es for foster youth: A primer for policymakers. Ins tute for Higher Educa on Policy. h p://www.voced.edu.au/content/ngv59318 Villegas, S., Rosenthal, J., O’Brien, K., & Pecora, P. J. (2014). Educa onal outcomes for adults formerly in foster care: The role of ethnicity. Children and Youth Services Review, 36, 42–52.