Embed Size (px)
Citation preview
College Knowledge: From Information to Expectation
Julie M. WilliamsTy M. Cruce
John V. MooreIndiana University
NACAC Conference, October 6th, 2006, Pittsburgh
Beginning College Survey of Student Engagement
Overview
Background and Literature
Questions of Interest
Data Sources and Sample
Findings
Implications for Practice
Gaps in College Information
Students enter the college search/choice process with a wide range of expectations, information and support for their college dreams.
The quality and quantity of information available, is often contingent in part on demographics and socioeconomics (student, school & community) Families misperceive costs of college & can be
confused/frustrated by the FA process.
Students are unsure of application requirements and important application and ACT/SAT deadlines.
Students and families may start the process too late.

Why Information is Important
Information is Powerful The quality of information, family/school resources, &
social networks individual students have access to and can apply toward their educational goals plays an important role in attainment (e.g. Bourdieu, Coleman, Hossler, McDonough)
Information Forms Expectations In addition to being necessary to navigate the search
process, information also helps shape students’ expectations for college experience.
Why Do Expectations Matter?
Expectations affect the actual experiences of college students by: 1) Serving as a filter through which students evaluate and
select various types of educational opportunities.
2) Predisposing students to seek specific learning activities.
Student expectations and subsequent experience are not always congruent. Ex: First-generation or low-income students may have
less tacit knowledge of what college is like.
May influence students’ overall performance in college and satisfaction with their experience.
Questions of Interest
How do the primary information sources that shape entering students’ expectations differ by the students’ backgrounds (e.g., gender, race/ethnicity, parents’ education)?
How does the match between student and faculty expectations about time spent studying differ by the students’ backgrounds (including their primary sources of information)?
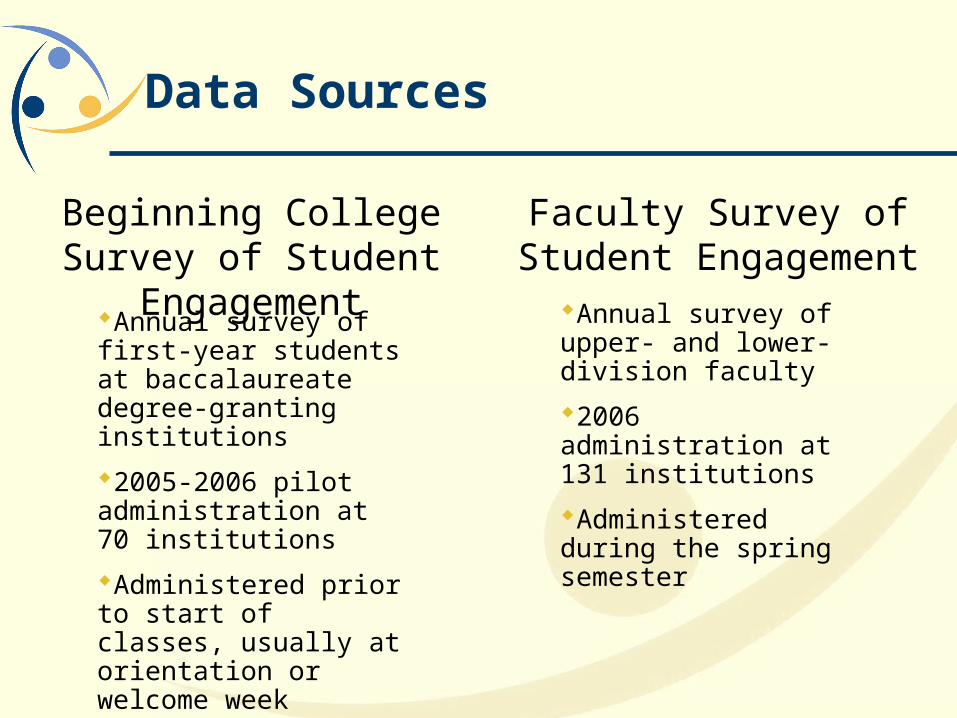
Data Sources
Beginning College Survey of Student
Engagement
Faculty Survey of Student Engagement
Annual survey of first-year students at baccalaureate degree-granting institutions
2005-2006 pilot administration at 70 institutions
Administered prior to start of classes, usually at orientation or welcome week
Annual survey of upper- and lower-division faculty
2006 administration at 131 institutions
Administered during the spring semester
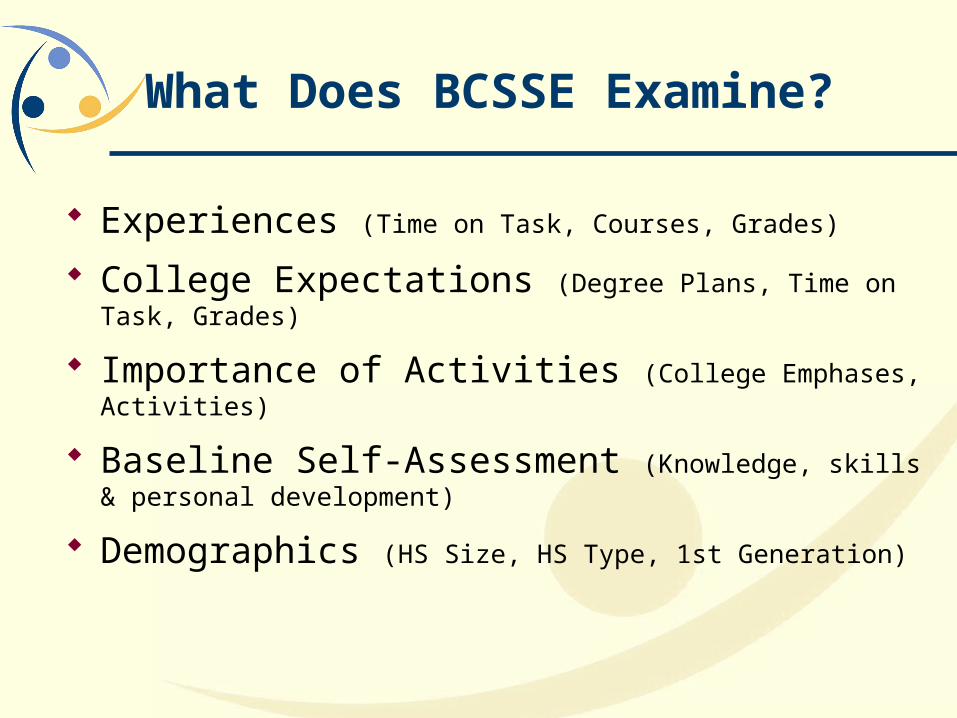
What Does BCSSE Examine?
Experiences (Time on Task, Courses, Grades)
College Expectations (Degree Plans, Time on Task, Grades)
Importance of Activities (College Emphases, Activities)
Baseline Self-Assessment (Knowledge, skills & personal development)
Demographics (HS Size, HS Type, 1st Generation)

What Does FSSE Examine?
Faculty perceptions of how often their students engage in different activities
The importance faculty place on various areas of learning and development
Nature and frequency of student-faculty interactions
How faculty organize class time

Survey Instrument Histories
Both surveys were designed as companions to the National Survey of Student Engagement (NSSE) Annual survey of first-year students and seniors at
four-year institutions that measures extent to which students engage in educational practices associated with high levels of learning and development.
Documents dimensions of quality in undergraduate education and provides information and assistance to colleges, universities, and other organizations to improve student learning.
Approximately 600 institutions plan to participate in NSSE 2007 in the spring.
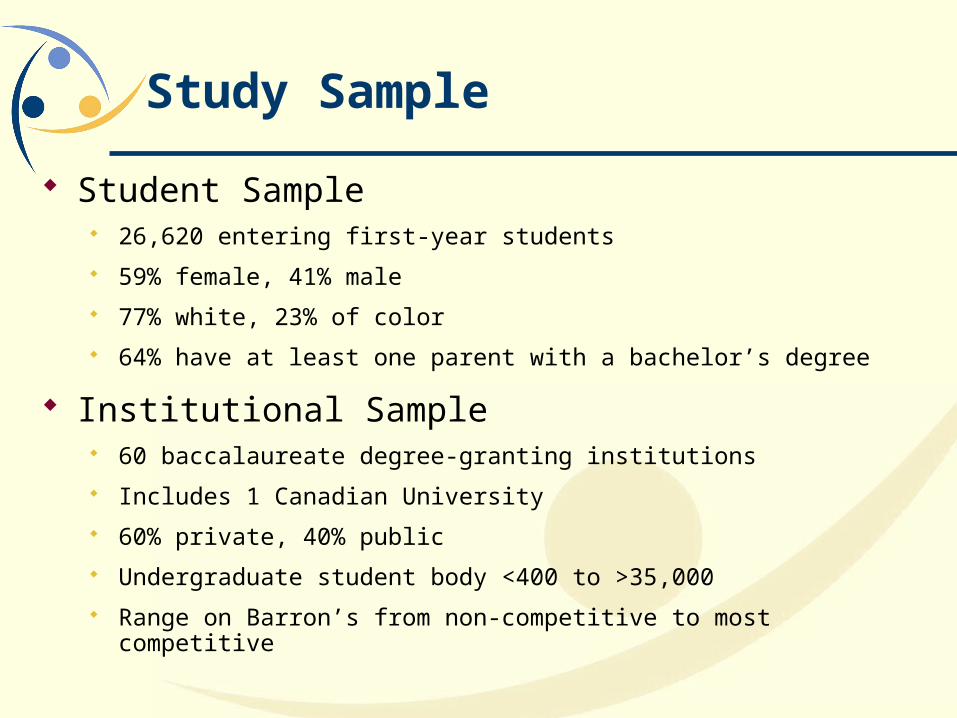
Study Sample
Student Sample 26,620 entering first-year students
59% female, 41% male
77% white, 23% of color
64% have at least one parent with a bachelor’s degree
Institutional Sample 60 baccalaureate degree-granting institutions
Includes 1 Canadian University
60% private, 40% public
Undergraduate student body <400 to >35,000
Range on Barron’s from non-competitive to most competitive
Findings
Part One:Primary Source of
Expectations

Primary Source of Expectations
BCSSE asks of entering college students: To what extent have the following influenced your
expectations about your experience at this college? Family members Friends/students in high school Friends/students already attending this college High school guidance counselors High school teachers/administrators College recruiters/admissions counselors College website/materials Campus visits College orientation External publications (e.g., guidebooks)
Responses range from ‘Not at all’ to ‘A lot’
Family/Friends
High School
College

Primary Source of Expectations
Using cluster analysis, we identified four student types Those students who primarily relied on:
Family and Friends 42% High School 10% College 22% All Sources Equally 26%

Question of Interest #1
How do the primary information sources that shape entering students’ expectations differ by the students’ backgrounds?
Examples:
Are males more likely than females to rely on family/friends as a primary source of information?
Are private high school students more likely than public high school students to rely on the college as a primary source of information?
Have some ideas? Its time to test your knowledge…
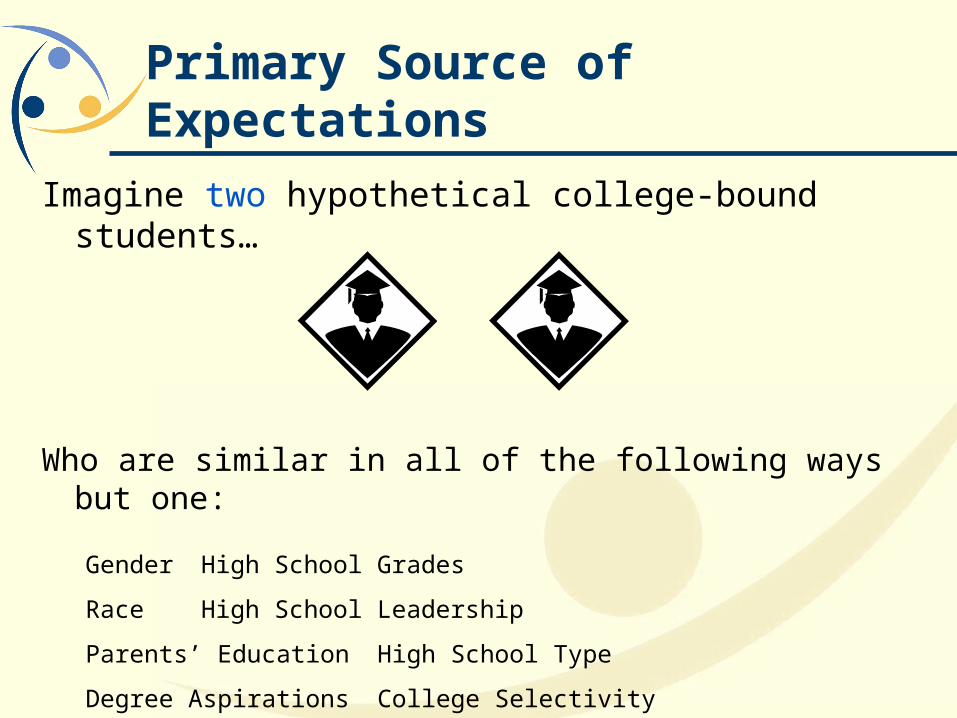
Primary Source of Expectations
Imagine two hypothetical college-bound students…
Who are similar in all of the following ways but one:
Gender High School Grades
Race High School Leadership
Parents’ Education High School Type
Degree Aspirations College Selectivity
Test Your Knowledge: #1
Females are less likely than males to rely on high school as a primary source of information.
True
False
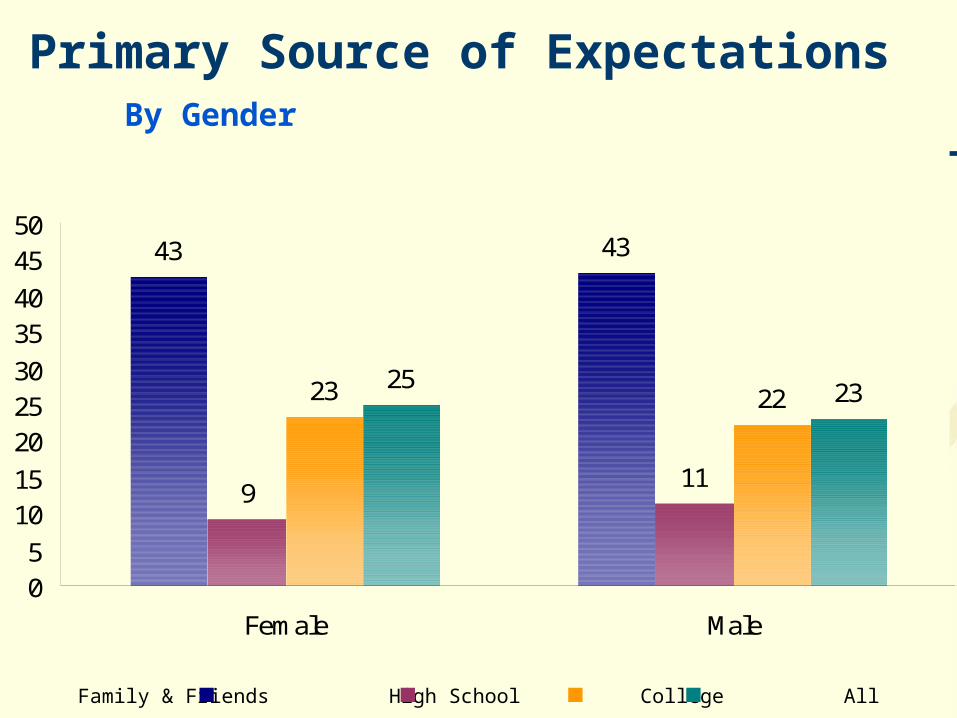
Primary Source of ExpectationsBy Gender
Family & Friends High School College All
43 43
911
23 2225 23
05
1015
202530
3540
4550
Female Male

Test Your Knowledge: #2
Asian American students are less likely than students of other races to rely on family/friends as a primary source of information.
True
False

Primary Source of ExpectationsBy Race
Family & Friends High School College All
29
47
3943
11 1012
10
26
15
2224
33
27 2723
05
1015
202530
3540
4550
African American Asian American Hispanic White

Test Your Knowledge: #3
First-generation students are more likely than other students to rely on high school as a primary source of information.
True
False
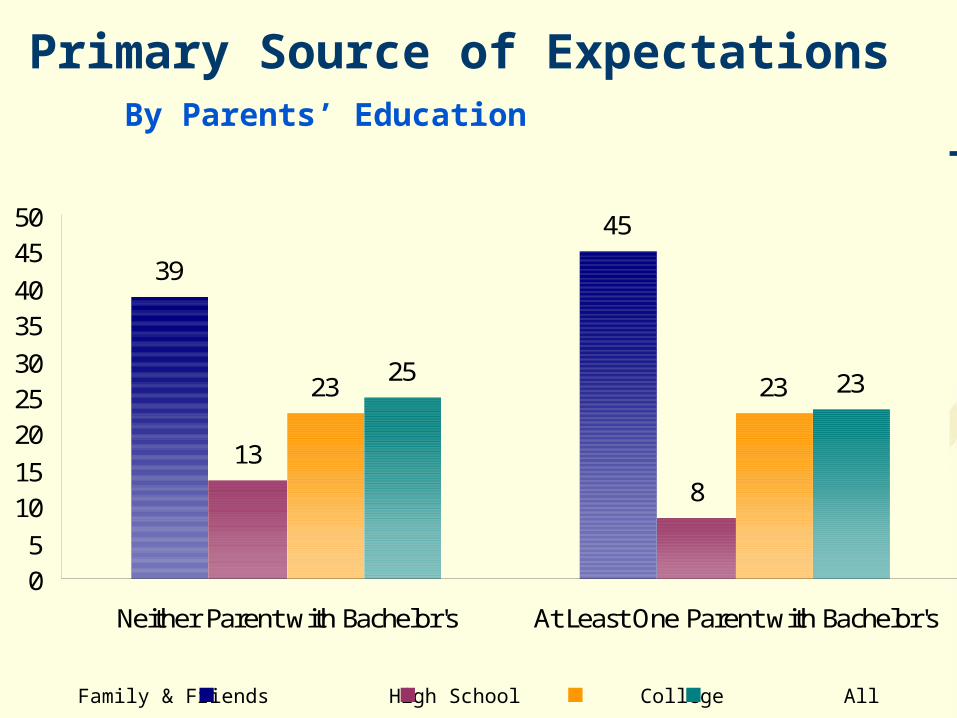
Primary Source of ExpectationsBy Parents’ Education
Family & Friends High School College All
39
45
13
8
23 2325 23
05
1015
202530
3540
4550
Neither Parent with Bachelor's At Least One Parent with Bachelor's
Test Your Knowledge: #4
Students with higher degree aspirations are more likely than students with lower aspirations to rely on college as a primary source of information.
True
False

Primary Source of ExpectationsBy Degree Aspirations
Family & Friends High School College All
43 42 43
10 10 10
23 23 2324 25 24
05
101520253035404550
Bachelor's Level DegreeExpectations
Master's Level DegreeExpectations
Doctoral Level DegreeExpectations

Test Your Knowledge: #5
Students with lower high school GPAs are less likely than students with higher GPAs to rely equally on all sources of information.
True
False
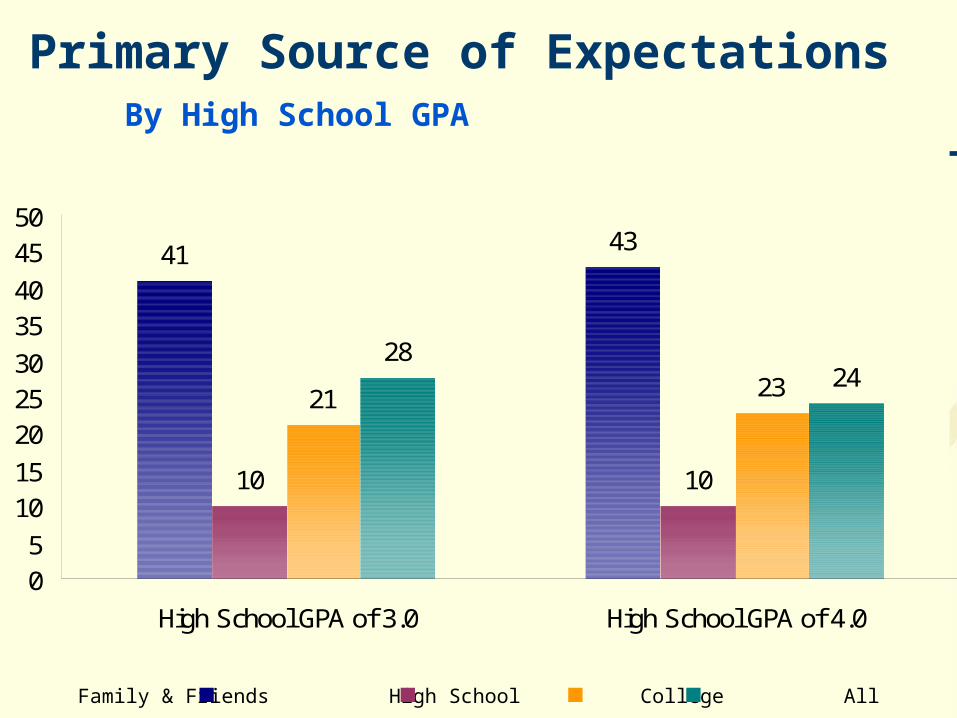
Primary Source of ExpectationsBy High School GPA
Family & Friends High School College All
41 43
10 10
21 2328
24
05
1015
202530
3540
4550
High School GPA of 3.0 High School GPA of 4.0
Test Your Knowledge: #6
Students who are less involved in leadership activities are more likely than students who are more involved to rely on family/friends as a primary source of information.
True
False
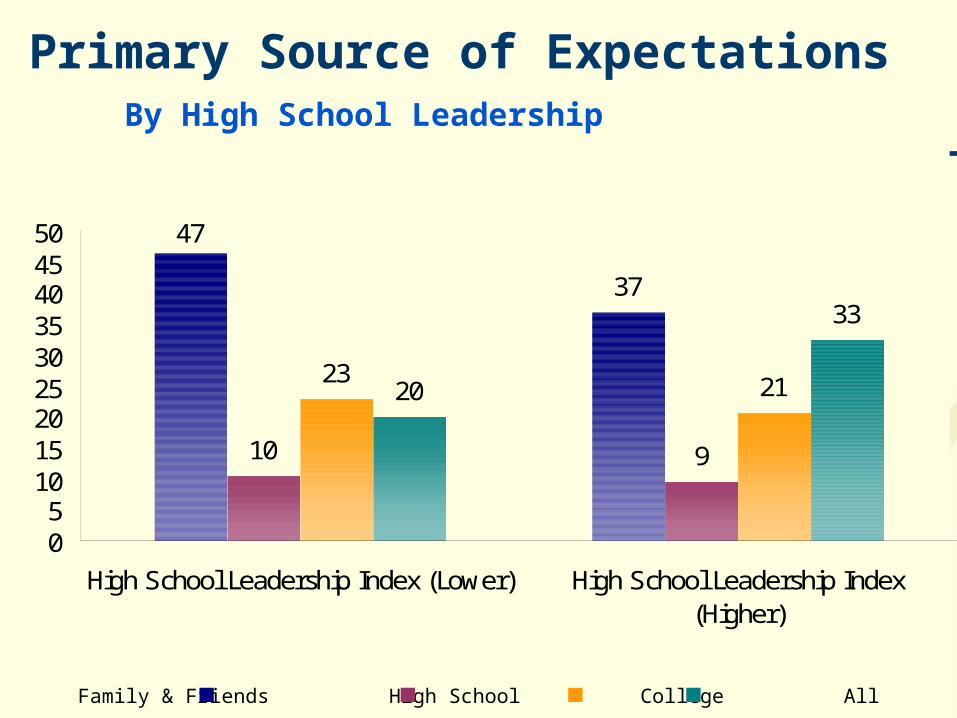
Primary Source of ExpectationsBy High School Leadership
Family & Friends High School College All
47
37
10 9
23 2120
33
05
101520253035404550
High School Leadership Index (Lower) High School Leadership Index(Higher)

Test Your Knowledge: #7
Students who attend private high schools are more likely than their public school peers to rely on high school as a primary source of information.
True
False

Primary Source of ExpectationsBy High School Type
Family & Friends High School College All
43
32
41
10
20
11
22 21 2226 28 27
05
101520253035404550
Public High School Private High School Religious High School

Test Your Knowledge: #8
Students who attend more selective colleges are more likely than students who attend less selective colleges to rely on college as a primary source of information.
True
False
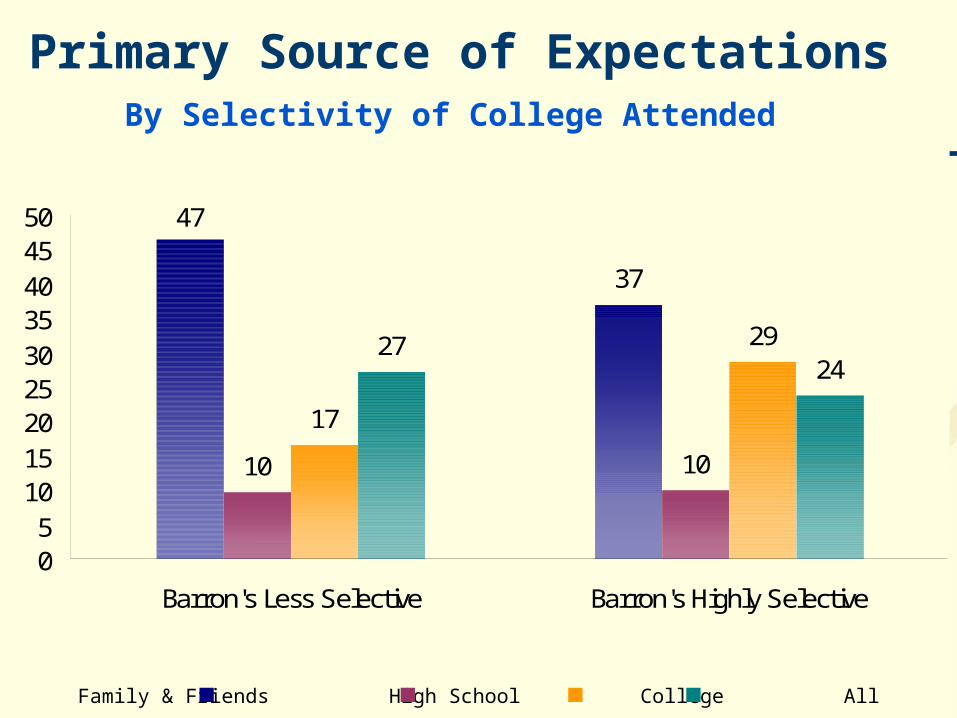
Primary Source of ExpectationsBy Selectivity of College Attended
Family & Friends High School College All
47
37
10 10
17
292724
05
101520253035404550
Barron's Less Selective Barron's Highly Selective

Primary Source of Expectations
“Test Your Knowledge” Scores 7-8 Good Job!
5-6 Not Bad!
1-4 This has been educational, No?
Summary of Findings
Most students rely on family/friends as a primary source of information to shape their college expectations
Differences in the primary source of information on which students rely seem most pronounced by: Race
Parents’ education
High school leadership
High school type
Selectivity of the college attended
Primary Source of Expectations
Question for Consideration:
(When) Does the source of information matter?
Answer:
When examining the accuracy of student expectations
Example:
Comparing student expectations with faculty expectations about the time per week that students spend studying

Findings
Part Two:Matching Faculty
Expectations
Time Spent Studying
BCSSE asks of entering college students:
During the coming school year, about how many hours do you think you will spend in a typical 7-day week preparing for your class (studying, reading, writing, doing homework or lab work, analyzing data, rehearsing, and other academic activities)?
FSSE asks of lower division faculty and instructors:
In a typical 7-day week, about how many hours do you expect your students to spend preparing for your class (studying, reading, writing, doing homework or lab work, analyzing data, rehearsing, and other academic activities)
Student responses were compared to adjusted average lower division faculty responses by college Carnegie Classification

Question of Interest #2
How does the match between student and faculty expectations about time spent studying differ by the students’ backgrounds?
Examples:
Are students who primarily rely on family/friends more likely than other students to match faculty expectations?
Are students who attend more selective colleges less likely than other students to match faculty expectations?
Have some ideas?
Its time again to test your knowledge…

Matching Faculty Expectations
Imagine two hypothetical college-bound students…
Who are similar in all of the following ways but one:
Primary Source of Information High School Grades
Gender High School Leadership
Race High School Type
Parents’ Education College Selectivity
Degree Aspirations
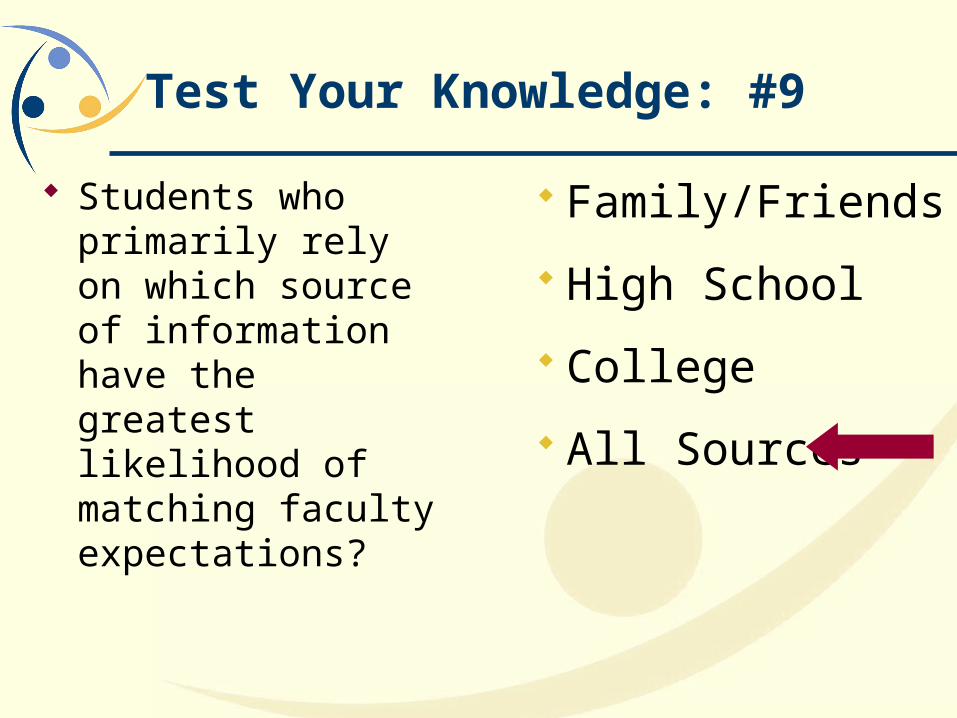
Test Your Knowledge: #9
Students who primarily rely on which source of information have the greatest likelihood of matching faculty expectations?
Family/Friends
High School
College
All Sources

Matching Faculty ExpectationsBy Information Source
50 53 55 58
0
10
20
30
40
50
60
70
Family/Friends High School College All

Test Your Knowledge: #10
Females are less likely than males to match faculty expectations.
True
False
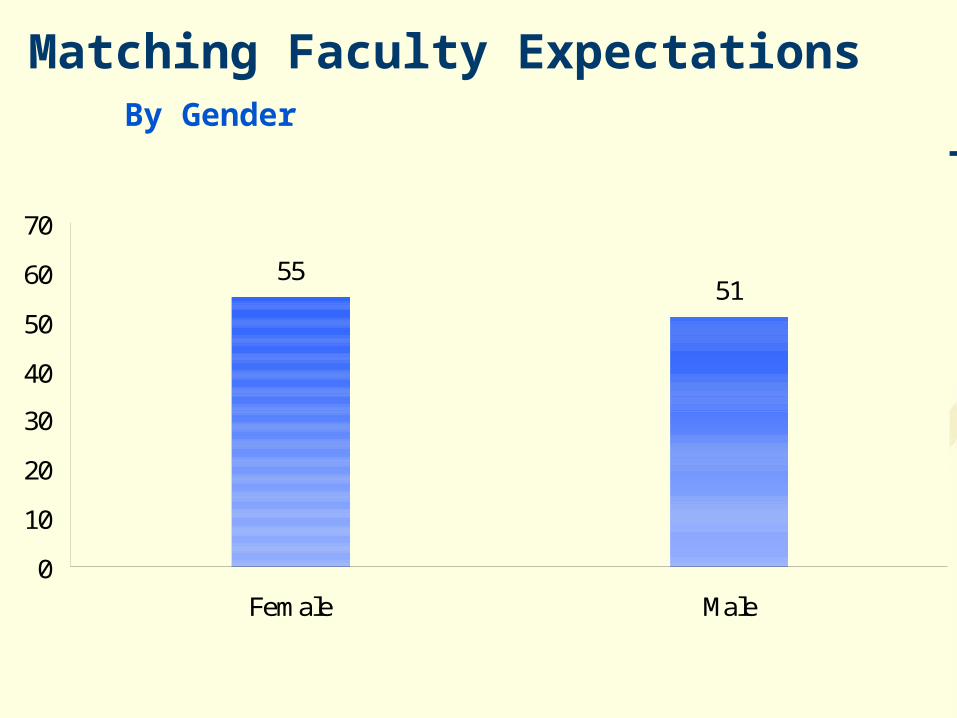
Matching Faculty ExpectationsBy Gender
5551
0
10
20
30
40
50
60
70
Female Male
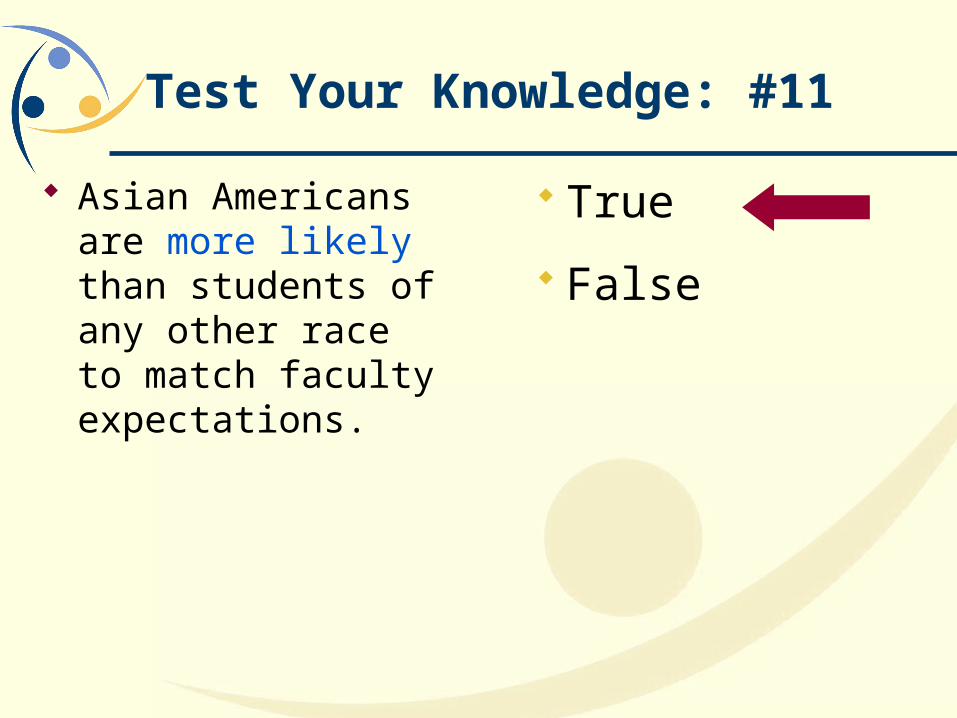
Test Your Knowledge: #11
Asian Americans are more likely than students of any other race to match faculty expectations.
True
False
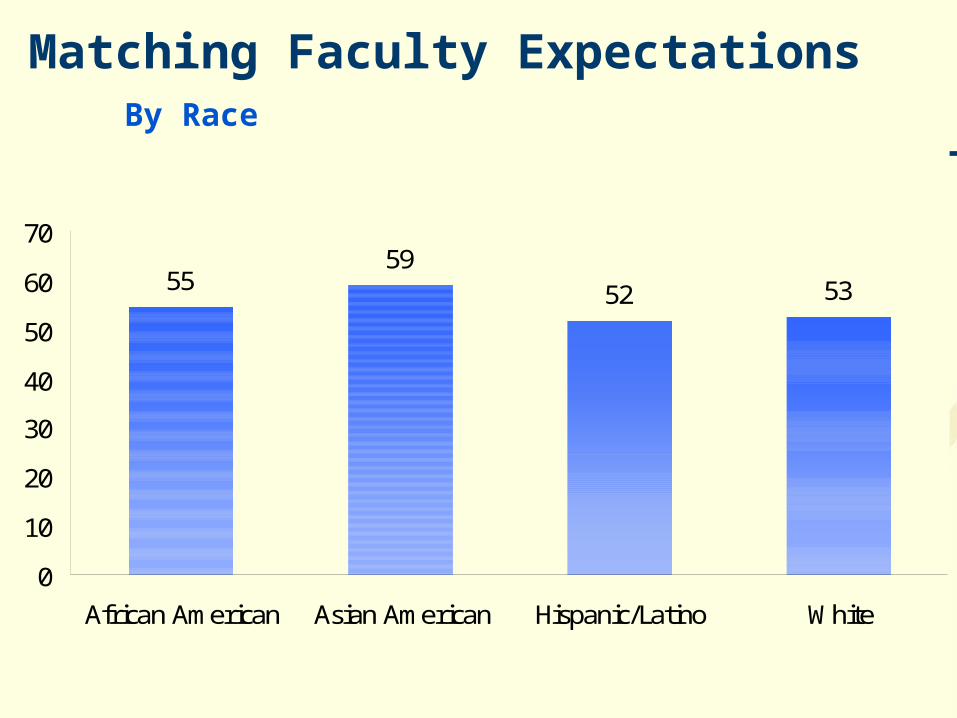
Matching Faculty ExpectationsBy Race
5559
52 53
0
10
20
30
40
50
60
70
African American Asian American Hispanic/Latino White

Test Your Knowledge: #12
First-generation students are less likely than other students to match faculty expectations.
True
False

Matching Faculty ExpectationsBy Parents’ Education
52 54
0
10
20
30
40
50
60
70
Neither Parent with Bachelor's At Least One Parent with Bachelor's
Test Your Knowledge: #13
Students with higher degree aspirations have the same likelihood as students with lower aspirations of matching faculty expectations.
True
False

Matching Faculty ExpectationsBy Degree Aspirations
4954
59
0
10
20
30
40
50
60
70
Bachelor's Level DegreeExpectations
Master's Level DegreeExpectations
Doctoral Level DegreeExpectations

Test Your Knowledge: #14
Students with higher high school GPAs are more likely than students with lower GPAs to match faculty expectations.
True
False

Primary Source of ExpectationsBy High School GPA
5255
0
10
20
30
40
50
60
70
High School GPA 3.0 High School GPA 4.0
Test Your Knowledge: #15
Students who are more active in leadership activities in high school are less likely than students who are less active to match faculty expectations.
True
False
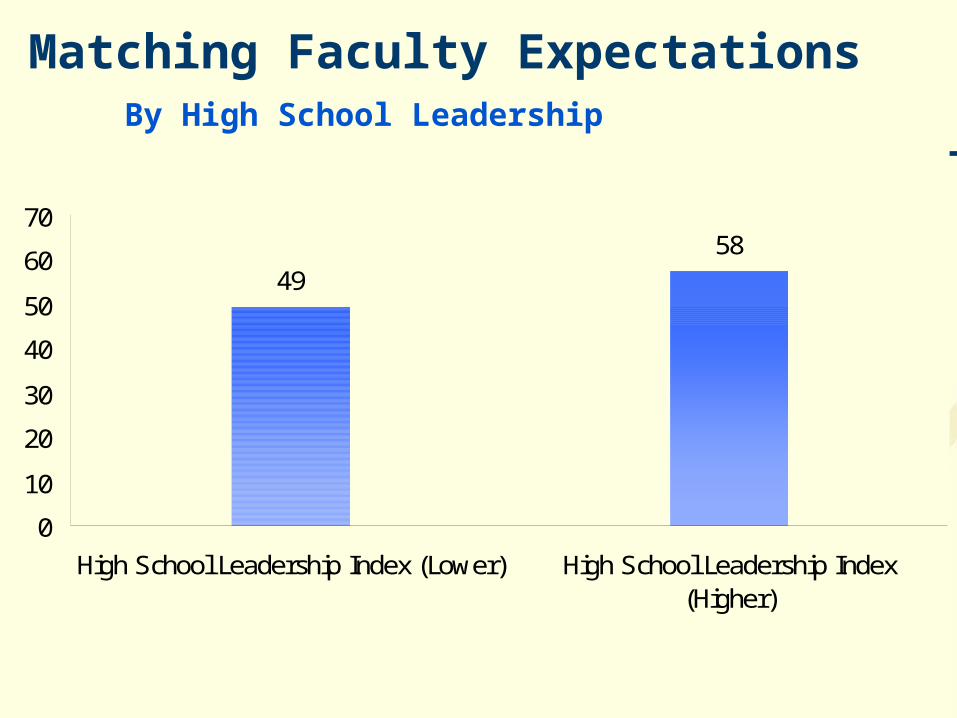
Matching Faculty ExpectationsBy High School Leadership
4958
0
10
20
30
40
50
60
70
High School Leadership Index (Lower) High School Leadership Index(Higher)
Test Your Knowledge: #16
True/FalseStudents who attend public high schools are less likely than students who attend private schools to match faculty expectations.
True
False
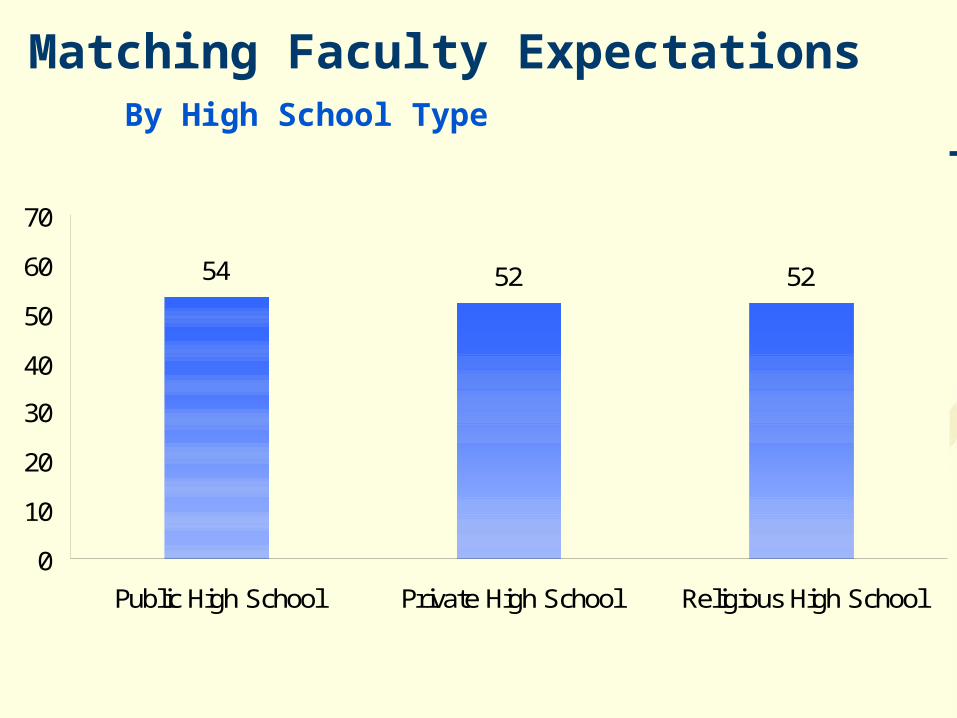
Matching Faculty ExpectationsBy High School Type
54 52 52
0
10
20
30
40
50
60
70
Public High School Private High School Religious High School
Test Your Knowledge: #17
Students who attend more selective colleges are more likely than students who attend less selective colleges to match faculty expectations.
True
False

Matching Faculty ExpectationsBy Selectivity of College Attended
49
58
0
10
20
30
40
50
60
70
Barron's Less Selective College
Barron's Highly Selective College
Matching Faculty Expectations
“Test Your Knowledge” Scores
7-9 Nice Work!
5-6 Not Bad!
1-4 This has been educational, no?

Summary of Key Findings
Family/friends were by far the most often cited source of college expectations, yet students who relied primarily on this source were least likely to match faculty expectations.
Students who relied on all sources equally had the greatest likelihood of matching faculty expectations.
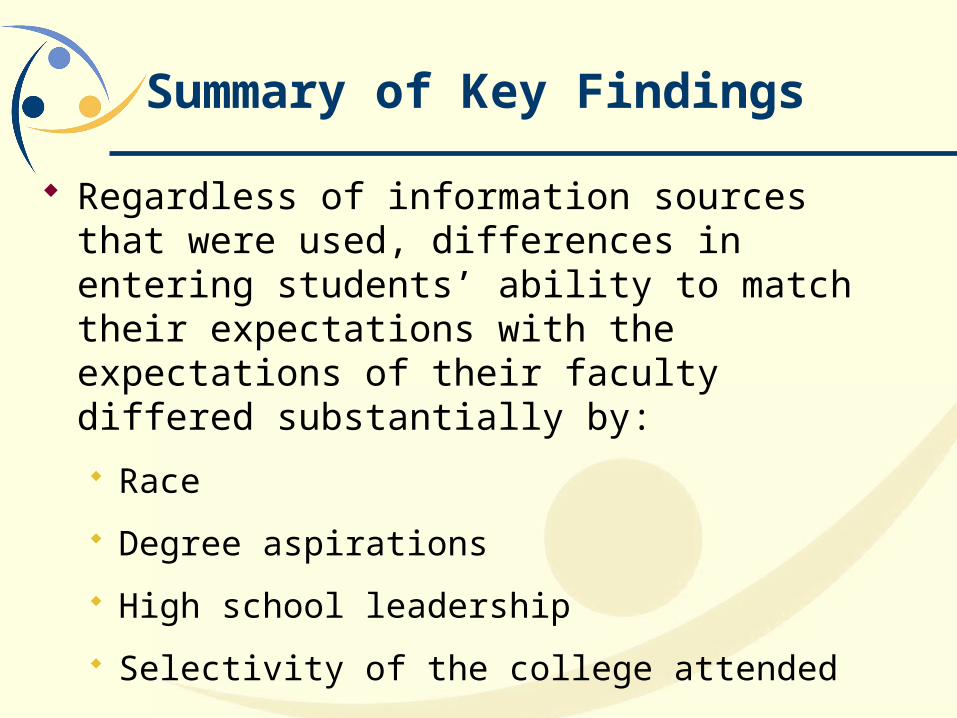
Summary of Key Findings
Regardless of information sources that were used, differences in entering students’ ability to match their expectations with the expectations of their faculty differed substantially by:
Race
Degree aspirations
High school leadership
Selectivity of the college attended

Implications
What does all of this mean for practice?

NACAC- Statement of Principles of Good Practice
Core Values - Include Education-Committed to educating students, their
families, the public, fellow education professionals, and ourselves about the transition to and within postsecondary education.
Fairness and Equity-Have a responsibility to treat one another and students in a fundamentally fair and equitable manner.
Social Responsibility-have a duty to serve student responsibly, by safeguarding their rights and their access to and within postsecondary education.

Implications for Practice
#1: Heavy Role of Family/Friends Focus on availability of quality and comprehensive
information for all
Do information sessions include “ what to expect” conversations? Academics? Extra-curriculars?
Is information provided at different levels of specificity?
Do we help all families (FG, low income, various races) develop accurate expectations of college?
Do we help students ask questions during campus visits that lead to accurate expectations?
Implications for Practice
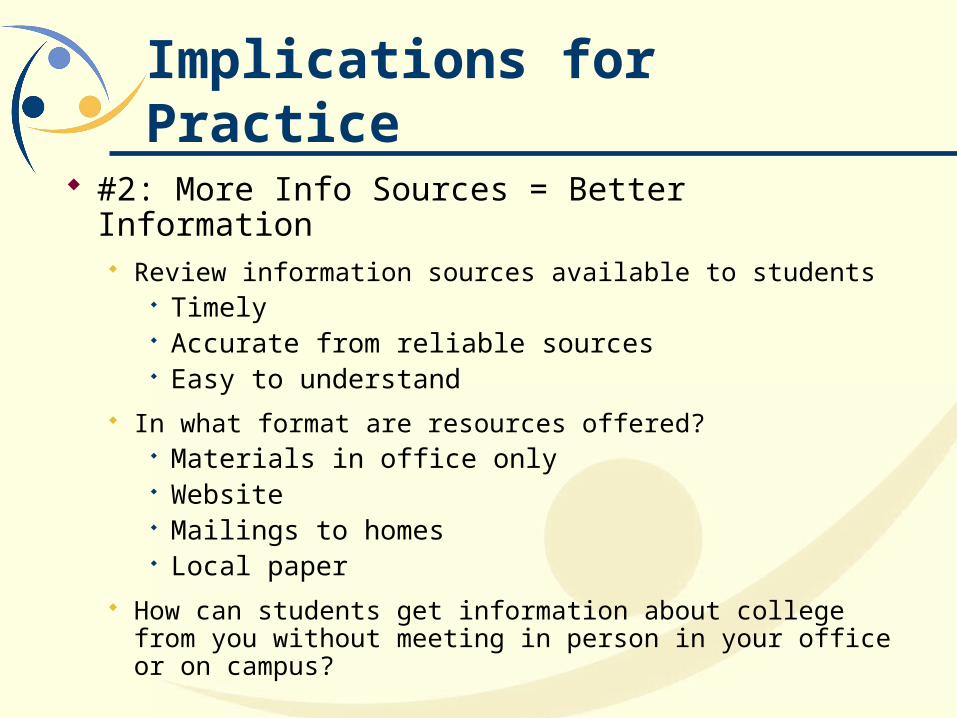
#2: More Info Sources = Better Information Review information sources available to students
Timely Accurate from reliable sources Easy to understand
In what format are resources offered? Materials in office only Website Mailings to homes Local paper
How can students get information about college from you without meeting in person in your office or on campus?
Implications for Practice
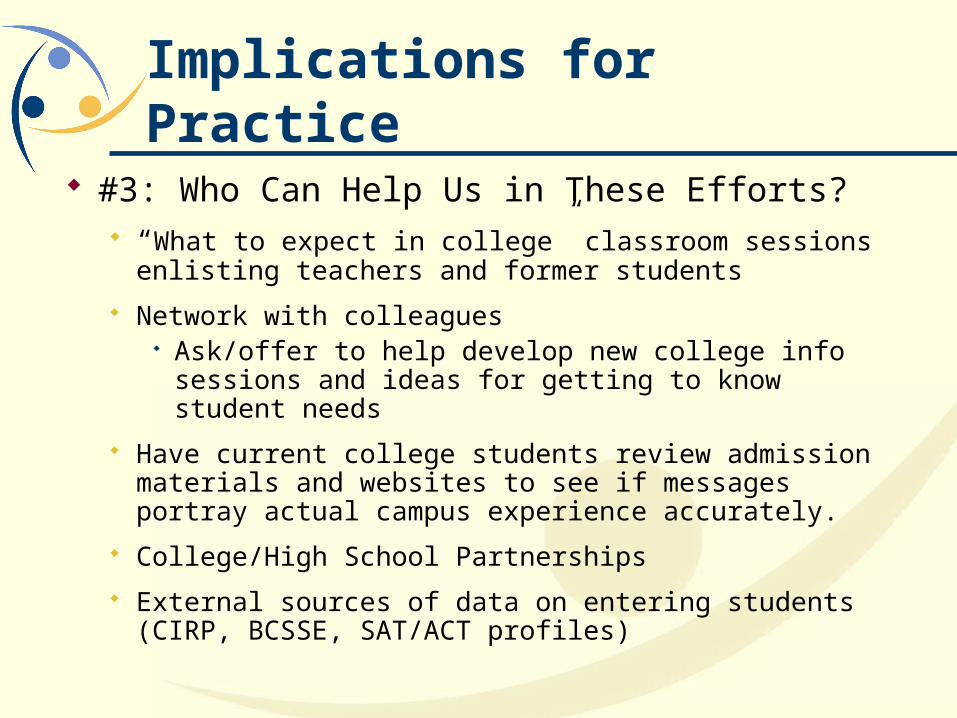
#3: Who Can Help Us in These Efforts? “What to expect in college” classroom sessions
enlisting teachers and former students
Network with colleagues Ask/offer to help develop new college info
sessions and ideas for getting to know student needs
Have current college students review admission materials and websites to see if messages portray actual campus experience accurately.
College/High School Partnerships
External sources of data on entering students (CIRP, BCSSE, SAT/ACT profiles)
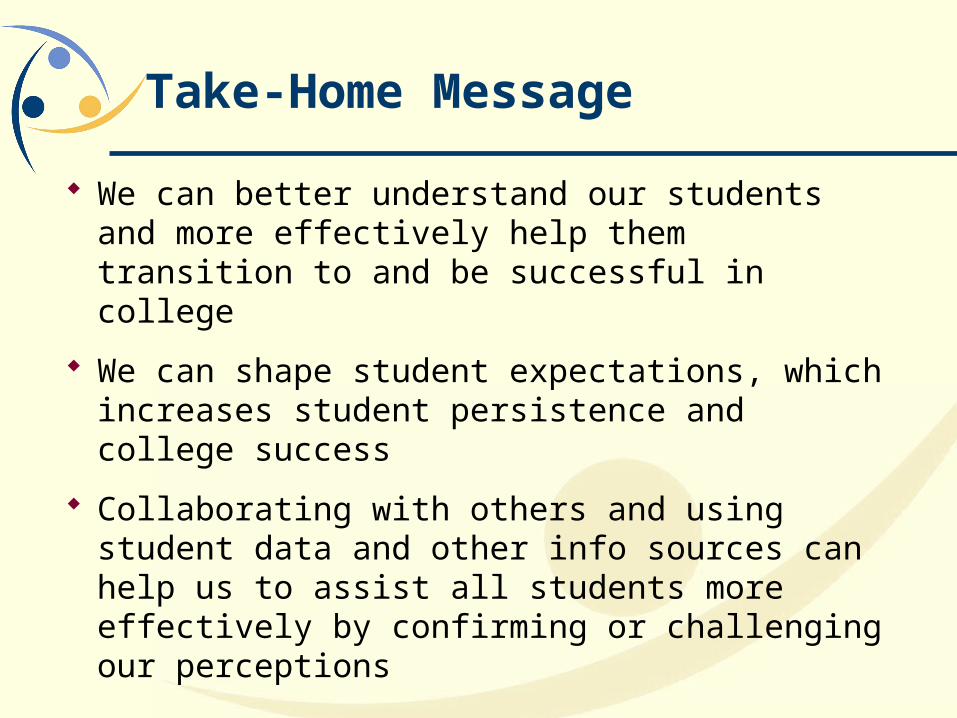
Take-Home Message
We can better understand our students and more effectively help them transition to and be successful in college
We can shape student expectations, which increases student persistence and college success
Collaborating with others and using student data and other info sources can help us to assist all students more effectively by confirming or challenging our perceptions

Participating InstitutionsBethel University
Brigham Young University-Hawaii
Brigham Young University
Case Western Reserve University
Clayton College and State University
Denison University
Drake University
Edgewood College
Elon University
Fort Lewis College
Goucher College
Hanover College
Harvey Mudd College
Henderson State University
Heritage University
Holy Family University
Illinois Wesleyan University
Indiana University-Bloomington
Indiana University-East
Indiana University-South Bend
John Carroll University
Loyola University Chicago
Lynchburg College
Mcneese State University
Morningside College
Mount Saint Mary's University
New Mexico Institute of Mining and Technology
Northwest Christian College
Paul Smiths College of Arts and Science
Pennsylvania State University-Berks
Queen's University
Radford University
Rider University
Rose-Hulman Institute of Technology
Saint Ambrose University
Saint Xavier University
Siena College
Southern Connecticut State University
Southwestern Assemblies of God University
Southwestern College
Syracuse University
The Richard Stockton College of New Jersey
The University of Tennessee-Martin
Thiel College
Trinity Western University
University of British Columbia
University of Guelph
University of Maine at Farmington
University of Missouri-Kansas City
University of San Francisco
University of South Dakota
University of South Florida St. Petersburg
University of St Francis
University of Toronto
University of Windsor
University of Wisconsin-La Crosse
University of Wisconsin-Stevens Point
University of Wisconsin-Stout
Ursinus College
Utah State University
Virginia Commonwealth University
Viterbo University
Voorhees College
Wabash College
Washington & Jefferson College
Washington State University
Western Illinois University
Western Kentucky University
Western New Mexico University
Worcester Polytechnic Institute
Contact Information
Email: Julie Williams [email protected]
Ty Cruce [email protected]
John Moore [email protected]
Presentation materials from this session
are available on the NSSE website: www.nsse.iub.edu
NSSE efforts have been supported by The Carnegie Foundation for the Advancement of Teaching, The Pew Forum on Undergraduate Learning, The Lumina Foundation, and the Center for Inquiry into the Liberal Arts at Wabash College.