Embed Size (px)
Citation preview
1000 Thomas Jefferson Street NW
Washington, DC 20007-3835
202-403-5000 | TTY 877-334-3499
www.earlywarningsystems.org
Copyright © 2014 American Institutes for Research. All rights reserved.
www.air.org 3028_08/14
College Persistence Indicators
Research Review
August 2014
Prepared by: Susan Bowles Therriault, Ed.D.
Ariel Krivoshey
American Institutes for Research
Supported by:
The following review of research was originally developed for the Massachusetts Executive Office of
Education, The Massachusetts Department of Elementary and Secondary Education and The Massachusetts
Department of Higher Education and funded through their Statewide Longitudinal Data Systems (SLDS)
Grant Program, provided by the U.S. Department of Education. Information has been modified to apply to
any state considering examining indicators of students’ persistence in post-secondary education.

Contents Page
Introduction ......................................................................................................................................1
Findings............................................................................................................................................1
Caveats and Considerations .............................................................................................................2
Student-Level Indicators ..................................................................................................................2
Precollege Indicators ..................................................................................................................2
College Indicators ......................................................................................................................4
Academic Indicators ............................................................................................................4
Social Indicators...................................................................................................................5
Life Experience Indicators .........................................................................................................6
Institutional Factors .........................................................................................................................7
State Persistence Indicators for Consideration ................................................................................8
Recommendations ..........................................................................................................................15
References ......................................................................................................................................16
American Institutes for Research College Persistence Indicators Research Review—1
Introduction
The following is a review of research on higher education persistence indicators. For the
purposes of this document, higher education persistence indicators are those indicators that can
be used to predict whether a student will stay in college and complete a two- or four-year degree.
The review was originally conducted by researchers at the American Institutes for Research
(AIR) for the Executive Office of Education, the Massachusetts Department of Elementary and
Secondary Education (ESE), the Massachusetts Department of Higher Education (DHE), and the
Massachusetts Department of Early Education and Care. The following has been modified to be
applicable to other states considering the collection and analysis of these types of indicators.
The review of research was conducted through an extensive search of online databases and
websites focused on research related to persistence indicators and college completion. The
databases and search engines used in the search were JSTOR, Education Resources Information
Center (ERIC), and Google. In addition, AIR higher education experts were interviewed to
identify seminal research on the topic.
Findings
Research suggests that the underlying reasons for not completing a college degree are as varied
as the numbers and types of students who attend college. Three decades of research focused on
persistence reveals that the topic is complex in that it represents a blending of individual
personal, academic, and background characteristics with higher education institutions, as well as
a transition between arguably structured educational experience (high school) to a wide range of
settings, climates, and cultures that characterize colleges and universities. Still, there are early
signs of risk that a student will not complete a degree. These signs or indicators may allow high
schools and institutions of higher education to target supports to students while they are still in
school and well as to examine patterns over time. Tracking these indicators may enable higher
education institutions to meet accountability measures to improve degree completion rates.
This review focuses on indicators that could be included as data elements within a state
longitudinal data system in terms of the practicality of data sources and burden of collection.
Therefore, to the extent possible we have limited our presentation to those persistence indicators
that are prevalent in the literature, and then indicate when they are clear and measurable.
The review primarily examined potential indicators of college persistence for individual students
and also examined some indicators that are specifically related to characteristics of higher
education institutions. Accordingly, the findings are organized into student indicators and
institutional indicators. The student indicators fall into three categories: precollege behavior,
college behavior, and life experience. Finally, the last section discusses key considerations for
states interested in these types of indicators.

American Institutes for Research College Persistence Indicators Research Review—2
Caveats and Considerations
Research on persistence in college spans decades and reflects shifts in thinking about access to
higher education, as well as ideas about the demand and necessity of a college education. The
evolution in ideas about who and why students should complete a college degree, and the
assumptions about the ways in which students access college, are different today from what they
may have been even a decade ago (e.g., the expectation that most students attending four-year
institutions reside on or near campus). Therefore, it is likely that there are new indicators of
persistence that more accurately capture information about the students who enroll in college and
the ways in which the access college (e.g., taking online courses, attending part-time). Similarly,
it is very possible that some indicators that are based on older research are no longer accurate
predictors of whether students persist in college or not.
It is also important to note that the research on persistence in higher education tends to focus on
completion of the first year (or even semester) of school, since that is the observable point at
which a large number of students either continue in their studies or drop out of college. This has
implications for how the research and this review are interpreted. First, the indicators identified
may be more accurate for predicting the probability of first-year completion than 2- or 4-year
degree completion. Second, there may be additional or different indicators (e.g., credit
accumulation, level of courses taken) that are more predictive of college completion as a student
progresses from year to year.
The indicators presented in this review represent possible indicators for consideration. State
leaders and policymakers need ensure attention to the level of burden for collecting student-level
data and defining indicators is paid, as the burden for some may prove to be too great (e.g.,
student-faculty interaction).
Student-Level Indicators
Student-level persistence indicators are related to students’ background characteristics, preparation
for college, college experience, and life experience. Together these represent a complex set of
factors that affect students’ ability to persist in college. The following section focuses on student-
level indicators and have been organized into three broad categories: (1) precollege indicators, (2)
college indicators (academic and social), and (3) life experience-related indicators.
Precollege Indicators
Precollege indicators are based on student data obtained before the student enters college and
that are predictive of whether a student will persist in college. Precollege indicators are based on
information prior to a student entering college. Therefore, these indicators may be used to
identify students who may benefit from support while they are still in high school that could
potentially improve their likelihood of persisting in college.1 Often referred to as “college
readiness,” precollege indicators tend to focus on the level of preparation a high school student
needs to succeed, without remediation, in a core, credit-level course of study at a postsecondary
1 Precollege indicators may be used as part of the selection criteria for some colleges.

American Institutes for Research College Persistence Indicators Research Review—3
institution (Conaway, 2009; Conley, 2007; D’Amico, Morgan, Robertson, & Rivers, 2010;
NCES, 2004). Exhibit 1 provides an overview of precollege indicators.
Exhibit 1. Summary Precollege Indicators of College Persistence
Indicator Description/Comments
Intensity of a
Student’s
High School
Curriculum
According to Adelman (2006) 95 percent of students completed a bachelor’s degree if they
had, at a minimum had a high school transcript with the following characteristics.
3.75 or more Carnegie units of English
3.75 or more Carnegie units of mathematics
highest mathematics of either calculus, precalculus, or trigonometry
2.5 or more Carnegie units of science or more than 2.0 Carnegie units of core
laboratory science (biology, chemistry, and physics)
more than 2.0 Carnegie Units of foreign languages
more than 2.0 Carnegie Units of history and social studies
or more Carnegie Units of computer science
More than one Advanced Placement course
No remedial English; no remedial mathematics
Advanced
Placement
Results
A student who scores below a three on the advanced placement (AP) exams is less likely to
persist in college than student score a three or higher. One interpretation of this finding is that
possessing a solid foundation in content—as evidenced by success on AP exams—is a critical
component for success in college (ACT, 2009; Conley, 2007). Note It is suggested that AP
performance may reflect habits of mind that contribute to college success and that students
who access AP courses through nontraditional means may not possess these same
characteristics and may be receiving supports that allow them to be successful on AP, but not
necessarily acquire the skills related to persistence (Roderick, et. al., 2008).
End-of-
Course Exams
A student who scores below the proficiency level on an end-of-course exam in high school
may be at risk of not persisting in college (Conley, 2007).
High School
Grades
A student who maintains a C average or lower in high school is less likely than a student who
maintains above a C-average to persist in college. Findings from one study, that is not nationally
representative, suggests that students who have an A-average are seven times more likely to
complete college in four years when compared to students with a C-average (Reason, 2009).
SAT Scores Students who perform poorly on college entrance exams are less likely to persist in college
than students who receive the highest scores on college entrance exams. Students with the
highest SAT scores were found to be six times as likely to graduate from college in four years
as students with the lowest scores (Ryan, 2004). Note: The exact cutoff or threshold for high
versus low SAT scores was not provided.
Dual-
Enrollment
Program (on a
College
Campus)
Dual-enrollment courses allow students to enroll in college-level courses (often for college
credit) while still in high school. Sometimes dual enrollment programs reflect a particular
career pathway (e.g., health, technology). Students who participate in dual-enrollment
programs focused on career-type courses and located on a college campus are more likely to
persist in college than similar students (attending college) who do not (D’Amico et al., 2010;
Hughes et al., 2005). One possible reason for this finding is that participating in a dual-
enrollment program exposes high-school upper classmen to the skills required to be successful
at the college level (D’Amico et al., 2010; Hughes, Karp, Fermin, & Bailey,
2005).Additionally, Berger, et.al. (2008) suggest that students in early college high school
programs (a specific type of dual enrollment program) who participate in college courses on a
college campus are more likely to be academically successful.

American Institutes for Research College Persistence Indicators Research Review—4
College Indicators
While enrolled in college, indicators related to students’ academic behavior and social
experience are predictive of whether a student will persist in college.
Academic Indicators
Academic behaviors center on a student’s college academic performance and desire for
intellectual development (Terenzini & Pascarella, 1980; Tinto, 1975, 1997). There are a number
of ways in which academic behaviors can be captured as relatively simple indicators, but the
primary measures in previous research are participation in remedial courses and grade point
average (GPA). Again, both remedial coursetaking and GPA are results of complex interacting
factors related to students’ background characteristics, academic behavior (before and during
college), commitment to career and performance goals, and commitment to the individual
college (Donovan, 1984; Tinto, 1975, 1997). Other academic behavior indicators that may be
more difficult to measure than GPA include personal goals and commitments (Kahn & Nauta,
2001; Pascarella & Terenzini, 1980; Titus, 2004) and institutional allegiance (Bean, 1980;
Berger & Milem, 1999; Pascarella &Terenzini, 1980). Exhibit 2 provides an overview of
academic college indicators of persistence.
Exhibit 2. Summary of Academic College Indicators of Persistence
Indicator Description/ Comments
Participation in
Remedial
Courses
Taking remedial, non-credit bearing courses in the first year of college is an indicator of risk
for dropping out of college (Conley, 2007, Adelman, 1999). For example, students who
take a remedial reading course in college are 41% more likely to drop out of college (NCES,
2004). This is a particularly critical issue in that many students are entering postsecondary
institutions unprepared for the rigorous course load (Conaway, 2009; Conley, 2007;
D’Amico et al., 2010; NCES, 2004). In fact, recent statistics suggest that 42 percent of
undergraduate students have taken a remedial course in college (NCES, 2011).
Grade Point
Average (GPA)
Students who maintain a college GPA of C-average or lower are less likely to persist in
college than their peers with higher GPAs and the likelihood of a student completing college
diminished as his or her GPA declined (Hu & St. John, 2001; Kahn & Nauta, 2001; Tinto,
1975; Titus, 2004). According to Adelman (1999, 2006) students who are in the top 40
percent of GPAs are likely to complete a college degree
Credits Earned
after First Year
of College
Students who earn less than 20 credits by the end of the first year of enrollment are lessens
the predictive probability that they will graduate by one-third compared to students who
earn 20 or more credits in their first year (Adelman, 1999, 2006).
Credits Earned
over Summer
Terms
Students who earn four or more credits during summer terms improved the predictive probability
that they would earn a degree. Note that African American students who earned four credits
during who earned more than 4 credits during summer terms showed a significant improvement
in the likelihood they would complete a college degree (Adelman, 2006).
Full v. Part-
Time Status
Students who fall to a part-time status are less likely to persist in college (Adelman, 2006;
Carroll, 1989). Note: Adelman (2006) found that a student who went to part time status ever
in his/her college career reduced the predictive probability of completing a college degree by
30 percent when compared to students who maintain a full time status. However, given the
way in which students attend college (e.g., multiple institutions, part time and full time
statuses, etc.), this indicator needs to be tested.
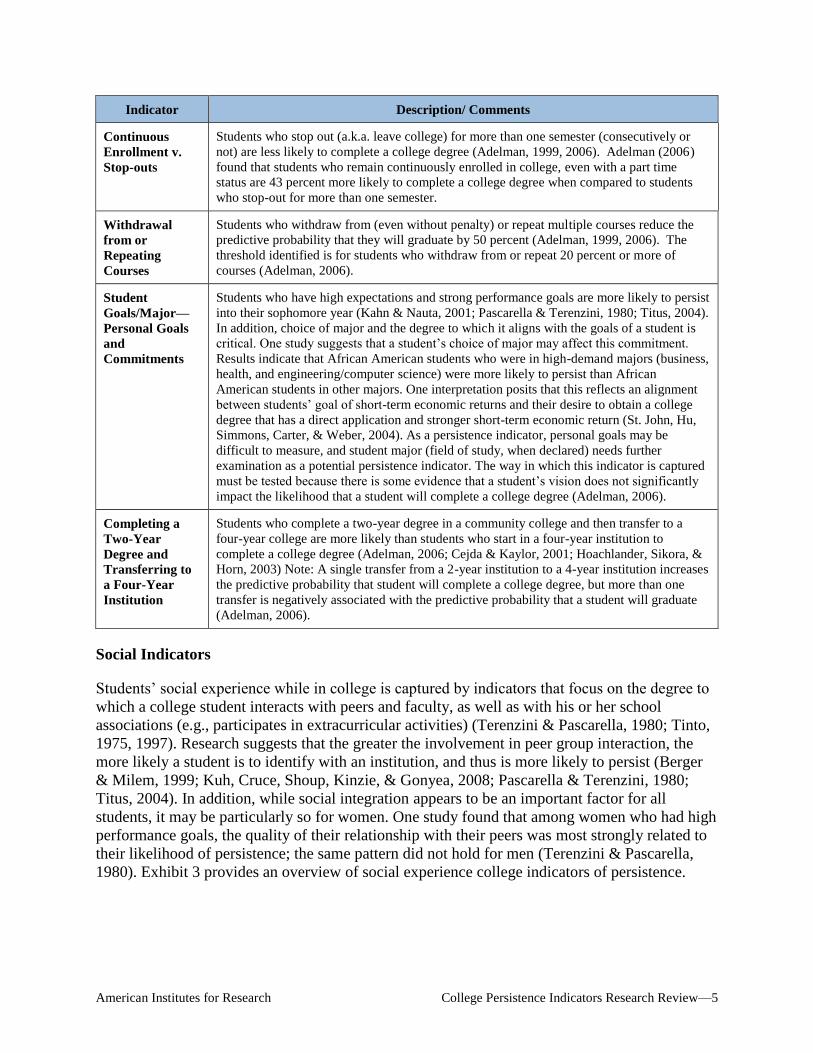
American Institutes for Research College Persistence Indicators Research Review—5
Indicator Description/ Comments
Continuous
Enrollment v.
Stop-outs
Students who stop out (a.k.a. leave college) for more than one semester (consecutively or
not) are less likely to complete a college degree (Adelman, 1999, 2006). Adelman (2006)
found that students who remain continuously enrolled in college, even with a part time
status are 43 percent more likely to complete a college degree when compared to students
who stop-out for more than one semester.
Withdrawal
from or
Repeating
Courses
Students who withdraw from (even without penalty) or repeat multiple courses reduce the
predictive probability that they will graduate by 50 percent (Adelman, 1999, 2006). The
threshold identified is for students who withdraw from or repeat 20 percent or more of
courses (Adelman, 2006).
Student
Goals/Major—
Personal Goals
and
Commitments
Students who have high expectations and strong performance goals are more likely to persist
into their sophomore year (Kahn & Nauta, 2001; Pascarella & Terenzini, 1980; Titus, 2004).
In addition, choice of major and the degree to which it aligns with the goals of a student is
critical. One study suggests that a student’s choice of major may affect this commitment.
Results indicate that African American students who were in high-demand majors (business,
health, and engineering/computer science) were more likely to persist than African
American students in other majors. One interpretation posits that this reflects an alignment
between students’ goal of short-term economic returns and their desire to obtain a college
degree that has a direct application and stronger short-term economic return (St. John, Hu,
Simmons, Carter, & Weber, 2004). As a persistence indicator, personal goals may be
difficult to measure, and student major (field of study, when declared) needs further
examination as a potential persistence indicator. The way in which this indicator is captured
must be tested because there is some evidence that a student’s vision does not significantly
impact the likelihood that a student will complete a college degree (Adelman, 2006).
Completing a
Two-Year
Degree and
Transferring to
a Four-Year
Institution
Students who complete a two-year degree in a community college and then transfer to a
four-year college are more likely than students who start in a four-year institution to
complete a college degree (Adelman, 2006; Cejda & Kaylor, 2001; Hoachlander, Sikora, &
Horn, 2003) Note: A single transfer from a 2-year institution to a 4-year institution increases
the predictive probability that student will complete a college degree, but more than one
transfer is negatively associated with the predictive probability that a student will graduate
(Adelman, 2006).
Social Indicators
Students’ social experience while in college is captured by indicators that focus on the degree to
which a college student interacts with peers and faculty, as well as with his or her school
associations (e.g., participates in extracurricular activities) (Terenzini & Pascarella, 1980; Tinto,
1975, 1997). Research suggests that the greater the involvement in peer group interaction, the
more likely a student is to identify with an institution, and thus is more likely to persist (Berger
& Milem, 1999; Kuh, Cruce, Shoup, Kinzie, & Gonyea, 2008; Pascarella & Terenzini, 1980;
Titus, 2004). In addition, while social integration appears to be an important factor for all
students, it may be particularly so for women. One study found that among women who had high
performance goals, the quality of their relationship with their peers was most strongly related to
their likelihood of persistence; the same pattern did not hold for men (Terenzini & Pascarella,
1980). Exhibit 3 provides an overview of social experience college indicators of persistence.

American Institutes for Research College Persistence Indicators Research Review—6
Exhibit 3. Summary of Social Experience College Indicators of Persistence
Indicator Description/ Comments
Participation in
College-Affiliated
Extracurricular
Activities
Students who do not participate in peer-group events such as extracurricular activities,
school associations, or social activities with other students in college are less likely to
persist in college (Berger & Milem, 1999; Kuh et al., 2008; Pascarella & Terenzini, 1980;
Titus, 2004).
Student–Faculty
Interaction
Students who have more student-to-faculty formal and informal periods of contact are less
likely to withdraw from college (Berger &Milem 1999; Pascarella & Terenzini, 1980;
Tinto, 1975, 1997). These indicators may be difficult to measure.
Life Experience Indicators
Life experiences can have a direct effect on persistence, in some cases by altering the degree to
which a student is able to focus on their college education. Previous research suggests that
experiences such as being a single parent, being the first member of your family to attend
college, or coming from a low-income household pose hurdles for college students and are
associated with lower rates of persistence (Dowd & Coury, 2006; Elkins, Braxton, & James,
2000; Ishitani, 2003; NCES, 1998; Raley & Kuo, 2011; Sibulkin & Butler, 2005; Somers,
Woodhouse, & Cofer, 2004; Stoutland, 2011; Tinto, 1975; Yakaboski, 2010). These experiences
may affect students’ engagement in and focus on college (e.g., Bean, 1980; Bean & Metzner,
1985; Bean &Vesper, 1990; Cabrera, Nora, & Castañeda, 1993; Dowd & Coury, 2006; Elkins, et
al., 2000; Raley & Kuo, 2011; Sibulkin & Butler, 2005; Tinto, 1975; Yakaboski, 2010).
Exhibit 4 provides an overview of life experience indicators of persistence.
Exhibit 4. Overview of Life Experience Indicators of College Persistence
Indicator Description/ Comments
Availability and
Access to
Financial
Assistance
The awareness and knowledge of how to access financial assistance as well as the
availability of financial assistance (Swail, 2003) may affect a student’s decision to persist
in college, but in ways that are not entirely clear. With the increasing cost of attending
postsecondary institutions during the past 30 years, and the increasing reliance on financial
aid to cover the cost of attending school, the amount of financial assistance and its
availability has become an indicator of college persistence (Nora, 1990; Voorhees, 1985).
The relationship between financial assistance and persistence has been shown to vary in
different studies. For example, some studies suggest that the use of subsidized loans, such
as non-campus (e.g., Pell grants) and campus aid (e.g., Perkins loans) may be related to
persistence (e.g., Nora, 1990; Voorhees, 1985). In contrast, another study suggests
subsidized loans are negatively related with persistence, and that no form of financial aid is
significantly linked with degree attainment (Dowd & Coury, 2006). Although financial
assistance may be related to persistence, a clear financial aid-related indicator cannot be
derived from the existing literature. Note: This indicator may also be related to other
categories such as precollege, college, and institutional indicators.
First-Generation
College Student
A student who is the first in his or her family to enroll in postsecondary institutions is at
greater risk of not persisting in college (Dowd & Coury, 2006; Sibulkin & Butler, 2005;
Yakaboski, 2010). Note: This is also related to the “support” indicator below.

American Institutes for Research College Persistence Indicators Research Review—7
Indicator Description/ Comments
Single-Parent
Student
A student who attends school while also being a single, full-time parent is at greater risk of
not persisting in college (cites). One study showed that in some instances this link between
single parenthood and college persistence may be mitigated by institutional supports
available at postsecondary institutions (Raley & Kuo, 2011).
Working While
Attending School
Related to financial need, working for more than 20 hours per week is associated with a
likelihood that a student will not persist in college (Raley & Kuo, 2011). In 2010,
approximately 51 percent of all college students participated in the labor force (Bureau of
Labor Statistics, 2011). As expected there are differences in the types of students who work
during college and those who do not. For example, full-time students were much less likely
to work than their part-time counterparts. Asian students were much less likely to work
than white, black, or Hispanic students (Bureau of Labor Statistics, 2011). In addition,
students with college-educated parents were less likely to work during the school year than
students with parents who are not college-educated (Raley & Kuo, 2011). Note: This is
related to “access to financial resources” and “support” indicators.
Support The absence of a home or community environment that is supportive of college and college
completion increases the likelihood that a student will not persist in college. Research
suggests that family support and encouragement of college-going students is related to
persistence (Bean, 1980; Bean & Metzner, 1985; Bean & Vesper, 1990; Cabrera et al.,
1993; Reason, 2009). As an indicator this may be difficult to measure.
Institutional Factors
Research suggests that some characteristics of higher education institutions are related to college
persistence and completion rates (Bean, 1980; Berger & Milem, 1999; Terenzini & Pascarella,
1980; Tinto, 1975; Titus, 2004). Specifically, institutional factors refer to the conditions,
availability, and invested resources targeted at the learning environment, including the quality of
classroom instruction and the availability of academic and social student supports.
Exhibit 5. Overview of Institutional Indicators of College Persistence
Indicator Description
Quality of
Classroom
Instruction
Students who find classroom instruction neither clear nor effective (based on survey
evaluation data) may be less likely to persist to graduation (Pascarella, Seifert, & Whitt,
2008). Classroom experience can be measured through teacher evaluations. Note: If the
evaluations could be identifiable by student, it may be possible to use these data as an
individual student indicator.
Institutional
Resources
Institutional resources are the amount of financial resources devoted the academic
programs and supports within an institution. Institutions that have lower levels of funding
for the administration and curriculum development, libraries, and instruction technologies
have lower rates of persistence (CITES?). One study suggests that a 1 percent increase in
expenditures led to a quarter of a percent increase in graduation rate (Ryan, 2004).
Academic support expenditures include resources allocated to academic administration and
curriculum development, libraries, and technological support for instruction could be
examined as institutional persistence indicators. Resources that are devoted to programs
that are dedicated to increasing academic involvement and integration can lead to increases
in college completion rates. Note: Academic support expenditures influence the college
experience (academic and social) of students and may in this way be related to higher
persistence rates. This is especially true for minority and nontraditional students most at
risk (Ryan, 2004).
American Institutes for Research College Persistence Indicators Research Review—8
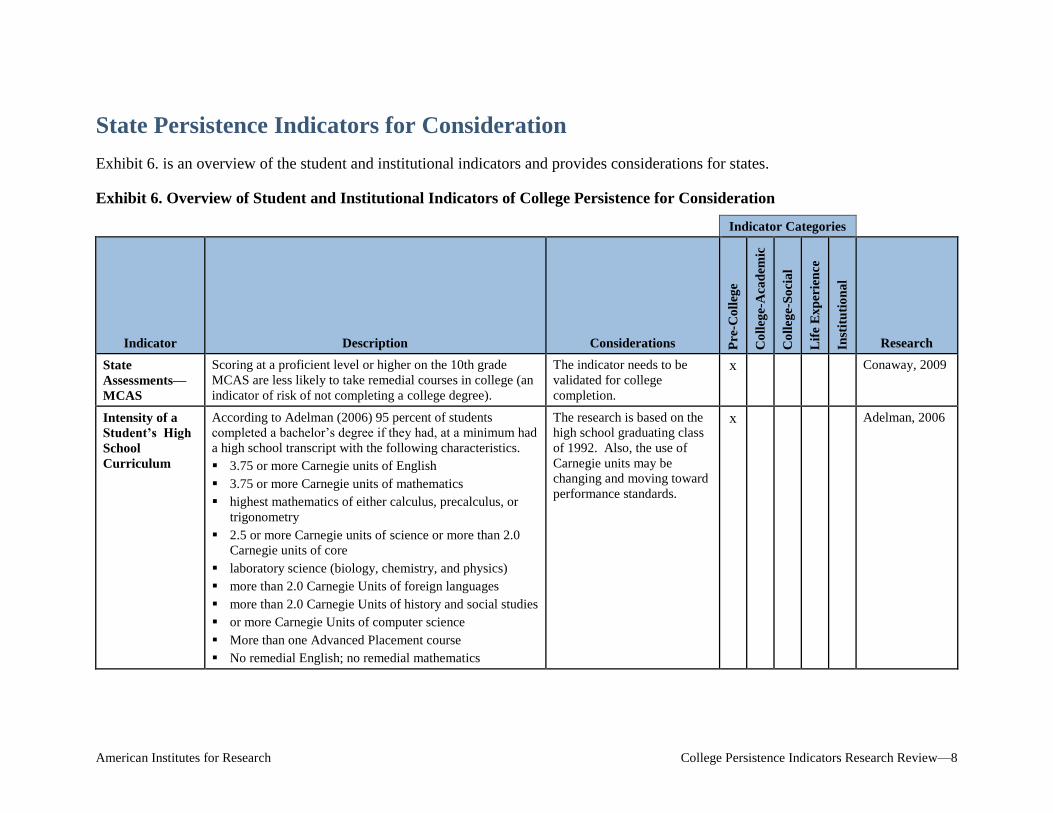
State Persistence Indicators for Consideration
Exhibit 6. is an overview of the student and institutional indicators and provides considerations for states.
Exhibit 6. Overview of Student and Institutional Indicators of College Persistence for Consideration
Indicator Categories
Indicator Description Considerations Pre
-Co
lleg
e
Co
lleg
e-A
cad
emic
Co
lleg
e-S
oci
al
Lif
e E
xp
erie
nce
Inst
itu
tio
na
l
Research
State
Assessments—
MCAS
Scoring at a proficient level or higher on the 10th grade
MCAS are less likely to take remedial courses in college (an
indicator of risk of not completing a college degree).
The indicator needs to be
validated for college
completion.
x Conaway, 2009
Intensity of a
Student’s High
School
Curriculum
According to Adelman (2006) 95 percent of students
completed a bachelor’s degree if they had, at a minimum had
a high school transcript with the following characteristics.
3.75 or more Carnegie units of English
3.75 or more Carnegie units of mathematics
highest mathematics of either calculus, precalculus, or
trigonometry
2.5 or more Carnegie units of science or more than 2.0
Carnegie units of core
laboratory science (biology, chemistry, and physics)
more than 2.0 Carnegie Units of foreign languages
more than 2.0 Carnegie Units of history and social studies
or more Carnegie Units of computer science
More than one Advanced Placement course
No remedial English; no remedial mathematics
The research is based on the
high school graduating class
of 1992. Also, the use of
Carnegie units may be
changing and moving toward
performance standards.
x Adelman, 2006

American Institutes for Research College Persistence Indicators Research Review—9
Indicator Categories
Indicator Description Considerations Pre
-Co
lleg
e
Co
lleg
e-A
cad
emic
Co
lleg
e-S
oci
al
Lif
e E
xp
erie
nce
Inst
itu
tio
na
l
Research
Advanced
Placement
Results
A student who scores below a 3 on the advanced placement
exams is less likely to persist in college, because possessing
a solid foundation in content is a critical component for
success in college.
Although this has been found
to be a predictive indicator of
college completion, there is
some research that suggests
the rapid expansion of AP
participation has made this a
less predictive indicator of
persistence.
x Act, 2009;
Conley, 2007;
Roderick, et al,
2008
End-of-Course
Exams
A student who scores below proficiency is at risk of not
persisting in college.
Data may not be consistently
available. There may not be
state-validated end-of-course
exams.
x Conley, 2007
High School
Grades
A student who maintains a C average or lower is
increasingly less likely to persist in college than students
with higher averages.
The indicator needs to be
validated. x Reason, 2009
SAT Scores A student who performs poorly on college entrance exams is
less likely to persist in college.
The specific risk threshold
must be defined through a
state validation process.
x Reason, 2009;
Ryan, 2004
Dual-
Enrollment
Program (on a
College
Campus)
Dual enrollment courses allow students to enroll in college
level courses (often for college credit) while still in high
school. Sometimes dual enrollment programs reflect a
particular career pathway (e.g., health, technology). A
student who participates in a dual-enrollment program
focused on career-type courses and that is located on a
college campus is more likely to persist in college.
Participating in a dual-enrollment program exposes high
school upperclassmen to the skills required to be successful
at the college level.
The indicator needs to be
validated within the state. x D’Amico et al.,
2010; Hughes et
al., 2005

American Institutes for Research College Persistence Indicators Research Review—10
Indicator Categories
Indicator Description Considerations Pre
-Co
lleg
e
Co
lleg
e-A
cad
emic
Co
lleg
e-S
oci
al
Lif
e E
xp
erie
nce
Inst
itu
tio
na
l
Research
Participation in
Remedial
Courses
Participation in remedial courses in college is an indicator of
risk that a student may not persist in college.
The indicator needs to be
validated within the state. x Conaway, 2009;
Conley, 2007;
D’Amico et al.,
2010; NCES,
2004; 2011
Grade Point
Average (GPA)
Students who maintain a grade point average (GPA) of C or
lower were found to be less likely to persist in college when
compared with student who maintain a grade point average
that is above a C (especially in the first year of college), and
the likelihood of a student persisting decreased as his or her
GPA declined.
The indicator needs to be
validated within the state. x Hu & St. John,
2001; Kahn &
Nauta, 2001;
Tinto 1975;
1994; Titus
2004
Personal Goals
and
Commitments
A student who has few or poor academic and career goals
may have less probability of completing college. Choice of
major and alignment with student goals.
The data necessary to inform
this indicator need to be clearly
defined. The research is based
on a survey of students. There
may be data on the college
application that could be used
to capture this information
(e.g., a student selects a major
or applies as undecided) The
data necessary to inform this
indicator need to be clearly
defined. The research is based
on a survey of students. There
may be data on the college
application that could be used
to capture this information
(e.g., a student selects a major
or applies as undecided).
x Kahn & Nauta,
2001;
Pascarella
&Terenzini,
1980; St. John,
et al, 2004;
Titus, 2004
American Institutes for Research College Persistence Indicators Research Review—11
Indicator Categories
Indicator Description Considerations Pre
-Co
lleg
e
Co
lleg
e-A
cad
emic
Co
lleg
e-S
oci
al
Lif
e E
xp
erie
nce
Inst
itu
tio
na
l
Research
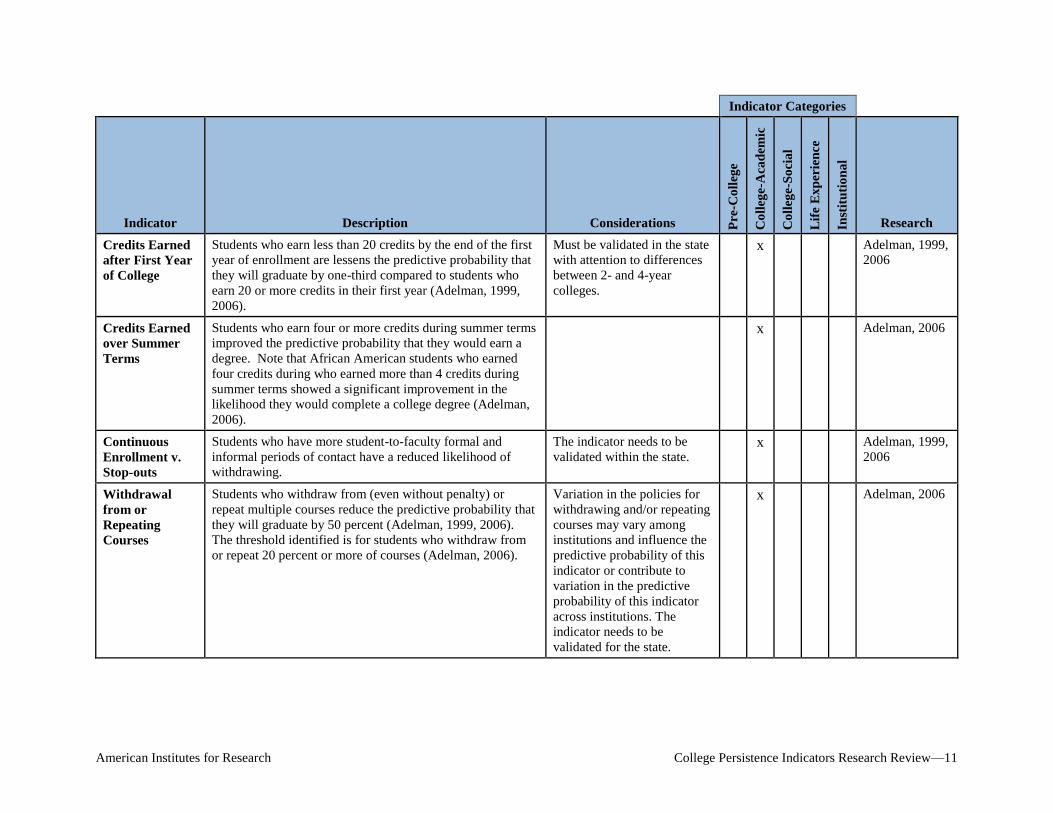
Credits Earned
after First Year
of College
Students who earn less than 20 credits by the end of the first
year of enrollment are lessens the predictive probability that
they will graduate by one-third compared to students who
earn 20 or more credits in their first year (Adelman, 1999,
2006).
Must be validated in the state
with attention to differences
between 2- and 4-year
colleges.
x Adelman, 1999,
2006
Credits Earned
over Summer
Terms
Students who earn four or more credits during summer terms
improved the predictive probability that they would earn a
degree. Note that African American students who earned
four credits during who earned more than 4 credits during
summer terms showed a significant improvement in the
likelihood they would complete a college degree (Adelman,
2006).
x Adelman, 2006
Continuous
Enrollment v.
Stop-outs
Students who have more student-to-faculty formal and
informal periods of contact have a reduced likelihood of
withdrawing.
The indicator needs to be
validated within the state. x Adelman, 1999,
2006
Withdrawal
from or
Repeating
Courses
Students who withdraw from (even without penalty) or
repeat multiple courses reduce the predictive probability that
they will graduate by 50 percent (Adelman, 1999, 2006).
The threshold identified is for students who withdraw from
or repeat 20 percent or more of courses (Adelman, 2006).
Variation in the policies for
withdrawing and/or repeating
courses may vary among
institutions and influence the
predictive probability of this
indicator or contribute to
variation in the predictive
probability of this indicator
across institutions. The
indicator needs to be
validated for the state.
x Adelman, 2006
American Institutes for Research College Persistence Indicators Research Review—12
Indicator Categories
Indicator Description Considerations Pre
-Co
lleg
e
Co
lleg
e-A
cad
emic
Co
lleg
e-S
oci
al
Lif
e E
xp
erie
nce
Inst
itu
tio
na
l
Research
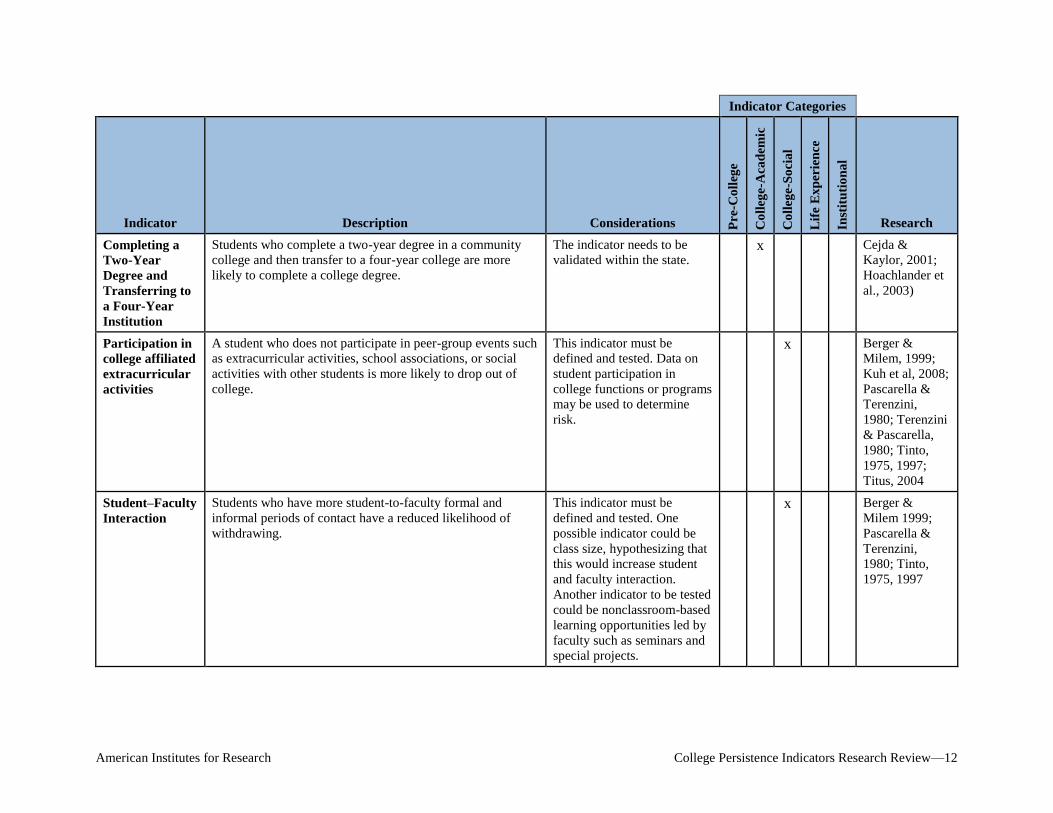
Completing a
Two-Year
Degree and
Transferring to
a Four-Year
Institution
Students who complete a two-year degree in a community
college and then transfer to a four-year college are more
likely to complete a college degree.
The indicator needs to be
validated within the state. x Cejda &
Kaylor, 2001;
Hoachlander et
al., 2003)
Participation in
college affiliated
extracurricular
activities
A student who does not participate in peer-group events such
as extracurricular activities, school associations, or social
activities with other students is more likely to drop out of
college.
This indicator must be
defined and tested. Data on
student participation in
college functions or programs
may be used to determine
risk.
x Berger &
Milem, 1999;
Kuh et al, 2008;
Pascarella &
Terenzini,
1980; Terenzini
& Pascarella,
1980; Tinto,
1975, 1997;
Titus, 2004
Student–Faculty
Interaction
Students who have more student-to-faculty formal and
informal periods of contact have a reduced likelihood of
withdrawing.
This indicator must be
defined and tested. One
possible indicator could be
class size, hypothesizing that
this would increase student
and faculty interaction.
Another indicator to be tested
could be nonclassroom-based
learning opportunities led by
faculty such as seminars and
special projects.
x Berger &
Milem 1999;
Pascarella &
Terenzini,
1980; Tinto,
1975, 1997
American Institutes for Research College Persistence Indicators Research Review—13
Indicator Categories
Indicator Description Considerations Pre
-Co
lleg
e
Co
lleg
e-A
cad
emic
Co
lleg
e-S
oci
al
Lif
e E
xp
erie
nce
Inst
itu
tio
na
l
Research
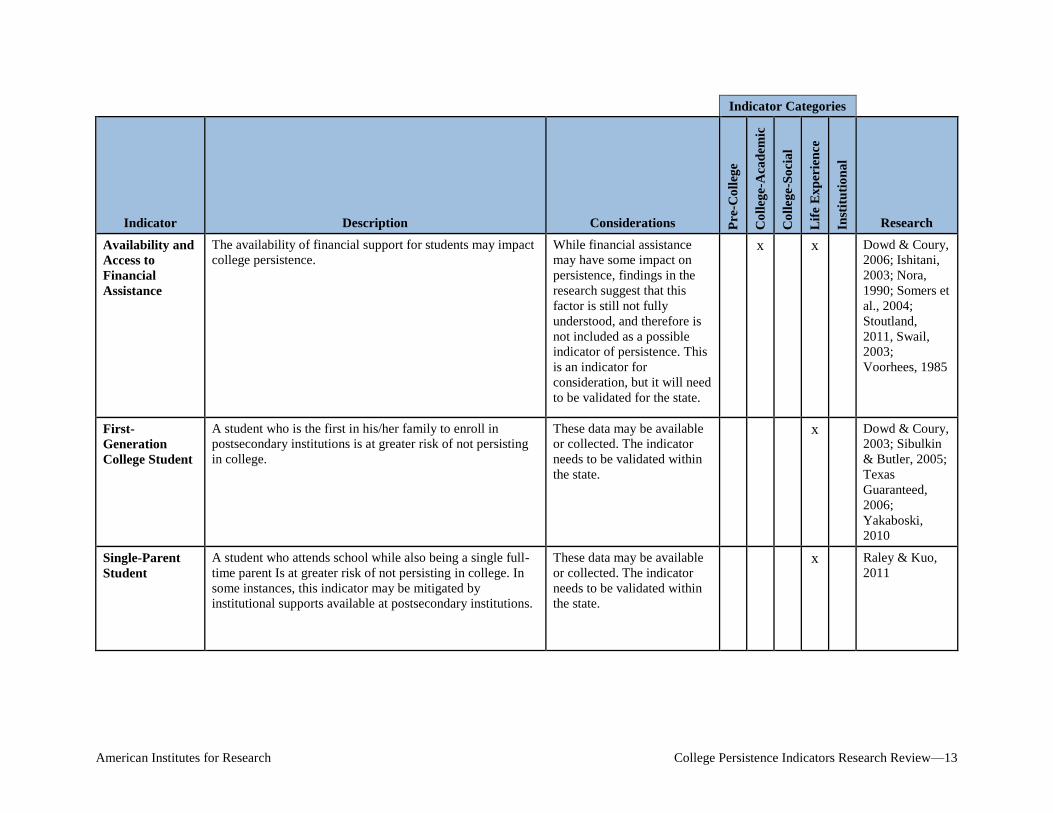
Availability and
Access to
Financial
Assistance
The availability of financial support for students may impact
college persistence.
While financial assistance
may have some impact on
persistence, findings in the
research suggest that this
factor is still not fully
understood, and therefore is
not included as a possible
indicator of persistence. This
is an indicator for
consideration, but it will need
to be validated for the state.
x x Dowd & Coury,
2006; Ishitani,
2003; Nora,
1990; Somers et
al., 2004;
Stoutland,
2011, Swail,
2003;
Voorhees, 1985
First-
Generation
College Student
A student who is the first in his/her family to enroll in
postsecondary institutions is at greater risk of not persisting
in college.
These data may be available
or collected. The indicator
needs to be validated within
the state.
x Dowd & Coury,
2003; Sibulkin
& Butler, 2005;
Texas
Guaranteed,
2006;
Yakaboski,
2010
Single-Parent
Student
A student who attends school while also being a single full-
time parent Is at greater risk of not persisting in college. In
some instances, this indicator may be mitigated by
institutional supports available at postsecondary institutions.
These data may be available
or collected. The indicator
needs to be validated within
the state.
x Raley & Kuo,
2011

American Institutes for Research College Persistence Indicators Research Review—14
Indicator Categories
Indicator Description Considerations Pre
-Co
lleg
e
Co
lleg
e-A
cad
emic
Co
lleg
e-S
oci
al
Lif
e E
xp
erie
nce
Inst
itu
tio
na
l
Research
Working While
Attending
School
A student who works more than 20 hours a week during
school is at greater risk of not persisting in college.
Data on the number of hours
students work while
attending school must be
collected.
x Bean, 1980;
Bean &
Metzner, 1985;
Bean &Vesper,
1990; Cabrera
et al., 1993
Support Research suggests that support and encouragement of
college-going students are much more important than
originally thought, in that factors external to the school,
including family approval and encouragement, will have an
effect on a student’s decision to persist.
This may be difficult to
measure in a single indicator,
but it may be assessed
imperfectly using multiple
indicators (e.g., first-
generation college student).
x Bean, 1980;
Bean &
Metzner, 1985;
Bean & Vesper,
1990; Cabrera
et al., 1993;
Reason, 2009
Quality of
Classroom
Instruction
Students who report that an institution’s classroom
instruction is clear and understandable are more likely to
persist.
Data on teacher evaluations
could be used to capture this
information. In addition, this
could become a student-level
indicator if evaluations were
identifiable by student.
x Pascarella et al.,
2008
Institutional
Resources
Institutions that have lower levels of funding for the
administration and curriculum development, libraries, and
instruction technologies have lower rates of persistence.
Especially those resources related to academic support (e.g.,
academic administration, curriculum development, libraries
and instructional technology).
Indicators on finances would
need to be tested and
validated within the state to
identify key funding
thresholds.
x Ryan, 2004

American Institutes for Research College Persistence Indicators Research Review—15
Recommendations
Persistence indicators, once validated using state data, can be important individual student and
institutional measures that may be used as levers to improve a system of higher education. Still,
the availability of individual student data at the higher education level is currently limited,
although precollege indicator data are available and may be a good starting point when testing
persistence indicators. When considering additional student-level data elements to include in a
longitudinal data system, as mentioned in the Caveats and Considerations section of this
document, a balance between the burden of collecting the data and the value it adds to the
predictive probability of a student completing college must be weighed. A possible solution is to
conduct a pilot study that includes a small number of higher education institutions with the intent
of identifying the indicators that are predictive, as well as evaluating the degree of burden for
collecting these data.
Another important recommendation focuses on the appropriate use of persistence indicators.
There is a danger that the increasing pressure holding institutions of higher education
accountable for college completion rates may bring about an unintended consequence of limiting
students’ access to higher education institutions. For example an institution may consider
changing the thresholds and practices of accepting students to the institution based on students
meeting thresholds on precollege indicators. The intent of identifying persistence indicators is to
improve higher education institutions to monitor students in need, observe patterns of need (or
risk of not completing college) among the students who attend the institution and develop
structures, supports and processes to improve college completion rates.
American Institutes for Research College Persistence Indicators Research Review—16
References
ACT Inc. (2009). Using PLAN to identify student readiness for rigorous courses in high school
(Issues in College Readiness). Iowa City, IA: Author. Retrieved from
http://www.act.org/research/policymakers/pdf/UsingPlan.pdf
Adelman, C. (1999). Answers in the tool box: Academic intensity, attendance patterns, and
bachelor’s degree attainment. Washington, DC: U.S. Department of Education.
Adelman, C. (2006). The toolbox revisited: Paths to degree completion from high school through
college. Washington, DC: U.S. Department of Education.
Bean, J. P. (1980). Dropouts and turnover: The synthesis and test of a causal model of student
attrition, Research in Higher Education, 12(2), 155–187.
Bean, J. P., & Metzner, B. S. (1985). A conceptual model of nontraditional undergraduate
student attrition. Review of Educational Research, 55(4), 485–540.
Bean, J. P., & Vesper, N. (1990). Quantitative approaches to grounding theory in data: Using
LISREL to develop a local model and theory of student attrition. Paper presented at the
annual meeting of the American Educational Research Association, Boston, MA.
Berger, J. B., & Milem, F. J. (1999). The role of student involvement and perceptions of
integration in a causal model of student persistence. Research in Higher Education,
40(6), 641–664.
Bureau of Labor Statistics. (2011, April 8). College enrollment and work activity of 2010 high
school graduates (Economic News Release). Washington, DC: Author. Retrieved from
http://www.bls.gov/news.release/pdf/hsgec.pdf
Cabrera, A. F., Nora, A., & Castañeda, M. B. (1993). College persistence: Structural equations
modeling test of an integrated model of student retention. The Journal of Higher
Education, 64(2), 123–139.
Carroll, C.D. (1989). College persistence and degree attainment for 1980 high school graduates:
Hazards for transfers, stopouts, and part-timers. Washington, DC: National Center for
Education Statistics.
Cejda, B. D., & Kaylor, A. J. (2001). Early transfer: A case study of traditional-aged community
college students. Community College Journal of Research and Practice, 25, 621–638.
Conaway, C., (2009). College readiness: Massachusetts compiles the data. Malden, MA:
Massachusetts Department of Elementary and Secondary Education.
Conley, D. T. (2007). Redefining college readiness. Washington, DC: Educational Policy
Improvement Center.
American Institutes for Research College Persistence Indicators Research Review—17
D'Amico, M. M., Morgan, G. B., Robertson, S., & Rivers, H. E. (2010, February). The influence
of dual enrollment policy and practice on college student persistence. Presentation made
at the annual conference of the South Carolina Educators for the Practical Use of
Research, Columbia, SC.
Donovan, R. (1984). Path analysis of a theoretical model of persistence in higher education
among low-income black youth. Research in Higher Education, 21(3), 243–259.
Dowd, C. A., & Coury, T. (2006). The effect of loans on the persistence and attainment of
community college students. Research in Higher Education, 47(1), 33–62.
Elkins, S. A., Braxton, J. M., & James, G. W. (2000). Tinto's separation stage and its influence
on first-semester college student persistence. Research in Higher Education, 41(2), 251–
268.
Hoachlander, G., Sikora, A. C., & Horn, L. (2003). Community college students: Goals,
academic preparation, and outcomes (NCES 2003-164). Washington, DC: National
Center for Education Statistics. Retrieved from http://nces.ed.gov/pubs2003/2003164.pdf
Hu, S., & St. John, E. P. (2001). Student persistence in a public higher education system:
Understanding racial and ethnic differences. The Journal of Higher Education, 72(3),
265–286.
Hughes, K. L., Karp, M. M., Fermin, B. J., & Bailey, T. R. (2005). Pathways to college access
and success. Washington, DC: U.S. Department of Education, Office of Vocational and
Adult Education. Retrieved from
http://www2.ed.gov/about/offices/list/ovae/pi/cclo/cbtrans/finalreport.pdf
Ishitani, T. T. (2003). A longitudinal approach to assessing attrition behavior among first-
generation students: Time-varying effects of pre-college characteristics. Research in
Higher Education, 44(4), 433–444.
Kahn, J. H., & Nauta, M. M. (2001). Social-cognitive predictors of first-year college persistence:
The importance of proximal assessment. Research in Higher Education, 42(6), 633–652.
Kuh, G. D., Cruce, T. M., Shoup, R., Kinzie, J., & Gonyea, R. M. (2008). Unmasking the effects
of student engagement on first-year college grades and persistence. The Journal of
Higher Education, 79(5), 540–563.
National Center for Education Statistics. (2004). Section 3: Student effort and educational
progress. The Condition of Education 2004 (NCES 2004–077, pp 59–65). Washington,
DC: U.S. Government Printing Office. Retrieved from
http://nces.ed.gov/pubs2004/2004077_3.pdf
National Center for Education Statistics. (2011). Indicator 22: Remediation and degree
completion. The Condition of Education 2011 (NCES 2011-033) [Website]. Retrieved
from http://nces.ed.gov/programs/coe/indicator_rmc.asp

American Institutes for Research College Persistence Indicators Research Review—18
Nora, A. (1990). Campus-based aid programs as determinants of retention among Hispanic
community college students. The Journal of Higher Education, 61(3), 312–331.
Pascarella, E. T., Seifert, T. A., Whitt, E. J. (2008). Effective instruction and college student
persistence: Some new evidence. New Directions for Teaching and Learning, 115, 55–
70. Retrieved from
http://jesserbishop.wiki.westga.edu/file/view/Pascarella_Effective+Instruction.pdf
Pascarella, E. T., & Terenzini, P. T (1980). Predicting freshman persistence and voluntary
dropout decisions from a theoretical model. The Journal of Higher Education, 51(1), 60–
75.
Raley, R. K., & Kuo, J. (2011, March–April). Does employment contribute to higher college
dropout rates among students from disadvantaged backgrounds? Paper presented at the
annual meeting of the Population Association of America, Washington, DC.
Reason, R. D. (2009). Student variables that predict retention: Recent research and new
developments. NASPA Journal, 46(3), 482–501.
Roderick, M., Nagaoka, J., Coca, V., Moeller, E. (2008). From high school to the future:
Potholes on the road to college. Chicago, IL: Consortium on Chicago School Research.
Ryan, J. F. (2004). The relationship between institutional expenditures and degree attainment at
baccalaureate colleges. Research in Higher Education, 45(2), 97–114.
Sibulkin, A. E., & Butler, J. S. (2005). Differences in graduation rates between young black and
white college students: Effect of entry into parenthood and historically black universities.
Research in Higher Education, 46(3), 327–348.
Somers, P., Woodhouse, S., & Cofer, J. (2004). Pushing the boulder uphill: The persistence of
first-generation college students. NASPA Journal, 41(3), 418–435.
St. John, E. P., Hu, S., Simmons, A., Carter, D. F., & Weber, J. (2004). What difference does a
major make? The influence of college major field on persistence by African American
and white students. Research in Higher Education, 45(3), 209–232.
Stoutland, S. E. (2011). How students are making it: Perspectives on getting through college
from recent graduates of the Boston Public Schools. Boston, MA: Boston Higher
Education Partnership. Retrieved from
http://www.tbf.org/uploadedFiles/tbforg/Utility_Navigation/Multimedia_Library/Reports
/how-students-are-making-it_2011.pdf
Swail, W. S. (with Redd, K. E., & Perna, L. W.). (2003). Retaining minority students in higher
education: A framework for success (ASHE-ERIC Higher Education Report No. 2). San
Francisco, CA: Wiley.

American Institutes for Research College Persistence Indicators Research Review—19
Terenzini, P. T., & Pascarella, E. T. (1980). Toward the validation of Tinto's model of college
student attrition: A review of recent studies. Research in Higher Education, 12(3), 271–
282.
Tinto, V. (1975). Dropout from higher education: A theoretical synthesis of recent research.
Review of Educational Research, 45(1), 89–125.
Tinto, V. (1997). Classrooms as communities: Exploring the educational character of student
persistence. The Journal of Higher Education, 68(6), 599–623.
Titus, M. A. (2004). An examination of the influence of institutional context on student
persistence at 4-year colleges and universities: A multilevel approach. Research in
Higher Education, 45(7), 673–699.
Voorhees, R. A. (1985). Student finances and campus-based financial aid: A structural model
analysis of the persistence of high need freshmen. Research in Higher Education, 22(1),
65–92.
Yakaboski, T. (2010). Going at it alone: Single-mother undergraduate’s experiences. Journal of
Student Affairs Research and Practice, 47(4), 463–481.