Embed Size (px)
Citation preview
College Students Define Binge Drinkingand Estimate Its Prevalence:Results of a National Survey
Henry Wechsler, PhD; Meichun Kuo, ScD
Abstract. Data from the 1999 College Alcohol Study were usedto examine how students define the term binge drinking, to deter-mine how much binge drinking the students think exists on theircampuses, and to analyze how students’ estimates compare withaggregated self-reports of student drinking. The findings indicatethat the median of the students’definitions of binge drinking is 6drinks in a row for men and 5 for women, 1 drink higher than thed e finition used by re s e a rch e rs. Students’ d e finitions of bingedrinking vary with their own drinking levels, suggesting that dis-senting views of the research definition may represent voices ofthe heaviest drinkers. At the median, students estimated that 35%of all students were binge drinkers. Half (47%) of the studentsunderestimated the binge drinking rate at their school, 29% over-estimated it, and 13% were accurate. Although programs designedto reduce the frequency or prevalence of binge drinking by empha-sizing healthier norms would be most useful in addressing bingedrinkers who overestimate drinking norms, this group includesonly 13% of college students.
Key Wo rd s : a l c o h o l ,b i n ge dri n k i n g, c o l l ege students, peer norms
ith the growing recognition that binge drinkingon college campuses constitutes a major publichealth problem, some college administrators are
seeking effective interventions for their campuses.1 Oneapproach has concentrated on changing students’ percep-tions about the drinking practices and attitudes of theirpeers. This approach is based on a series of studies that haveassociated the alcohol use of friends and peers and a stu-dent’s perception of that use with the student’s own drink-ing patterns. Studies have found that students’consumptionof alcohol is shaped, in part, by how much they think otherstudents on campus drink.2–5
A d o l e s c e n t s ’ l evels of alcohol and drug use have beenfound to be stro n g ly associated with peers ’u s e.6 , 7 H oweve r,other studies have shown that a student’s drinking was more
s t ro n g ly influenced by how mu ch he or she thought cl o s ef riends drank than by perc eptions of the extent of use by stu-dents in ge n e ra l .3 , 8 , 9 Pe rsonal drinking practices have beenfound to mirror those of the social group the student hasl ived with (eg, f rat e rn i t i e s , s o ro ri t i e s , and dorm i t o ri e s ) .1 0 – 1 2
Several studies have concluded that some students over-estimate alcohol use among their friends and others on cam-pus, and that this misperception may be associated withhigher drinking levels.2,4,5,9,13,14 If students perceive thatheavy or binge drinking is the usual behavior of their peers,they may be more likely to engage in this behavior. Studentswho perceive that more drinking occurs than actually doesp rovide themselves with an excuse for drinking morebecause “everyone is doing it.” The results of these studieshave been used to develop interventions aimed at adjustingstudent overestimates.15,16
Social norms programs attempt to influence students’choices about health behaviors by emphasizing the presenceof an underlying, but under-emphasized and under-recog-nized pattern of healthy behavior. In broad terms, thisapproach assumes that students who otherwise overestimatecampus drinking norms (and adjust their own behavior tomatch) may adopt a healthier pattern of behavior if theybelieve that such a pattern is normative. Such attempts tobring students’ misperceptions about the levels of drinkingon campus into line with campus drinking norms havegained popularity in recent years.
In a survey of college administrat o rs ’ e ffo rts to counterb i n ge dri n k i n g, We chsler et al1 found that programs toreduce the gap between perc e ived and actual norms bye d u c ating students about how mu ch drinking actuallyo c c u rs have been put in place at 1 in 9 colleges (11%).H oweve r, m e a s u res and methods used in the studiesu n d e rlying this new ap p ro a ch va ry considerably, and theresults are far from defi n i t ive. Most of the studies havebeen conducted at a single school rather than at a rep re-s e n t at ive sample of diffe rent college s .2 , 6 – 8 , 1 2 Some studies
Henry Wechsler and Meichun Kuo are with the Department ofHealth and Social Medicine at the Harvard School of PublicHealth in Boston.
VOL 49, SEPTEMBER 2000 57
W
focus on the fre q u e n cy of drinking and not on the quanti-ty consumed to measure the dispari t y,1 5 wh e reas otherstudies examine students’ p e rc eptions of the dispari t yrather than considering measures of the disparity thatre s e a rch e rs have deve l o p e d.2 , 3 , 1 3
In the past decade, large-scale epidemiologic studies ofyouth alcohol use have employed 5 drinks in a row as ameasure of heavy drinking, which has become a standardmeasure in both secondary school populations (the Univer-sity of Michigan’s National Institute of Drug Abuse-spon-sored Monitoring the Future study)17 and college popula-tions (the Core Institute Survey18 and theNational CollegeHealth Risk Behavior Survey19). The Harvard School ofPublic Health College Alcohol Study (CAS) has used a gen-der-specific definition of binge drinking: 5 drinks in a rowfor men and 4 drinks in a row for women.20–23 Yet othersdisagree about the use of the 5 or 5-4 measure of bingedrinking. The time period in which the drinking occurs isnot specified in these studies, which use the measure as amarker for heavy episodic drinking and not as an indicatorof blood-alcohol level.24 Some opine that students considerthis level of drinking low and insufficient for problems tooccur.Yet no empirical studies have been designed to exam-ine how students define binge drinking.
In this study, we examined students’perceptions of drink-ing at their colleges and attempted to relate the perceptionsto the students’ own drinking levels from a national per-spective. Our purpose is to understand the following:
• students’ definitions of binge drinking with respect toquantity of alcohol consumed and the factors associatedwith their definitions;
• students’ perceptions of the extent of binge drinking ontheir campuses and how they compare with aggregatedself-reports of drinking behavior;
• students’ misperceptions of the extent of binge drinkingon their campuses and the factors associated with theirmisperceptions.
The Harvard School of Public Health CAS provided uswith the opportunity to extend the research on students’per-ceptions to a representative national sample of colleges anduniversities.
METHOD
College Sample
This study is based on the 1999 CAS survey. Responsesfrom a randomly selected sample of 14 138 students at 119nationally representative colleges in 40 states were used inthese analyses. Details of the sample and research designhave been described previously in this and other publishedreports.21–23,25
Questionnaire
The 1999 survey repeated standard questions used in the1993 and 1997 CAS surveys.21,22 The 20-page self-adminis-tered questionnaire asked about alcohol use, other sub-
stance use, student attitudes and lifestyles, and requestedb a ck ground ch a ra c t e ristics. The questionnaire instru c t e dstudents to define a drink in equivalent amounts of alcohol:a 12-oz (360 mL) bottle or can of beer, a 4-oz (120 mL)glass of wine, a 12-oz (360 mL) bottle or can of wine cool-er, or a shot of liquor (1.25 oz or 37 mL), either straight orin a mixed drink. The questions were adapted from previouslarge-scale, national studies.18,22,26
Measures
Alcohol-related Health and Behavioral Problems
Students were asked if they had encountered any of 12health and behavioral consequences as a result of theirdrinking since the beginning of the school year. Studentswere classified by whether they reported five or more dif-ferent problems. This measure has been used by the CAS toindicate a high level of alcohol problems.
Binge Drinking
Heavy episodic or binge drinking was defined as the con-sumption of at least 5 drinks in a row for men or 4 drinks ina row for women during the 2 weeks preceding their com-pletion of the questionnaire. The CAS gender-specific mea-sure of binge drinking was constructed from responses tofour questions: (a) sex; (b) recency of last drink; (c) drink-ing 5 or more drinks during the past 2 weeks; and (d) drink-ing 4 or more drinks during the past 2 weeks. Missing datafor any of these questions resulted in excluding that stu-dent’s responses from the analysis. Frequent binge drinkershad binged three or more times in the past 2 weeks, occa -sional binge drinkers had done so only once or twice in thesame time period. Nonbinge drinkers had consumed alcoholin the past year but had not binged in the previous 2 weeks,whereas abstainers had not consumed any alcohol in thepast year.
College Binge Drinking Rates
The college binge drinking rate of a school was the per-centage of students classified as binge drinkers at thatschool. It was calculated for each school on the basis of theaggregated self-rep o rt responses of students at their sch o o l sto the binge drinking questions. Colleges were divided intothree categories according to their binge drinking rates:high-binge schools, more than 50% of students were bingedrinkers; medium-binge schools, 36% to 50% of the stu-dents were binge drinkers; and low-binge schools, wherefrom 0% to 35% of the students were binge drinkers. Thesesame groupings have been the basis of CAS studies of sec-ondhand effects of drinking.23
Students’Definitions of Binge Drinking
Students we re asked to respond to the question “ H owm a ny drinks in a row must a college (man)/(woman) have ino rder to be called binge dri n ke r ? ” R e s p o n s e s , to be prov i d-ed for men and women sep a rat e ly, we re 3 or less, 4 , 5 , 6 , 7 ,8 , 9 , and 10 or more. The question paralleled the CAS mea-s u re of binge drinking and did not specify a time peri o d.
58 JOURNAL OF AMERICAN COLLEGE HEALTH
COLLEGE HEALTH
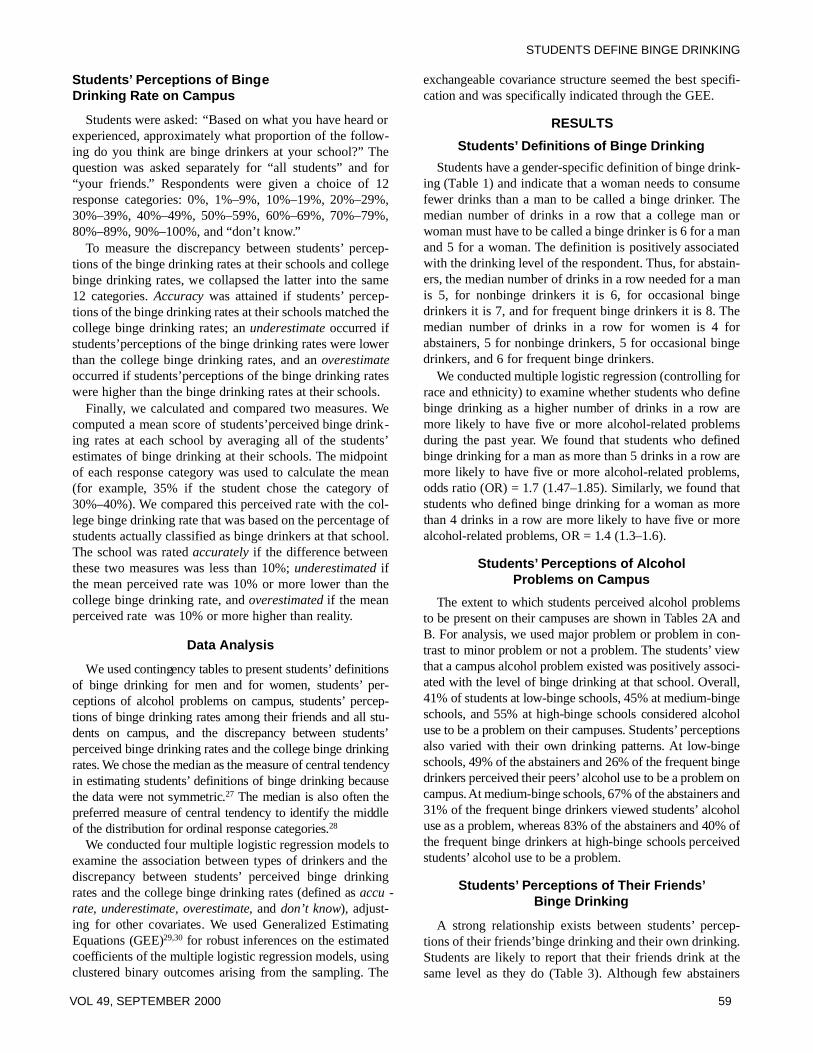
Students’ Perceptions of BingeDrinking Rate on Campus
Students were asked: “Based on what you have heard orexperienced, approximately what proportion of the follow-ing do you think are binge drinkers at your school?” Thequestion was asked separately for “all students” and for“your friends.” Respondents were given a choice of 12response categories: 0%, 1%–9%, 10%–19%, 20%–29%,30%–39%, 40%–49%, 50%–59%, 60%–69%, 70%–79%,80%–89%, 90%–100%, and “don’t know.”
To measure the discrepancy between students’ percep-tions of the binge drinking rates at their schools and collegebinge drinking rates, we collapsed the latter into the same12 categories. Accuracy was attained if students’ percep-tions of the binge drinking rates at their schools matched thecollege binge drinking rates; an underestimate occurred ifstudents’perceptions of the binge drinking rates were lowerthan the college binge drinking rates, and an overestimateoccurred if students’perceptions of the binge drinking rateswere higher than the binge drinking rates at their schools.
Finally, we calculated and compared two measures. Wecomputed a mean score of students’perceived binge drink-ing rates at each school by averaging all of the students’estimates of binge drinking at their schools. The midpointof each response category was used to calculate the mean(for example, 35% if the student chose the category of30%–40%). We compared this perceived rate with the col-lege binge drinking rate that was based on the percentage ofstudents actually classified as binge drinkers at that school.The school was rated accurately if the difference betweenthese two measures was less than 10%; underestimated ifthe mean perceived rate was 10% or more lower than thecollege binge drinking rate, and overestimated if the meanperceived rate was 10% or more higher than reality.
Data Analysis
We used continge n cy tables to present students’ d e fi n i t i o n sof binge drinking for men and for wo m e n , s t u d e n t s ’ p e r-c eptions of alcohol pro blems on campus, s t u d e n t s ’ p e rc ep-tions of binge drinking rates among their friends and all stu-dents on campus, and the discrep a n cy between students’p e rc e ived binge drinking rates and the college binge dri n k i n grates. We chose the median as the measure of central tendencyin estimating students’ d e finitions of binge drinking becausethe data we re not symmetri c.2 7 The median is also often thep re fe rred measure of central tendency to identify the midd l eof the distri bution for ordinal response cat ego ri e s .2 8
We conducted four multiple logistic regression models toexamine the association between types of dri n ke rs and thed i s c rep a n cy between students’ p e rc e ived binge dri n k i n grates and the college binge drinking rates (defined as a c c u -rat e, u n d e re s t i m at e, ove re s t i m at e, and d o n ’t know) , a d j u s t-ing for other cova ri ates. We used Genera l i zed Estimat i n gE q u ations (GEE)2 9 , 3 0 for ro bust infe rences on the estimat e dc o e fficients of the multiple logistic regression models, u s i n gcl u s t e red binary outcomes arising from the sampling. Th e
ex ch a n ge able cova riance stru c t u re seemed the best specifi-c ation and was specifi c a l ly indicated through the GEE.
RESULTS
Students’ Definitions of Binge Drinking
Students have a gender-specific definition of binge drink-ing (Table 1) and indicate that a woman needs to consumefewer drinks than a man to be called a binge drinker. Themedian number of drinks in a row that a college man orwoman must have to be called a binge drinker is 6 for a manand 5 for a woman. The definition is positively associatedwith the drinking level of the respondent. Thus, for abstain-ers, the median number of drinks in a row needed for a manis 5, for nonbinge drinkers it is 6, for occasional bingedrinkers it is 7, and for frequent binge drinkers it is 8. Themedian number of drinks in a row for women is 4 forabstainers, 5 for nonbinge drinkers, 5 for occasional bingedrinkers, and 6 for frequent binge drinkers.
We conducted multiple logistic regression (controlling fo rrace and ethnicity) to examine whether students who defi n eb i n ge drinking as a higher number of drinks in a row arem o re like ly to have five or more alcohol-re l ated pro bl e m sd u ring the past ye a r. We found that students who defi n e db i n ge drinking for a man as more than 5 drinks in a row arem o re like ly to have five or more alcohol-re l ated pro bl e m s ,o dds ratio (OR) = 1.7 (1.47–1.85). Similarly, we found thatstudents who defined binge drinking for a woman as morethan 4 drinks in a row are more like ly to have five or morea l c o h o l - re l ated pro bl e m s , OR = 1.4 (1.3–1.6).
Students’ Perceptions of AlcoholProblems on Campus
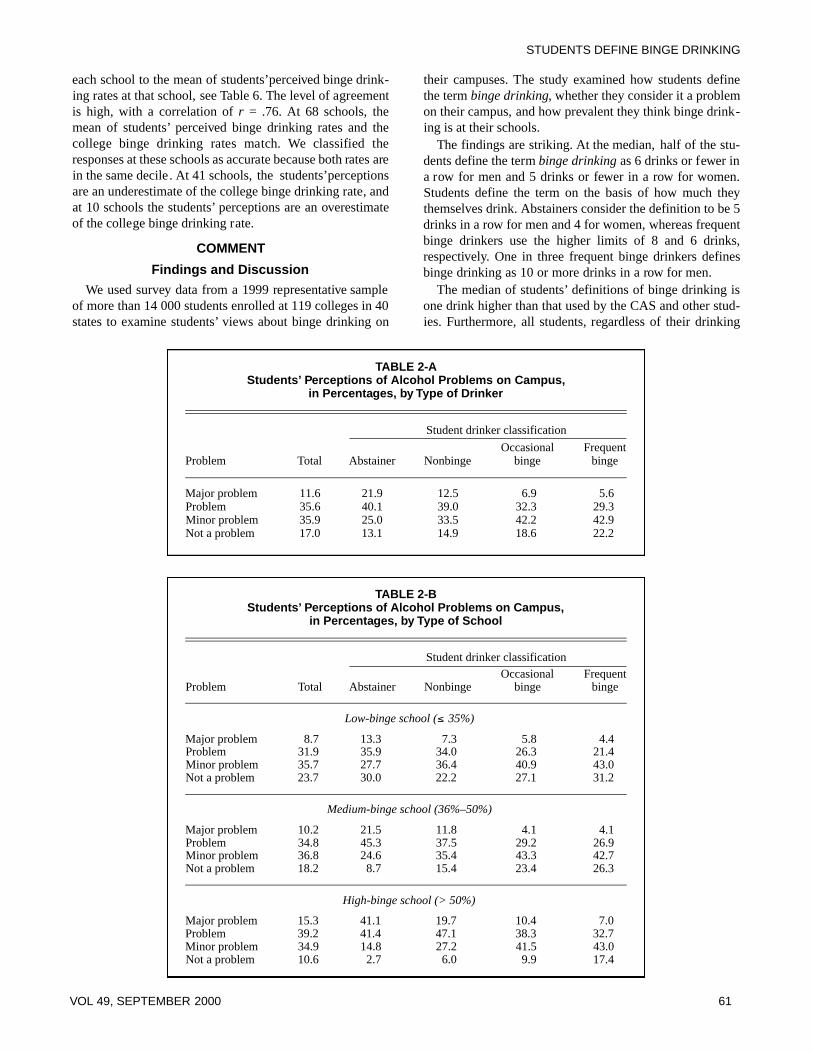
The extent to wh i ch students perc e ived alcohol pro bl e m sto be present on their campuses are shown in Tables 2A andB. For analy s i s , we used major pro blem or pro blem in con-t rast to minor pro blem or not a pro blem. The students’ v i ewt h at a campus alcohol pro blem existed was positive ly associ-ated with the level of binge drinking at that school. Ove ra l l ,41% of students at low - b i n ge sch o o l s , 45% at medium-binges ch o o l s , and 55% at high-binge schools considered alcoholuse to be a pro blem on their campuses. Students’ p e rc ep t i o n salso va ried with their own drinking pat t e rns. At low - b i n ges ch o o l s , 49% of the ab s t a i n e rs and 26% of the frequent binged ri n ke rs perc e ived their peers ’ alcohol use to be a pro blem oncampus. At medium-binge sch o o l s , 67% of the ab s t a i n e rs and31% of the frequent binge dri n ke rs viewed students’ a l c o h o luse as a pro bl e m , wh e reas 83% of the ab s t a i n e rs and 40% ofthe frequent binge dri n ke rs at high-binge schools perc e ive ds t u d e n t s ’ alcohol use to be a pro bl e m .
Students’ Perceptions of Their Friends’Binge Drinking
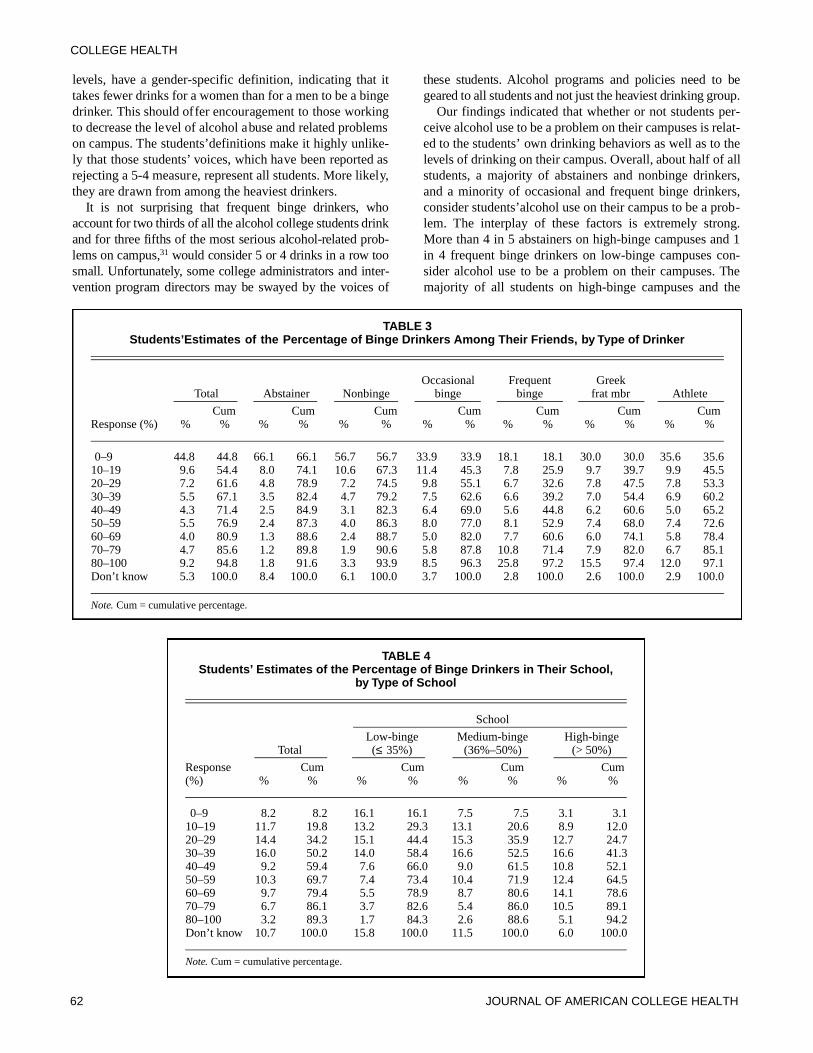
A strong relationship exists between students’ percep-tions of their friends’binge drinking and their own drinking.Students are likely to report that their friends drink at thesame level as they do (Table 3). Although few abstainers
VOL 49, SEPTEMBER 2000 59
STUDENTS DEFINE BINGE DRINKING

(7%) and nonbinge drinkers (12%) estimated that half ormore of their friends were binge drinkers, progressivelymore of the occasional binge drinkers (27%) and frequentbinge drinkers (52%) did so. In the two highest drinkinggroups, 3 in 8 (37%) members of sororities or fraternitiesand 1 in 3 (32%) intercollegiate athletes estimated that halfor more of their friends were binge drinkers.
Students’ Perceptions of the Binge DrinkingLevels on Campus
Nationally, more than half of the students (59%) indicat-ed that the binge drinking rates at their schools were under50% (Table 4). The students’ perceptions of binge drinkingrates varied with a schools’ binge drinking level. Two in 3(66%) of the students at low-binge schools and 1 in 2 (52%)of the students at high-binge schools perceived the bingedrinking rate on campus to be under 50%. Students at low-binge schools were more likely to indicate that they did notknow what the rate was (15.8%), compared with students atmedium-binge (11.5%) and high-binge schools (6.0%).
Discrepancy Between Students’ Perceptions ofBinge Rates and College Binge Rates
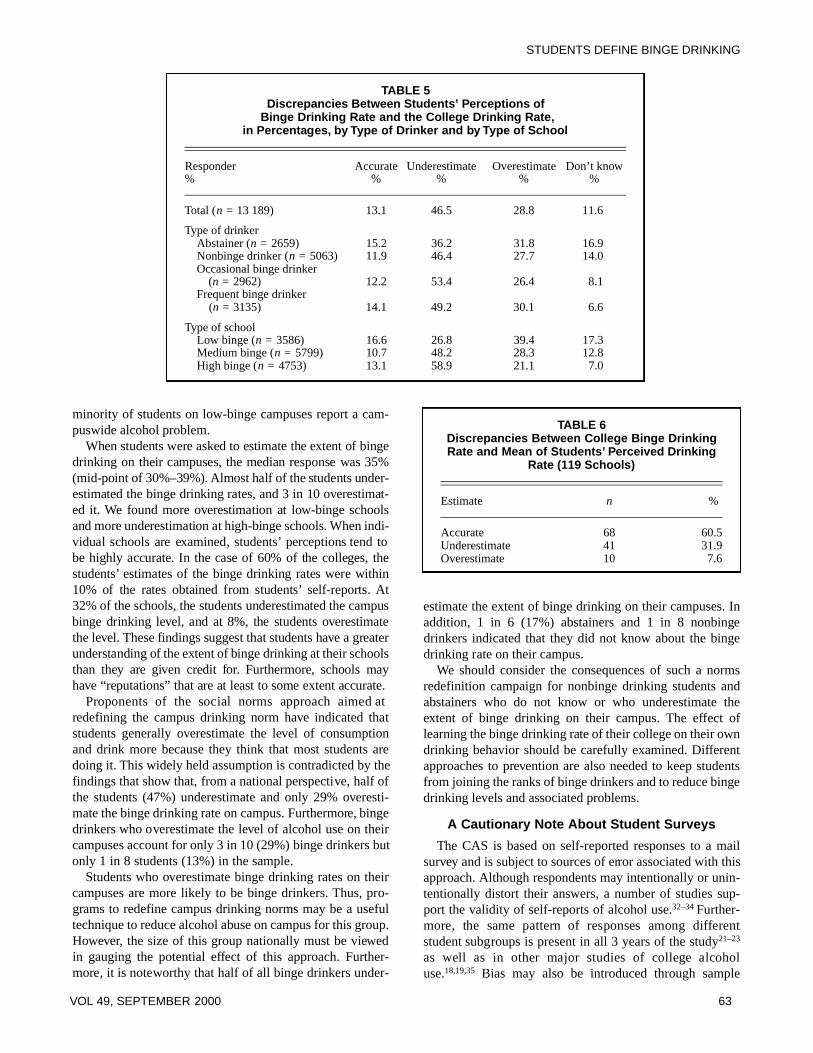
Comparisons of students’ perceived binge drinking rateson campus with the college binge drinking rates by type ofdrinkers and type of schools are shown in Table 5. In gen-eral, 47% of the students underestimated the binge drinking
rates at their schools, whereas 29% overestimated the lev-els, and 13% were accurate, within 10%. Twelve percent ofthe students indicated that they did not know the bingedrinking rates in their schools.
Using multiple logistic regression models, we examinedthe association between type of drinker and the discrepancybetween students’ perceived binge drinking rates and col-lege binge drinking rates, adjusting for drinking level ofs ch o o l , s ex , age, e t h n i c i t y, p u bl i c / p rivate sch o o l , c o m-muter/noncommuter school, and school enrollment. Theanalysis indicated that abstainers and frequent binge drink-ers are significantly more likely than nonbinge drinkers tobe accurate in their perceptions, OR = 1.3 (1.08–1.51) and1.2 (1.08–1.43), respectively.
Frequent binge drinkers are significantly more likely thannonbinge drinkers to overestimate campus binge drinkingrates, OR = 1.4 (1.27–1.62). Abstainers and frequent bingedrinkers are less likely than nonbinge drinkers to underesti-mate the binge drinking rates at their schools, OR = 0.7(0.57–0.82), and OR = 0.8 (0.72–0.87), respectively. Fur-thermore, abstainers are more likely than nonbinge drinkersto answer “don’t know,” whereas occasional and frequentbinge drinkers are less likely to say that they do not knowabout the binge drinking rates at their schools, OR = 1.2( 1 . 0 5 – 1 . 4 5 ) , OR = 0.7 (0.57–0.76), and OR = 0.6(0.52–0.70), respectively.
For a comparison of the college binge drinking rate at
60 JOURNAL OF AMERICAN COLLEGE HEALTH
COLLEGE HEALTH
TABLE 1Students’Definitions of Binge Drinking for Men and for Women, by Type of Drinker
Type of drinkerOccasional Frequent
Total Abstainer Nonbinge binge bingeCum Cum Cum Cum Cum
Drinks in a row (n) % % % % % % % % % %
For men
≤ 3 4.3 4.3 12.1 12.1 3.5 3.5 1.8 1.8 1.2 1.24 9.7 14.0 18.5 30.6 10.6 14.1 6.0 7.8 4.5 5.75 19.5 33.5 24.8 55.4 22.3 36.4 15.9 23.7 14.0 19.76 16.8 50.3 18.2 73.6 19.7 56.1 16.2 39.9 11.7 31.47 11.5 61.7 8.8 82.4 12.1 68.2 13.3 53.2 10.9 42.38 12.1 73.8 6.7 89.1 11.8 80.0 14.8 68.0 14.4 56.79 4.5 78.3 1.7 90.8 4.0 84.0 5.9 73.9 6.5 63.2
≥ 10 21.7 100.0 9.3 100.0 16.0 100.0 26.1 100.0 36.7 100.0
For women
≤ 3 10.6 10.6 23.1 23.1 10.1 10.1 6.0 6.0 5.3 5.34 23.5 34.1 32.0 55.1 25.4 35.5 19.1 25.1 17.6 22.95 21.9 56.0 21.6 76.7 24.5 60.0 22.0 47.1 18.0 40.96 16.9 72.9 12.2 88.9 17.7 77.7 19.8 66.9 16.6 57.57 9.5 82.4 4.4 93.3 8.6 86.3 11.8 78.7 13.2 70.78 7.7 90.1 2.8 96.1 6.4 92.7 9.7 88.4 11.9 82.69 2.1 92.2 0.6 96.7 1.5 94.2 2.6 91.0 3.7 86.3
≥ 10 7.8 100.0 3.3 100.0 5.9 100.0 9.1 100.0 13.7 100.0
Note. Cum = cumulative percentage.
each school to the mean of students’perceived binge drink-ing rates at that school, see Table 6. The level of agreementis high, with a correlation of r = .76. At 68 schools, themean of students’ perceived binge drinking rates and thec o l l ege binge drinking rates mat ch. We cl a s s i fied theresponses at these schools as accurate because both rates arein the same decile. At 41 schools, the students’perceptionsare an underestimate of the college binge drinking rate, andat 10 schools the students’ perceptions are an overestimateof the college binge drinking rate.
COMMENT
Findings and Discussion
We used survey data from a 1999 representative sampleof more than 14 000 students enrolled at 119 colleges in 40states to examine students’ views about binge drinking on
their campuses. The study examined how students definethe term binge drinking, whether they consider it a problemon their campus, and how prevalent they think binge drink-ing is at their schools.
The findings are striking. At the median, half of the stu-dents define the term binge drinking as 6 drinks or fewer ina row for men and 5 drinks or fewer in a row for women.Students define the term on the basis of how much theythemselves drink. Abstainers consider the definition to be 5drinks in a row for men and 4 for women, whereas frequentbinge drinkers use the higher limits of 8 and 6 drinks,respectively. One in three frequent binge drinkers definesbinge drinking as 10 or more drinks in a row for men.
The median of students’ definitions of binge drinking isone drink higher than that used by the CAS and other stud-ies. Furthermore, all students, regardless of their drinking
VOL 49, SEPTEMBER 2000 61
STUDENTS DEFINE BINGE DRINKING
TABLE 2-AStudents’ Perceptions of Alcohol Problems on Campus,
in Percentages, by Type of Drinker
Student drinker classification
Occasional FrequentProblem Total Abstainer Nonbinge binge binge
Major problem 11.6 21.9 12.5 6.9 5.6Problem 35.6 40.1 39.0 32.3 29.3Minor problem 35.9 25.0 33.5 42.2 42.9Not a problem 17.0 13.1 14.9 18.6 22.2
TABLE 2-BStudents’ Perceptions of Alcohol Problems on Campus,
in Percentages, by Type of School
Student drinker classificationOccasional Frequent
Problem Total Abstainer Nonbinge binge binge
Low-binge school ( 35%)
Major problem 8.7 13.3 7.3 5.8 4.4Problem 31.9 35.9 34.0 26.3 21.4Minor problem 35.7 27.7 36.4 40.9 43.0Not a problem 23.7 30.0 22.2 27.1 31.2
Medium-binge school (36%–50%)
Major problem 10.2 21.5 11.8 4.1 4.1Problem 34.8 45.3 37.5 29.2 26.9Minor problem 36.8 24.6 35.4 43.3 42.7Not a problem 18.2 8.7 15.4 23.4 26.3
High-binge school (> 50%)
Major problem 15.3 41.1 19.7 10.4 7.0Problem 39.2 41.4 47.1 38.3 32.7Minor problem 34.9 14.8 27.2 41.5 43.0Not a problem 10.6 2.7 6.0 9.9 17.4
levels, have a gender-specific definition, indicating that ittakes fewer drinks for a women than for a men to be a bingedrinker. This should offer encouragement to those workingto decrease the level of alcohol abuse and related problemson campus. The students’definitions make it highly unlike-ly that those students’ voices, which have been reported asrejecting a 5-4 measure, represent all students. More likely,they are drawn from among the heaviest drinkers.
It is not surp rising that frequent binge dri n ke rs , wh oaccount for two thirds of all the alcohol college students dri n kand for three fifths of the most serious alcohol-re l ated pro b-lems on campus,3 1 would consider 5 or 4 drinks in a row toosmall. Unfo rt u n at e ly, some college administrat o rs and inter-vention program dire c t o rs may be swayed by the voices of
these students. Alcohol programs and policies need to bege a red to all students and not just the heaviest drinking group.
Our findings indicated that whether or not students per-ceive alcohol use to be a problem on their campuses is relat-ed to the students’ own drinking behaviors as well as to thelevels of drinking on their campus. Overall, about half of allstudents, a majority of abstainers and nonbinge drinkers,and a minority of occasional and frequent binge drinkers,consider students’alcohol use on their campus to be a prob-lem. The interplay of these factors is extremely strong.More than 4 in 5 abstainers on high-binge campuses and 1in 4 frequent binge drinkers on low-binge campuses con-sider alcohol use to be a problem on their campuses. Themajority of all students on high-binge campuses and the
62 JOURNAL OF AMERICAN COLLEGE HEALTH
COLLEGE HEALTH
TABLE 3Students’Estimates of the Percentage of Binge Drinkers Among Their Friends, by Type of Drinker
Occasional Frequent GreekTotal Abstainer Nonbinge binge binge frat mbr Athlete
Cum Cum Cum Cum Cum Cum CumResponse (%) % % % % % % % % % % % % % %
0–9 44.8 44.8 66.1 66.1 56.7 56.7 33.9 33.9 18.1 18.1 30.0 30.0 35.6 35.610–19 9.6 54.4 8.0 74.1 10.6 67.3 11.4 45.3 7.8 25.9 9.7 39.7 9.9 45.520–29 7.2 61.6 4.8 78.9 7.2 74.5 9.8 55.1 6.7 32.6 7.8 47.5 7.8 53.330–39 5.5 67.1 3.5 82.4 4.7 79.2 7.5 62.6 6.6 39.2 7.0 54.4 6.9 60.240–49 4.3 71.4 2.5 84.9 3.1 82.3 6.4 69.0 5.6 44.8 6.2 60.6 5.0 65.250–59 5.5 76.9 2.4 87.3 4.0 86.3 8.0 77.0 8.1 52.9 7.4 68.0 7.4 72.660–69 4.0 80.9 1.3 88.6 2.4 88.7 5.0 82.0 7.7 60.6 6.0 74.1 5.8 78.470–79 4.7 85.6 1.2 89.8 1.9 90.6 5.8 87.8 10.8 71.4 7.9 82.0 6.7 85.180–100 9.2 94.8 1.8 91.6 3.3 93.9 8.5 96.3 25.8 97.2 15.5 97.4 12.0 97.1Don’t know 5.3 100.0 8.4 100.0 6.1 100.0 3.7 100.0 2.8 100.0 2.6 100.0 2.9 100.0
Note. Cum = cumulative percentage.
TABLE 4Students’ Estimates of the Percentage of Binge Drinkers in Their School,
by Type of School
School
Low-binge Medium-binge High-bingeTotal (≤ 35%) (36%–50%) (> 50%)
Response Cum Cum Cum Cum(%) % % % % % % % %
0–9 8.2 8.2 16.1 16.1 7.5 7.5 3.1 3.110–19 11.7 19.8 13.2 29.3 13.1 20.6 8.9 12.020–29 14.4 34.2 15.1 44.4 15.3 35.9 12.7 24.730–39 16.0 50.2 14.0 58.4 16.6 52.5 16.6 41.340–49 9.2 59.4 7.6 66.0 9.0 61.5 10.8 52.150–59 10.3 69.7 7.4 73.4 10.4 71.9 12.4 64.560–69 9.7 79.4 5.5 78.9 8.7 80.6 14.1 78.670–79 6.7 86.1 3.7 82.6 5.4 86.0 10.5 89.180–100 3.2 89.3 1.7 84.3 2.6 88.6 5.1 94.2Don’t know 10.7 100.0 15.8 100.0 11.5 100.0 6.0 100.0
Note. Cum = cumulative percentage.
minority of students on low-binge campuses report a cam-puswide alcohol problem.
When students we re asked to estimate the extent of binged rinking on their campuses, the median response was 35%(mid-point of 30%–39%). Almost half of the students under-e s t i m ated the binge drinking rat e s , and 3 in 10 ove re s t i m at-ed it. We found more ove re s t i m ation at low - b i n ge sch o o l sand more undere s t i m ation at high-binge schools. When indi-vidual schools are ex a m i n e d, s t u d e n t s ’ p e rc eptions tend tobe highly accurat e. In the case of 60% of the college s , t h es t u d e n t s ’ e s t i m ates of the binge drinking rates we re within10% of the rates obtained from students’ s e l f - rep o rts. A t32% of the sch o o l s , the students undere s t i m ated the campusb i n ge drinking leve l , and at 8%, the students ove re s t i m at ethe level. These findings suggest that students have a gre at e ru n d e rstanding of the extent of binge drinking at their sch o o l sthan they are given credit fo r. Furt h e rm o re, s chools mayh ave “ rep u t at i o n s ” t h at are at least to some extent accurat e.
P roponents of the social norms ap p ro a ch aimed atredefining the campus drinking norm have indicated thatstudents generally overestimate the level of consumptionand drink more because they think that most students aredoing it. This widely held assumption is contradicted by thefindings that show that, from a national perspective, half ofthe students (47%) underestimate and only 29% overesti-mate the binge drinking rate on campus. Furthermore, bingedrinkers who overestimate the level of alcohol use on theircampuses account for only 3 in 10 (29%) binge drinkers butonly 1 in 8 students (13%) in the sample.
Students who overestimate binge drinking rates on theircampuses are more likely to be binge drinkers. Thus, pro-grams to redefine campus drinking norms may be a usefultechnique to reduce alcohol abuse on campus for this group.However, the size of this group nationally must be viewedin gauging the potential effect of this approach. Further-more, it is noteworthy that half of all binge drinkers under-
estimate the extent of binge drinking on their campuses. Inaddition, 1 in 6 (17%) abstainers and 1 in 8 nonbingedrinkers indicated that they did not know about the bingedrinking rate on their campus.
We should consider the consequences of such a normsredefinition campaign for nonbinge drinking students andabstainers who do not know or who underestimate theextent of binge drinking on their campus. The effect oflearning the binge drinking rate of their college on their owndrinking behavior should be carefully examined. Differentapproaches to prevention are also needed to keep studentsfrom joining the ranks of binge drinkers and to reduce bingedrinking levels and associated problems.
A Cautionary Note About Student Surveys
The CAS is based on self-reported responses to a mailsurvey and is subject to sources of error associated with thisapproach. Although respondents may intentionally or unin-tentionally distort their answers, a number of studies sup-port the validity of self-reports of alcohol use.32–34 Further-m o re, the same pat t e rn of responses among diffe re n tstudent subgroups is present in all 3 years of the study21–23
as well as in other major studies of college alcoholuse.18,19,35 Bias may also be introduced through sample
VOL 49, SEPTEMBER 2000 63
STUDENTS DEFINE BINGE DRINKING
TABLE 5Discrepancies Between Students’ Perceptions of
Binge Drinking Rate and the College Drinking Rate,in Percentages, by Type of Drinker and by Type of School
Responder Accurate Underestimate Overestimate Don’t know% % % % %
Total (n = 13 189) 13.1 46.5 28.8 11.6
Type of drinkerAbstainer (n = 2659) 15.2 36.2 31.8 16.9Nonbinge drinker (n = 5063) 11.9 46.4 27.7 14.0Occasional binge drinker
(n = 2962) 12.2 53.4 26.4 8.1Frequent binge drinker
(n = 3135) 14.1 49.2 30.1 6.6
Type of schoolLow binge (n = 3586) 16.6 26.8 39.4 17.3Medium binge (n = 5799) 10.7 48.2 28.3 12.8High binge (n = 4753) 13.1 58.9 21.1 7.0
TABLE 6Discrepancies Between College Binge DrinkingRate and Mean of Students’ Perceived Drinking
Rate (119 Schools)
Estimate n %
Accurate 68 60.5Underestimate 41 31.9Overestimate 10 7.6
attrition or nonresponse. Statistical controls used to exam-ine potential bias, however, revealed no association betweenstudents’nonresponses and binge drinking rates.
S t u d e n t s ’ d e finitions of binge drinking are obtained with-out specifi c ation of the time period during wh i ch the dri n k-ing occurs. This is done because the rates of binge dri n k i n ga re also obtained without re fe rence to a time peri o d. Th es t rong corre l ation of the 5-4 measure without a time specifi-c ation to alcohol-re l ated pro blems and secondhand effe c t sm a kes this an important indicator of the type of alcohol uset h at produces pro blems for the dri n ker and others on campus.
ACKNOWLEDGMENT
This study was supported by the Robert Wood Johnson Fo u n d a-tion. We grat e f u l ly ack n ow l e d ge the assistance of Karen Powe rs andM a rk Seibring for care f u l ly rev i ewing drafts of this manu s c ri p t .
NOTE
For further info rm at i o n , please add ress correspondence toHenry Wechsler, PhD, Department of Health and Social Behavior,Harvard School of Public Health,677 Huntington Avenue, Boston,MA 02115 (e-mail: [email protected]).
REFERENCES
1. Wechsler H, Kelley K, Weitzman ER, San Giovanni JP,Seibring M. What colleges are doing about student binge drinking:A national survey of college administrators. J Am Coll Health.2000;48:219–226.
2. Perkins HW, Berkowitz AD. Perceiving the communitynorms of alcohol use among students: Some research implicationsfor campus alcohol education programming. Int J Addict. 1986;21:961–976.
3. Baer JS , Stacy A, Larimer M. Biases in the perception ofdrinking norms among college students. J Stud Alcohol. 1991;52:580–586.
4. Wood MD, Nagoshi CT, Dennis DA. Alcohol norms andexpectations as predictors of alcohol use and problems in a collegestudent sample. Am J Drug Alcohol Abuse. 1992;18:461–476.
5. Mäkelä K. Drinking, the majority fallacy, cognitive disso-nance and social pressure. Addictions. 1997;92:729–736.
6. Downs WR. A panel study of normative structure, adoles-cent alcohol use and peer alcohol use. J Stud A l c o h o l .1987;48:167–175.
7. Perkins HW. Religious traditions, parents, and peers asdeterminants of alcohol and drug use among college students.Review of Religious Research. 1985;27:15–31.
8. Baer JS, Carney MM. Biases in the perceptions of the con-sequences of alcohol use among college students. J Stud Alcohol.1993;54:54–60.
9. Thombs DL, Wolcott BJ, Farkash LGE. Social context,per-ceived norms and drinking behavior in young people. J SubstanceAbuse. 1997;9:257–267.
10. Berkowitz AD, Perkins HW. Problem drinking among col-lege students: A review of recent research. J Am Coll Health.1986;35:21–28.
11. Wechsler H, Dowdall GW, Davenport A, Castillo S. Corre-lates of college student binge drinking. Am J Public Health.1995;7:921–926.
12. Larimer M, Irvine D, Kilmer JR, Marlatt GA. CollegeDrinking and the Greek System: Examining the role of perceivednorms for high-risk behavior. Journal of College Student Develop -ment.1997; 38:587–598.
13. Perkins HW, Meilman PW. Leichliter JS, Cashin JS, Pres-ley CA. Misperceptions of the norms for the frequency of alcohol
and other drug use on college campuses. J Am Coll Health. 1999;47:253–258.
14. Prentice DA, Miller DT. Pluralistic ignorance and alcoholuse on campus: Some consequences of misperceiving the socialnorm. J Pers Soc Psychol. 1993;45:134–140.
15. Agostinelli G, Brown JM, Miller WR. Effects of normativefeedback on consumption among heavy drinking college students.J Drug Education. 1995;25,31–40.
16. Haines M, Spear SF. Changing the perception of the norm:A str ategy to decrease binge drinking among college students. JAm Coll Health. 1996;45:134–140.
17. Johnston LD, O’Malley PM, Bachman JG. National SurveyResults on Drug Use From the Monitoring the Future Study,1975–1995; Vol II,College Students and Young Adults. US Dept ofHealth and Human Services; NIH publication #98-4140;1997.
18. Presley CA, Meilman PW, Cashin JR, Lyerla R. Alcoholand Drugs on American College Campuses: Use, Consequences,and Perceptions of the Campus Environment, Vol IV, 1992–94.Carbondale, IL: Southern Illinois University; 1996.
19. Douglas KA, Collins JL, Warren C, et al. Results from the1995 National College Health Risk Behavior Survey. J Am CollHealth. 1997;46:55–66.
20. Wechsler H, Dowdall G, Davenport A, Rimm E. A gender-specific measure of binge drinking among college students. Am JPublic Health. 1995;85:982–985.
21. Wechsler H, Davenport A, Dowdall G, Moeykens B, Castil-lo S. Health and behavioral consequences of binge drinking in col-l ege : A national survey of students at 140 colleges. JA M A .1994;272:1672–1677.
22. Wechsler H, Dowdall GW, Maenner G, Gledhill-Hoyt J,Lee H. Changes in binge drinking and related problems amongAmerican college students between 1993 and 1997. J Am CollHealth. 1998;47:57–68.
23. Wechsler H, Lee JE, Kuo M, Lee H. College binge drinkingin the 1990s:A continuing problem:Results of the Harvard Schoolof Public Health 1999 College Alcohol Study. J Am Coll Health.2000;48:199–210.
24. Wechsler H, Austin SB. Binge drinking: The five/four mea-sure. J Stud Alcohol. 1998;59:122–124.
25. Wechsler H, Kuo M, Lee H, Dowdall GW. Environmentalcorrelates of underage alcohol use and related problems of collegestudents. Am J Prev Med. 2000;19:24–29. In press.
26. Wechsler H, Isaac N. “Binge” drinkers at Massachusettscolleges: Prevalence, drinking style, time trends, and associatedproblems. JAMA. 1992;267:2929–2931.
27. Rosner B. Fundamentals of Biostatistics. 3rd ed. Boston:PWS-KENT; 1990.
28. Jaeger R. Statistics: A Spectator Sport. 2nd ed. NewburyPark, CA: Sage; 1990.
29. Liang KY, Zeger SL. Longitudinal data analysis using gen-eralized linear models. Biometrika. 1992;73:12–22.
30. Zegar SL, Liang KY, Albert PS. Models for longitudinaldata: A generalized estimating equation approach. Biometrics.1988;4:1049–1060.
31. Wechsler H, Molnar BE, Davenport AE, Baer JS. Collegealcohol use: A full or empty glass? J Am Coll Health. 2000;47:247–252.
32. Frier MC, Bell RM,Ellickson PL. Do Teens Tell the Truth?The Validity of Self-Report Tobacco Use by Adolescents. SantaMonica, CA: RAND; 1991. RAND publication N-3291-CHF.
33. Cooper AM, Sobell MB, Sobell LC, Maisto SA. Validity ofa l c o h o l i c s ’ s e l f - rep o rt s : D u ration data. Int J A dd i c t. 1981;16:401–406.
34. Midanik L. Validity of self-report alcohol use: A literaturereview and assessment. Brit J Addict. 1988;83:1019–1030.
35. Youth risk behavior surveillance: National College HealthRisk Behavior Survey United States. M M W R. 1997;46(SS-6):1–54.
64 JOURNAL OF AMERICAN COLLEGE HEALTH
COLLEGE HEALTH
TIAA CREF (CAMERA COPYAND NEG ENCLOSED)
P. 65