Embed Size (px)
Citation preview
Color categories only affect post-perceptual processeswhen same- and different-category colors
are equally discriminable
Xun He,1,2,4 Christoph Witzel,2 Lewis Forder,2 Alexandra Clifford,3 and Anna Franklin2,5
1Psychology Research Centre, School of Design, Engineering and Computing, Bournemouth University, BH12 5BB, UK2The Sussex Colour Group, School of Psychology, University of Sussex, BN1 9RH, UK
3Department of Psychology, University of Surrey, Guildford, Surrey GU2 7XH, UK4e-mail: [email protected]
5e-mail: [email protected]
Received September 30, 2013; revised December 13, 2013; accepted January 6, 2014;posted January 17, 2014 (Doc. ID 198626); published 0 MONTH 0000
Prior claims that color categories affect color perception are confounded by inequalities in the color space used toequate same- and different-category colors. Here, we equate same- and different-category colors in the number ofjust-noticeable differences, and measure event-related potentials (ERPs) to these colors on a visual oddball task toestablish if color categories affect perceptual or post-perceptual stages of processing. Category effects were foundfrom 200 ms after color presentation, only in ERP components that reflect post-perceptual processes (e.g., N2, P3).The findings suggest that color categories affect post-perceptual processing, but do not affect the perceptualrepresentation of color. © 2014 Optical Society of America
OCIS codes: (330.1720) Color vision; (330.5020) Perception psychology; (330.5510) Psychophysics.http://dx.doi.org/10.1364/JOSAA.31.00000A
1. INTRODUCTIONAlthough we are able to perceive more than two million differ-ent colors [1,2], colors are commonly grouped into a numberof more or less discrete categories (e.g., red, green, blue). Theeffect of categorization on how color is perceived has beenextensively researched [3,4]. Numerous studies have claimedthat the phenomenon of “categorical perception,” where dis-crimination of stimuli from different categories is easier thandiscrimination of an equivalent same category stimulus differ-ence [5], extends to the domain of color. For example, somehave suggested that people are faster or more accurate atsearching for a colored target when target and distractorsare from different color categories than when they are fromthe same category, even when same- and different-categorychromatic differences are equated (e.g., [6–8]). Other poten-tial categorical effects have been documented when peoplememorize colors or judge their similarity (e.g., [9,10]).
There has been uncertainty about whether color categoryeffects really do occur at a perceptual level, as the term “cat-egorical perception” would suggest [11–15]. Psychophysicalstudies have disagreed whether categorical effects are presentat detection threshold [13] or not [14]. Distinguishingdifferent-category colors may be easier than same-categorycolors because the categorical difference enhances attention[15]. Alternatively, a same-category disadvantage could arisebecause same-category colors have the same name despitebeing different colors, which leads to conflict at the stageof decision making [11]. Color categories may therefore affectpost-perceptual stages of processing, but the underlying per-ceptual representation of color and early stages of colorprocessing (e.g., at visual cortex) may remain unaffected.
In order to clarify what stages of color processing are af-fected by color categories, a number of studies have employedthe event-related potential (ERP) technique [15–24]. This tech-nique uses electrodes to measure electrical activity from thescalp elicited in response to sensory, cognitive, or motorevents. The resulting ERPs are then represented as wave-forms through time at various locations on the scalp surface.Typical visual ERPs (i.e., ERPs generated by visual stimuli)have a series of components (P1, N1, P2, N2, P3), whichare termed after their polarity (P positive, N negative)and relative positions in the waveforms (e.g., P1 means thefirst positive component) and which are known to index cer-tain sensory or post-perceptual processes [25,26].
Studies that have used the ERP technique to investigatecolor category effects have recorded ERPs while participantssearch for colors [18], while they passively or actively detectchanges in the color presented [16–23], or while they makejudgments about whether colors are the same or different[24]. The majority of these studies have claimed that the influ-ence of categories can be seen at early perceptual stages of thetime course, during the first couple of hundred millisecondsafter color presentation [16–23]. For example, in one study,the detection of a color change elicited an ERP componentaround 100 ms (P1) that peaked roughly 5 ms earlier whenthe color changewasdifferent- than same-category [17].Othershave claimed that category effects are pre-attentive or uncon-scious and are found for an ERP component (the visual mis-match negativity, vMMN) [27,28] that is elicited even whenattention is not directed to the colors [19–21]. An fMRI inves-tigation of categorical effects in visual search that foundgreater activation in V2/V3 for different- than same-category
He et al. Vol. 31, No. 4 / April 2014 / J. Opt. Soc. Am. A A1
1084-7529/14/0400A1-01$15.00/0 © 2014 Optical Society of America

color search has strengthened such claims [29]. Such findingshave been taken to suggest that color categories affectperceptual processing at visual cortex [16,17,19].
However, there is also concern over whether these so-called category effects are actually categorical at all becausethese studies only coarsely controlled color differences usingthe Munsell color system, or CIELUV/CIELAB color spaces.There are known perceptual inequalities in these color spaces[30,31], such that color differences equated in Munsell hue orEuclidean distance in CIELUV/LAB are not necessarily equallydiscriminable. It is therefore possible that the early perceptualcategory effects in some ERP studies may simply be explainedby failure to control the discriminability of the colors [32].
Nevertheless, there is also evidence for color category ef-fects that cannot easily be explained by perceptual inequalitiesin the color spaces used to equate same- and different-categorycolors or by other stimulus issues. First, effects are likely to becategorical when there are cross-linguistic differences in theeffect. For example, if there is an effect only for speakerswho have separate terms for the categories, then there isgreater certainty that the effect is a result of categories, as ifthe effect were due to problems with the color spaces usedto equate colors then the effect would be present for all partic-ipants irrespective of the terms in their language [19,33–35].One ERP study examined the time course of the effect ofcross-linguistic differences in color terms (Greek and English)and found cross-linguistic differences within the time range ofan early perceptual and pre-attentive ERP component (thevMMN) [19]. However, others have also questioned whetherthese effects really were independent of attention or whether;at least for some participants (particularly the Englishspeakers), the vMMN ERP component was actually obscuredby an attentional one (the “N2b”) [15–17,20]. This means thatthere is still some uncertainty about whether cross-linguisticdifferences in color category effects are due to differencesin perception or post-perceptual processes such as attention.
Second, effects are likely to be categorical when they arisefollowing the learning of novel categories (e.g., if participantsare trained to divide greens into two new categories). In suchstudies, the stimuli are the same before and after participantslearn the novel categories, and so effects induced by categorylearning cannot be due to stimulus issues [15,21,36]. One ERPstudy examined the time course of category effects inducedfollowing the learning of novel categories [15] and only foundevidence for category effects in post-perceptual stages ofprocessing (P3 component, 350–600 ms). However, it does re-main possible that category effects would appear earlier inperceptual processing if the newly learnt color categorieswere more familiar.
A third method of ensuring that “category” effects cannotbe accounted for by inequalities in the color space used toequate same- and different-category colors is to instead equatecolors in empirically measured just-noticeable differences(JNDs). A JND is the minimal difference between two colorsthat an observer is just able to perceive, and equating the num-ber of JNDs for same- and different-category color differencescontrols for discriminability. A set of studies that havepreviously taken this approach have found color categoryeffects [37–39]. For example, performance in a speededdiscrimination task increased toward category boundarieswhen colors from same- and different-categories were equally
discriminable [37–39]. One potential explanation for these cat-egory effects is that when equally discriminable colors aredistinguished on speeded tasks such as search, memory, orchange detection tasks, categorical distinctions affect post-perceptual processes (e.g., attention), which modulate perfor-mance. An alternative account is that the category effectsresult from categories modulating perception in a top-downmanner. As colors are equated in discriminability, it mightseem circular to argue that categories could influence percep-tion. However, even though colors are equated in discrimi-nable differences at threshold, it could still be possible forcategories to modulate perception when participants makejudgments about supra-threshold color differences underspeeded conditions such as visual search or change detection.
The aim of the current study is to investigate the timecourse of color category effects in ERPs, when the discrimi-nability of colors is carefully controlled through the measure-ment of discrimination thresholds. We investigate categoryeffects across the blue–green category boundary, as this boun-dary has been the main focus of prior claims for color catego-ries affecting perception, e.g., [6,7,9,10,16–18]. The currentstudy has two stages: a stimulus definition stage and a mainexperiment. The stimulus definition stage aimed to define astimulus set with blue/green color pairs that are equated inJNDs for the average participant. To get an idea of the averagelocation of the blue–green category boundary and its rangeacross participants we asked one group of participants toname colors in the blue–green region. Discrimination thresh-olds in terms of JNDs were then measured for a series of blueand green colors with another group of participants. Based onthese measurements, we created equally discriminable colorpairs that were expected to vary in categorical relationship(same-/different-category) for individuals in the main experi-ment. Separate groups of participants completed the stimulusdefinition naming and JND tasks, and participants were alsodifferent to those who completed the main experiment toensure that there were no carry-over effects between tasks.
The main experiment aimed to establish the time course ofcategory effects for the equally discriminable colors. To as-sess the category effect, a third group of participants viewedthe colors on a visual oddball task [17]. The visual oddball taskrequired participants to detect infrequently presented colors(the deviant stimuli) amongst frequent presentations of an-other color (the standard stimulus). Participants completedthe visual oddball task twice: First when ERPs were recordedand participants counted the number of deviant stimuli. Par-ticipants did not make a manual response, which removed thepossibility of having undesirable contamination from move-ment-related brain activities on the EEG data. Participantsthen completed the visual oddball task again when partici-pants manually responded to the stimuli and we recorded re-action time (RT) and accuracy but not ERPs. Following this,the same participants named the colors used on the visualoddball task. The standard-deviant color pairs were classifiedas same- or different-category for each individual on the basisof their own color naming. This ensured that individual varia-tion in the location of the blue–green category boundary wasaccounted for.
A number of ERP components are elicited on a visualoddball task. The early ERP components, namely P1 andN1, which typically occur 100–200 ms post-stimulus, generally
A2 J. Opt. Soc. Am. A / Vol. 31, No. 4 / April 2014 He et al.
reflect the processing of visual information at a sensory level;thus they are called sensory-level components because theyare sensitive to physical properties of visual stimuli [40–42].Later activities, which include P2, N2, and P3, involve post-perceptual processes such as feature evaluation and contextupdating [43–45]. Studies have shown that these late compo-nents are enhanced by low-frequency stimuli [45–47]. Aneffect of color categories on the viewing of colors on thevisual oddball task is characterized by differences in thepeak latency or amplitude of the ERP components elicitedby deviant colors that were from the same- versus different-category to the standard. The ERP components for whichsuch category effects are found indicate the time courseand nature of the effect of color categories. If categories affectpost-perceptual processes, category effects should be foundfor post-perceptual ERP components (e.g., P2, N2, P3, compo-nents after 200 ms). If color categories affect perceptual proc-esses, category effects should be found for perceptual ERPcomponents (e.g., P1, N1).
2. STIMULUS DEFINITIONA. ParticipantsTen native British-English speakers took part in a color nam-ing task [6 females, mean age 23.5, standard deviationSD 6.2]. Data from 17 participants (12 females, meanage 23.2, SD 5.0) were used to determine the JND values.All measurements from two further participants were re-moved because their JNDs were more than 3 SDs away fromthe group mean for at least one tested color. This removal ofoutlier data ensures a more accurate estimate of JNDs. All par-ticipants had normal or corrected-to-normal vision and had nocolor vision deficiencies on the Ishihara Color Vision Test [48]or the City Color Vision Test [49] (as for participants in themain experiment). All parts of the study were approved bythe Life Sciences and Psychology Cluster based EthicsCommittee at the University of Sussex (ref: AF0811) andthe European Research Council Executive Agency EthicsReview Board (ref: 283605).
B. Apparatus and Set-UpMATLAB (MathWorks, Inc.) and Psychophysics Toolbox 3(see [50,51]) were used to prepare the color naming andJND measurements. Stimuli were displayed on a 22” CRTmonitor (color resolution: 8 bits∕channel, spatial resolution:1600 × 1200, refresh rate: 100 Hz). The CIE1931 chromaticitycoordinates and luminance of the monitor primaries were:R 0.626; 0.337; 14.24, G 0.281; 0.614; 45.51, and B 0.151; 0.071; 5.28. Gamma corrections were applied basedon the measured gamma curves of the monitor primaries.
C. Color Naming and Threshold DiscriminationExperimentsColor naming and threshold discrimination experiments wererun in order to define the colors for the main visual oddballexperiment. The aim of the color naming experiment was toestablish the average location of the blue–green boundary andits range across participants. This allows us to define a stimu-lus set, which is likely to provide color pairs that participantswho take part in the main experiment will consider to besame- or different-category. A group of participants named120 colors on an isoluminant circle (3° steps) in the CIELUV
space at a lightness level typical for green (L 50) [52] on agray background (L 70) with an equal-energy white point.Participants determined the name of the presented color bypressing one of eight keys (for the eight basic color names).The average boundary between green and blue was quantifiedas the hue angle for which participants named the two adja-cent colors with equal probabilities (linear interpolation wasperformed when the actual data showed ambiguous bounda-ries). This average boundary was determined in the currentsetup at the hue azimuth of 183° (standard error 3°).
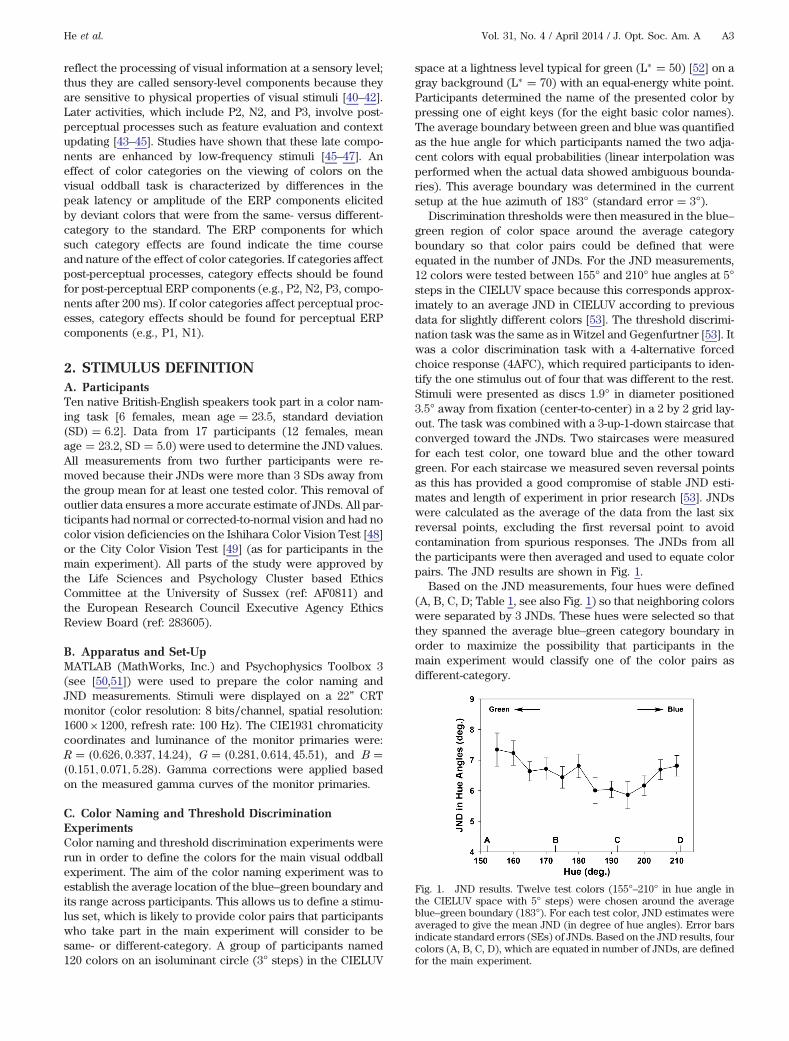
Discrimination thresholds were then measured in the blue–green region of color space around the average categoryboundary so that color pairs could be defined that wereequated in the number of JNDs. For the JND measurements,12 colors were tested between 155° and 210° hue angles at 5°steps in the CIELUV space because this corresponds approx-imately to an average JND in CIELUV according to previousdata for slightly different colors [53]. The threshold discrimi-nation task was the same as in Witzel and Gegenfurtner [53]. Itwas a color discrimination task with a 4-alternative forcedchoice response (4AFC), which required participants to iden-tify the one stimulus out of four that was different to the rest.Stimuli were presented as discs 1.9° in diameter positioned3.5° away from fixation (center-to-center) in a 2 by 2 grid lay-out. The task was combined with a 3-up-1-down staircase thatconverged toward the JNDs. Two staircases were measuredfor each test color, one toward blue and the other towardgreen. For each staircase we measured seven reversal pointsas this has provided a good compromise of stable JND esti-mates and length of experiment in prior research [53]. JNDswere calculated as the average of the data from the last sixreversal points, excluding the first reversal point to avoidcontamination from spurious responses. The JNDs from allthe participants were then averaged and used to equate colorpairs. The JND results are shown in Fig. 1.
Based on the JND measurements, four hues were defined(A, B, C, D; Table 1, see also Fig. 1) so that neighboring colorswere separated by 3 JNDs. These hues were selected so thatthey spanned the average blue–green category boundary inorder to maximize the possibility that participants in themain experiment would classify one of the color pairs asdifferent-category.
Fig. 1. JND results. Twelve test colors (155°–210° in hue angle inthe CIELUV space with 5° steps) were chosen around the averageblue–green boundary (183°). For each test color, JND estimates wereaveraged to give the mean JND (in degree of hue angles). Error barsindicate standard errors (SEs) of JNDs. Based on the JND results, fourcolors (A, B, C, D), which are equated in number of JNDs, are definedfor the main experiment.
He et al. Vol. 31, No. 4 / April 2014 / J. Opt. Soc. Am. A A3
3. MAIN EXPERIMENT: METHODA. ParticipantsTwenty native British-English speakers (18 female, meanage 21.0, SD 3.0) participated in the main experiment.Their eyesight and color vision were tested beforehand.
B. Apparatus and Set-UpMaterials were prepared with e-Prime 2 (Psychology SoftwareTools, Inc.), and participants were seated comfortably in adark room 77 cm away from a 22” CRT monitor (color reso-lution: 8 bits∕channel, spatial resolution: 1024 × 768, refreshrate: 75 Hz). The CIE1931 chromaticity coordinates and lumi-nance of the monitor primaries were R 0.627; 0.339; 16.83,G 0.280; 0.614; 42.98, and B 0.150; 0.071; 5.55. All RGBvalues were gamma-corrected based on the inverted gammafunctions of the monitor.
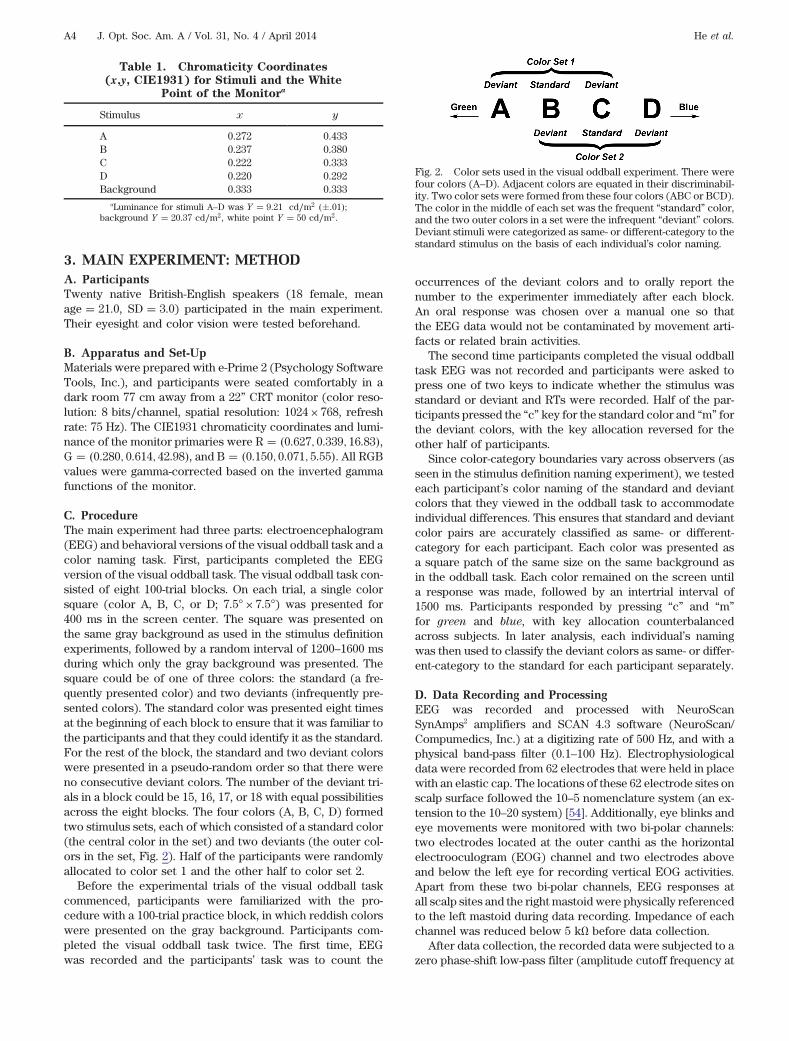
C. ProcedureThe main experiment had three parts: electroencephalogram(EEG) and behavioral versions of the visual oddball task and acolor naming task. First, participants completed the EEGversion of the visual oddball task. The visual oddball task con-sisted of eight 100-trial blocks. On each trial, a single colorsquare (color A, B, C, or D; 7.5° × 7.5°) was presented for400 ms in the screen center. The square was presented onthe same gray background as used in the stimulus definitionexperiments, followed by a random interval of 1200–1600 msduring which only the gray background was presented. Thesquare could be of one of three colors: the standard (a fre-quently presented color) and two deviants (infrequently pre-sented colors). The standard color was presented eight timesat the beginning of each block to ensure that it was familiar tothe participants and that they could identify it as the standard.For the rest of the block, the standard and two deviant colorswere presented in a pseudo-random order so that there wereno consecutive deviant colors. The number of the deviant tri-als in a block could be 15, 16, 17, or 18 with equal possibilitiesacross the eight blocks. The four colors (A, B, C, D) formedtwo stimulus sets, each of which consisted of a standard color(the central color in the set) and two deviants (the outer col-ors in the set, Fig. 2). Half of the participants were randomlyallocated to color set 1 and the other half to color set 2.
Before the experimental trials of the visual oddball taskcommenced, participants were familiarized with the pro-cedure with a 100-trial practice block, in which reddish colorswere presented on the gray background. Participants com-pleted the visual oddball task twice. The first time, EEGwas recorded and the participants’ task was to count the
occurrences of the deviant colors and to orally report thenumber to the experimenter immediately after each block.An oral response was chosen over a manual one so thatthe EEG data would not be contaminated by movement arti-facts or related brain activities.
The second time participants completed the visual oddballtask EEG was not recorded and participants were asked topress one of two keys to indicate whether the stimulus wasstandard or deviant and RTs were recorded. Half of the par-ticipants pressed the “c” key for the standard color and “m” forthe deviant colors, with the key allocation reversed for theother half of participants.
Since color-category boundaries vary across observers (asseen in the stimulus definition naming experiment), we testedeach participant’s color naming of the standard and deviantcolors that they viewed in the oddball task to accommodateindividual differences. This ensures that standard and deviantcolor pairs are accurately classified as same- or different-category for each participant. Each color was presented asa square patch of the same size on the same background asin the oddball task. Each color remained on the screen untila response was made, followed by an intertrial interval of1500 ms. Participants responded by pressing “c” and “m”
for green and blue, with key allocation counterbalancedacross subjects. In later analysis, each individual’s namingwas then used to classify the deviant colors as same- or differ-ent-category to the standard for each participant separately.
D. Data Recording and ProcessingEEG was recorded and processed with NeuroScanSynAmps2 amplifiers and SCAN 4.3 software (NeuroScan/Compumedics, Inc.) at a digitizing rate of 500 Hz, and with aphysical band-pass filter (0.1–100 Hz). Electrophysiologicaldata were recorded from 62 electrodes that were held in placewith an elastic cap. The locations of these 62 electrode sites onscalp surface followed the 10–5 nomenclature system (an ex-tension to the 10–20 system) [54]. Additionally, eye blinks andeye movements were monitored with two bi-polar channels:two electrodes located at the outer canthi as the horizontalelectrooculogram (EOG) channel and two electrodes aboveand below the left eye for recording vertical EOG activities.Apart from these two bi-polar channels, EEG responses atall scalp sites and the right mastoid were physically referencedto the left mastoid during data recording. Impedance of eachchannel was reduced below 5 kΩ before data collection.
After data collection, the recorded data were subjected to azero phase-shift low-pass filter (amplitude cutoff frequency at
Table 1. Chromaticity Coordinates(x;y, CIE1931) for Stimuli and the White
Point of the Monitora
Stimulus x y
A 0.272 0.433B 0.237 0.380C 0.222 0.333D 0.220 0.292Background 0.333 0.333
aLuminance for stimuli A–D was Y 9.21 cd∕m2 .01;background Y 20.37 cd∕m2, white point Y 50 cd∕m2.
Fig. 2. Color sets used in the visual oddball experiment. There werefour colors (A–D). Adjacent colors are equated in their discriminabil-ity. Two color sets were formed from these four colors (ABC or BCD).The color in the middle of each set was the frequent “standard” color,and the two outer colors in a set were the infrequent “deviant” colors.Deviant stimuli were categorized as same- or different-category to thestandard stimulus on the basis of each individual’s color naming.
A4 J. Opt. Soc. Am. A / Vol. 31, No. 4 / April 2014 He et al.

40 Hz, 48 dB∕oct roll-off) and then digitally re-referenced tothe mean voltage of electrical activities recorded at the twomastoids. Trials containing activities out of the range of60 μV were rejected as contaminated with artifacts. ERPswere then generated by averaging EEG activities over trialstime-locked to stimulus onsets (for different experimentalconditions separately). The averaged EEG segments lasted900 ms, starting at 100 ms before stimulus onset and endingat 800 ms after stimulus onset and were measured relative tothe 100-ms pre-stimulus baseline.
4. MAIN EXPERIMENT: RESULTSThere were three stages of analysis. First, naming data wereanalyzed to establish the category membership of the deviantcolors for individual participants. Second, behavioral datawere analyzed with themain aim of establishing whether therewas a category effect in participants’ behavioral response.Third, EEG data were analyzed with the main aim of establish-ing whether there was a category effect for sensory or post-perceptual ERP components. The analysis is reported in thisorder (a reverse order to the reporting of the tasks in the meth-ods, and the order of completion by participants) as this is themost logical order in which to present the findings.
A. NamingOne participant was ambiguous in the naming of the standardcolor (named green in 48% and blue in 52% of the trials). Thisparticipant’s data were excluded from further analysis as theirambiguous naming of the standard meant that deviants couldnot be classified as same- or different-category for that partici-pant. The blue–green category boundary was clear for the re-maining 19 participants: for all colors the most frequent namegiven to a color was given on at least 60% of the trials. On thebasis of the color naming in the stimulus definition phase ofthe study, it was expected that on average stimuli A and Bwould be named green and C and D would be named blueby many of the participants. This was indeed the mostcommon location of the category boundary for participantsin the main experiment as well (for 12 participants), yet therewas also individual variation (seven participants, who saw col-ors B, C, and D in the oddball task, put the category boundarybetween C and D). Deviant colors were classified as same- ordifferent-category to the standard color for each individualaccording to their own naming in order to take this individualvariation in color naming into account.
B. Behavioral Oddball TaskThe behavioral data (Section 4.B) and the EEG data(Section 4.C) from the visual oddball task were both analyzedusing data from participants who saw either set 1 or set 2.Preliminary analyses with color set as a factor revealed nosignificant interactions of Set with Color, p 0:49 for hit ratesand p 0:98 for RTs. Therefore the behavior analyses are pre-sented for data collapsed across sets. For the behavioral odd-ball task data, trials with RTs more than three SDs away fromthe mean value were rejected for each participant. Hit ratesand mean RTs for correct identification of the stimulus asstandard or deviant for the three color conditions (standard,same-category deviant, different-category deviant) were thenanalyzed with one-way repeated-measures analyses of vari-ance (ANOVAs). For hit rates, the main effect was significant,
F2; 36 30.97, p < 0.0001. Least significance difference(LSD) pairwise comparisons revealed that the performancewas better for the standard color (98.7%) than for the deviants(same-category 75.6%, different-category 80.4%), ps < 0.0001.The hit rates for the two deviant colors, however, did not dif-fer, p 0.14, showing no evidence of a category effect. Thispattern was replicated in the RT data, where a significant maineffect was found, F2; 36 86.58, p < 0.0001. RTs were sig-nificantly shorter for the standard color (406 ms) than for thedeviant colors (same-category 515 ms, different-category510 ms), ps < 0.0001. The RTs for the two deviant colors werecomparable, p 0.59, providing no evidence for a significantcategory effect.
C. EEG Oddball Task: ElectrophysiologyTwo participants elicited very strong alpha waves (8–13 Hzspontaneous EEG rhythmic activities) [55], which contami-nated the ERP waveforms greatly. Additionally, anothertwo persons showed an excessive number of artifacts inthe EEG data, resulting in too few accepted trials for anyERP analysis. Data from these four subjects were removedfrom any ERP analysis. Therefore, 15 participants’ data wereanalyzed and are presented here. ERP components and de-flections were quantified as mean amplitudes at electrodesites within time windows that taken together showed themost prominent activities over space (electrode sites) andtime (time windows) of the analyzed ERP responses. Thiswas in line with the standard analysis procedure of ERP data-sets [25,26]. The electrode sites (always a cluster of neighbor-ing sites representative of the spatial distribution of thecomponents) and time windows (representative of the tempo-ral distribution of the components) were chosen based on lit-erature and observation of grand-average (i.e., averagedacross all participants) ERP waveforms obtained in the cur-rent study. When a sensory-level component had a discerniblepeak latency (the peak was clearly localized to a precise pointin time) in each participant, peak latency was analyzed (see[25] for more on latency analysis).
The oddball effect was revealed as differences in the meanamplitude or peak latency of the standard and either the same-or different-category deviant. The category effect was seen bya differential response to the same- and different-category de-viants. ANOVAs were used in the analyses, and Greenhouse–Geisser corrections were applied when sphericity assumptionwas violated. LSD tests were used for pairwise comparisons tofollow up significant main effects. Preliminary analyses withcolor set as a factor revealed no significant Set × Color inter-action, all ps > 0.1. Therefore all ERP analyses are presentedfor data collapsed across sets. Figure 3 shows the ERP wave-forms at eight representative electrode sites.
1. Sensory-Level Component: P1Figure 4 summarizes the results from the sensory-level com-ponents (P1 and the anterior N1). The P1 component was atits maximal amplitude at occipital electrode sites at around150 ms after stimulus onset. But because the peak was notclearly discernible across individuals despite a recognizableP1 component in the grand-average waveforms, no peaklatency analysis was conducted. Its mean amplitudes weremeasured between 130 and 170 ms averaged over five occipi-tal electrode sites (O1, Oz, O2, OI1h, OI2h), then analyzed with
He et al. Vol. 31, No. 4 / April 2014 / J. Opt. Soc. Am. A A5
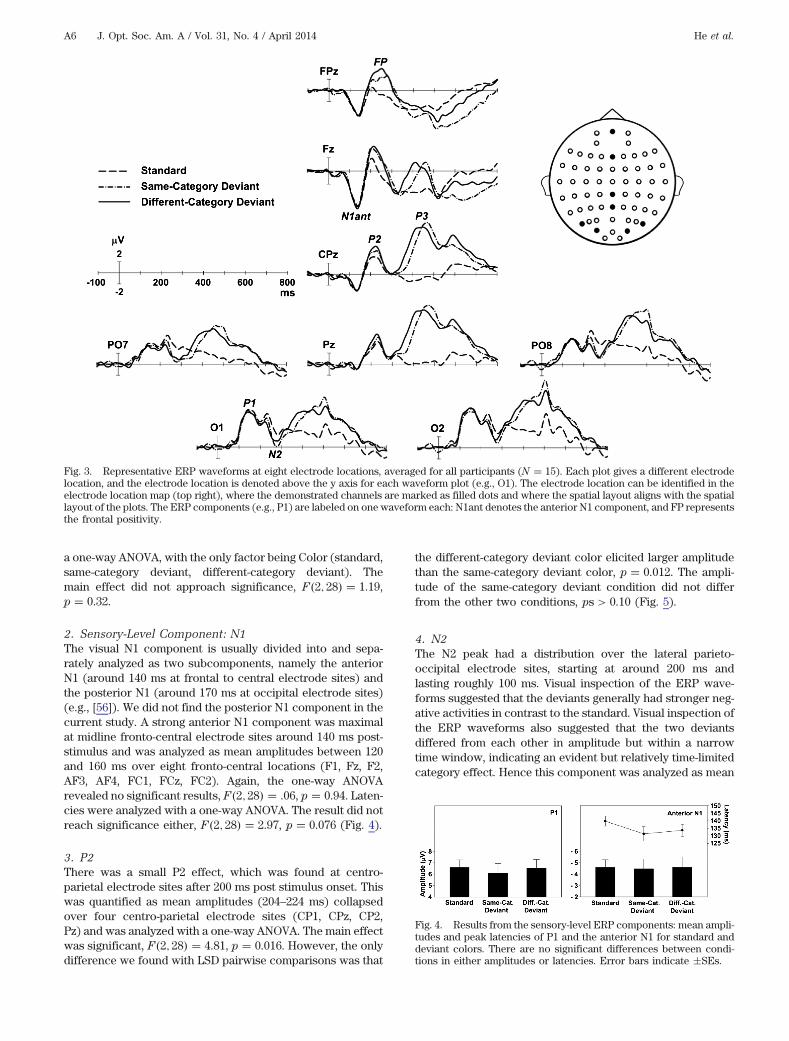
a one-way ANOVA, with the only factor being Color (standard,same-category deviant, different-category deviant). Themain effect did not approach significance, F2; 28 1.19,p 0.32.
2. Sensory-Level Component: N1The visual N1 component is usually divided into and sepa-rately analyzed as two subcomponents, namely the anteriorN1 (around 140 ms at frontal to central electrode sites) andthe posterior N1 (around 170 ms at occipital electrode sites)(e.g., [56]). We did not find the posterior N1 component in thecurrent study. A strong anterior N1 component was maximalat midline fronto-central electrode sites around 140 ms post-stimulus and was analyzed as mean amplitudes between 120and 160 ms over eight fronto-central locations (F1, Fz, F2,AF3, AF4, FC1, FCz, FC2). Again, the one-way ANOVArevealed no significant results, F2; 28 .06, p 0.94. Laten-cies were analyzed with a one-way ANOVA. The result did notreach significance either, F2; 28 2.97, p 0.076 (Fig. 4).
3. P2There was a small P2 effect, which was found at centro-parietal electrode sites after 200 ms post stimulus onset. Thiswas quantified as mean amplitudes (204–224 ms) collapsedover four centro-parietal electrode sites (CP1, CPz, CP2,Pz) and was analyzed with a one-way ANOVA. The main effectwas significant, F2; 28 4.81, p 0.016. However, the onlydifference we found with LSD pairwise comparisons was that
the different-category deviant color elicited larger amplitudethan the same-category deviant color, p 0.012. The ampli-tude of the same-category deviant condition did not differfrom the other two conditions, ps > 0.10 (Fig. 5).
4. N2The N2 peak had a distribution over the lateral parieto-occipital electrode sites, starting at around 200 ms andlasting roughly 100 ms. Visual inspection of the ERP wave-forms suggested that the deviants generally had stronger neg-ative activities in contrast to the standard. Visual inspection ofthe ERP waveforms also suggested that the two deviantsdiffered from each other in amplitude but within a narrowtime window, indicating an evident but relatively time-limitedcategory effect. Hence this component was analyzed as mean
Fig. 3. Representative ERP waveforms at eight electrode locations, averaged for all participants (N 15). Each plot gives a different electrodelocation, and the electrode location is denoted above the y axis for each waveform plot (e.g., O1). The electrode location can be identified in theelectrode location map (top right), where the demonstrated channels are marked as filled dots and where the spatial layout aligns with the spatiallayout of the plots. The ERP components (e.g., P1) are labeled on one waveform each: N1ant denotes the anterior N1 component, and FP representsthe frontal positivity.
Fig. 4. Results from the sensory-level ERP components: mean ampli-tudes and peak latencies of P1 and the anterior N1 for standard anddeviant colors. There are no significant differences between condi-tions in either amplitudes or latencies. Error bars indicate SEs.
A6 J. Opt. Soc. Am. A / Vol. 31, No. 4 / April 2014 He et al.

amplitudes over two time windows: a wide one (200–280 ms)and a narrow one (230–246 ms). This latter analysis was spe-cifically to test whether the category effect takes place at thetime range of the N2 component. Sites chosen for these analy-ses were O1, O2, PO7, PO5, PO6, PO8, OI1h, OI2h in theparieto-occipital areas. Unlike previously analyzed compo-nents, the N2 had a lateral distribution. Therefore a factorof hemisphere was added for the analysis, in which ERPactivities were averaged across four electrode sites for the leftand right hemisphere separately. The results are shown inFig. 5 (collapsed across hemisphere).
For the wide-window data, we ran a two-way ANOVA: Color(standard, same-category deviant, different-category deviant) ×Hemisphere (left versus right). A significant main effectof Color was found, F2; 28 10.33, p 0.00044. SubsequentLSD tests confirmed our observation by showing morenegative amplitudes from the deviants than from thestandard color, ps < 0:006. The amplitudes of the deviantconditions were not significantly different, p 0.37. The effectof Hemisphere did not reach significance, F1; 14 0.64,p 0.44, or interact with Color, F2; 28 0.08, p 0.92.
Analysis for the narrow-window (230–246 ms) data demon-strated a slightly different pattern. The main effect of Colorwas significant, F2; 28 13.76, p < 0.0001. The activitywas more negative for the different-category deviant condi-tion than for the same-category deviant color, p 0.020,and they were both stronger than the standard condition,p 0.0083 (same-category deviant) and p 0.00042(different-category deviant). Similar to the wide-window data,Hemisphere did not have an effect on the amplitudes,F1; 14 0:70, p 0.42, or interact with Color,F2; 28 0.28, p 0.76.
5. Frontal PositivityThe three stimulus types elicited different activities over thefrontal electrode sites. This effect started at around 200 mspost-stimulus and spanned more than 100 ms. Generally devi-ant colors produced a more positive deflection relative to thestandard color. This effect was quantified as mean amplitudesover an early window (210–260 ms) and a late window
(280–320 ms) at frontal electrode sites FP1, FPz, FP2, AF3,and AF4.
Figure 6 summarizes the results of both analyses. The one-way ANOVA for the early-window data yielded a significantmain effect of Color, F2; 18 21.06, p < 0.0001. LSD testsconfirmed our visual inspection, showing that the deviantsgenerated more positive activities than the standard color,ps < 0.0013, and that the activity was more positive for thedifferent-category deviant color than the same-categorydeviant color, p 0:042.
The analysis for the late-window data replicated the patternthat the deviant colors had more prominent positivity than thestandard color, F2; 28 10.54, p 0.00039, pairwise testps < 0.0038. In contrast to the early-window results, therewas no difference between the amplitudes of the two deviantconditions, p 0.43.
6. P3We found a long-lasting and strong P3 component at posterior(centro-parietal, parietal, parieto-occipital) electrode sites. Asis common in visual oddball studies [17], it is evident that thedeviant conditions had much larger P3 than the standard con-dition. This was confirmed by a two-way (Color × Region)ANOVA, which statistically assessed the mean amplitudesover three regions, each of which included three electrodesites (centro-parietal: CP1, CPz, CP2; parietal: P1, Pz, P2;parieto-occipital: PO3, POz, PO4) between 350 and 530 ms.The main effect of Color was highly significant, F2; 28 61.80, p < 0.0001. Further paired LSD tests indicated thatthe deviants produced stronger activities than the standard,ps < 0.0001, suggesting that participants were activelyengaged in the detection of the deviant stimuli and that theamplitudes of the deviants were similar, p 0.56 (Fig. 7).The effect of Region was also significant, F2; 28 11.88,p 0.0031. This was because the activities were more promi-nent over the more posterior (parietal and parieto-occipital)sites than the centro-parietal sites, ps < 0.0032 (parietal ver-sus parieto-occipital p 0.050). The interaction did not reachsignificance, F4; 56 3.34, p 0.052.
However, it cannot be concluded that the two deviant con-ditions elicited similar P3s, because we noticed in the wave-forms that the two deviants had different patterns at differentstages. Initially the amplitude of the different-category deviantcondition was larger than that of the same-category deviantcondition. Yet at a later stage this was reversed. Hence, wecarried out two further ANOVAs to look into the P3 effectsat these two stages (early 350–410 ms, late 460–520 ms).Because our aim was to test the differences between thetwo deviant conditions, we did not include the standard
Fig. 5. Mean amplitudes of P2 and N2 components for standard anddeviant colors. Asterisks indicate significant differences between con-ditions (p < 0.05, p < 0.01, p < 0.001). Error bars indicateSEs.
Fig. 6. Mean amplitudes of the frontal positivity (FP) for standardand deviant colors. Significant differences are marked by asterisks(p < 0.05, p < 0.01, p < 0.001). Error bars indicate SEs.
He et al. Vol. 31, No. 4 / April 2014 / J. Opt. Soc. Am. A A7

condition in the analyses, resulting in 2 (Color) ×3 (Region)ANOVAs.
At the early stage, the main effect of Color was significant,F1; 14 5.74, p 0.031, with the different-category deviantcolor eliciting a stronger P3. The amplitudes differed acrossregions, F2; 28 10.01, p 0.0058, with larger P3 ampli-tude over the more posterior sites, all pairwise ps < 0.039.The interaction was not significant, F2; 28 1.79, p 0.20.For the late stage, an opposite pattern was found, with thesame-category deviant eliciting stronger P3 activitiesthan the different-category deviant condition, F1; 14 5.80; p 0.030. Effect of Region was again significant,F2; 28 11.86, p 0.0028, because amplitudes were largerat the parietal and parieto-occipital sites than at the centro-parietal sites, ps < 0:0037, but did not differ between the pari-etal and parieto-occipital regions, p 0.23. No significantinteraction was found, F2; 28 0.51, p 0.50.
5. DISCUSSIONThe aim of the current study was to investigate the timecourse of category effects for equally discriminable same-and different-category colors. Same- and different-categorycolors were equated in discriminability in terms of the numberof JNDs. The category effect was then assessed using a visualoddball task where infrequent deviant colors were either fromthe same- or different-color category to a frequent standardcolor. Although there was no category effect on a behavioralversion of this task, the ERPs revealed clear category effectsfor several ERP components. ERP components elicited in re-sponse to infrequent deviant colors varied according towhether deviant colors were from the same- or different-colorcategory to the frequent standard color. This category effectwas only found after the sensory-level processing stage, after200 ms post stimulus presentation.
Different-category deviants elicited greater mean amplitudethan same-category deviants, within a limited time window ofthe N2 component (230–246 ms) at occipital sites, and duringthe early phase of a frontal positivity (210–260 ms). For the P3component at parietal sites, we also found an amplitude en-hancement for the different-category deviant relative to thesame-category deviant at the early phase (350–410 ms) anda reduction at the late phase (460–520 ms). This pattern ac-tually suggests that the P3 component reached its amplitudemaximum earlier for the different-category deviants than forthe same-category deviants (see Figs. 3 and 7), suggesting anearlier context updating process for the different-category de-viant stimuli [43]. Importantly however, a category effect wasabsent from ERP activities earlier than 200 ms. Two early ERP
components (P1 and the anterior N1) were observed in thecurrent study, and there was no trace of a categoryeffect for either of these components.
Although many prior ERP investigations of color categoriesfound effects early on in the time course [16–22], the categoryeffects in those studies cannot be dissociated from inequal-ities in the color space used to equate same- and different-category colors. In contrast to previous studies, the categoryeffects found here cannot be due to differences in the discrim-inability of same- and different-category colors as colors wereequated in empirically measured JNDs. Other stimulus issues(such as salience of one hue over the others) cannot accountfor the category effects, as the design ensured that different-or same-category deviant hues varied across participants (dueto the use of two color sets and individual differences in colornaming). Therefore, we are confident that the differences inERP components for different- and same-category deviants isnot due to stimulus issues, but is due to the categorical rela-tionship of the deviant and the standard.
Here, we show that when same- and different-category col-ors are equated in their discriminability, the category effectsat early perceptual stages of processing disappear and onlypost-perceptual category effects remain. These findings alignwith a prior ERP study of newly trained color categories,which was able to dissociate category effects from stimulusissues and which only found effects later on in the time course[15]. Category effects for the blue–green categorical distinc-tion in the current study were found earlier than for the newlytrained categories in the prior study (e.g., from 210 ms forblue–green versus 350 ms for the newly trained categoryboundary in Clifford et al.) [15]. This potentially suggests thatthe degree to which the categorical distinction is establishedcould influence the time course of the category effect.
The findings of the current study challenge the idea thatcross-linguistic differences in color terms would result inpre-attentive differences in perceptual processing [19]. Ifthe basic color categories of blue and green do not affect per-ceptual processing, then it is also unlikely that cross-linguisticdifferences in color lexicons would result in differences inearly perceptual processing of color. It has previously beenargued that the domain of color provides a prime exampleof Whorfian effects of language on perceptual representation[57]. However, the findings of the current study suggest thatcolor terms in fact have a less pervasive influence on percep-tion than such accounts propose, and although color catego-ries interact with post-perceptual processes, the perceptualrepresentation of color is actually unaffected.
6. CONCLUSIONThe current study finds that color categories only affectpost-perceptual color processing when same- and different-category colors are equally discriminable. It therefore appearsthat color categories do affect people’s ability to distinguishcolors [53], but that this is due to an influence of categorieson post-perceptual processes rather than due to categories af-fecting the perceptual similarity of colors or interacting withtheir perceptual representation.
ACKNOWLEDGMENTSThe research was supported by a European Research CouncilStarter Grant (project “CATEGORIES,” ref. 283605) to AF, and
Fig. 7. Mean amplitude of the P3 component for standard anddeviant colors. As indicated by asterisks (p < 0.05, p < 0.01,p < 0.001), deviant colors have a much larger P3, and the resultson the same- and different-category deviants differ at different timewindows. Error bars indicate SEs.
A8 J. Opt. Soc. Am. A / Vol. 31, No. 4 / April 2014 He et al.

CW was supported by a DAAD postdoctoral fellowship. Wewould like to thank Amanda Holmes for contributing to thedevelopment of the visual oddball task and for insightful dis-cussion, and two anonymous reviewers for highly construc-tive comments.
REFERENCES1. M. R. Pointer and G. G. Attridge, “The number of discernible
colours,” Color Res. Appl. 23, 52–54 (1998).2. J. M. M. Linhares, P. D. Pinto, and S. M. C. Nascimento, “The
number of discernible colors in natural scenes,” J. Opt. Soc.Am. A 25, 2918–2924 (2008).
3. P. Kay and T. Regier, “Language, thought and color: recent de-velopments,” Trends Cogn. Sci. 10, 51–54 (2006).
4. C. E. Sternheim and R. M. Boynton, “Uniqueness of perceivedhues investigated with a continuous judgmental technique,”J. Exp. Psychol. 72, 770–776 (1966).
5. S. R. Harnad, “Interhemispheric division of labour,” presented atBucke Society Conference on Transformation of Conscious-
ness, Montreal, 1973.6. A. L. Gilbert, T. Regier, P. Kay, and R. B. Ivry, “Whorf hypothesis
is supported in the right visual field but not in the left,” Proc.Natl. Acad. Sci. USA 103, 489–494 (2006).
7. G. V. Drivonikou, P. Kay, T. Regier, R. B. Ivry, A. L. Gilbert, A.Franklin, and I. R. Davies, “Further evidence that Whorfianeffects are stronger in the right visual field than the left,” Proc.Natl. Acad. Sci. USA 104, 1097–1102 (2007).
8. C. A. Daoutis, M. Pilling, and I. R. Davies, “Categorical effects invisual search for colour,” Vis. Cogn. 14, 217–240 (2006).
9. D. Roberson and J. Davidoff, “The categorical perception of col-ors and facial expressions: the effect of verbal interference,”Mem. Cogn. 28, 977–986 (2000).
10. P. Kay and W. Kempton, “What is the Sapir-Whorf hypothesis,”Am. Anthropol. 86, 65–79 (1984).
11. D. Roberson and J. R. Hanley, “Color vision: color categoriesvary with language after all,” Curr. Biol. 17, R605–R607 (2007).
12. M. A. Webster and P. Kay, “Color categories and color appear-ance,” Cognition 122, 375–392 (2012).
13. K. T. Mullen and J. J. Kulikowski, “Wavelength discrimination atdetection threshold,” J. Opt. Soc. Am. A 7, 733–742 (1990).
14. J. Krauskopf, D. R. Williams, M. B. Mandler, and A. M. Brown,“Higher order color mechanisms,” Vis. Res. 26, 23–32 (1986).
15. A. Clifford, A. Franklin, A. Holmes, V. G. Drivonikou, E. Özgen,and I. R. Davies, “Neural correlates of acquired color categoryeffects,” Brain Cogn. 80, 126–143 (2012).
16. E. Fonteneau and J. Davidoff, “Neural correlates of colour cat-egories,” Neuroreport 18, 1323–1327 (2007).
17. A. Holmes, A. Franklin, A. Clifford, and I. R. Davies, “Neuro-physiological evidence for categorical perception of color,”Brain Cogn. 69, 426–434 (2009).
18. Q. Liu, H. Li, J. L. Campos, Q. Wang, Y. Zhang, J. Qiu, Q. Zhang,and H. J. Sun, “The N2pc component in ERP and the lateraliza-tion effect of language on color perception,”Neurosci. Lett. 454,58–61 (2009).
19. G. Thierry, P. Athanasopoulos, A. Wiggett, B. Dering, and J. R.Kuipers, “Unconscious effects of language-specific terminologyon preattentive color perception,” Proc. Natl. Acad. Sci. USA106, 4567–4570 (2009).
20. A. Clifford, A. Holmes, I. R. Davies, and A. Franklin, “Color cat-egories affect pre-attentive color perception,” Biol. Psychol. 85,275–282 (2010).
21. L. Mo, G. Xu, P. Kay, and L. H. Tan, “Electrophysiological evi-dence for the left-lateralized effect of language on preattentivecategorical perception of color,” Proc. Natl. Acad. Sci. USA 108,14026–14030 (2011).
22. A. Clifford, A. Franklin, I. R. Davies, and A. Holmes, “Electro-physiological markers of categorical perception of color in7-month old infants,” Brain Cogn. 71, 165–172 (2009).
23. P. Athanasopoulos, “Cognitive representation of colour in bilin-guals: the case of Greek blues,” Bilingual. Lang. Cogn. 12, 83–95(2009).
24. Q. Liu, H. Li, J. L. Campos, C. Teeter, W. Tao, Q. Zhang, andH. J. Sun, “Language suppression effects on the categorical
perception of colour as evidenced through ERPs,” Biol. Psychol.85, 45–52 (2010).
25. S. J. Luck, An Introduction to the Event-Related Potential Tech-
nique (MIT, 2005).26. M. D. Rugg and M. G. H. Coles, Electrophysiology of Mind:
Event-Related Brain Potentials and Cognition (OxfordUniversity, 1996).
27. I. Czigler, “Visual mismatch negativity: violation of nonattendedenvironmental regularities,” J. Psychophysiol. 21, 224–230(2007).
28. I. Czigler, L. Balázs, and L. G. Pató, “Visual change detection:event-related potentials are dependent on stimulus location inhumans,” Neurosci. Lett. 364, 149–153 (2004).
29. W. T. Siok, P. Kay, W. S. Wang, A. H. Chan, L. Chen, K. K. Luke,and L. H. Tan, “Language regions of brain are operative in colorperception,” Proc. Natl. Acad. Sci. USA 106, 8140–8145(2009).
30. G. Wyszecki and W. S. Stiles, Color Science: Concepts and
Methods, Quantitative Data and Formulae, 2nd ed. (Wiley,2000).
31. R. W. G. Hunt and M. R. Pointer, Measuring Colour, 4th ed.(Wiley, 2011).
32. A. M. Brown, D. T. Lindsey, and K. M. Guckes, “Color names,color categories, and color-cued visual search: sometimes, colorperception is not categorical,” J. Vis. 11(12), 2 (2011).
33. D. Roberson, I. R. Davies, and J. Davidoff, “Color categories arenot universal: replications and new evidence from a stone-ageculture,” J. Exp. Psychol. Gen. 129, 369–398 (2000).
34. C. A. Daoutis, A. Franklin, A. Riddett, A. Clifford, and I. R.Davies, “Categorical effects in children’s colour search: across-linguistic comparison,” Br. J. Dev. Psychol. 24, 373–400(2006).
35. J. Winawer, N. Witthoft, M. C. Frank, L. Wu, A. R. Wade, and L.Boroditsky, “Russian blues reveal effects of language on colordiscrimination,” Proc. Natl. Acad. Sci. USA 104, 7780–7785(2007).
36. E. Özgen and I. R. Davies, “Acquisition of categorical color per-ception: a perceptual learning approach to the linguisticrelativity hypothesis,” J. Exp. Psychol. Gen. 131, 477–493(2002).
37. C. Witzel, T. Hansen, and K. R. Gegenfurtner, “Categorical reac-tion times for equally discriminable colours,” Perception 38, 14(2009).
38. C. Witzel and K. R. Gegenfurtner, “Category effects for red andbrown,” presented at European Conference of Visual Percep-
tion (ECVP), Alghero, Italy, 2012.39. C. Witzel and K. R. Gegenfurtner, are preparing a manuscript to
be called “Categorical facilitation effects for equally dicrimin-able colours.”
40. S. Johannes, T. F. Münte, H. J. Heinze, and G. R. Mangun,“Luminance and spatial attention effects on early visual process-ing,” Cogn. Brain Res. 2, 189–205 (1995).
41. S. A. Hillyard, E. K. Vogel, and S. J. Luck, “Sensory gain control(amplification) as a mechanism of selective attention: electro-physiological and neuroimaging evidence,” Phil. Trans. R.Soc. London B 353, 1257–1270 (1998).
42. A. Martínez, F. Di Russo, L. Anllo-Vento, M. I. Sereno, R. B.Buxton, and S. A. Hillyard, “Putting spatial attention on themap: timing and localization of stimulus selection processesin striate and extrastriate visual areas,” Vis. Res. 41, 1437–1457 (2001).
43. E. Donchin, “Surprise! … surprise?” Psychophysiology 18,493–513 (1981).
44. G. McCarthy and E. Donchin, “A metric for thought: a compari-son of P300 latency and reaction time,” Science 211, 77–80(1981).
45. S. H. Patel and P. N. Azzam, “Characterization of N200 and P300:selected studies of the event-related potential,” Int. J. Med. Sci.2, 147–154 (2005).
46. S. J. Luck and S. A. Hillyard, “Spatial filtering during visualsearch: evidence from human electrophysiology,” J. Exp.Psychol. Hum. Percept. Perform. 20, 1000–1014 (1994).
47. S. J. Luck and S. A. Hillyard, “Electrophysiological correlates offeature analysis during visual search,” Psychophysiology 31,291–308 (1994).
He et al. Vol. 31, No. 4 / April 2014 / J. Opt. Soc. Am. A A9

48. S. Ishihara, Ishihara Tests for Color-Blindness (Kanehara,1987).
49. R. Fletcher, City Color Vision Test (Keeler, 1981).50. D. H. Brainard, “The psychophysics toolbox,” Spat. Vis. 10,
433–436 (1997).51. D. G. Pelli, “The VideoToolbox software for visual psychophys-
ics: transforming numbers into movies,” Spat. Vis. 10, 437–442(1997).
52. C. Witzel and A. Franklin, “Do focal colors look particularly‘colorful’?” J. Opt. Soc. Am. A (to be published).
53. C. Witzel and K. R. Gegenfurtner, “Categorical sensitivity tocolor differences,” J. Vis. 13(7), 1 (2013).
54. R. Oostenveld and P. Praamstra, “The five percent electrodesystem for high-resolution EEG and ERP measurements,” Clin.Neurophysiol. 112, 713–719 (2001).
55. E. Niedermeyer, “Alpha rhythms as physiological andabnormal phenomena,” Int. J. Psychophysiol. 26, 31–49(1997).
56. H. J. Heinze, S. J. Luck, G. R. Mangun, and S. A. Hillyard, “Visualevent-related potentials index focused attention within bilateralstimulus arrays. I. Evidence for early selection,” Electroen. Clin.Neuro. 75, 511–527 (1990).
57. G. Lupyan, “Linguistically modulated perception and cognition:the label-feedback hypothesis,” Front. Psychol. 3, 1–13 (2012).
A10 J. Opt. Soc. Am. A / Vol. 31, No. 4 / April 2014 He et al.