Embed Size (px)
Citation preview
CCoolloorraaddoo 22000077 AAiirr QQuuaalliittyy DDaattaa RReeppoorrtt
`
Air Pollution Control Division

COLORADO AIR QUALITY DATA REPORT
2007
Air Pollution Control Division APCD-TS-B1
4300 Cherry Creek Drive South Denver, Colorado 80246-1530
(303) 692-3100
July 2008

Cover photo View of Perry’s Peak from above the Frasier River Valley. This report is available electronically at http://www.colorado.gov/airquality/tech.aspx
Table of Contents
1.0 Purpose of the Annual Data Report ....................................................................................................1 1.1 Symbols and Abbreviations ............................................................................................................1 1.2 Description of Monitoring Areas in Colorado................................................................................1
1.2.1 Eastern Plains Counties............................................................................................................1 1.2.2 Northern Front Range Counties ...............................................................................................2 1.2.3 Southern Front Range Counties ...............................................................................................2 1.2.4 Mountain Counties...................................................................................................................2 1.2.5 Western Counties .....................................................................................................................2
2.0 Criteria Pollutants ...............................................................................................................................6 2.0.1 Exceedance Summary Table....................................................................................................6
2.1 Carbon Monoxide - Sources ...........................................................................................................7 2.1.1 Carbon Monoxide - Standards .................................................................................................7 2.1.2 Carbon Monoxide - Health Effects ..........................................................................................7 2.1.3 Carbon Monoxide - Emissions.................................................................................................8
2.2 Ozone ..............................................................................................................................................8 2.2.1 Ozone - Standards ....................................................................................................................9 2.2.2 Ozone - Health Effects.............................................................................................................9 2.2.3 Ozone - Sources .....................................................................................................................10
2.3 Sulfur Dioxide...............................................................................................................................10 2.3.1 Sulfur Dioxide - Standards.....................................................................................................10 2.3.2 Sulfur Dioxide - Health Effects .............................................................................................10 2.3.3 Sulfur Dioxide - Sources........................................................................................................10
2.4 Nitrogen Dioxide ..........................................................................................................................11 2.4.1 Nitrogen Dioxide - Standards ................................................................................................11 2.4.2 Nitrogen Dioxide - Health Effects .........................................................................................11 2.4.3 Nitrogen Dioxide - Sources ...................................................................................................11
2.5 Particulate Matter - PM10 ..............................................................................................................12 2.5.1 Particulate Matter - PM10 - Standards....................................................................................12 2.5.2 Particulate Matter - PM10 - Health Effects.............................................................................13 2.5.3 Particulate Matter - PM10 - Sources .......................................................................................13
2.6 Particulate Matter - PM2.5 .............................................................................................................14 2.6.1 Particulate Matter - PM2.5 - Standards ...................................................................................14 2.6.2 Particulate Matter - PM2.5 - Health Effects ............................................................................15 2.6.3 Particulate Matter - PM2.5 - Sources ......................................................................................15
2.7 Lead...............................................................................................................................................15 2.7.1 Lead - Standards ....................................................................................................................16 2.7.2 Lead - Health Effects .............................................................................................................16 2.7.3 Lead - Sources........................................................................................................................16
3.0 Non-Criteria Pollutants .....................................................................................................................17 3.1 Visibility .......................................................................................................................................17
3.1.1 Visibility - Standards .............................................................................................................17 3.1.2 Visibility - Health Effects ......................................................................................................17 3.1.3 Visibility - Sources ................................................................................................................18 3.1.4 Visibility - Monitoring...........................................................................................................18 3.1.5 Visibility - Denver Camera....................................................................................................18
3.2 Nitric Oxide ..................................................................................................................................21 3.3 Total Suspended Particulates ........................................................................................................21 3.4 Meteorology..................................................................................................................................21 3.5 Air Toxics .....................................................................................................................................21 3.6 PM2.5 Chemical Speciation ...........................................................................................................22
4.0 Statewide Summaries For Criteria Pollutants ...................................................................................23 4.1 Carbon Monoxide .........................................................................................................................23 4.2 Ozone ............................................................................................................................................24 4.3 Sulfur Dioxide...............................................................................................................................25 4.4 Nitrogen Dioxide ..........................................................................................................................26 4.5 Particulates - PM10 ........................................................................................................................26 4.6 Particulates - PM2.5 .......................................................................................................................27 4.7 Lead...............................................................................................................................................28
5.0 National Comparisons For Criteria Pollutants..................................................................................29 5.1 Carbon monoxide..........................................................................................................................29 5.2 Ozone ............................................................................................................................................30 5.3 Sulfur Dioxide...............................................................................................................................30 5.4 Nitrogen Dioxide ..........................................................................................................................31 5.5 Particulates....................................................................................................................................32 5.6 Lead...............................................................................................................................................32
6.0 Monitoring Results by Area in Colorado..........................................................................................34 6.1 Eastern Plains Counties.................................................................................................................34 6.2 Northern Front Range Counties ....................................................................................................37 6.3 Southern Front Range Counties ....................................................................................................61 6.4 Mountain Counties........................................................................................................................66 6.5 Western Counties ..........................................................................................................................69
Table of Figures
Figure 1 - Monitoring Areas in Colorado ............................................................................................. 3 Figure 2 - Changes in National Carbon Monoxide Emissions from 1970 – 2007 ................................. 8 Figure 3 - Changes in National Sulfur Dioxide Emissions from 1970 – 2007 .................................... 11 Figure 4 - Changes in National Oxides of Nitrogen Emissions from 1970 - 2005 .............................. 12 Figure 5 - Changes in National PM10 Emissions from 1970 - 2007 .................................................... 14 Figure 6 - Changes in National PM2.5 Emissions from 1990 - 2007.................................................... 15 Figure 7 - Changes in National Lead Emissions from 1970 - 2007..................................................... 16 Figure 8 - Best and Worst Visibility Days for 2007 ......................................................................... 20 Figure 9 - Statewide Ambient Trends - Carbon Monoxide.................................................................. 23 Figure 10 - Statewide Ambient Trends - Ozone .................................................................................. 25 Figure 11 - Statewide Ambient Trends – PM10.................................................................................... 27 Figure 12 - Eastern Plains PM10 Particulate Graphs ........................................................................... 35 Figure 13 - Eastern Plains PM2.5 Particulate Graph ............................................................................. 35 Figure 14 - Eastern Plains Wind Rose Graph ...................................................................................... 36 Figure 15 - Northern Front Range PM10 Particulate Graphs ............................................................... 39 Figure 16 - Northern Front Range PM2.5 Particulate Graphs ............................................................... 41 Figure 17 - Northern Front Range Lead Graphs .................................................................................. 43 Figure 18 - Northern Front Range Carbon Monoxide Graphs............................................................. 45 Figure 19 - Northern Front Range Ozone Graphs................................................................................ 48 Figure 19 - Northern Front Range Ozone Graphs (continued) ........................................................... 49 Figure 20 - Northern Front Range Nitrogen Dioxide Graphs .............................................................. 50 Figure 21 - Northern Front Range Sulfur Dioxide Graphs .................................................................. 50 Figure 22 - Denver Visibility (January 2007 through December 2007) .............................................. 51 Figure 23 - Denver Visibility Comparison (1998 to 2007).................................................................. 52 Figure 24 - Fort Collins Visibility Data (January 2007 to December 2007)........................................ 53 Figure 25 - Fort Collins Visibility Data (1998 to 2007) ...................................................................... 54 Figure 26 - Northern Front Range Wind Roses ................................................................................... 55 Figure 27 - Southern Front Range PM10 Particulate Graphs ............................................................... 62 Figure 27 - Southern Front Range PM10 Particulate Graphs (continued) ............................................ 63 Figure 28 - Southern Front Range PM2.5 Particulate Graphs ............................................................... 64 Figure 29 - Southern Front Range Carbon Monoxide Graphs............................................................. 64 Figure 30 - Southern Front Range Ozone Graph ................................................................................. 65 Figure 31 - Mountain Counties PM10 Particulate Graphs .................................................................... 67 Figure 32 - Western Counties PM10 Particulate Graphs ...................................................................... 70 Figure 33 - Western Counties PM2.5 Particulate Graph ....................................................................... 72 Figure 34 - Western Counties Carbon Monoxide Graph ..................................................................... 72 Figure 35 - Western Counties Wind Roses .......................................................................................... 73
Table of Tables Table 1 - Statewide Continuous Monitors In Operation For 2007......................................................... 4 Table 2 - Statewide Particulate Monitors In Operation For 2007.......................................................... 5 Table 3 - National Ambient Air Quality Standards ............................................................................... 6 Table 4 - 2006/2007 Exceedance Summaries at APCD Monitors ......................................................... 7 Table 5 - Historical Maximum 1-Hr and 8-Hr Carbon Monoxide Concentrations.............................. 24 Table 6 - Historical Maximum 1-Hour Ozone Concentrations............................................................ 24 Table 7 - Historical Maximum Annual Average Sulfur Dioxide Concentrations................................ 25 Table 8 - Historical Maximum Annual Average Nitrogen Dioxide Concentrations ........................... 26 Table 9 - Historical Maximum 24-Hour PM10 Concentrations............................................................ 27 Table 10 - Historical Maximum Quarterly Lead Concentrations ........................................................ 28 Table 11 - 2007 National Ranking of Carbon Monoxide Monitors by 8-Hr Concentrations in ppm.. 29 Table 12 - 2007 National Ranking of Ozone Monitors by 1-Hr Concentrations in ppm..................... 30 Table 13 - 2007 National Ranking of Ozone Monitors by 8-Hr Concentrations in ppm..................... 30 Table 14 - 2007 National Ranking of Sulfur Dioxide Monitors by 24-Hr Concentrations in ppm ..... 31 Table 15 - 2007 National Ranking of Nitrogen Dioxide Monitors by 1-Hr Concentrations in ppm ... 31 Table 16 - 2007 National Ranking of PM10 Monitors by 24-Hr Maximum Concentrations in μg/m3 32 Table 17 - 2007 National Ranking of PM2.5 Monitors by 24-Hr Maximum Concentrations in μg/m3 32 Table 18 - 2006 National Ranking of Lead Monitors by 24-Hr Maximum Concentration in μg/m3 .. 33 Table 19 - Eastern Plains Monitors In Operation For 2007 ................................................................. 34 Table 20 - Eastern Plains Particulate Values For 2007........................................................................ 34 Table 21 - Northern Front Range Particulate Monitors In Operation For 2007 .................................. 37 Table 22 - Northern Front Range Particulate Values For 2007 ........................................................... 38 Table 23 - Northern Front Range TSP and Lead Values For 2007...................................................... 43 Table 24 - Northern Front Range Continuous Monitors In Operation For 2007 ................................. 44 Table 25 - Northern Front Range Carbon Monoxide Values for 2007 ................................................ 45 Table 26 - Northern Front Range Ozone Values For 2007.................................................................. 47 Table 27 - Northern Front Range Oxides of Nitrogen and Sulfur Dioxide Values For 2007 .............. 50 Table 28 - Denver Visibility Standard Exceedance Days.................................................................... 51 Table 29 - Fort Collins Visibility Standard Exceedance Days ............................................................ 53 Table 30 - Southern Front Range Monitors In Operation For 2007..................................................... 61 Table 31 - Southern Front Range Maximum Particulate Values For 2007.......................................... 62 Table 32 - Southern Front Range Carbon Monoxide Values For 2007 ............................................... 64 Table 33 - Southern Front Range Ozone Values For 2007.................................................................. 65 Table 34 - Mountain Counties Monitors In Operation For 2007 ......................................................... 66 Table 35 - Mountain Counties Particulate Values For 2007................................................................ 67 Table 36 - Western Counties Monitors In Operation For 2007 ........................................................... 69 Table 37 - Western Counties Particulate Values For 2007 .................................................................. 70 Table 38 - Western Counties Carbon Monoxide Values For 2007...................................................... 72
1
1.0 Purpose of the Annual Data Report The Colorado Department of Public Health and Environment, Air Pollution Control Division (APCD) publishes the Colorado Air Quality Data Report as a companion document to the Colorado Air Quality Control Commission Report to the Public. The Air Quality Data Report addresses changes in ambient air quality measured by Division monitors. The Report to the Public discusses the policies and programs designed to improve and protect Colorado’s air quality. 1.1 Symbols and Abbreviations The following symbols and abbreviations are used through out this report:
CO – Carbon monoxide SO2 – Sulfur dioxide SOX – Sulfur oxides NOX – Nitrogen oxides NO – Nitric oxide NO2 – Nitrogen dioxide O3 – Ozone Met – meteorological measurements, wind speed, wind direction, temperature, relative
humidity and standard deviation of horizontal wind direction. TSP – Total suspended particulates PM10 – Particulate matter less than 10 microns in aerometric diameter. PM2.5 – Particulate matter less than 2.5 microns in aerometric diameter. Pb – Lead ppm – parts per million – this is used with gaseous pollutants. μg/m3 – micrograms per cubic meter – this is used with particulate pollutants. Criteria Pollutants – CO, NO2, SO2, O3, PM10, PM2.5, Pb
1.2 Description of Monitoring Areas in Colorado
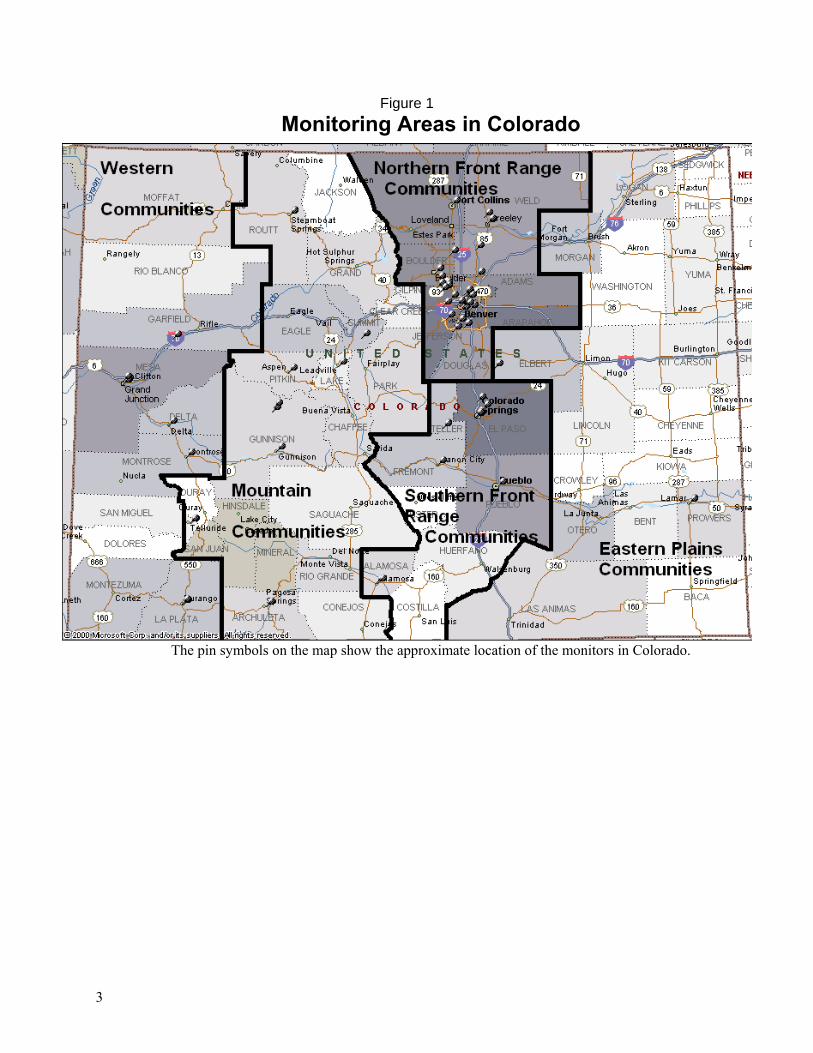
The state has been divided into five multi-county areas that are generally based on topography. The areas are; the Eastern Plains, the Northern Front Range, the Southern Front Range, the Mountain Counties and the Western Counties. These divisions are a somewhat arbitrary grouping of monitoring sites with similar characteristics.
The Eastern Plains Counties consist of those counties east of the I-25 corridor. These counties are generally rolling agricultural plains below 6000 feet.
The Front Range used in this definition is defined by the counties along or associated with the I-25 corridor not strictly by the Continental Divide. A division using the Continental Divide would place Leadville with the same counties as Colorado Springs and Denver. Leadville as the highest city in the U.S. has more in common with Breckenridge and Aspen than Denver or Colorado Springs.
The Mountain Counties are generally those on the west side of the Continental Divide and the Western Counties are the ones adjacent to the Utah border. Other divisions can and have been made, but these five divisions seemed appropriate for this report. Figure 1 shows the boundaries of these areas. 1.2.1 Eastern Plains Counties
The Air Pollution Control Division has only monitored for particulates and meteorology in the Eastern Plains Counties. The Eastern Plains Counties do not have the pollution sources that can generate health impacting concentrations of the other criteria pollutants.
The Division has monitored for particulates in the communities along I-76, I-70 and along US Highway 50. The only monitors still in operation are in Prowers County at Lamar and Elbert County at the Wright-Ingraham Institute. The Elbert County monitor is used as a background PM2.5 monitor. The other monitors were discontinued after a review of the data showed that levels of particulates in those communities were well below the standard and were trending even lower.
2
1.2.2 Northern Front Range Counties The Northern Front Range Counties are those along the urbanized I-25 corridor from the
Colorado/Wyoming border to just south of the city of Castle Rock. This area has the majority of the population in the state. It also has the majority of the monitors, with the Denver-metro area being the most heavily monitored. The remaining monitors are located in or near Fort Collins, Greeley, Longmont and Boulder. 1.2.3 Southern Front Range Counties
The Southern Front Range Counties are those along the urbanized I-25 corridor from south of the city of Castle Rock to the southern Colorado border. The cities with monitoring in the area include Colorado Springs, Pueblo, Cripple Creek, Cañon City and Alamosa. Alamosa is included because it shares more in common with the other cities in this group than it does with the mountain counties. Colorado Springs is the only city in the area that is monitored for carbon monoxide and ozone; the other cities are only monitored for particulates. In the past the APCD has conducted particulate monitoring in both Walsenburg and Trinidad. The monitoring in those cities was discontinued after a review of the data showed that levels of particulates were below the standard and declining. 1.2.4 Mountain Counties
The Mountain Counties are those counties along and near the Continental Divide. The communities in this area are usually located in tight mountain valleys where nighttime temperature inversions trap any pollution near the ground. Their primary monitoring concern is with particulate pollution from wood burning and road sanding. These communities range from Steamboat Springs in the north to Pagosa Springs in the south and Breckenridge along the I-70 corridor; Aspen, Crested Butte and Mt. Crested Butte in the central mountains. 1.2.5 Western Counties
The Western Counties generally contain smaller towns located in fairly broad river valleys. Grand Junction is the only large city in the area and the only location that monitors for carbon monoxide on the western slope. The other Western Slope monitors are located in the cities of Parachute, Rifle, Silt, Glenwood Springs, Delta, Durango and Telluride. These locations monitor only for particulates.
3
Figure 1 Monitoring Areas in Colorado
The pin symbols on the map show the approximate location of the monitors in Colorado.
4
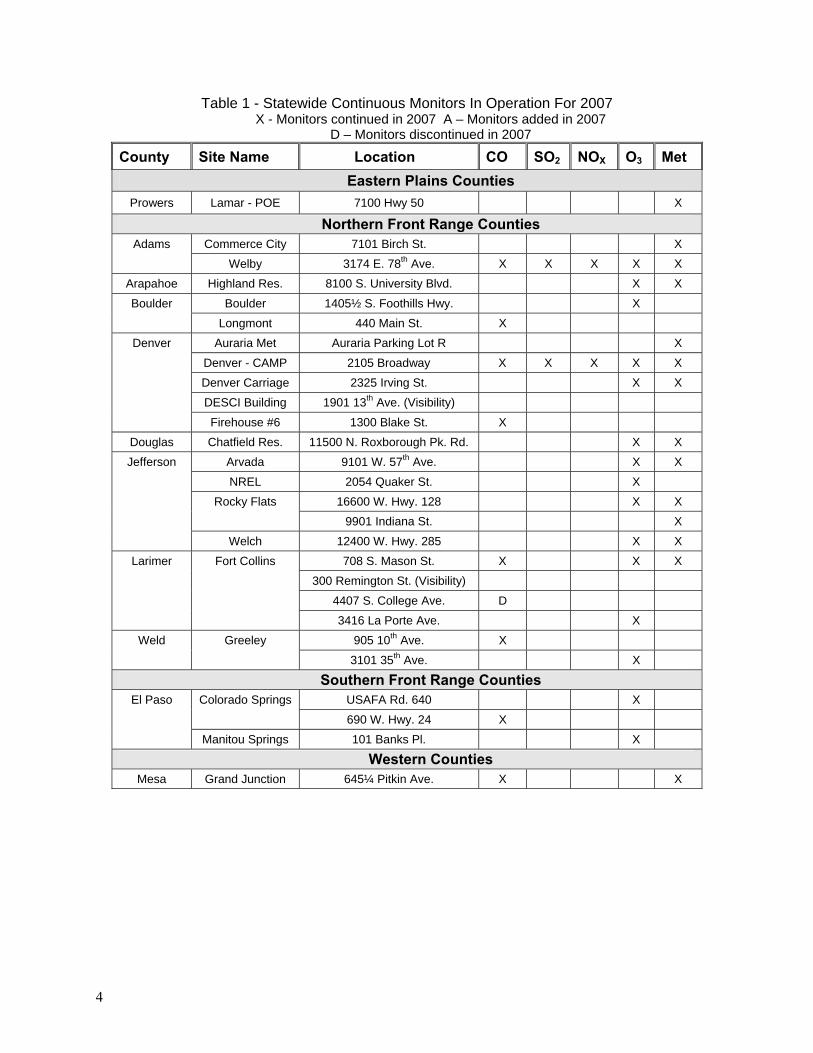
Table 1 - Statewide Continuous Monitors In Operation For 2007 X - Monitors continued in 2007 A – Monitors added in 2007
D – Monitors discontinued in 2007
County Site Name Location CO SO2 NOX O3 Met Eastern Plains Counties
Prowers Lamar - POE 7100 Hwy 50 X
Northern Front Range Counties Adams Commerce City 7101 Birch St. X
Welby 3174 E. 78th Ave. X X X X X Arapahoe Highland Res. 8100 S. University Blvd. X X Boulder Boulder 1405½ S. Foothills Hwy. X
Longmont 440 Main St. X Denver Auraria Met Auraria Parking Lot R X
Denver - CAMP 2105 Broadway X X X X X Denver Carriage 2325 Irving St. X X DESCI Building 1901 13th Ave. (Visibility) Firehouse #6 1300 Blake St. X
Douglas Chatfield Res. 11500 N. Roxborough Pk. Rd. X X Jefferson Arvada 9101 W. 57th Ave. X X
NREL 2054 Quaker St. X Rocky Flats 16600 W. Hwy. 128 X X 9901 Indiana St. X Welch 12400 W. Hwy. 285 X X
Larimer Fort Collins 708 S. Mason St. X X X 300 Remington St. (Visibility) 4407 S. College Ave. D 3416 La Porte Ave. X
Weld Greeley 905 10th Ave. X 3101 35th Ave. X
Southern Front Range Counties El Paso Colorado Springs USAFA Rd. 640 X
690 W. Hwy. 24 X Manitou Springs 101 Banks Pl. X
Western Counties Mesa Grand Junction 645¼ Pitkin Ave. X X
5
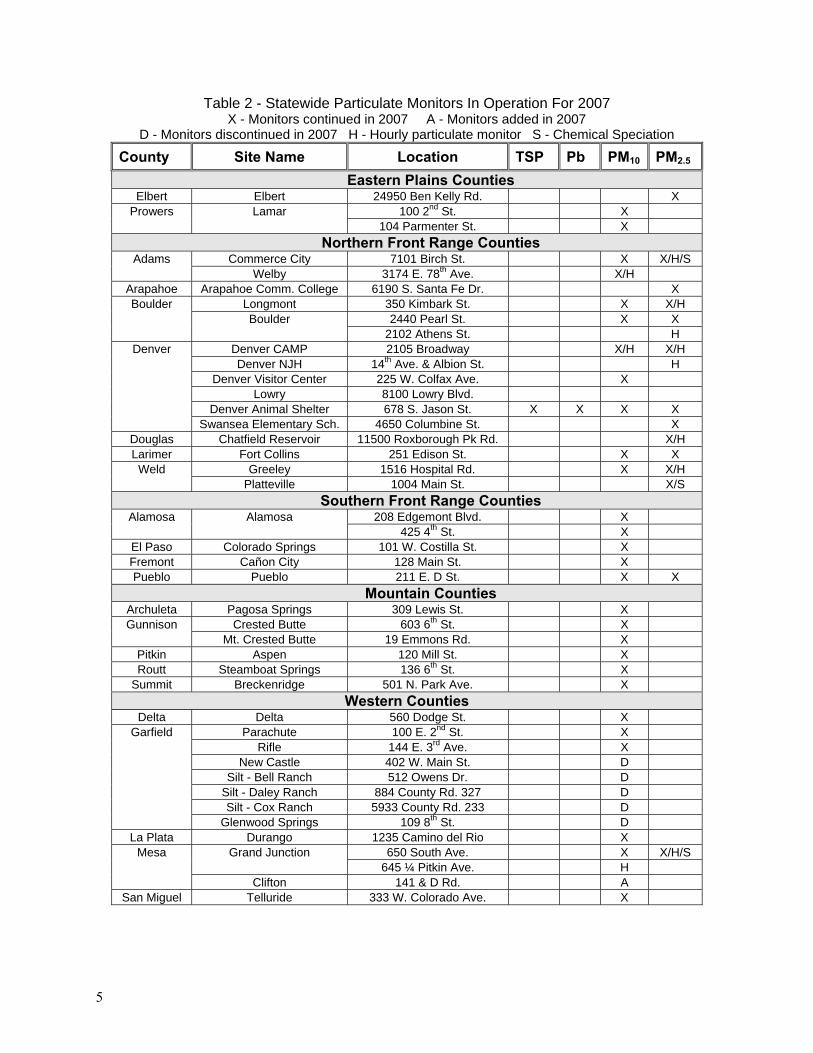
Table 2 - Statewide Particulate Monitors In Operation For 2007 X - Monitors continued in 2007 A - Monitors added in 2007
D - Monitors discontinued in 2007 H - Hourly particulate monitor S - Chemical Speciation County Site Name Location TSP Pb PM10 PM2.5
Eastern Plains Counties Elbert Elbert 24950 Ben Kelly Rd. X
Prowers Lamar 100 2nd St. X 104 Parmenter St. X
Northern Front Range Counties Adams Commerce City 7101 Birch St. X X/H/S
Welby 3174 E. 78th Ave. X/H Arapahoe Arapahoe Comm. College 6190 S. Santa Fe Dr. X Boulder Longmont 350 Kimbark St. X X/H
Boulder 2440 Pearl St. X X 2102 Athens St. H
Denver Denver CAMP 2105 Broadway X/H X/H Denver NJH 14th Ave. & Albion St. H Denver Visitor Center 225 W. Colfax Ave. X Lowry 8100 Lowry Blvd. Denver Animal Shelter 678 S. Jason St. X X X X Swansea Elementary Sch. 4650 Columbine St. X
Douglas Chatfield Reservoir 11500 Roxborough Pk Rd. X/H Larimer Fort Collins 251 Edison St. X X Weld Greeley 1516 Hospital Rd. X X/H
Platteville 1004 Main St. X/S Southern Front Range Counties
Alamosa Alamosa 208 Edgemont Blvd. X 425 4th St. X
El Paso Colorado Springs 101 W. Costilla St. X Fremont Cañon City 128 Main St. X Pueblo Pueblo 211 E. D St. X X
Mountain Counties Archuleta Pagosa Springs 309 Lewis St. X Gunnison Crested Butte 603 6th St. X
Mt. Crested Butte 19 Emmons Rd. X Pitkin Aspen 120 Mill St. X Routt Steamboat Springs 136 6th St. X
Summit Breckenridge 501 N. Park Ave. X Western Counties
Delta Delta 560 Dodge St. X Garfield Parachute 100 E. 2nd St. X
Rifle 144 E. 3rd Ave. X New Castle 402 W. Main St. D Silt - Bell Ranch 512 Owens Dr. D Silt - Daley Ranch 884 County Rd. 327 D Silt - Cox Ranch 5933 County Rd. 233 D Glenwood Springs 109 8th St. D
La Plata Durango 1235 Camino del Rio X Mesa Grand Junction 650 South Ave. X X/H/S
645 ¼ Pitkin Ave. H Clifton 141 & D Rd. A
San Miguel Telluride 333 W. Colorado Ave. X
6
2.0 Criteria Pollutants The criteria pollutants are those for which the federal government has established ambient air
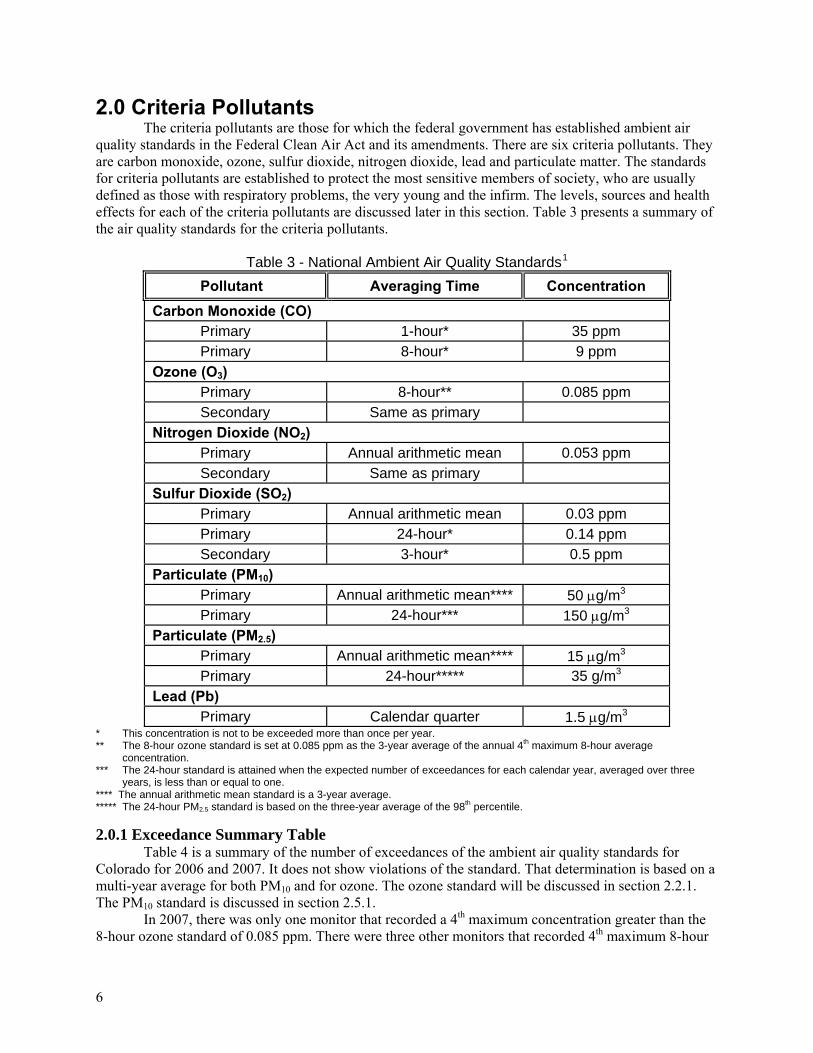
quality standards in the Federal Clean Air Act and its amendments. There are six criteria pollutants. They are carbon monoxide, ozone, sulfur dioxide, nitrogen dioxide, lead and particulate matter. The standards for criteria pollutants are established to protect the most sensitive members of society, who are usually defined as those with respiratory problems, the very young and the infirm. The levels, sources and health effects for each of the criteria pollutants are discussed later in this section. Table 3 presents a summary of the air quality standards for the criteria pollutants.
Table 3 - National Ambient Air Quality Standards1 Pollutant Averaging Time Concentration
Carbon Monoxide (CO) Primary 1-hour* 35 ppm Primary 8-hour* 9 ppm
Ozone (O3) Primary 8-hour** 0.085 ppm Secondary Same as primary
Nitrogen Dioxide (NO2) Primary Annual arithmetic mean 0.053 ppm Secondary Same as primary
Sulfur Dioxide (SO2) Primary Annual arithmetic mean 0.03 ppm Primary 24-hour* 0.14 ppm Secondary 3-hour* 0.5 ppm
Particulate (PM10) Primary Annual arithmetic mean**** 50 μg/m3 Primary 24-hour*** 150 μg/m3
Particulate (PM2.5) Primary Annual arithmetic mean**** 15 μg/m3 Primary 24-hour***** 35 g/m3
Lead (Pb) Primary Calendar quarter 1.5 μg/m3
* This concentration is not to be exceeded more than once per year. ** The 8-hour ozone standard is set at 0.085 ppm as the 3-year average of the annual 4th maximum 8-hour average
concentration. *** The 24-hour standard is attained when the expected number of exceedances for each calendar year, averaged over three
years, is less than or equal to one. **** The annual arithmetic mean standard is a 3-year average. ***** The 24-hour PM2.5 standard is based on the three-year average of the 98th percentile.
2.0.1 Exceedance Summary Table
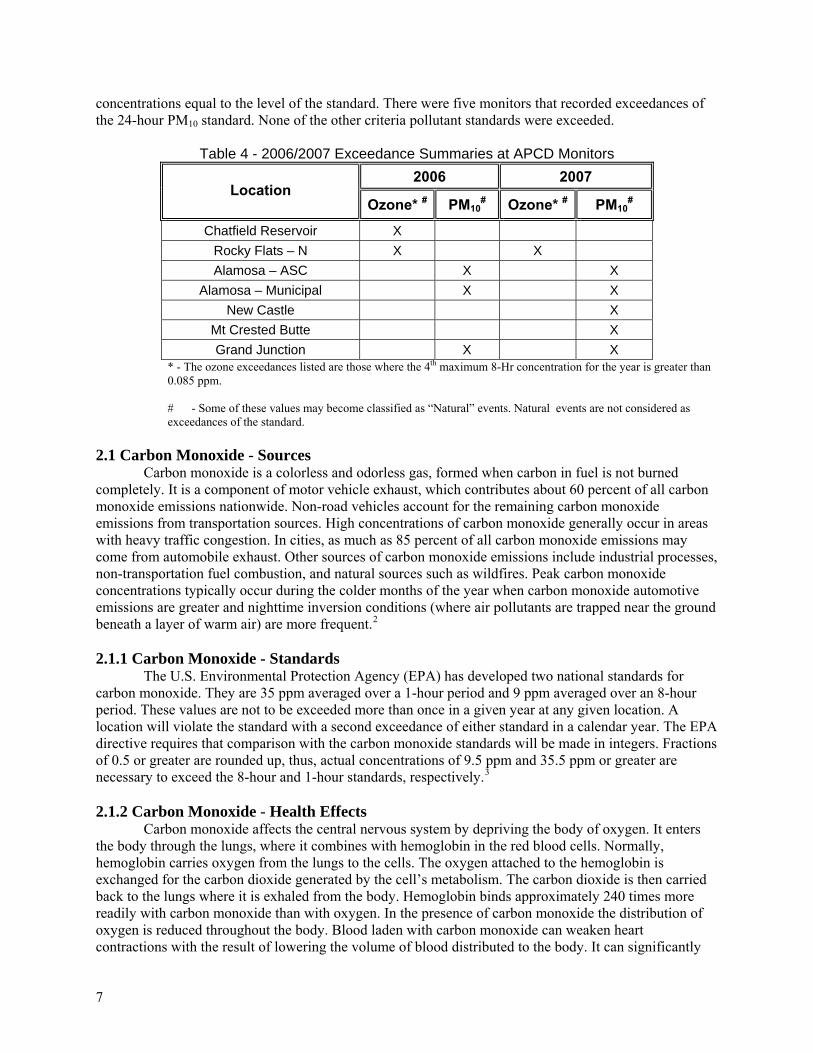
Table 4 is a summary of the number of exceedances of the ambient air quality standards for Colorado for 2006 and 2007. It does not show violations of the standard. That determination is based on a multi-year average for both PM10 and for ozone. The ozone standard will be discussed in section 2.2.1. The PM10 standard is discussed in section 2.5.1.
In 2007, there was only one monitor that recorded a 4th maximum concentration greater than the 8-hour ozone standard of 0.085 ppm. There were three other monitors that recorded 4th maximum 8-hour
7
concentrations equal to the level of the standard. There were five monitors that recorded exceedances of the 24-hour PM10 standard. None of the other criteria pollutant standards were exceeded.
Table 4 - 2006/2007 Exceedance Summaries at APCD Monitors
2006 2007 Location
Ozone* # PM10# Ozone* # PM10
#
Chatfield Reservoir X Rocky Flats – N X X Alamosa – ASC X X
Alamosa – Municipal X X New Castle X
Mt Crested Butte X Grand Junction X X
* - The ozone exceedances listed are those where the 4th maximum 8-Hr concentration for the year is greater than 0.085 ppm. # - Some of these values may become classified as “Natural” events. Natural events are not considered as exceedances of the standard.
2.1 Carbon Monoxide - Sources
Carbon monoxide is a colorless and odorless gas, formed when carbon in fuel is not burned completely. It is a component of motor vehicle exhaust, which contributes about 60 percent of all carbon monoxide emissions nationwide. Non-road vehicles account for the remaining carbon monoxide emissions from transportation sources. High concentrations of carbon monoxide generally occur in areas with heavy traffic congestion. In cities, as much as 85 percent of all carbon monoxide emissions may come from automobile exhaust. Other sources of carbon monoxide emissions include industrial processes, non-transportation fuel combustion, and natural sources such as wildfires. Peak carbon monoxide concentrations typically occur during the colder months of the year when carbon monoxide automotive emissions are greater and nighttime inversion conditions (where air pollutants are trapped near the ground beneath a layer of warm air) are more frequent.2 2.1.1 Carbon Monoxide - Standards
The U.S. Environmental Protection Agency (EPA) has developed two national standards for carbon monoxide. They are 35 ppm averaged over a 1-hour period and 9 ppm averaged over an 8-hour period. These values are not to be exceeded more than once in a given year at any given location. A location will violate the standard with a second exceedance of either standard in a calendar year. The EPA directive requires that comparison with the carbon monoxide standards will be made in integers. Fractions of 0.5 or greater are rounded up, thus, actual concentrations of 9.5 ppm and 35.5 ppm or greater are necessary to exceed the 8-hour and 1-hour standards, respectively.3 2.1.2 Carbon Monoxide - Health Effects
Carbon monoxide affects the central nervous system by depriving the body of oxygen. It enters the body through the lungs, where it combines with hemoglobin in the red blood cells. Normally, hemoglobin carries oxygen from the lungs to the cells. The oxygen attached to the hemoglobin is exchanged for the carbon dioxide generated by the cell’s metabolism. The carbon dioxide is then carried back to the lungs where it is exhaled from the body. Hemoglobin binds approximately 240 times more readily with carbon monoxide than with oxygen. In the presence of carbon monoxide the distribution of oxygen is reduced throughout the body. Blood laden with carbon monoxide can weaken heart contractions with the result of lowering the volume of blood distributed to the body. It can significantly
8
reduce a healthy person's ability to do manual tasks, such as working, jogging and walking. A life-threatening situation can exist for patients with heart disease when these people are unable to compensate for the oxygen loss by increasing the heart rate.4
The EPA has concluded that the following groups may be particularly sensitive to carbon monoxide exposures: angina patients, individuals with other types of cardiovascular disease, persons with chronic obstructive pulmonary disease, anemic individuals, fetuses and pregnant women. Concern also exists for healthy children because of increased oxygen requirements that result from their higher metabolic rate.5
Carbon monoxide is exhausted from the body at varying rates, depending on physiological and external factors. The general guideline is that 20 to 40 percent is lost from the system after 2 to 3 hours following exposure.6 The severity of health effects depends on both the concentration and the length of exposure because it takes time to remove it from the blood stream. 2.1.3 Carbon Monoxide - Emissions
In Denver, the APCD estimates that 86 percent of the carbon monoxide emissions are from automotive sources. An estimated 3 percent of Denver's carbon monoxide emissions are from woodburning stoves and fireplaces. The remainder originates from aircraft, locomotives, construction equipment, power plants and space heating. These numbers are similar to the nationwide emissions.7
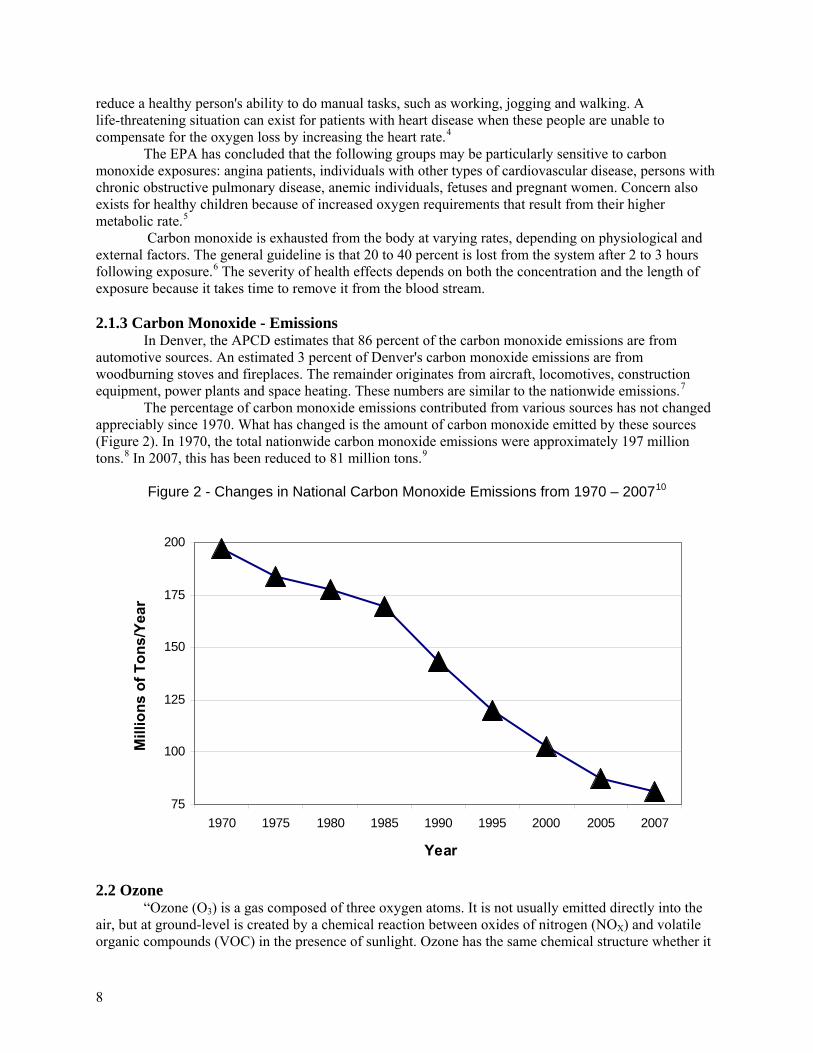
The percentage of carbon monoxide emissions contributed from various sources has not changed appreciably since 1970. What has changed is the amount of carbon monoxide emitted by these sources (Figure 2). In 1970, the total nationwide carbon monoxide emissions were approximately 197 million tons.8 In 2007, this has been reduced to 81 million tons.9
Figure 2 - Changes in National Carbon Monoxide Emissions from 1970 – 200710
2.2 Ozone “Ozone (O3) is a gas composed of three oxygen atoms. It is not usually emitted directly into the
air, but at ground-level is created by a chemical reaction between oxides of nitrogen (NOX) and volatile organic compounds (VOC) in the presence of sunlight. Ozone has the same chemical structure whether it
75
100
125
150
175
200
1970 1975 1980 1985 1990 1995 2000 2005 2007
Year
Mill
ions
of T
ons/
Year
9
occurs miles above the earth or at ground-level and can be "good" or "bad," depending on its location in the atmosphere.
In the earth's lower atmosphere, ground-level ozone is considered "bad." Motor vehicle exhaust and industrial emissions, gasoline vapors, and chemical solvents as well as natural sources emit NOX and VOC that help form ozone. Ground-level ozone is the primary constituent of smog. Sunlight and hot weather cause ground-level ozone to form in harmful concentrations in the air. As a result, it is known as a summertime air pollutant. Many urban areas tend to have high levels of "bad" ozone, but even rural areas are also subject to increased ozone levels because wind carries ozone and pollutants that form it hundreds of miles away from their original sources.
At ground level, ozone is a significant health risk, espically for children with asthma. It also damages crops, trees and other vegetation. It is a main ingredient of urban smog.
The stratosphere or "good" ozone layer extends upward from about 6 to 30 miles and protects life on Earth from the sun's harmful ultraviolet (UV) rays. This natural shield has been gradually depleted by man-made chemicals like chlorofluorocarbons (CFCs). A depleted ozone shield allows more UV from the sun to reach the ground, leading to more cases of skin cancer, cataracts, and other health problems.”11
2.2.1 Ozone - Standards
The level of the ozone standard, until May 2008, was 0.08 ppm as an 8-hour average concentration. This means that the effective level of the ozone standard in 2007 was 0.085 ppminorder to round up from 0.08 ppm to 0.09 ppm. The standard states that the 3-year average of the 4th maximum values of the 8-hour average should not exceed the 0.085 ppm level. The medical and scientific communities did not feel that this level provided adaquate protection for the young, elderly and people with respiratory illinessess. They petition the E.P.A. to review the standard and lower it to a point where it would provide appropriate health protection for all groups.
In May 2008 the EPA responded to these requests and established a new level for the ozone standard. The new level was set at 0.075 ppm, again as the 3-year average of the 4th maximum 8-hour average values. This new level was not as low as the health and welfare communities requested. They wanted the new level set between 0.060 and 0.065 ppm. But it was lower than the regulated communities, like power plants and oil refining wanted. As the result of this change in the standard more areas in Colorado and a great many more areas in the United States, will be in nonattainment status when the standard becomes fully implemented.
Since this report reflects conditions in 2007, all graphs and tables reflect the 0.085 level of the standard. The 0.075 level of the standard will be reflected in the data for the 2008 data report.
2.2.2 Ozone - Health Effects
Exposure to ozone has been linked to a number of health effects, including significant decreases in lung function, inflammation of the airways, and increased respiratory symptoms, such as cough and pain when taking a deep breath. Exposure can also aggravate lung diseases such as asthma, leading to increased medication use, increased hospital admissions and emergency room visits. Active children are the group at highest risk from ozone exposure because they often spend a large part of the summer playing outdoors. Children are also more likely to have asthma, which may be aggravated by ozone exposure. Other at-risk groups include adults who are active outdoors (e.g. some outdoor workers) and individuals with lung diseases such as asthma and chronic obstructive pulmonary disease. In addition, long-term exposure to moderate levels of ozone may cause permanent changes in lung structure, leading to premature aging of the lungs and worsening of chronic lung disease. Ozone also affects vegetation and ecosystems, leading to reductions in agricultural crop and commercial forest yields, reduced growth and survivability of tree seedlings, and increased plant susceptibility to disease, pests, and other environmental stresses (e.g. harsh weather).12
The on going review of the ozone standard (by the EPA and others) also highlighted concerns with ozone effects on vegetation for which the 1-hour ozone standard did not provide adequate protection. These effects can include reduction in agricultural and commercial forest yields, reduced growth and
10
decreased survivability of tree seedlings, increased tree and plant susceptibility to disease, pests and other environmental stresses and potential long-term effects on forests and ecosystems. In long-lived species, these effects may become evident only after several years or even decades and may result in long-term effects on forest ecosystems. Ground level ozone injury to trees and plants can lead to a decrease in the natural beauty of our national parks and recreation areas.13
2.2.3 Ozone - Sources
Ozone is not emitted directly from a source, as are other pollutants, but forms as a secondary pollutant. Its precursors are certain reactive hydrocarbons and nitrogen oxides, which react chemically in sunlight to form ozone. The main sources for these reactive hydrocarbons are automobile exhaust, gasoline, oil storage and transfer facilities, industrial paint solvents, degreasing agents, cleaning fluids and ink solvents. High temperature combustion combines nitrogen and oxygen in the air to form oxides of nitrogen. Vegetation can also emit reactive hydrocarbons such as terpenes from pine trees, for example.14
Although some ozone is produced all year, the highest concentrations usually occur in the summer. The stagnant air and intense sunlight on hot, bright summer days provide the conditions for the precursor chemicals to react and form ozone. The ozone produced under these stagnant summer conditions remains as a coherent air mass and can be transported many miles from its point of origin. 2.3 Sulfur Dioxide
Sulfur dioxide is a colorless gas with a pungent odor. It is detectable by smell at concentrations of about 0.5 to 0.8 ppm. It is highly soluble in water. In the atmosphere, sulfur oxides and nitric oxides are converted to “acid rain.”15 2.3.1 Sulfur Dioxide - Standards
There are two primary standards for sulfur dioxide. The first is a long-term, one-year arithmetic average not to exceed 0.03 ppm. The second is a short-term, 24-hour average where concentrations are not to exceed 0.14 ppm more than once per year. The secondary standard is a 3-hour average not to exceed 0.5 ppm more than once per year.16 2.3.2 Sulfur Dioxide - Health Effects
High concentrations of sulfur dioxide can result in temporary breathing impairment for asthmatic children and adults who are active outdoors. Short-term exposures of asthmatic individuals to elevated sulfur dioxide levels during moderate activity may result in breathing difficulties that can be accompanied by symptoms such as wheezing, chest tightness, or shortness of breath. Other effects that have been associated with longer-term exposures to high concentrations of sulfur dioxide, in conjunction with high levels of particulate matter, include aggravation of existing cardiovascular disease, respiratory illness, and alterations in the lungs’ defenses. The subgroups of the population that may be affected under these conditions include individuals with heart or lung disease, as well as the elderly and children.17
Together, sulfur dioxide and oxides of nitrogen are the major precursors to acidic deposition (acid rain), which is associated with the acidification of soils, lakes, and streams and accelerated corrosion of buildings and monuments. Sulfur dioxide also is a major precursor to PM2.5, which is a significant health concern, and a main contributor to poor visibility.18 2.3.3 Sulfur Dioxide - Sources
Nationwide, over 65 percent of sulfur dioxide released to the air, or more than 8 million tons per year, comes from electric utilities, especially those that burn coal. Other sources of sulfur dioxide are industrial facilities that derive their products from raw materials like metallic ore, coal, and crude oil, or that burn coal or oil to produce process heat. Examples are petroleum refineries, cement manufacturing, and metal processing facilities. Also, locomotives, large ships, and some nonroad diesel equipment currently burn high sulfur fuel and release sulfur dioxide emissions to the air in large quantities.19
11
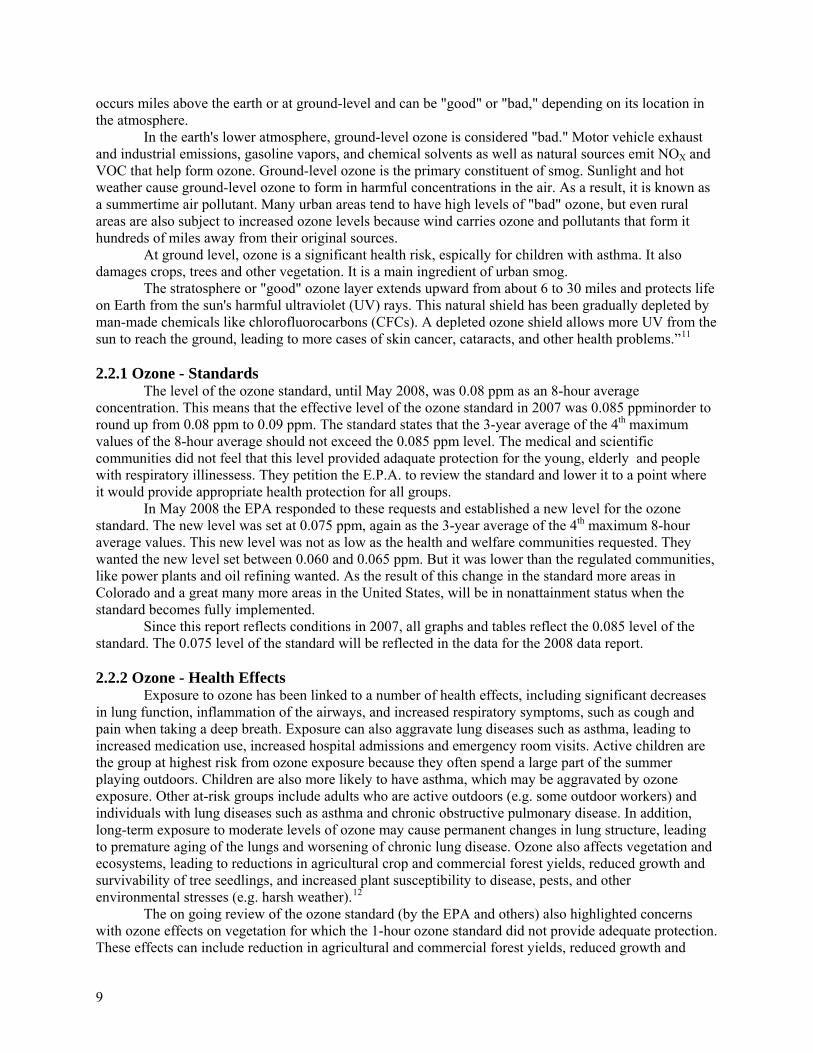
Figure #3 shows the decline in sulfur dioxide emissions from 32 million tons per year in 1970 to 13 tons per year in 2007.
Figure 3 - Changes in National Sulfur Dioxide Emissions from 1970 – 200720
2.4 Nitrogen Dioxide In its pure state, nitrogen dioxide is a reddish-brown gas with a characteristic pungent odor. It is
corrosive and a strong oxidizing agent. As a pollutant in ambient air, however, it is virtually colorless and odorless. Nitrogen dioxide can be an irritant to the eyes and throat. Oxides of nitrogen (nitric oxide and nitrogen dioxide) are formed when the nitrogen and oxygen in the air are combined in high temperature combustion. 2.4.1 Nitrogen Dioxide - Standards
The annual standard for nitrogen dioxide is 0.053 ppm expressed as an annual arithmetic mean (average).21 “Pomona, CA, was the last U.S. city to record an exceedance of the nitrogen dioxide annual standard in 1989.”22 2.4.2 Nitrogen Dioxide - Health Effects
Elevated concentrations of nitrogen dioxide cause respiratory distress, degradation of vegetation, clothing and visibility, and increased acid deposition. Nitrate aerosols, which result from nitric oxide and nitrogen dioxide combining with water vapor in the air, have been consistently linked to Denver's visibility problems. 2.4.3 Nitrogen Dioxide - Sources
About 44 percent of the emissions of nitrogen dioxide in the Denver area come from large combustion sources such as power plants. Almost 33 percent comes from motor vehicles, 15 percent from space heating, 3 percent from aircraft and 5 percent from miscellaneous off-road vehicles. Minor sources include fireplaces and woodstoves and high temperature combustion processes used in industrial work.23
10
15
20
25
30
35
1970 1975 1980 1985 1990 1995 2000 2005 2007
Years
Mill
ion
Tons
/Yea
r
12
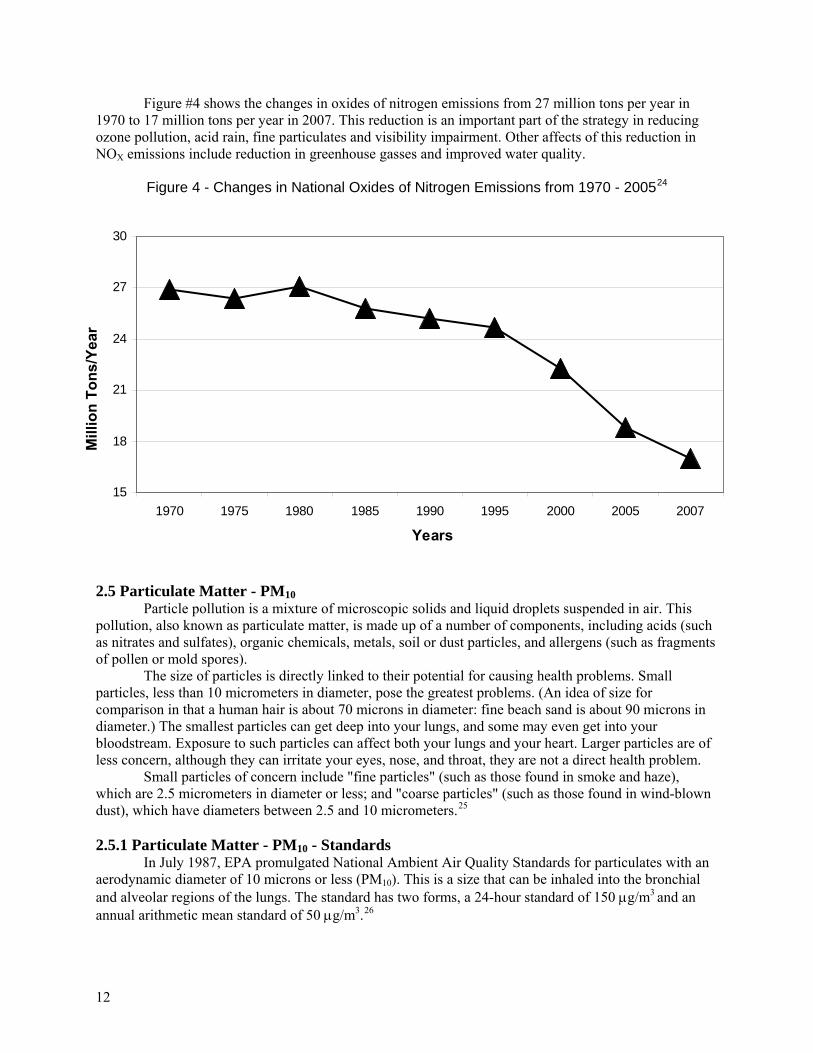
Figure #4 shows the changes in oxides of nitrogen emissions from 27 million tons per year in 1970 to 17 million tons per year in 2007. This reduction is an important part of the strategy in reducing ozone pollution, acid rain, fine particulates and visibility impairment. Other affects of this reduction in NOX emissions include reduction in greenhouse gasses and improved water quality.
Figure 4 - Changes in National Oxides of Nitrogen Emissions from 1970 - 200524
2.5 Particulate Matter - PM10
Particle pollution is a mixture of microscopic solids and liquid droplets suspended in air. This pollution, also known as particulate matter, is made up of a number of components, including acids (such as nitrates and sulfates), organic chemicals, metals, soil or dust particles, and allergens (such as fragments of pollen or mold spores).
The size of particles is directly linked to their potential for causing health problems. Small particles, less than 10 micrometers in diameter, pose the greatest problems. (An idea of size for comparison in that a human hair is about 70 microns in diameter: fine beach sand is about 90 microns in diameter.) The smallest particles can get deep into your lungs, and some may even get into your bloodstream. Exposure to such particles can affect both your lungs and your heart. Larger particles are of less concern, although they can irritate your eyes, nose, and throat, they are not a direct health problem.
Small particles of concern include "fine particles" (such as those found in smoke and haze), which are 2.5 micrometers in diameter or less; and "coarse particles" (such as those found in wind-blown dust), which have diameters between 2.5 and 10 micrometers.25 2.5.1 Particulate Matter - PM10 - Standards
In July 1987, EPA promulgated National Ambient Air Quality Standards for particulates with an aerodynamic diameter of 10 microns or less (PM10). This is a size that can be inhaled into the bronchial and alveolar regions of the lungs. The standard has two forms, a 24-hour standard of 150 μg/m3 and an annual arithmetic mean standard of 50 μg/m3.26
15
18
21
24
27
30
1970 1975 1980 1985 1990 1995 2000 2005 2007
Years
Mill
ion
Tons
/Yea
r
13
1. The 24-hour standard is attained when the expected number of exceedances for each calendar year, averaged over three years, is less than or equal to one. The estimated number of exceedances is computed quarterly using available data and adjusting for missing sample days.
2. The annual arithmetic mean standard is attained when the annual mean, averaged over three years is less than or equal to the level of the standard. Each annual mean is computed from the average of each quarter in the year, with adjustments made for missing sample days.
3. In both cases, a data recovery of 75 percent is needed for each calendar quarter to be considered a valid quarter of data.
2.5.2 Particulate Matter - PM10 - Health Effects
According to American Lung Association’s paper The Perils of Particulates; “The health risk from an inhaled dose of particulate matter depends on the size and concentration
of the particulate. Size determines how deeply the inhaled particulate will penetrate into the respiratory tract where they can persist and cause respiratory damage. Particles less than 10 microns in diameter are easily inhaled deep into the lungs. In this range, larger particles tend to deposit in the tracheobronchial region and smaller ones in the alveolar region. Particulates deposited in the alveolar region can remain in the lungs for long periods because the alveoli have a slow mucociliary clearance system.”27
“Fine particulate pollution does not affect the health of exposed persons with equal severity. Certain subgroups of people potentially exposed to air pollutants can be identified as potentially ‘at risk’ from adverse health effects of air borne pollutants. There is very strong evidence that asthmatics are much more sensitive (i.e., respond with symptoms at relatively low concentrations) to the effects of particulates than the general healthy population.”28
The welfare effects of particulate exposure may be the most widespread of all the pollutants. Because of the potential for extremely long-range transport of fine particles and chemical reactions that occur, no place on earth has been spared from the particulate pollution generated by urban and rural sources. The effects of particulates range from visibility degradation to climate changes and vegetation damage. General soiling, commonly thought to be just a nuisance, can have long-term adverse effects on building paints and other materials. Acid deposition as particulates can be detected in the most remote areas of the world. 2.5.3 Particulate Matter - PM10 - Sources
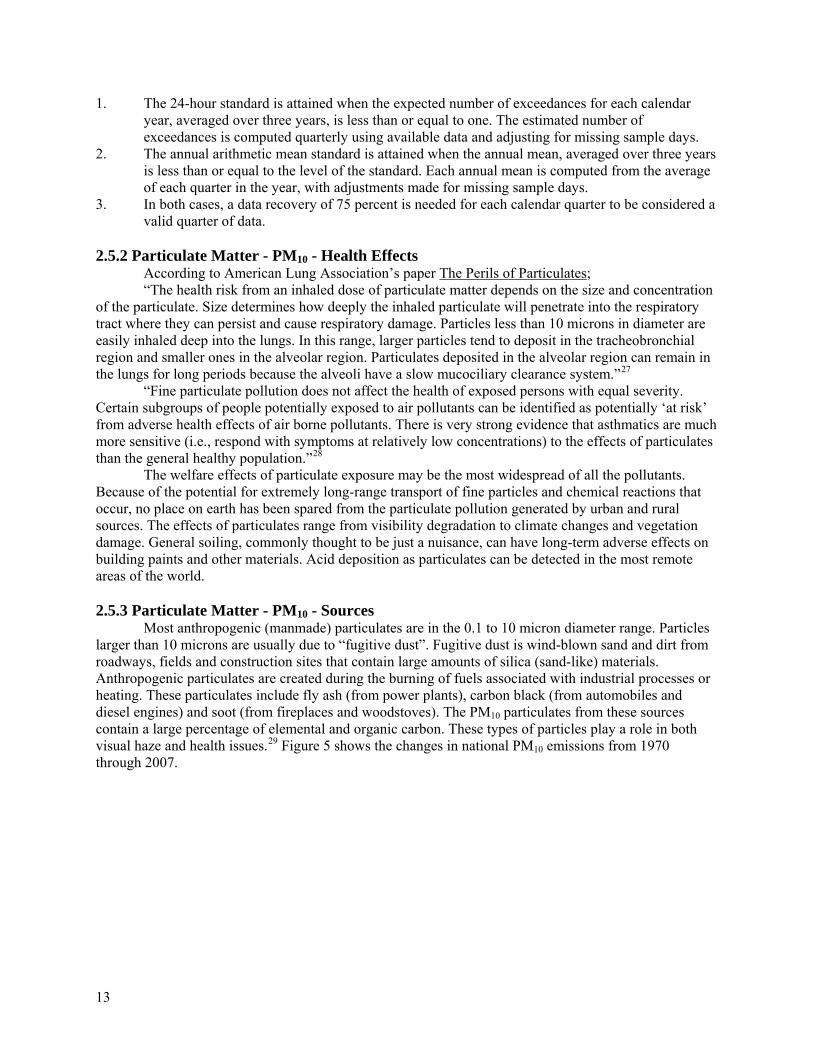
Most anthropogenic (manmade) particulates are in the 0.1 to 10 micron diameter range. Particles larger than 10 microns are usually due to “fugitive dust”. Fugitive dust is wind-blown sand and dirt from roadways, fields and construction sites that contain large amounts of silica (sand-like) materials. Anthropogenic particulates are created during the burning of fuels associated with industrial processes or heating. These particulates include fly ash (from power plants), carbon black (from automobiles and diesel engines) and soot (from fireplaces and woodstoves). The PM10 particulates from these sources contain a large percentage of elemental and organic carbon. These types of particles play a role in both visual haze and health issues.29 Figure 5 shows the changes in national PM10 emissions from 1970 through 2007.
14
Figure 5 - Changes in National PM10 Emissions from 1970 - 200730
2.6 Particulate Matter - PM2.5 “Particle pollution is a mixture of microscopic solids and liquid droplets suspended in air. This
pollution, also known as particulate matter, is made up of a number of components, including acids (such as nitrates and sulfates), organic chemicals, metals, soil or dust particles, and allergens (such as fragments of pollen or mold spores).
Fine particle pollution or PM2.5 describes particulate matter that is 2.5 micrometers in diameter and smaller - 1/30th the diameter of a human hair.
Fine particle pollution can be emitted directly or formed secondarily in the atmosphere. Examples Sulfates are a type of secondary particle formed from sulfur dioxide emissions from power plants and industrial facilities. Nitrates, another a type of fine particle, are formed from emissions of nitrogen oxides from power plants, automobiles, and other combustion sources.
The chemical composition of particles depends on location, time of year, and weather.”31 2.6.1 Particulate Matter - PM2.5 - Standards
In 1997, the EPA added new fine particle standards, PM2.5, to the existing PM10 standards. EPA added an annual PM2.5 standard set at a concentration of 15 micrograms per cubic meter (μg/m3) and a 24-hour PM2.5 standard set at 65 μg/m3. The annual component of the standard was set to provide protection against typical day-to-day exposures as well as longer-term exposures, while the daily component protects against more extreme short-term events.
Areas will be considered in compliance with the annual PM2.5 standard when the 3-year average of the annual arithmetic mean PM2.5 concentrations, from single or multiple community-oriented monitors, is less than or equal to 15 μg/m3. The 24-hour PM2.5 standard is based on the 98th percentile of 24-hour PM2.5 concentrations in a year (averaged over 3 years). The change to a percentile based standard from a second maximum based standard was designed to eliminate the effect of anomalously high concentrations. In addition, this change is an attempt to focus more on the true health effects of the pollutant. The 24-hour standard was lowered by EPA on September 20, 2006 to 35 μg/m3. This new standard became effective on December 17, 2006.
2.0
4.0
6.0
8.0
10.0
12.0
14.0
1970 1975 1980 1985 1990 1995 2000 2005 2007
Years
Mill
ion
Tons
/Yea
r
15
2.6.2 Particulate Matter - PM2.5 - Health Effects “Health studies have shown a significant association between exposure to fine particles and
premature death from heart or lung disease. Fine particles can aggravate heart and lung diseases and have been linked to effects such as: cardiovascular symptoms; cardiac arrhythmias; heart attacks; respiratory symptoms; asthma attacks; and bronchitis. These effects can result in increased hospital admissions, emergency room visits, absences from school or work, and restricted activity days. Individuals that may be particularly sensitive to fine particle exposure include people with heart or lung disease, older adults, and children.”32 2.6.3 Particulate Matter - PM2.5 - Sources
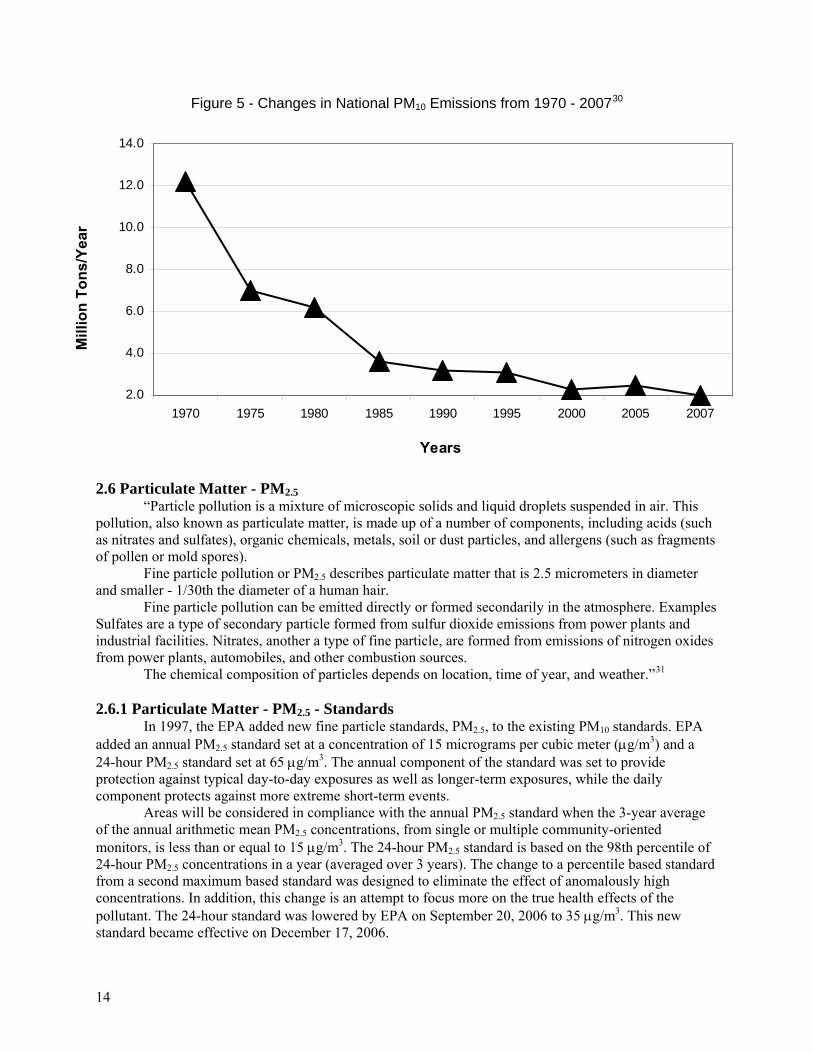
Figure 6 shows the nationwide changes in emissions of PM2.5 particulates from 1990 through 2007.
The primary source of fine particles emitted directly into the air is carbonaceous material from combustion. Secondary particles are another large source of “fine” particulates. Secondary particles are those that are created in the atmosphere by chemical reactions of gaseous pollutants and water vapor to form a semi-solid particle.33
Particles less than 2.5 microns in diameter, or PM2.5, are the major contributors to visibility problems because of their ability to scatter or absorb light. In Denver, the effects of this particulate pollution can be seen as the “Brown Cloud” or more appropriately, the “Denver Haze” because it is frequently neither brown nor an actual cloud.
Figure 6 - Changes in National PM2.5 Emissions from 1990 - 200734
2.7 Lead Lead is a metal found naturally in the environment as well as in manufactured products. The
major sources of lead emissions have historically been motor vehicles (such as cars and trucks) and industrial sources. Due to the phase out of leaded gasoline, metals processing is the major source of lead emissions to the air today. The highest levels of lead in air are generally found near lead smelters. Other stationary sources are waste incinerators, utilities, and lead-acid battery manufacturers.35
0.00
0.50
1.00
1.50
2.00
2.50
1990 1995 2000 2005 2007
Years
Mill
ion
Tons
/Yea
r
16
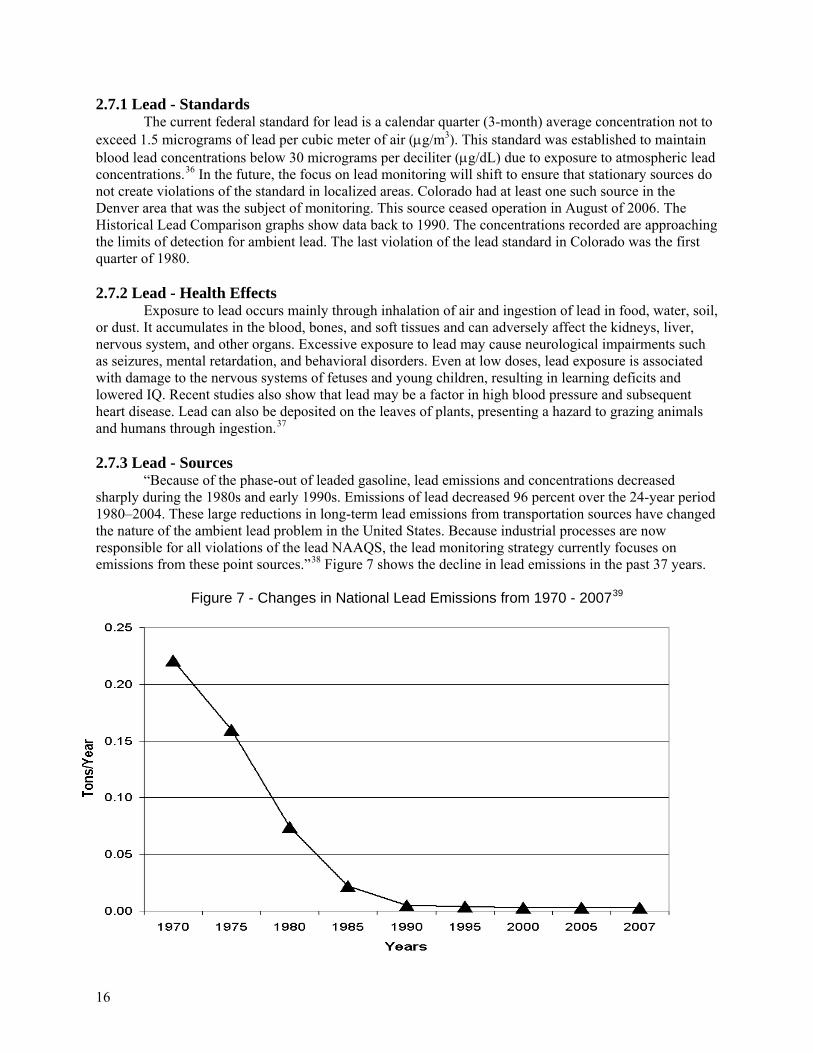
2.7.1 Lead - Standards The current federal standard for lead is a calendar quarter (3-month) average concentration not to
exceed 1.5 micrograms of lead per cubic meter of air (μg/m3). This standard was established to maintain blood lead concentrations below 30 micrograms per deciliter (μg/dL) due to exposure to atmospheric lead concentrations.36 In the future, the focus on lead monitoring will shift to ensure that stationary sources do not create violations of the standard in localized areas. Colorado had at least one such source in the Denver area that was the subject of monitoring. This source ceased operation in August of 2006. The Historical Lead Comparison graphs show data back to 1990. The concentrations recorded are approaching the limits of detection for ambient lead. The last violation of the lead standard in Colorado was the first quarter of 1980. 2.7.2 Lead - Health Effects
Exposure to lead occurs mainly through inhalation of air and ingestion of lead in food, water, soil, or dust. It accumulates in the blood, bones, and soft tissues and can adversely affect the kidneys, liver, nervous system, and other organs. Excessive exposure to lead may cause neurological impairments such as seizures, mental retardation, and behavioral disorders. Even at low doses, lead exposure is associated with damage to the nervous systems of fetuses and young children, resulting in learning deficits and lowered IQ. Recent studies also show that lead may be a factor in high blood pressure and subsequent heart disease. Lead can also be deposited on the leaves of plants, presenting a hazard to grazing animals and humans through ingestion.37 2.7.3 Lead - Sources
“Because of the phase-out of leaded gasoline, lead emissions and concentrations decreased sharply during the 1980s and early 1990s. Emissions of lead decreased 96 percent over the 24-year period 1980–2004. These large reductions in long-term lead emissions from transportation sources have changed the nature of the ambient lead problem in the United States. Because industrial processes are now responsible for all violations of the lead NAAQS, the lead monitoring strategy currently focuses on emissions from these point sources.”38 Figure 7 shows the decline in lead emissions in the past 37 years.
Figure 7 - Changes in National Lead Emissions from 1970 - 200739
17
3.0 Non-Criteria Pollutants Non-criteria pollutants are those pollutants for which there are no current national ambient air
quality standards. These include but are not limited to pollutants that impair visibility, total suspended particulates, nitric oxide and air toxics. Meteorological measurements of wind speed, wind direction, temperature and humidity are also included in this group. 3.1 Visibility
Visibility is unique among air pollution effects in that it involves human perception and judgment. It has been described as the maximum distance that an object can be perceived against the background sky. Visibility also refers to the clarity with which the form and texture of distant, middle and near details can be seen as well as the sense of the trueness of their apparent coloration. As a result, measures of visibility serve as surrogates of human perception. There are several ways to measure visibility but none of them tell the whole story or completely measure visibility as human beings experience it. 3.1.1 Visibility - Standards
The Colorado Air Quality Control Commission established a visibility standard in 1990 for the Front Range cities from Fort Collins to Colorado Springs. The standard, an atmospheric extinction of 0.076 per kilometer, was based on the public's definition of unacceptable amounts of haze as judged from slides of different haze levels taken in the Denver area. At the standard, 7.6 percent of the light in a kilometer of air is blocked. The standard applies from 8 A.M. to 4 P.M. each day, during those hours when the relative humidity is less than 70 percent. Visibility, along with meteorology and concentrations of other pollutants for which National Ambient Air Quality Standards exist, is used to determine the need for mandatory woodburning and voluntary driving restrictions.
There is no quantitative visibility standard for Colorado's pristine and scenic rural areas. However, in the 1977 amendments to the Federal Clean Air Act, Congress added Section 169a40 and established a national visibility goal that created a qualitative standard of “the prevention of any future and the remedying of any existing, impairment of visibility in mandatory Class I federal areas which impairment results from manmade air pollution.” The implementation of Section 169a has led to federal requirements to protect visual air quality in large national parks and wilderness areas.41 Colorado has 12 of these Class I areas. Federal and state law prohibits visibility impairment in national parks and wildernesses from large stationary sources of air pollution. 3.1.2 Visibility - Health Effects
Visual air quality is an element of public welfare. Specifically, it is an important aesthetic, natural and economic resource of the state of Colorado. The worth of visibility is difficult to measure; yet good visibility is something that people undeniably value. Impaired visibility can affect the enjoyment of a recreational visit to a scenic mountain area. Similarly, people prefer to have clear views from their homes and offices. These concerns are often reflected in residential property values and office rents. Any loss in visual air quality may contribute to corresponding losses in tourism and usually make an area less attractive to residents, potential newcomers and industry.
There is increasing information that shows a correlation between ambient concentrations of particulate matter and respiratory illnesses. Some researchers believe this link may be strongest with concentrations of fine particles, which also contribute to visibility impairment. In July 1997, the EPA developed a National Ambient Air Quality Standard for particulate matter less than 2.5 microns in diameter (PM2.5). See the section 2.6 for more information on PM2.5. Any control strategies to lower ambient concentrations of fine particulate matter for health reasons will also improve visibility.
18
3.1.3 Visibility - Sources The cause of visibility impairment in Colorado is most often fine particles in the 0.1 to 2.5
micrometer size range (one micrometer is a millionth of a meter). Fine beach sand is approximately 90 micrometers in diameter; human hair is approximately 70 micrometers in diameter. Light passing from a vista to an observer is either scattered away from the sight path or absorbed by the atmospheric fine particulate. Sunlight entering the pollution cloud may be scattered into the sight path adding brightness to the view and making it difficult to see elements of the vista. Sulfate, nitrate, elemental carbon and organic carbon are the types of particulate matter most effective at scattering and/or absorbing light. The man-made sources of these particulates include woodburning, electric power generation, industrial combustion of coal or oil, and emissions from cars, trucks and buses.
Visibility conditions vary considerably across the state. Usually, visibility in Colorado is among the best in the country. Our prized western vistas exist due to unique combinations of topography and scenic features. Air in much of the West contains low humidity and minimal levels of visibility-degrading pollution. Nevertheless, visibility problems occur periodically throughout the state. Woodburning haze is a concern in several mountain communities each winter. Denver has its “brown cloud.” Even the national parks, monuments, and wilderness areas shows pollution-related visibility impairment on occasion due to regional haze, the interstate or even regional-scale transport of visibility-degrading pollution.
The visibility problems across the state have raised public concern and spurred research. The goal of Colorado's visibility program is to protect visual air quality where it is presently good and improve visibility where it is degraded. 3.1.4 Visibility - Monitoring
There are several ways to measure visibility. Currently, the Division uses camera systems to provide qualitative visual documentation of a view. Transmissometers and nephelometers are used to measure the atmosphere’s ability to attenuate light quantitatively.
A visibility site was installed in Denver in late 1990 using a long-path transmissometer. Visibility in the downtown area is monitored using a receiver located near Cheesman Park at 1901 E. 13th Avenue and a transmitter located on the roof of the Federal Building at 1929 Stout Street. This instrument directly measures light extinction, which is proportional to the ability of atmospheric particles and gases to attenuate image-forming light as it travels from an object to an observer. The visibility standard is stated in units of atmospheric extinction. Days when the visibility is affected by rain, snow or high relative humidity are termed “excluded” (as shown in Figures 22 and 24) and are not counted as violations of the visibility standard. In September 1993, a transmissometer and nephelometer were purchased by the city of Fort Collins to monitor visibility.
In Colorado, several agencies of the federal government, in cooperation with regional and nationwide state air pollution organizations, also monitor visibility in a number of national parks and wilderness areas “Class I” areas, either individually or jointly through the Inter-agency Monitoring of PROtected Visual Environments (IMPROVE) monitoring program. The goals of the monitoring programs are to establish background visibility levels, identify trends of deterioration or improvement, to identify suspected sources of visibility impairment and to track regional haze. Visibility and the atmospheric constituents that cause visibility degradation are characterized with camera systems, transmissometers and extensive fine-particle chemical composition measurements by the monitoring network. There are currently monitoring sites in Rocky Mountain National Park, Mesa Verde National Park, Weminuche Wilderness, Mount Zirkel Wilderness, Great Sand Dunes National Monument and Maroon Bells/Snowmass Wilderness. These data are not contained in this report, but are available at this web site address: http://vista.cira.colostate.edu/improve/ 3.1.5 Visibility - Denver Camera
The Division operates a web-based camera that can be viewed by clicking on the “Live Image” icon on the right side of the screen at the Air Pollution Control Division - Technical Services Program web site http://www.colorado.gov/airquality. There is a great deal of other information available from this
19
site in addition to the image from the visibility camera. The Front Range Air Quality Forecast, Air Quality Advisory, Monitoring Reports and Open Burning Forecast are also available.
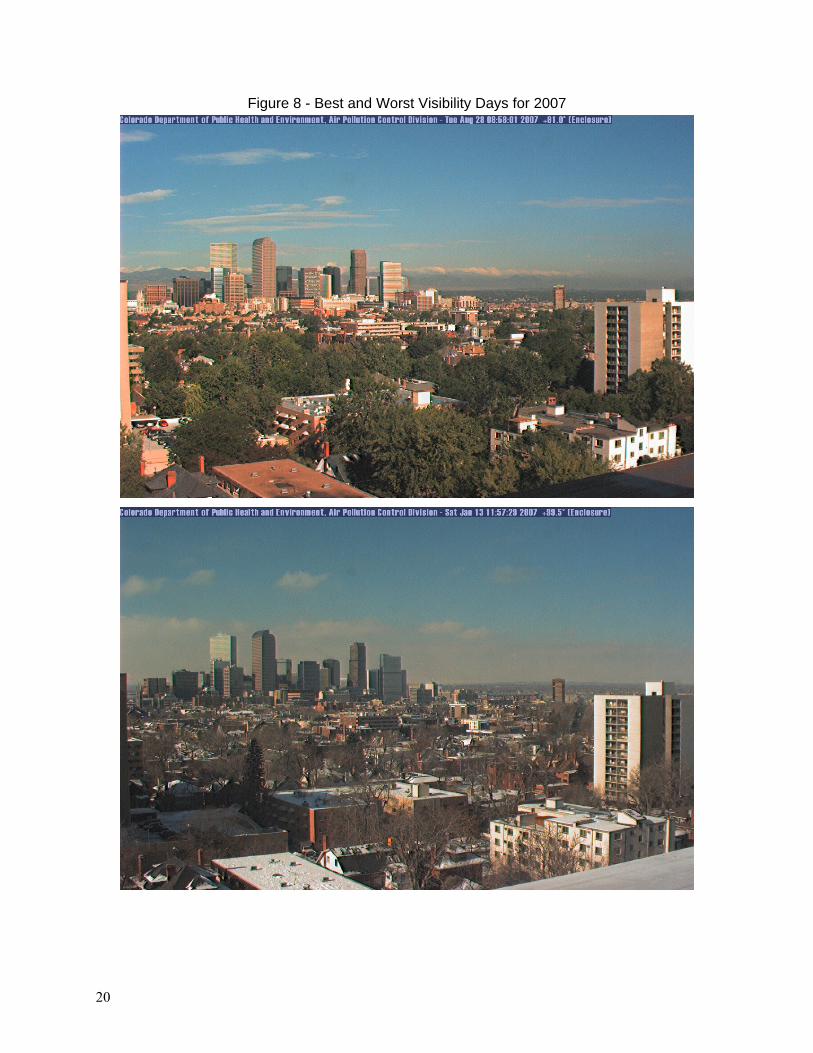
The images in Figure 8 show the visibility on one of the “Best” and “Worst” days in 2007. One of the “Best “visibility day was May 28, 2007. One of the “Worst” visibility day was January 13, 2007.
These two pictures are images made by the web camera at the visibility monitor located at 1901 E. 13th Avenue in Denver. These images are centered on the Federal Building at 1929 Stout Street. The difference in these two pictures is the brightness and detail that can be seen in the image on the top as compared to the image on the bottom. Look specifically at the edges of the downtown buildings and the area on the horizon at the right edge of the picture.
20
Figure 8 - Best and Worst Visibility Days for 2007
21
3.2 Nitric Oxide Nitric oxide is the most abundant of the oxides of nitrogen emitted from combustion sources.
There are no known adverse health effects at normal ambient concentrations. However, nitric oxide as a precursor, is involved in the reaction of nitrogen dioxide, nitric acid, nitrates and ozone, all of which have demonstrated adverse health effects.42 There are no Federal or state standards for nitric oxide. 3.3 Total Suspended Particulates
Total suspended particulates (TSP) were first monitored in Colorado in 1960 at 414 14th Street in Denver. This location monitored particulates until 1988. The Adams City and Gates total suspended particulate monitors began operation in 1964 and the Denver CAMP monitor at 2105 Broadway began operating in 1965. These monitors were operated by either the Federal EPA or the City of Denver until the mid-1970s when daily operation was taken over by the Colorado Department of Public Health and Environment.
Particulate monitoring expanded to more than 70 locations around the state by the early 1980s. The primary standards for total suspended particulates were 260 μg/m3 as a 24-hour average and 75 μg/m3 as an annual geometric mean. On July 1, 1987, with the promulgation of the PM10 standards, the old TSP particulate standards were eliminated. For the past ten years the APCD operated six TSP monitoring sites. These were operated for ambient lead analysis. On January 1, 2007 the lead monitoring was reduced to a single monitor at the Denver Municipal Animal Shelter, located at 678 S. Jason Street. This change in monitors was the result of dramatically reduced ambient lead levels in Colorado and the change in federal lead monitoring requirements. 3.4 Meteorology
The Air Pollution Control Division takes a limited set of meteorological measurements at 14 locations around the state. These measurements include wind speed, wind direction, temperature, standard deviation of horizontal wind direction and some monitoring of relative humidity. Relative humidity measurements are also taken in conjunction with the two visibility monitors. The humidity data are not summarized in this report since they are used primarily to validate the visibility measurements taken at the specific locations. The Division does not collect precipitation measurements. The wind speed, wind direction and temperature measurements are collected primarily for air quality forecasting and air quality modeling. The instruments are on ten-meter towers and the data are stored as hourly averages.
The wind roses displayed in this report are placed on a background map that shows the approximate location of the meteorological site. The wind roses are based on the direction that the wind is blowing from. Another way of visualizing a wind rose is to picture yourself standing in the center of the plot and facing into the wind. The wind direction is broken down in the 16 cardinal directions (i.e. N, NNE, NE, ENE, E, ESE, SE, SSE, S, etc). The wind speed is broken down in six categories. The graphs in this report use 1-3 mph, 4-5 mph, 7-11 mph, 12-14 mph, 15-38 mph and greater than 38 mph. The length of each arm of the wind rose represents the percentage of time the wind was blowing from that direction at that speed. The longer the arm the greater percentage of time the wind is blowing from that direction. A review of the wind rose in Figure 26, for example, shows that in Arvada the majority of the winds come from the west and west-northwest and that these winds are generally in the 1-3 mph and 4-6 mph ranges. 3.5 Air Toxics
Toxic air pollutants, or air toxics, are those pollutants that cause or may cause cancer or other serious health effects, such as reproductive effects or birth defects. Air toxics may also cause adverse environmental and ecological effects. EPA is required to reduce air emissions of 188 air toxics listed in the Clean Air Act. Examples of toxic air pollutants include benzene, found in gasoline; perchloroethylene, emitted from some dry cleaning facilities; and methylene chloride, used as a solvent by a number of industries. Most air toxics originate from man-made sources, including mobile sources (e.g., cars, trucks,
22
construction equipment) and stationary sources (e.g., factories, refineries, power plants), as well as indoor sources (e.g., some building materials and cleaning solvents). Some air toxics are also released from natural sources such as volcanic eruptions and forest fires.43
People exposed to toxic air pollutants at sufficient concentrations may experience various health effects including cancer and damage to the immune system, as well as neurological, reproductive (e.g., reduced fertility), developmental, respiratory and other health problems. In addition to exposure from breathing air toxics, risks also are associated with the deposition of toxic pollutants onto soils or surface waters, where they are taken up by plants and ingested by animals and eventually magnified up through the food chain. Like humans, animals may experience health problems due to air toxics exposure.
The APCD currently monitors for air toxics in Grand Junction as part of EPA’s National Air Toxics Trend Stations. The data from this study will be presented in a separate report. 3.6 PM2.5 Chemical Speciation
Chemical speciation analysis is conducted on some PM2.5 filters. These analyses are conducted for several elements and chemical compounds, which can cause serious health effects, premature deaths, visibility degradation and regional haze. There are two broad categories of PM2.5: primary and secondary particles. Primary PM2.5 particles are those emitted directly to the air from crushed geologic materials to carbonaceous particles from incomplete combustion (see section 2.6.3 for more information on PM2.5 sources). Secondary PM2.5 is formed from gases that combine in the atmosphere through chemical processes and form liquid aerosol droplets. If the PM2.5 pollution needs to be controlled it is important to know the composition of PM2.5 particles so that the appropriate sources can be targeted for control.
Numerous health effects studies have correlated negative health effects to the total mass concentration of PM2.5 in ambient air.44 However, it has not yet been determined if the health correlation is to total mass concentration or to concentrations of specific chemical species in the PM2.5 mix. When the EPA promulgated the NAAQS for PM2.5 in 1997 the compliance (mass) monitoring part of the network was established first. Mass concentrations from the compliance network are used to determine attainment of the NAAQS. EPA soon supplemented the PM2.5 network with chemical speciation monitoring to provide information on the chemical composition of PM2.5. The main purposes are to identify sources, develop implementation plans to reduce PM2.5 pollution and support health effects research.
Colorado began chemical speciation monitoring at the Commerce City site in February 2001 at the state’s only speciation trend network site. Four other chemical speciation sites were established in 2001 in the following areas: Colorado Springs, Durango, Grand Junction and Platteville. The Durango site was closed in September 2003. The Colorado Springs site was removed on December 31, 2006. It will moved to the Denver Municipal Animal Shelter location in 2007. Each air filter is analyzed for gravimetric mass, 48 elemental concentrations (sodium through lead), organic (four types) and elemental carbon and five ions (ammonium, sodium, potassium, sulfate and nitrate.) Selected filters can also be analyzed for semi volatile organics and microscopic analyses. The results of these samples can be obtained from the Air Pollution Control Division upon request.
23
4.0 Statewide Summaries For Criteria Pollutants 4.1 Carbon Monoxide
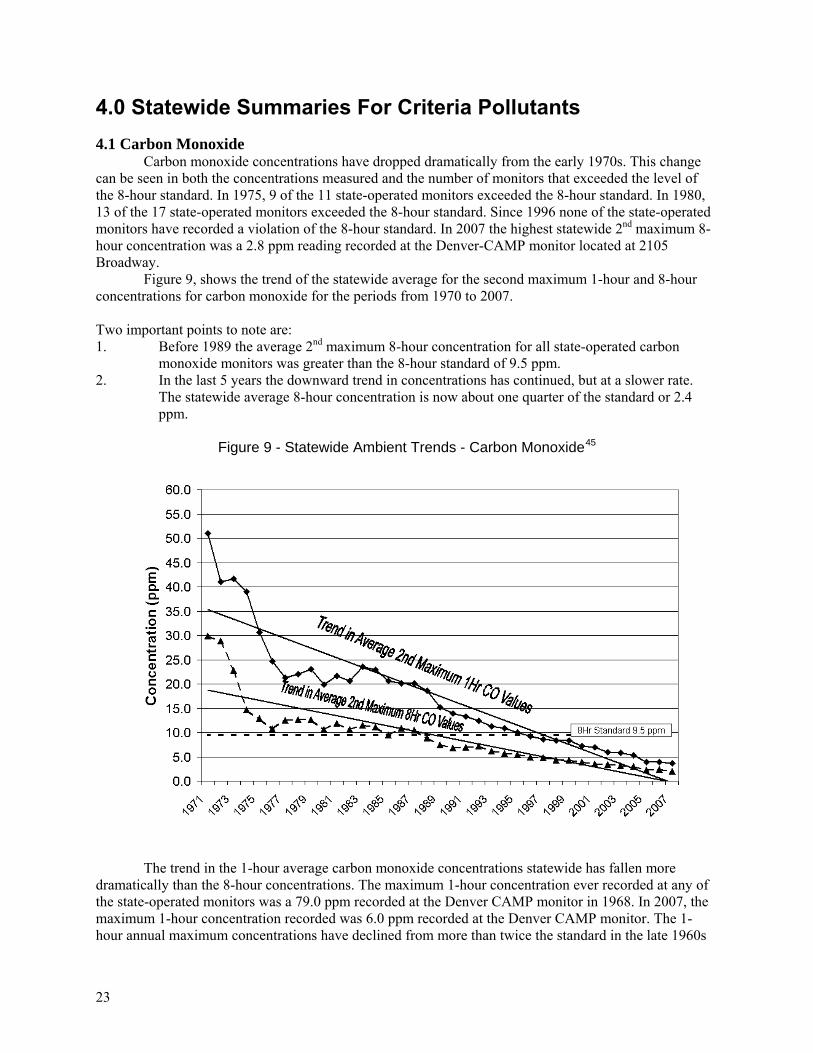
Carbon monoxide concentrations have dropped dramatically from the early 1970s. This change can be seen in both the concentrations measured and the number of monitors that exceeded the level of the 8-hour standard. In 1975, 9 of the 11 state-operated monitors exceeded the 8-hour standard. In 1980, 13 of the 17 state-operated monitors exceeded the 8-hour standard. Since 1996 none of the state-operated monitors have recorded a violation of the 8-hour standard. In 2007 the highest statewide 2nd maximum 8-hour concentration was a 2.8 ppm reading recorded at the Denver-CAMP monitor located at 2105 Broadway.
Figure 9, shows the trend of the statewide average for the second maximum 1-hour and 8-hour concentrations for carbon monoxide for the periods from 1970 to 2007. Two important points to note are: 1. Before 1989 the average 2nd maximum 8-hour concentration for all state-operated carbon
monoxide monitors was greater than the 8-hour standard of 9.5 ppm. 2. In the last 5 years the downward trend in concentrations has continued, but at a slower rate.
The statewide average 8-hour concentration is now about one quarter of the standard or 2.4 ppm.
Figure 9 - Statewide Ambient Trends - Carbon Monoxide45
The trend in the 1-hour average carbon monoxide concentrations statewide has fallen more
dramatically than the 8-hour concentrations. The maximum 1-hour concentration ever recorded at any of the state-operated monitors was a 79.0 ppm recorded at the Denver CAMP monitor in 1968. In 2007, the maximum 1-hour concentration recorded was 6.0 ppm recorded at the Denver CAMP monitor. The 1-hour annual maximum concentrations have declined from more than twice the standard in the late 1960s
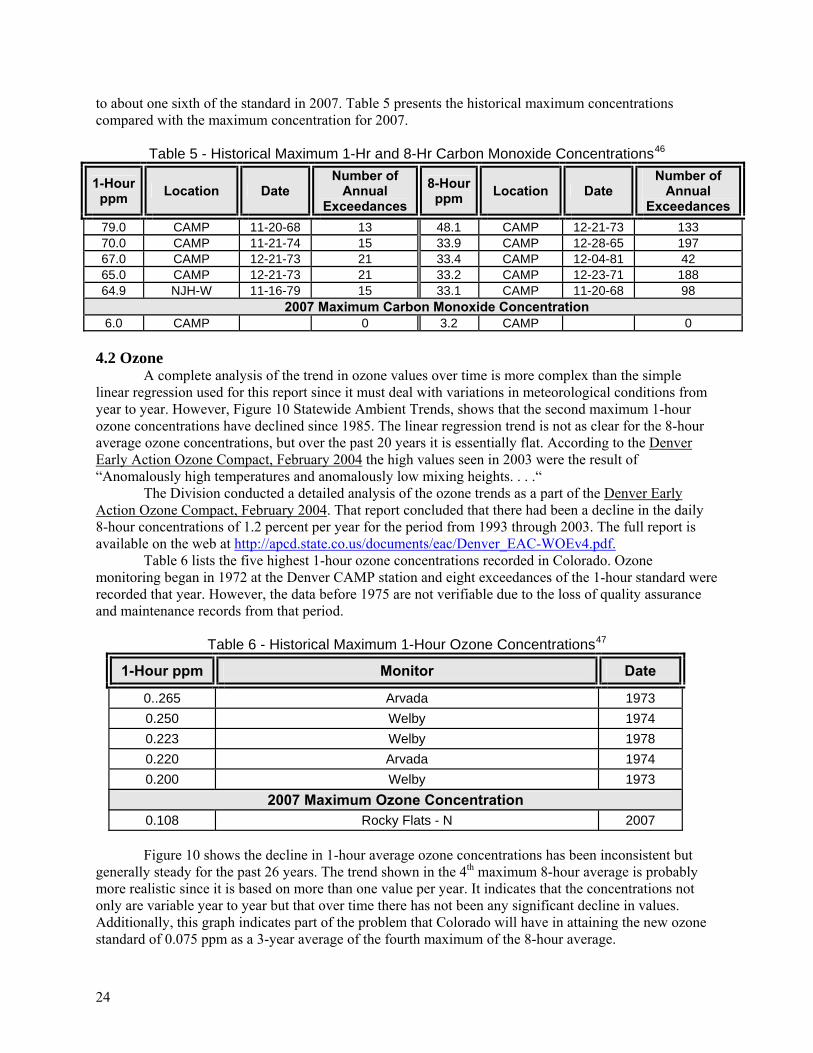
24
to about one sixth of the standard in 2007. Table 5 presents the historical maximum concentrations compared with the maximum concentration for 2007.
Table 5 - Historical Maximum 1-Hr and 8-Hr Carbon Monoxide Concentrations46
1-Hour ppm Location Date
Number of Annual
Exceedances 8-Hour
ppm Location Date Number of
Annual Exceedances
79.0 CAMP 11-20-68 13 48.1 CAMP 12-21-73 133 70.0 CAMP 11-21-74 15 33.9 CAMP 12-28-65 197 67.0 CAMP 12-21-73 21 33.4 CAMP 12-04-81 42 65.0 CAMP 12-21-73 21 33.2 CAMP 12-23-71 188 64.9 NJH-W 11-16-79 15 33.1 CAMP 11-20-68 98
2007 Maximum Carbon Monoxide Concentration 6.0 CAMP 0 3.2 CAMP 0
4.2 Ozone
A complete analysis of the trend in ozone values over time is more complex than the simple linear regression used for this report since it must deal with variations in meteorological conditions from year to year. However, Figure 10 Statewide Ambient Trends, shows that the second maximum 1-hour ozone concentrations have declined since 1985. The linear regression trend is not as clear for the 8-hour average ozone concentrations, but over the past 20 years it is essentially flat. According to the Denver Early Action Ozone Compact, February 2004 the high values seen in 2003 were the result of “Anomalously high temperatures and anomalously low mixing heights. . . .“
The Division conducted a detailed analysis of the ozone trends as a part of the Denver Early Action Ozone Compact, February 2004. That report concluded that there had been a decline in the daily 8-hour concentrations of 1.2 percent per year for the period from 1993 through 2003. The full report is available on the web at http://apcd.state.co.us/documents/eac/Denver_EAC-WOEv4.pdf.
Table 6 lists the five highest 1-hour ozone concentrations recorded in Colorado. Ozone monitoring began in 1972 at the Denver CAMP station and eight exceedances of the 1-hour standard were recorded that year. However, the data before 1975 are not verifiable due to the loss of quality assurance and maintenance records from that period.
Table 6 - Historical Maximum 1-Hour Ozone Concentrations47
1-Hour ppm Monitor Date
0..265 Arvada 1973 0.250 Welby 1974 0.223 Welby 1978 0.220 Arvada 1974 0.200 Welby 1973
2007 Maximum Ozone Concentration 0.108 Rocky Flats - N 2007 Figure 10 shows the decline in 1-hour average ozone concentrations has been inconsistent but
generally steady for the past 26 years. The trend shown in the 4th maximum 8-hour average is probably more realistic since it is based on more than one value per year. It indicates that the concentrations not only are variable year to year but that over time there has not been any significant decline in values. Additionally, this graph indicates part of the problem that Colorado will have in attaining the new ozone standard of 0.075 ppm as a 3-year average of the fourth maximum of the 8-hour average.
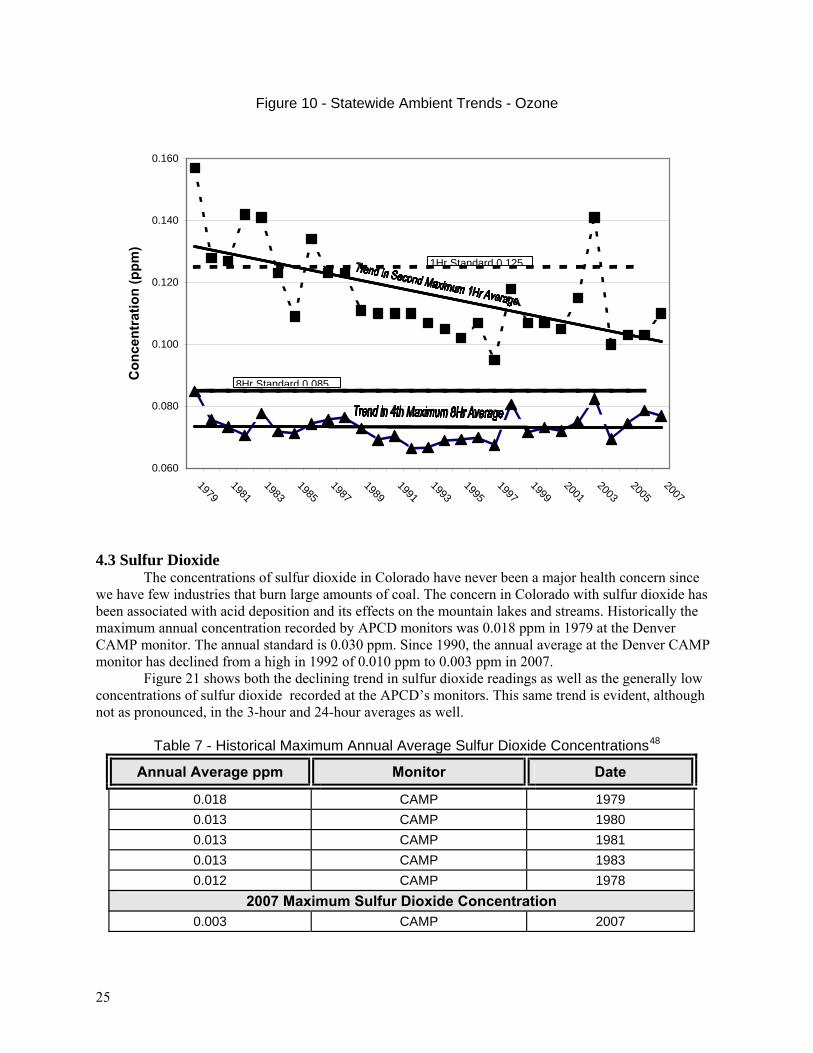
25
Figure 10 - Statewide Ambient Trends - Ozone
4.3 Sulfur Dioxide
The concentrations of sulfur dioxide in Colorado have never been a major health concern since we have few industries that burn large amounts of coal. The concern in Colorado with sulfur dioxide has been associated with acid deposition and its effects on the mountain lakes and streams. Historically the maximum annual concentration recorded by APCD monitors was 0.018 ppm in 1979 at the Denver CAMP monitor. The annual standard is 0.030 ppm. Since 1990, the annual average at the Denver CAMP monitor has declined from a high in 1992 of 0.010 ppm to 0.003 ppm in 2007.
Figure 21 shows both the declining trend in sulfur dioxide readings as well as the generally low concentrations of sulfur dioxide recorded at the APCD’s monitors. This same trend is evident, although not as pronounced, in the 3-hour and 24-hour averages as well.
Table 7 - Historical Maximum Annual Average Sulfur Dioxide Concentrations48
Annual Average ppm Monitor Date
0.018 CAMP 1979 0.013 CAMP 1980 0.013 CAMP 1981 0.013 CAMP 1983 0.012 CAMP 1978
2007 Maximum Sulfur Dioxide Concentration 0.003 CAMP 2007
0.060
0.080
0.100
0.120
0.140
0.160
19791981
19831985
19871989
19911993
19951997
19992001
20032005
2007
Con
cent
ratio
n (p
pm)
1Hr Standard 0 125
8Hr Standard 0.085
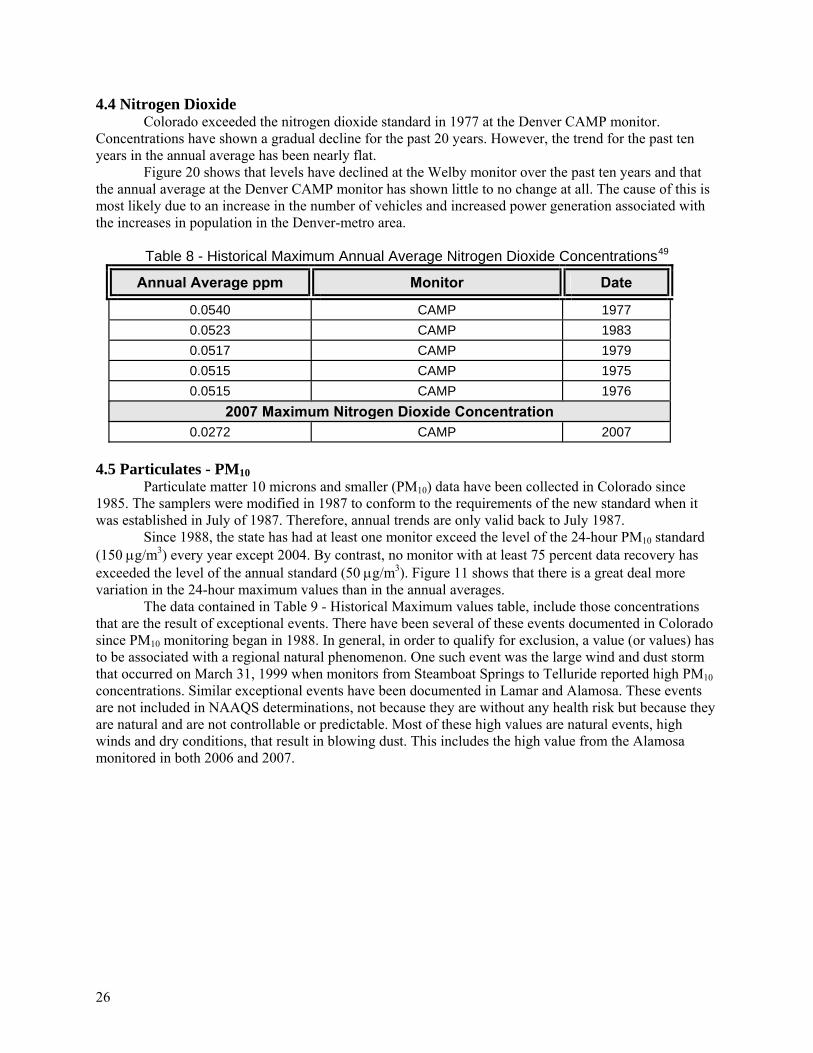
26
4.4 Nitrogen Dioxide Colorado exceeded the nitrogen dioxide standard in 1977 at the Denver CAMP monitor.
Concentrations have shown a gradual decline for the past 20 years. However, the trend for the past ten years in the annual average has been nearly flat.
Figure 20 shows that levels have declined at the Welby monitor over the past ten years and that the annual average at the Denver CAMP monitor has shown little to no change at all. The cause of this is most likely due to an increase in the number of vehicles and increased power generation associated with the increases in population in the Denver-metro area.
Table 8 - Historical Maximum Annual Average Nitrogen Dioxide Concentrations49
Annual Average ppm Monitor Date
0.0540 CAMP 1977 0.0523 CAMP 1983 0.0517 CAMP 1979 0.0515 CAMP 1975 0.0515 CAMP 1976
2007 Maximum Nitrogen Dioxide Concentration 0.0272 CAMP 2007
4.5 Particulates - PM10
Particulate matter 10 microns and smaller (PM10) data have been collected in Colorado since 1985. The samplers were modified in 1987 to conform to the requirements of the new standard when it was established in July of 1987. Therefore, annual trends are only valid back to July 1987.
Since 1988, the state has had at least one monitor exceed the level of the 24-hour PM10 standard (150 μg/m3) every year except 2004. By contrast, no monitor with at least 75 percent data recovery has exceeded the level of the annual standard (50 μg/m3). Figure 11 shows that there is a great deal more variation in the 24-hour maximum values than in the annual averages.
The data contained in Table 9 - Historical Maximum values table, include those concentrations that are the result of exceptional events. There have been several of these events documented in Colorado since PM10 monitoring began in 1988. In general, in order to qualify for exclusion, a value (or values) has to be associated with a regional natural phenomenon. One such event was the large wind and dust storm that occurred on March 31, 1999 when monitors from Steamboat Springs to Telluride reported high PM10 concentrations. Similar exceptional events have been documented in Lamar and Alamosa. These events are not included in NAAQS determinations, not because they are without any health risk but because they are natural and are not controllable or predictable. Most of these high values are natural events, high winds and dry conditions, that result in blowing dust. This includes the high value from the Alamosa monitored in both 2006 and 2007.
27
Table 9 - Historical Maximum 24-Hour PM10 Concentrations50
24-Hour Maximum μg/m3 Monitor Date
494 Alamosa - Municipal 06-06-07 473 Alamosa-ASC 06-06-07 424 Alamosa - ASC 02-10-06 412 Alamosa - ASC 04-10-91 306 Cripple Creek 12-27-95
2007 Maximum PM10 Concentration 494 Alamosa - Municipal 06-06-07
Figure 11 - Statewide Ambient Trends – PM10
Figure 11 - Statewide Ambient Trends shows a decline in both the 24-hour and the Annual average concentrations since 1987. This graph has been modified from previous years in that the exceptional events have been excluded from the trend data. The 412 μg/m3 in 1991 occurred at the Alamosa-Adams State College monitor and may have been a high wind event as well. The overall trend remains the same whether the 1991 value is included or not. The trend in the 24-hour concentrations over the past three years is increasing but the trend in the annual average concentrations has continued to decline.
4.6 Particulates - PM2.5
Monitoring for PM2.5 in Colorado began with the establishment of sites in Denver, Grand Junction, Steamboat Springs, Colorado Springs, Greeley, Fort Collins, Platteville, Boulder, Longmont and Elbert County in 1999. Additional sites were established nearly every month until full
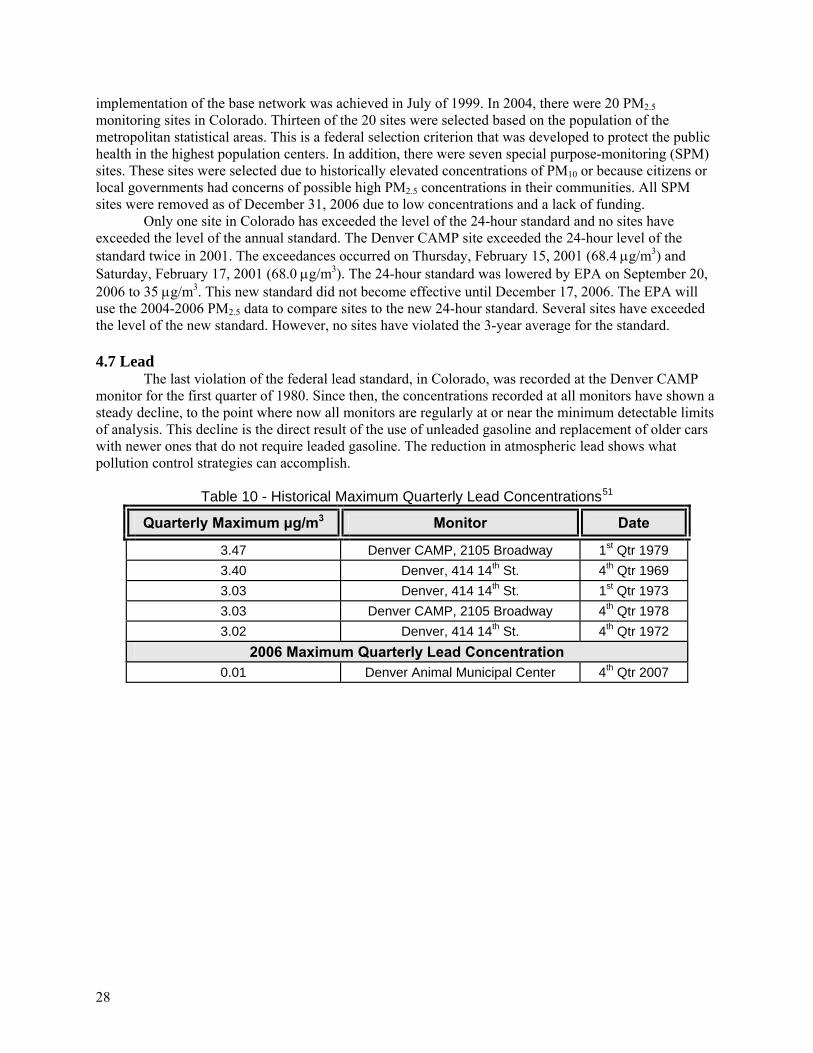
28
implementation of the base network was achieved in July of 1999. In 2004, there were 20 PM2.5 monitoring sites in Colorado. Thirteen of the 20 sites were selected based on the population of the metropolitan statistical areas. This is a federal selection criterion that was developed to protect the public health in the highest population centers. In addition, there were seven special purpose-monitoring (SPM) sites. These sites were selected due to historically elevated concentrations of PM10 or because citizens or local governments had concerns of possible high PM2.5 concentrations in their communities. All SPM sites were removed as of December 31, 2006 due to low concentrations and a lack of funding.
Only one site in Colorado has exceeded the level of the 24-hour standard and no sites have exceeded the level of the annual standard. The Denver CAMP site exceeded the 24-hour level of the standard twice in 2001. The exceedances occurred on Thursday, February 15, 2001 (68.4 μg/m3) and Saturday, February 17, 2001 (68.0 μg/m3). The 24-hour standard was lowered by EPA on September 20, 2006 to 35 μg/m3. This new standard did not become effective until December 17, 2006. The EPA will use the 2004-2006 PM2.5 data to compare sites to the new 24-hour standard. Several sites have exceeded the level of the new standard. However, no sites have violated the 3-year average for the standard. 4.7 Lead
The last violation of the federal lead standard, in Colorado, was recorded at the Denver CAMP monitor for the first quarter of 1980. Since then, the concentrations recorded at all monitors have shown a steady decline, to the point where now all monitors are regularly at or near the minimum detectable limits of analysis. This decline is the direct result of the use of unleaded gasoline and replacement of older cars with newer ones that do not require leaded gasoline. The reduction in atmospheric lead shows what pollution control strategies can accomplish.
Table 10 - Historical Maximum Quarterly Lead Concentrations51
Quarterly Maximum μg/m3 Monitor Date
3.47 Denver CAMP, 2105 Broadway 1st Qtr 1979 3.40 Denver, 414 14th St. 4th Qtr 1969 3.03 Denver, 414 14th St. 1st Qtr 1973 3.03 Denver CAMP, 2105 Broadway 4th Qtr 1978 3.02 Denver, 414 14th St. 4th Qtr 1972
2006 Maximum Quarterly Lead Concentration 0.01 Denver Animal Municipal Center 4th Qtr 2007
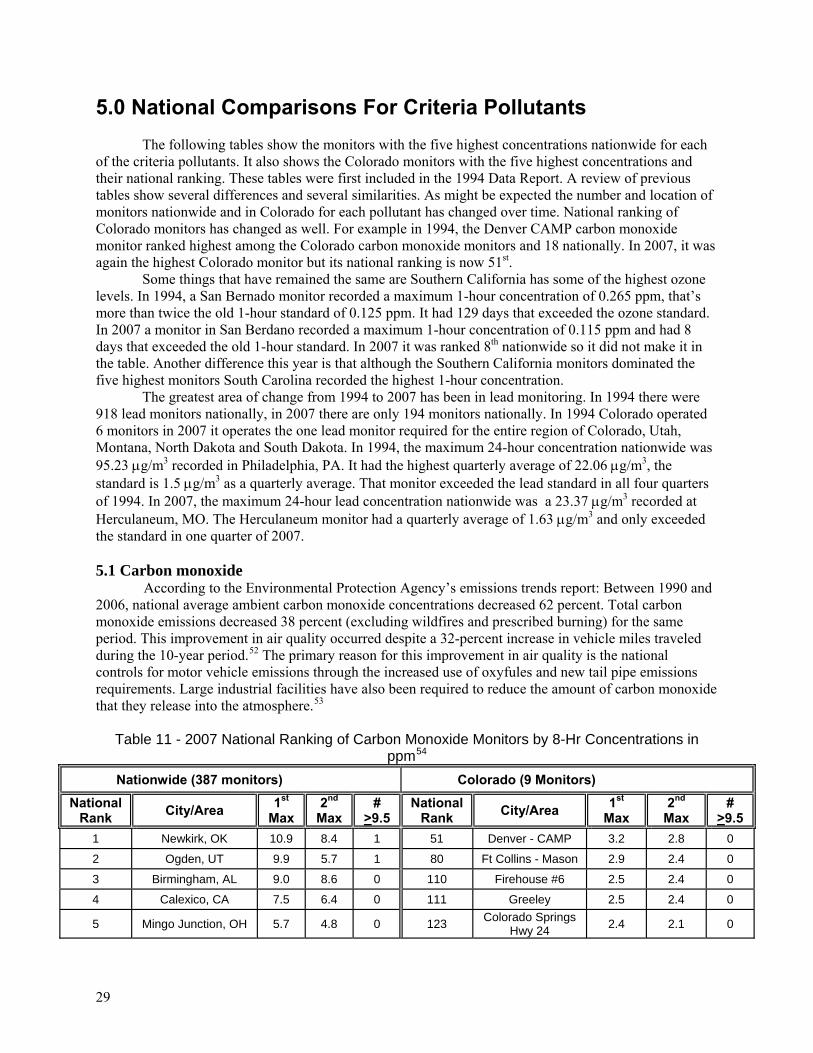
29
5.0 National Comparisons For Criteria Pollutants The following tables show the monitors with the five highest concentrations nationwide for each of the criteria pollutants. It also shows the Colorado monitors with the five highest concentrations and their national ranking. These tables were first included in the 1994 Data Report. A review of previous tables show several differences and several similarities. As might be expected the number and location of monitors nationwide and in Colorado for each pollutant has changed over time. National ranking of Colorado monitors has changed as well. For example in 1994, the Denver CAMP carbon monoxide monitor ranked highest among the Colorado carbon monoxide monitors and 18 nationally. In 2007, it was again the highest Colorado monitor but its national ranking is now 51st. Some things that have remained the same are Southern California has some of the highest ozone levels. In 1994, a San Bernado monitor recorded a maximum 1-hour concentration of 0.265 ppm, that’s more than twice the old 1-hour standard of 0.125 ppm. It had 129 days that exceeded the ozone standard. In 2007 a monitor in San Berdano recorded a maximum 1-hour concentration of 0.115 ppm and had 8 days that exceeded the old 1-hour standard. In 2007 it was ranked 8th nationwide so it did not make it in the table. Another difference this year is that although the Southern California monitors dominated the five highest monitors South Carolina recorded the highest 1-hour concentration. The greatest area of change from 1994 to 2007 has been in lead monitoring. In 1994 there were 918 lead monitors nationally, in 2007 there are only 194 monitors nationally. In 1994 Colorado operated 6 monitors in 2007 it operates the one lead monitor required for the entire region of Colorado, Utah, Montana, North Dakota and South Dakota. In 1994, the maximum 24-hour concentration nationwide was 95.23 μg/m3 recorded in Philadelphia, PA. It had the highest quarterly average of 22.06 μg/m3, the standard is 1.5 μg/m3 as a quarterly average. That monitor exceeded the lead standard in all four quarters of 1994. In 2007, the maximum 24-hour lead concentration nationwide was a 23.37 μg/m3 recorded at Herculaneum, MO. The Herculaneum monitor had a quarterly average of 1.63 μg/m3 and only exceeded the standard in one quarter of 2007. 5.1 Carbon monoxide
According to the Environmental Protection Agency’s emissions trends report: Between 1990 and 2006, national average ambient carbon monoxide concentrations decreased 62 percent. Total carbon monoxide emissions decreased 38 percent (excluding wildfires and prescribed burning) for the same period. This improvement in air quality occurred despite a 32-percent increase in vehicle miles traveled during the 10-year period.52 The primary reason for this improvement in air quality is the national controls for motor vehicle emissions through the increased use of oxyfules and new tail pipe emissions requirements. Large industrial facilities have also been required to reduce the amount of carbon monoxide that they release into the atmosphere.53
Table 11 - 2007 National Ranking of Carbon Monoxide Monitors by 8-Hr Concentrations in ppm54
Nationwide (387 monitors) Colorado (9 Monitors) National
Rank City/Area 1st Max
2nd
Max #
>9.5 National
Rank City/Area 1st Max
2nd
Max #
>9.5 1 Newkirk, OK 10.9 8.4 1 51 Denver - CAMP 3.2 2.8 0
2 Ogden, UT 9.9 5.7 1 80 Ft Collins - Mason 2.9 2.4 0
3 Birmingham, AL 9.0 8.6 0 110 Firehouse #6 2.5 2.4 0
4 Calexico, CA 7.5 6.4 0 111 Greeley 2.5 2.4 0
5 Mingo Junction, OH 5.7 4.8 0 123 Colorado Springs Hwy 24 2.4 2.1 0
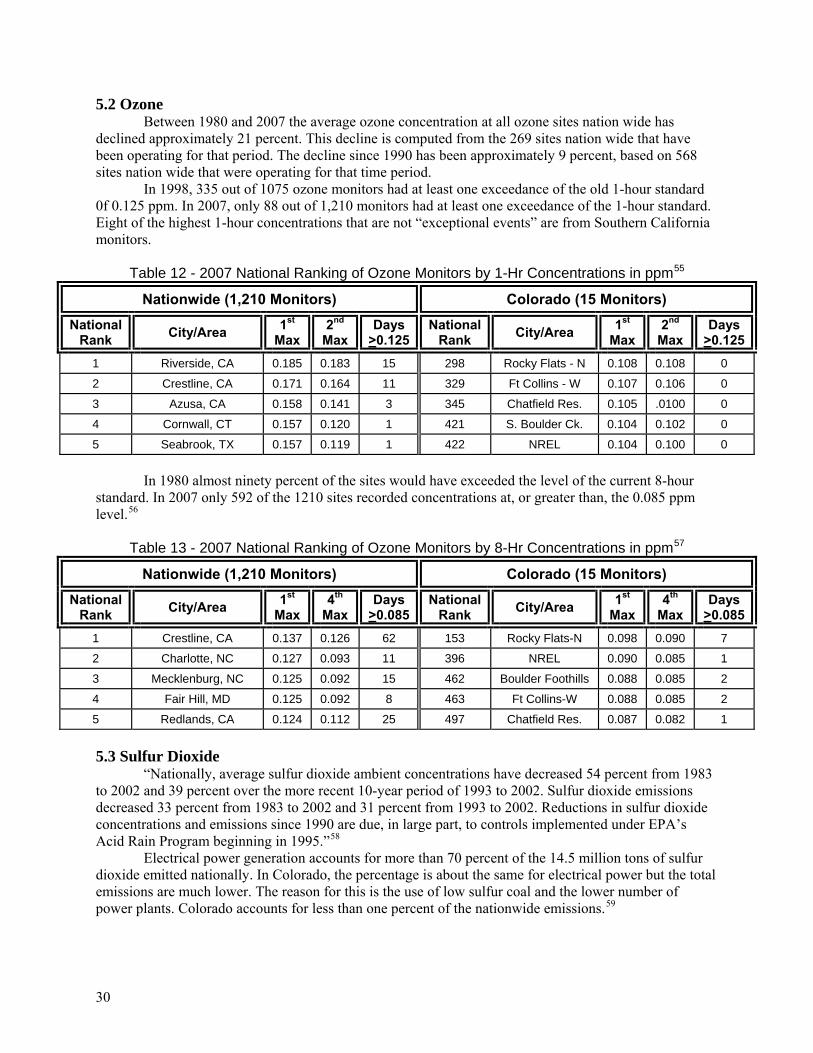
30
5.2 Ozone Between 1980 and 2007 the average ozone concentration at all ozone sites nation wide has
declined approximately 21 percent. This decline is computed from the 269 sites nation wide that have been operating for that period. The decline since 1990 has been approximately 9 percent, based on 568 sites nation wide that were operating for that time period.
In 1998, 335 out of 1075 ozone monitors had at least one exceedance of the old 1-hour standard 0f 0.125 ppm. In 2007, only 88 out of 1,210 monitors had at least one exceedance of the 1-hour standard. Eight of the highest 1-hour concentrations that are not “exceptional events” are from Southern California monitors.
Table 12 - 2007 National Ranking of Ozone Monitors by 1-Hr Concentrations in ppm55
Nationwide (1,210 Monitors) Colorado (15 Monitors) National
Rank City/Area 1st Max
2nd Max
Days >0.125
National Rank City/Area 1st
Max 2nd
Max Days
>0.1251 Riverside, CA 0.185 0.183 15 298 Rocky Flats - N 0.108 0.108 0
2 Crestline, CA 0.171 0.164 11 329 Ft Collins - W 0.107 0.106 0
3 Azusa, CA 0.158 0.141 3 345 Chatfield Res. 0.105 .0100 0
4 Cornwall, CT 0.157 0.120 1 421 S. Boulder Ck. 0.104 0.102 0
5 Seabrook, TX 0.157 0.119 1 422 NREL 0.104 0.100 0
In 1980 almost ninety percent of the sites would have exceeded the level of the current 8-hour
standard. In 2007 only 592 of the 1210 sites recorded concentrations at, or greater than, the 0.085 ppm level.56
Table 13 - 2007 National Ranking of Ozone Monitors by 8-Hr Concentrations in ppm57
Nationwide (1,210 Monitors) Colorado (15 Monitors) National
Rank City/Area 1st Max
4th Max
Days >0.085
National Rank City/Area 1st
Max 4th
Max Days
>0.0851 Crestline, CA 0.137 0.126 62 153 Rocky Flats-N 0.098 0.090 7
2 Charlotte, NC 0.127 0.093 11 396 NREL 0.090 0.085 1
3 Mecklenburg, NC 0.125 0.092 15 462 Boulder Foothills 0.088 0.085 2
4 Fair Hill, MD 0.125 0.092 8 463 Ft Collins-W 0.088 0.085 2
5 Redlands, CA 0.124 0.112 25 497 Chatfield Res. 0.087 0.082 1
5.3 Sulfur Dioxide
“Nationally, average sulfur dioxide ambient concentrations have decreased 54 percent from 1983 to 2002 and 39 percent over the more recent 10-year period of 1993 to 2002. Sulfur dioxide emissions decreased 33 percent from 1983 to 2002 and 31 percent from 1993 to 2002. Reductions in sulfur dioxide concentrations and emissions since 1990 are due, in large part, to controls implemented under EPA’s Acid Rain Program beginning in 1995.”58
Electrical power generation accounts for more than 70 percent of the 14.5 million tons of sulfur dioxide emitted nationally. In Colorado, the percentage is about the same for electrical power but the total emissions are much lower. The reason for this is the use of low sulfur coal and the lower number of power plants. Colorado accounts for less than one percent of the nationwide emissions.59
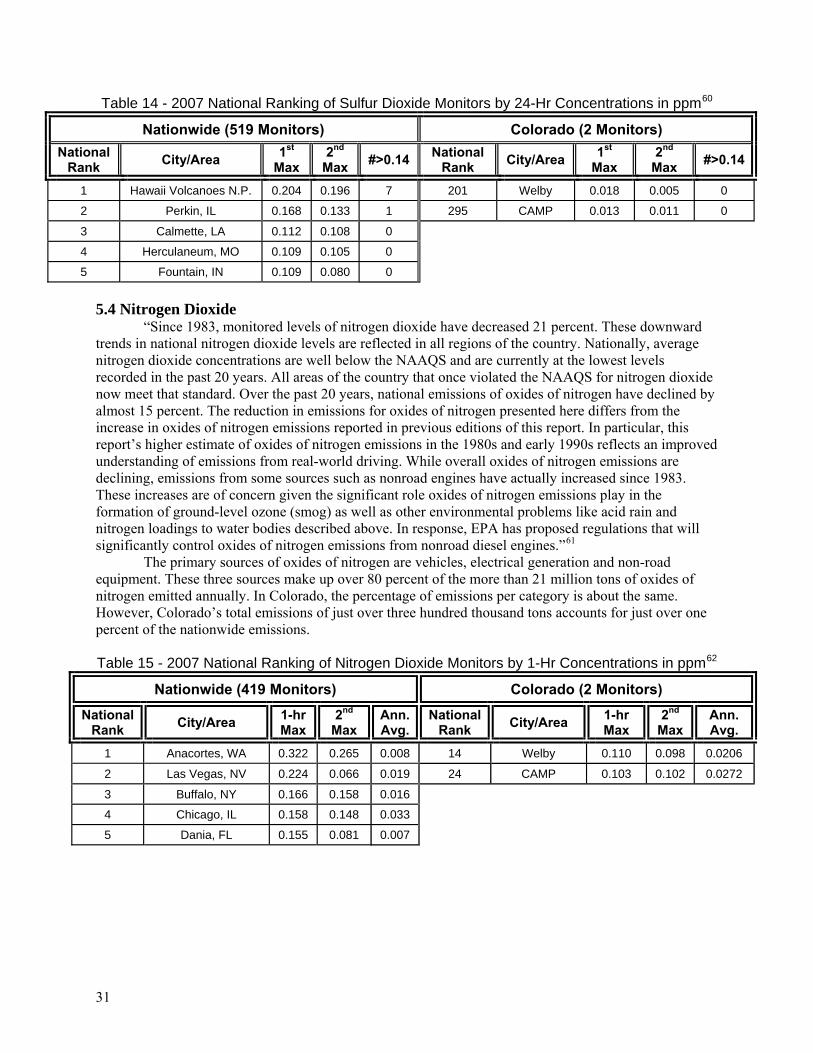
31
Table 14 - 2007 National Ranking of Sulfur Dioxide Monitors by 24-Hr Concentrations in ppm60
Nationwide (519 Monitors) Colorado (2 Monitors) National
Rank City/Area 1st Max
2nd Max #>0.14 National
Rank City/Area 1st Max
2nd Max #>0.14
1 Hawaii Volcanoes N.P. 0.204 0.196 7 201 Welby 0.018 0.005 0
2 Perkin, IL 0.168 0.133 1 295 CAMP 0.013 0.011 0
3 Calmette, LA 0.112 0.108 0
4 Herculaneum, MO 0.109 0.105 0
5 Fountain, IN 0.109 0.080 0
5.4 Nitrogen Dioxide
“Since 1983, monitored levels of nitrogen dioxide have decreased 21 percent. These downward trends in national nitrogen dioxide levels are reflected in all regions of the country. Nationally, average nitrogen dioxide concentrations are well below the NAAQS and are currently at the lowest levels recorded in the past 20 years. All areas of the country that once violated the NAAQS for nitrogen dioxide now meet that standard. Over the past 20 years, national emissions of oxides of nitrogen have declined by almost 15 percent. The reduction in emissions for oxides of nitrogen presented here differs from the increase in oxides of nitrogen emissions reported in previous editions of this report. In particular, this report’s higher estimate of oxides of nitrogen emissions in the 1980s and early 1990s reflects an improved understanding of emissions from real-world driving. While overall oxides of nitrogen emissions are declining, emissions from some sources such as nonroad engines have actually increased since 1983. These increases are of concern given the significant role oxides of nitrogen emissions play in the formation of ground-level ozone (smog) as well as other environmental problems like acid rain and nitrogen loadings to water bodies described above. In response, EPA has proposed regulations that will significantly control oxides of nitrogen emissions from nonroad diesel engines.”61
The primary sources of oxides of nitrogen are vehicles, electrical generation and non-road equipment. These three sources make up over 80 percent of the more than 21 million tons of oxides of nitrogen emitted annually. In Colorado, the percentage of emissions per category is about the same. However, Colorado’s total emissions of just over three hundred thousand tons accounts for just over one percent of the nationwide emissions. Table 15 - 2007 National Ranking of Nitrogen Dioxide Monitors by 1-Hr Concentrations in ppm62
Nationwide (419 Monitors) Colorado (2 Monitors) National
Rank City/Area 1-hr Max
2nd Max
Ann. Avg.
National Rank City/Area 1-hr
Max 2nd
Max Ann. Avg.
1 Anacortes, WA 0.322 0.265 0.008 14 Welby 0.110 0.098 0.0206
2 Las Vegas, NV 0.224 0.066 0.019 24 CAMP 0.103 0.102 0.0272
3 Buffalo, NY 0.166 0.158 0.016
4 Chicago, IL 0.158 0.148 0.033
5 Dania, FL 0.155 0.081 0.007
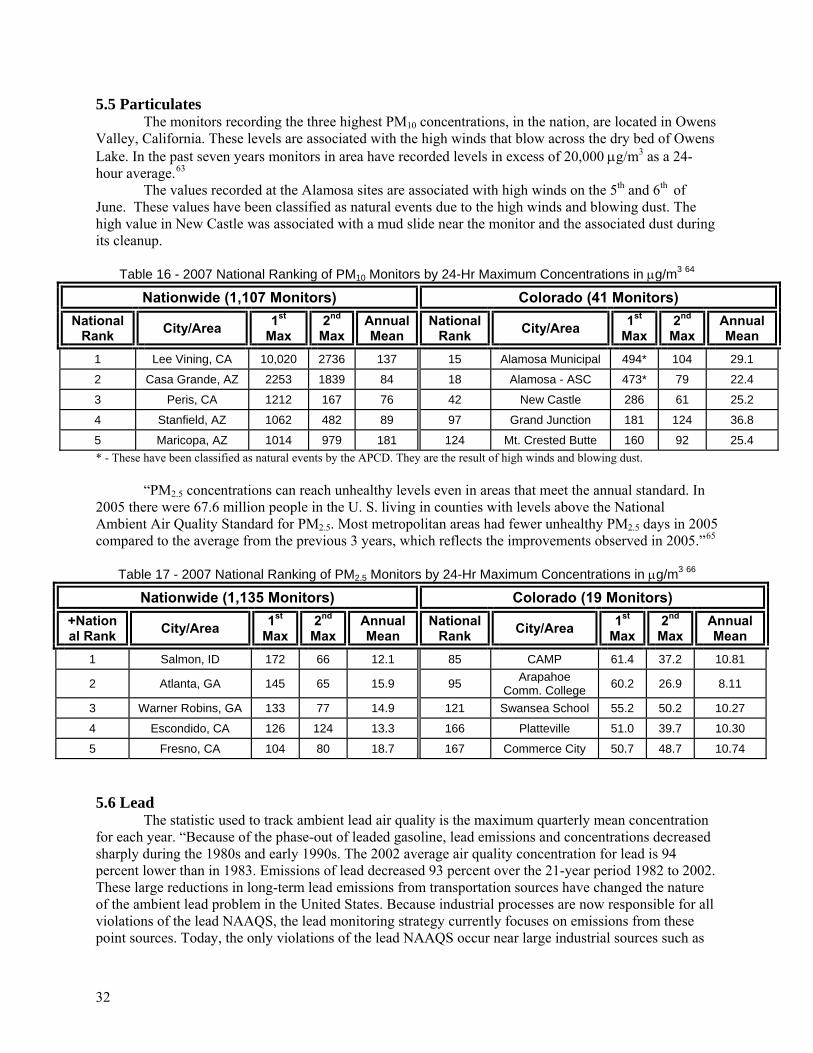
32
5.5 Particulates The monitors recording the three highest PM10 concentrations, in the nation, are located in Owens
Valley, California. These levels are associated with the high winds that blow across the dry bed of Owens Lake. In the past seven years monitors in area have recorded levels in excess of 20,000 μg/m3 as a 24-hour average.63
The values recorded at the Alamosa sites are associated with high winds on the 5th and 6th of June. These values have been classified as natural events due to the high winds and blowing dust. The high value in New Castle was associated with a mud slide near the monitor and the associated dust during its cleanup.
Table 16 - 2007 National Ranking of PM10 Monitors by 24-Hr Maximum Concentrations in μg/m3 64
Nationwide (1,107 Monitors) Colorado (41 Monitors) National
Rank City/Area 1st Max
2nd Max
Annual Mean
National Rank City/Area 1st
Max 2nd
Max Annual Mean
1 Lee Vining, CA 10,020 2736 137 15 Alamosa Municipal 494* 104 29.1
2 Casa Grande, AZ 2253 1839 84 18 Alamosa - ASC 473* 79 22.4
3 Peris, CA 1212 167 76 42 New Castle 286 61 25.2
4 Stanfield, AZ 1062 482 89 97 Grand Junction 181 124 36.8
5 Maricopa, AZ 1014 979 181 124 Mt. Crested Butte 160 92 25.4 * - These have been classified as natural events by the APCD. They are the result of high winds and blowing dust.
“PM2.5 concentrations can reach unhealthy levels even in areas that meet the annual standard. In 2005 there were 67.6 million people in the U. S. living in counties with levels above the National Ambient Air Quality Standard for PM2.5. Most metropolitan areas had fewer unhealthy PM2.5 days in 2005 compared to the average from the previous 3 years, which reflects the improvements observed in 2005.”65
Table 17 - 2007 National Ranking of PM2.5 Monitors by 24-Hr Maximum Concentrations in μg/m3 66
Nationwide (1,135 Monitors) Colorado (19 Monitors) +National Rank City/Area 1st
Max 2nd
Max Annual Mean
National Rank City/Area 1st
Max 2nd
Max Annual Mean
1 Salmon, ID 172 66 12.1 85 CAMP 61.4 37.2 10.81
2 Atlanta, GA 145 65 15.9 95 Arapahoe Comm. College 60.2 26.9 8.11
3 Warner Robins, GA 133 77 14.9 121 Swansea School 55.2 50.2 10.27
4 Escondido, CA 126 124 13.3 166 Platteville 51.0 39.7 10.30
5 Fresno, CA 104 80 18.7 167 Commerce City 50.7 48.7 10.74
5.6 Lead
The statistic used to track ambient lead air quality is the maximum quarterly mean concentration for each year. “Because of the phase-out of leaded gasoline, lead emissions and concentrations decreased sharply during the 1980s and early 1990s. The 2002 average air quality concentration for lead is 94 percent lower than in 1983. Emissions of lead decreased 93 percent over the 21-year period 1982 to 2002. These large reductions in long-term lead emissions from transportation sources have changed the nature of the ambient lead problem in the United States. Because industrial processes are now responsible for all violations of the lead NAAQS, the lead monitoring strategy currently focuses on emissions from these point sources. Today, the only violations of the lead NAAQS occur near large industrial sources such as
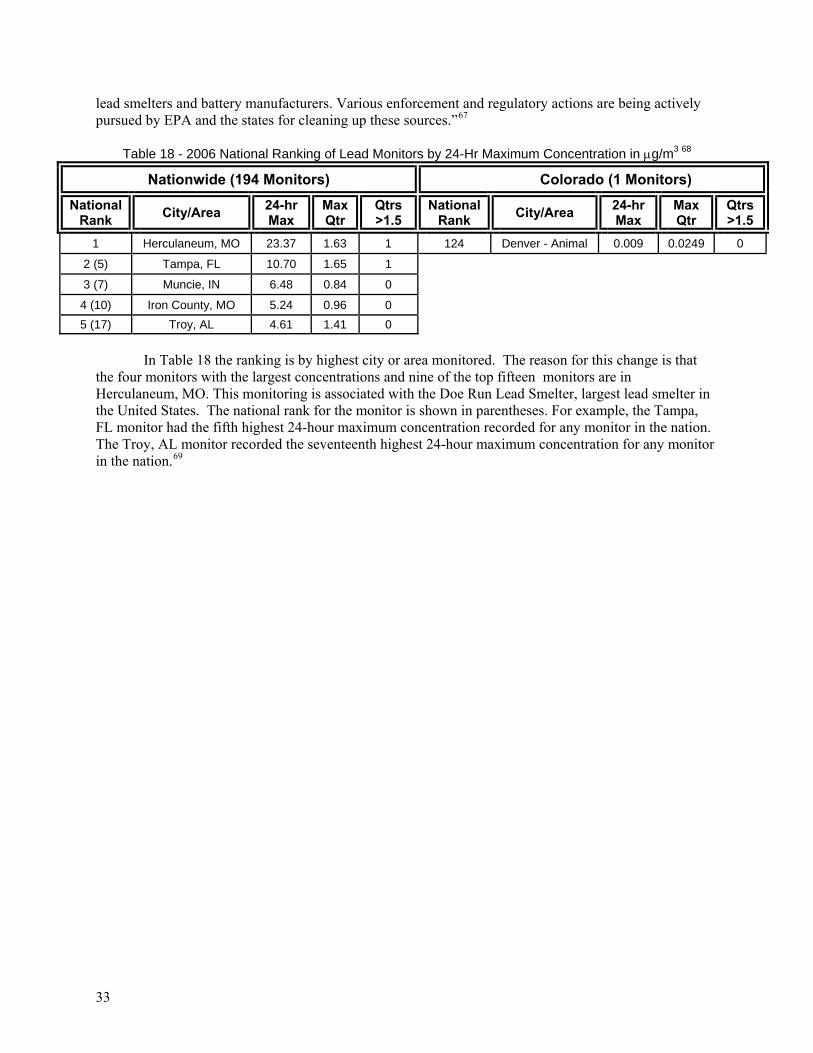
33
lead smelters and battery manufacturers. Various enforcement and regulatory actions are being actively pursued by EPA and the states for cleaning up these sources.”67
Table 18 - 2006 National Ranking of Lead Monitors by 24-Hr Maximum Concentration in μg/m3 68
Nationwide (194 Monitors) Colorado (1 Monitors) National
Rank City/Area 24-hr Max
Max Qtr
Qtrs >1.5
National Rank City/Area 24-hr
Max Max Qtr
Qtrs >1.5
1 Herculaneum, MO 23.37 1.63 1 124 Denver - Animal 0.009 0.0249 0
2 (5) Tampa, FL 10.70 1.65 1
3 (7) Muncie, IN 6.48 0.84 0
4 (10) Iron County, MO 5.24 0.96 0 5 (17) Troy, AL 4.61 1.41 0
In Table 18 the ranking is by highest city or area monitored. The reason for this change is that
the four monitors with the largest concentrations and nine of the top fifteen monitors are in Herculaneum, MO. This monitoring is associated with the Doe Run Lead Smelter, largest lead smelter in the United States. The national rank for the monitor is shown in parentheses. For example, the Tampa, FL monitor had the fifth highest 24-hour maximum concentration recorded for any monitor in the nation. The Troy, AL monitor recorded the seventeenth highest 24-hour maximum concentration for any monitor in the nation.69
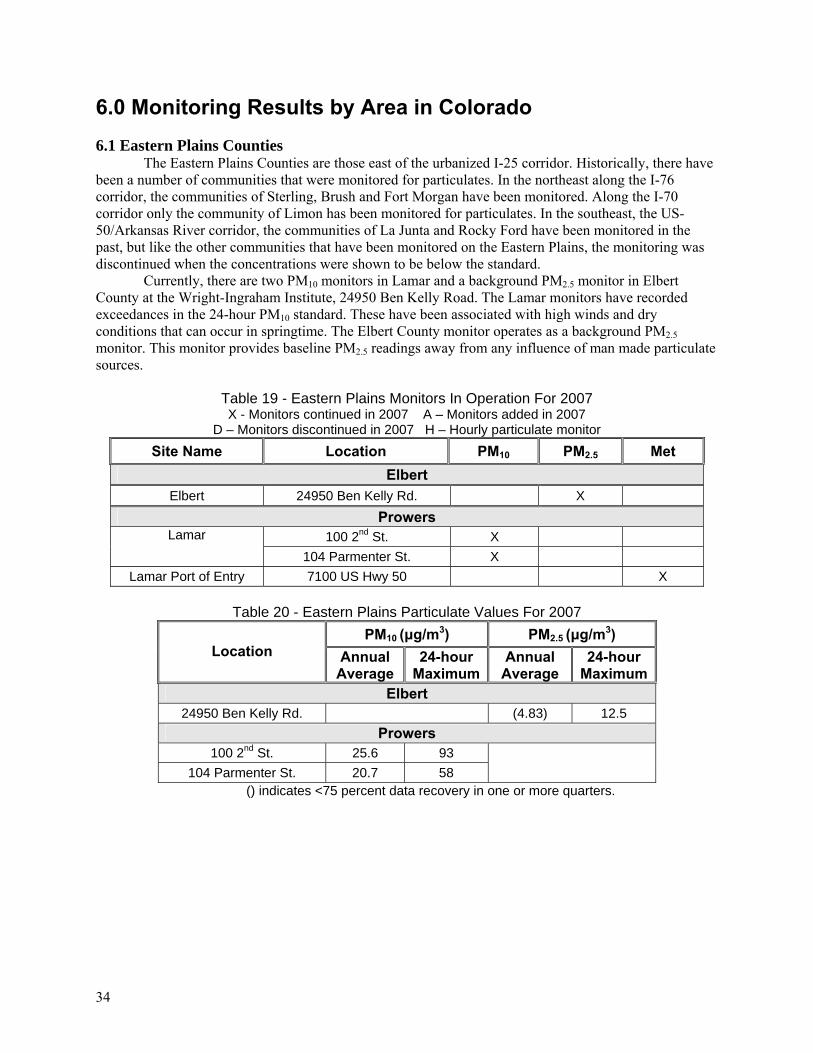
34
6.0 Monitoring Results by Area in Colorado 6.1 Eastern Plains Counties
The Eastern Plains Counties are those east of the urbanized I-25 corridor. Historically, there have been a number of communities that were monitored for particulates. In the northeast along the I-76 corridor, the communities of Sterling, Brush and Fort Morgan have been monitored. Along the I-70 corridor only the community of Limon has been monitored for particulates. In the southeast, the US-50/Arkansas River corridor, the communities of La Junta and Rocky Ford have been monitored in the past, but like the other communities that have been monitored on the Eastern Plains, the monitoring was discontinued when the concentrations were shown to be below the standard.
Currently, there are two PM10 monitors in Lamar and a background PM2.5 monitor in Elbert County at the Wright-Ingraham Institute, 24950 Ben Kelly Road. The Lamar monitors have recorded exceedances in the 24-hour PM10 standard. These have been associated with high winds and dry conditions that can occur in springtime. The Elbert County monitor operates as a background PM2.5 monitor. This monitor provides baseline PM2.5 readings away from any influence of man made particulate sources.
Table 19 - Eastern Plains Monitors In Operation For 2007 X - Monitors continued in 2007 A – Monitors added in 2007
D – Monitors discontinued in 2007 H – Hourly particulate monitor Site Name Location PM10 PM2.5 Met
Elbert Elbert 24950 Ben Kelly Rd. X
Prowers Lamar 100 2nd St. X
104 Parmenter St. X Lamar Port of Entry 7100 US Hwy 50 X
Table 20 - Eastern Plains Particulate Values For 2007
PM10 (μg/m3) PM2.5 (μg/m3) Location Annual
Average 24-hour
MaximumAnnual
Average 24-hour
Maximum Elbert
24950 Ben Kelly Rd. (4.83) 12.5 Prowers
100 2nd St. 25.6 93 104 Parmenter St. 20.7 58
() indicates <75 percent data recovery in one or more quarters.
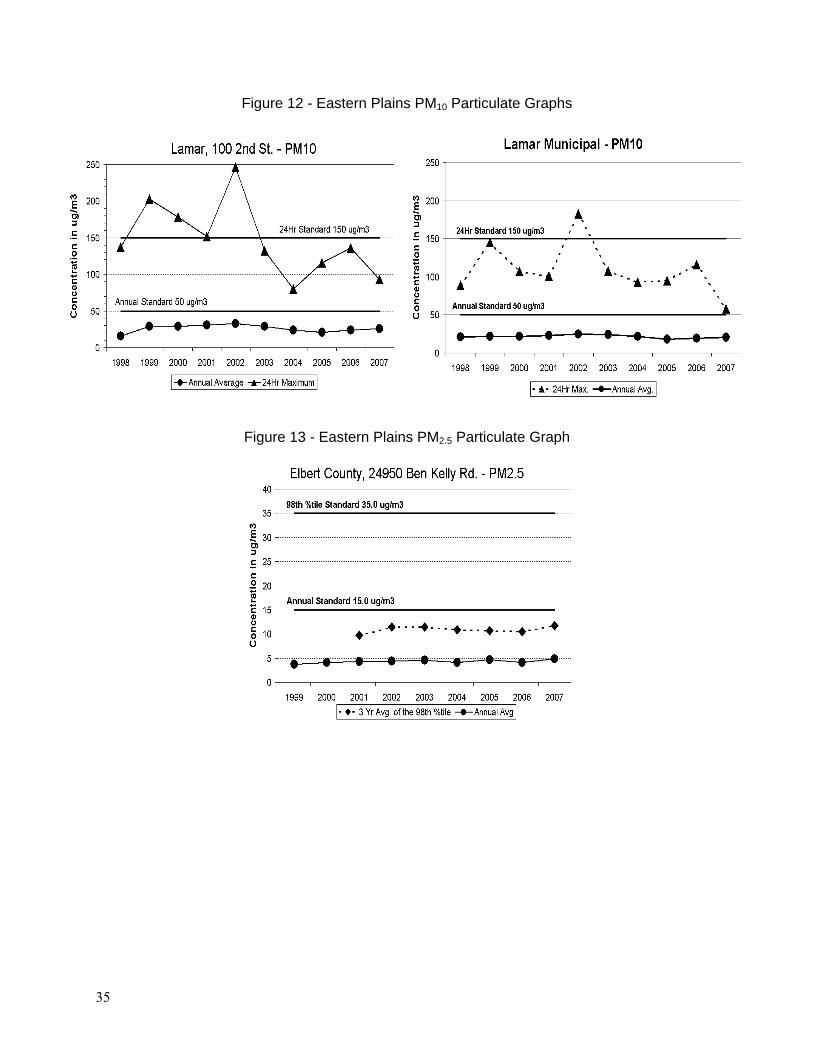
35
Figure 12 - Eastern Plains PM10 Particulate Graphs
Figure 13 - Eastern Plains PM2.5 Particulate Graph
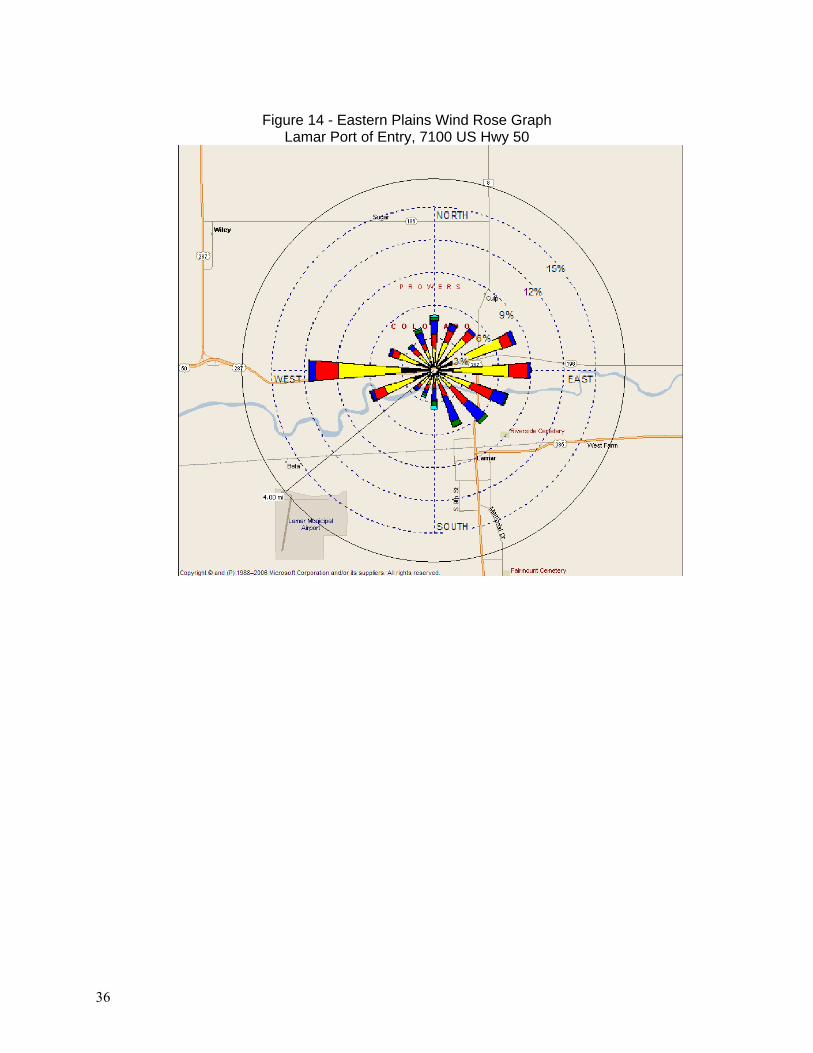
36
Figure 14 - Eastern Plains Wind Rose Graph
Lamar Port of Entry, 7100 US Hwy 50
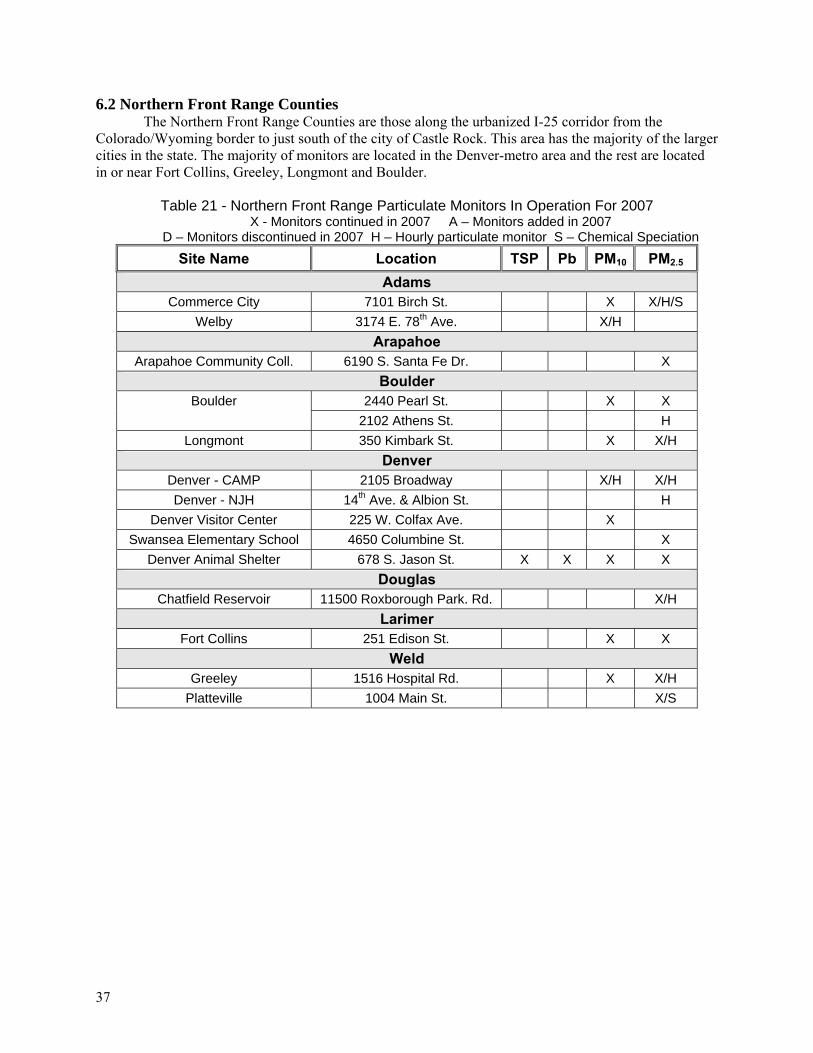
37
6.2 Northern Front Range Counties The Northern Front Range Counties are those along the urbanized I-25 corridor from the
Colorado/Wyoming border to just south of the city of Castle Rock. This area has the majority of the larger cities in the state. The majority of monitors are located in the Denver-metro area and the rest are located in or near Fort Collins, Greeley, Longmont and Boulder.
Table 21 - Northern Front Range Particulate Monitors In Operation For 2007 X - Monitors continued in 2007 A – Monitors added in 2007
D – Monitors discontinued in 2007 H – Hourly particulate monitor S – Chemical Speciation Site Name Location TSP Pb PM10 PM2.5
Adams Commerce City 7101 Birch St. X X/H/S
Welby 3174 E. 78th Ave. X/H Arapahoe
Arapahoe Community Coll. 6190 S. Santa Fe Dr. X Boulder
Boulder 2440 Pearl St. X X 2102 Athens St. H
Longmont 350 Kimbark St. X X/H Denver
Denver - CAMP 2105 Broadway X/H X/H Denver - NJH 14th Ave. & Albion St. H
Denver Visitor Center 225 W. Colfax Ave. X Swansea Elementary School 4650 Columbine St. X
Denver Animal Shelter 678 S. Jason St. X X X X Douglas
Chatfield Reservoir 11500 Roxborough Park. Rd. X/H Larimer
Fort Collins 251 Edison St. X X Weld
Greeley 1516 Hospital Rd. X X/H Platteville 1004 Main St. X/S
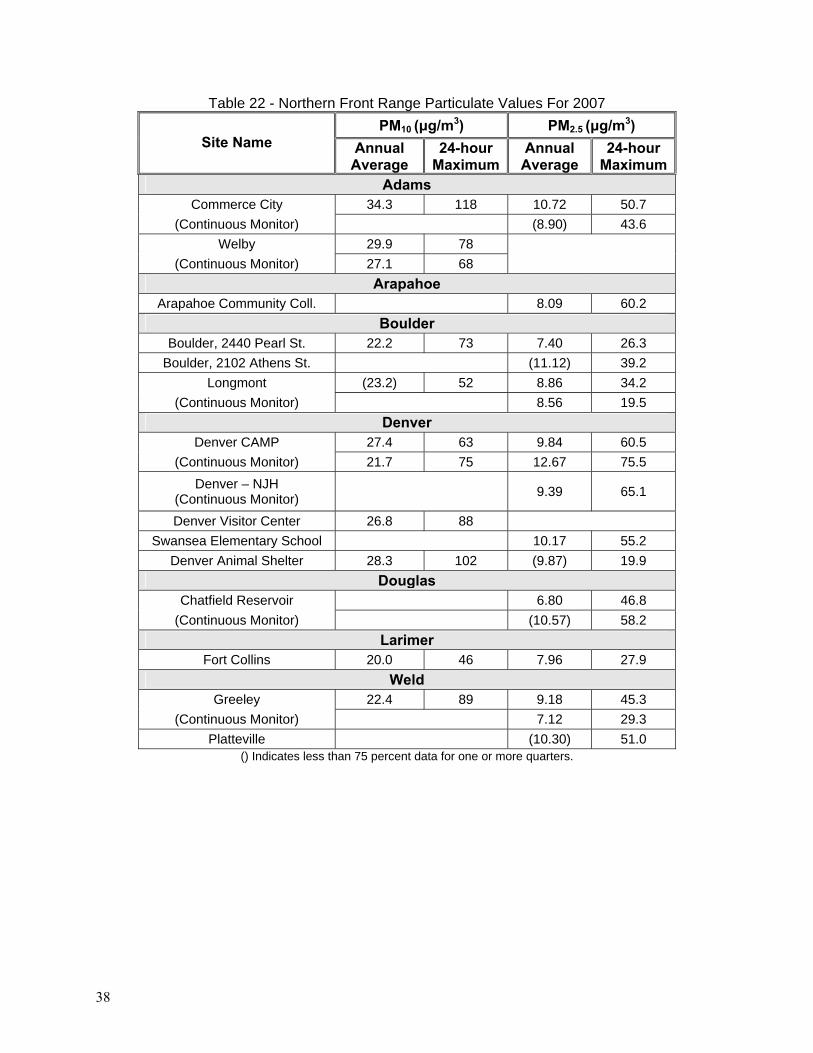
38
Table 22 - Northern Front Range Particulate Values For 2007 PM10 (μg/m3) PM2.5 (μg/m3)
Site Name Annual Average
24-hour Maximum
Annual Average
24-hour Maximum
Adams Commerce City 34.3 118 10.72 50.7
(Continuous Monitor) (8.90) 43.6 Welby 29.9 78
(Continuous Monitor) 27.1 68 Arapahoe
Arapahoe Community Coll. 8.09 60.2 Boulder
Boulder, 2440 Pearl St. 22.2 73 7.40 26.3 Boulder, 2102 Athens St. (11.12) 39.2
Longmont (23.2) 52 8.86 34.2 (Continuous Monitor) 8.56 19.5
Denver Denver CAMP 27.4 63 9.84 60.5
(Continuous Monitor) 21.7 75 12.67 75.5 Denver – NJH
(Continuous Monitor) 9.39 65.1
Denver Visitor Center 26.8 88 Swansea Elementary School 10.17 55.2
Denver Animal Shelter 28.3 102 (9.87) 19.9 Douglas
Chatfield Reservoir 6.80 46.8 (Continuous Monitor) (10.57) 58.2
Larimer Fort Collins 20.0 46 7.96 27.9
Weld Greeley 22.4 89 9.18 45.3
(Continuous Monitor) 7.12 29.3 Platteville (10.30) 51.0
() Indicates less than 75 percent data for one or more quarters.
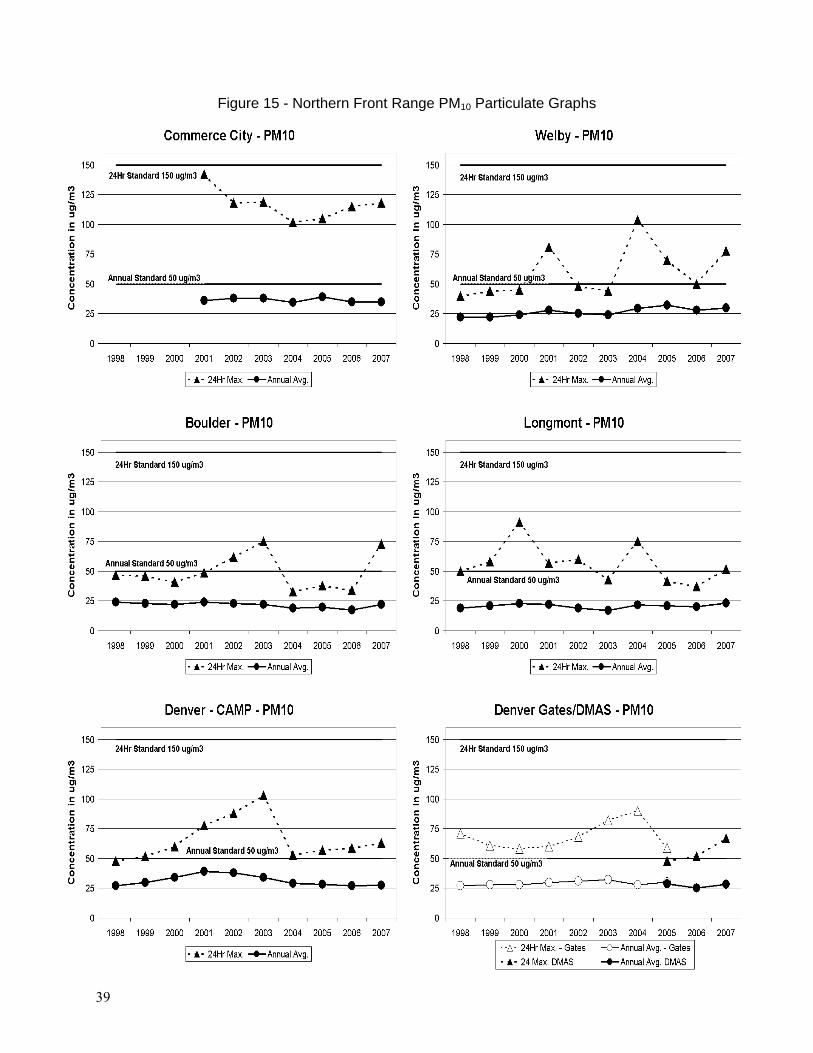
39
Figure 15 - Northern Front Range PM10 Particulate Graphs
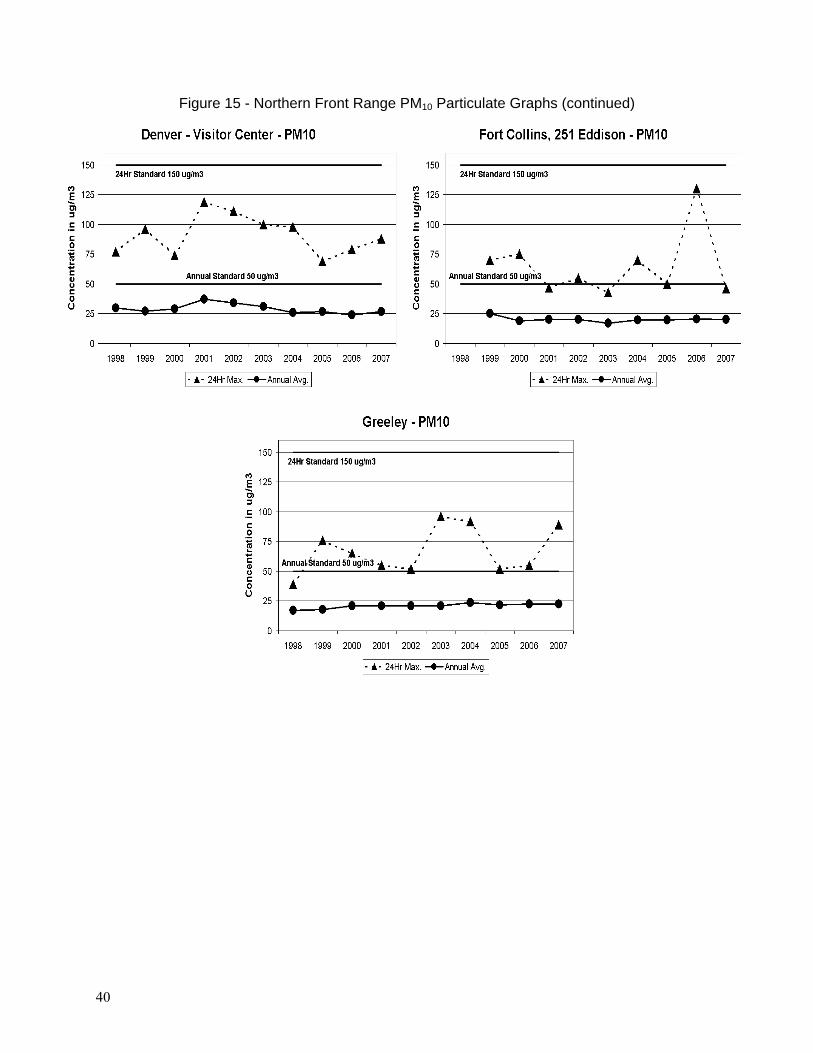
40
Figure 15 - Northern Front Range PM10 Particulate Graphs (continued)
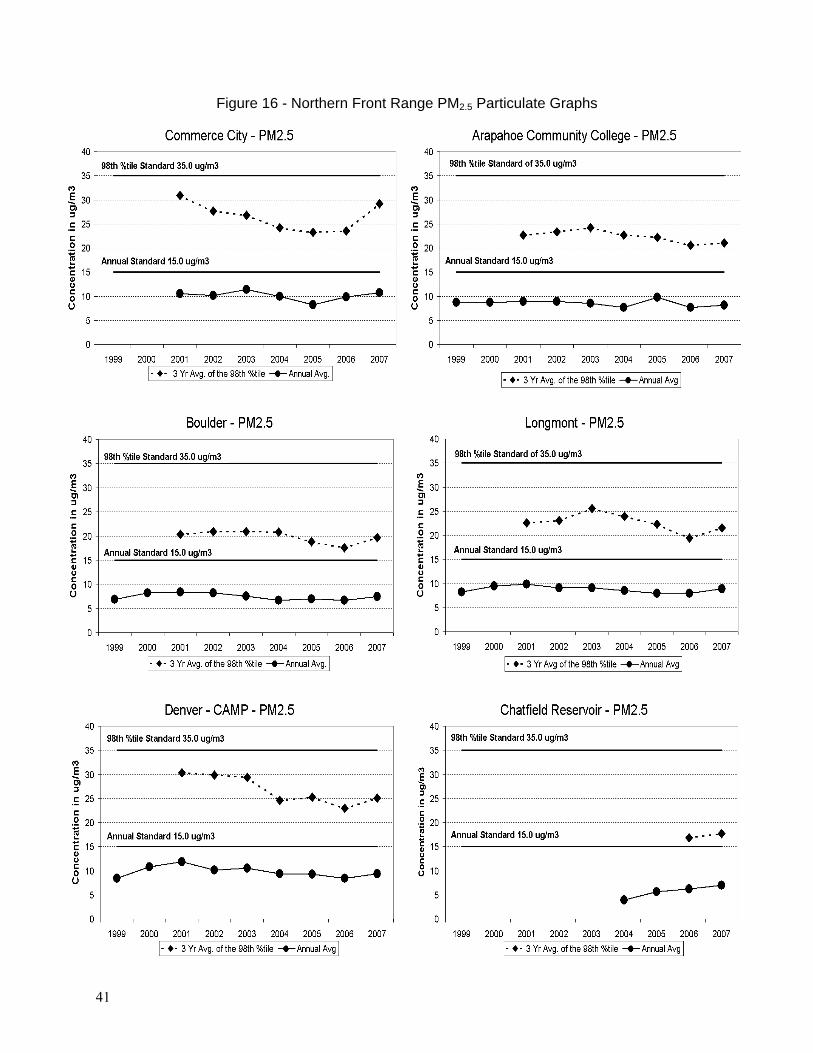
41
Figure 16 - Northern Front Range PM2.5 Particulate Graphs
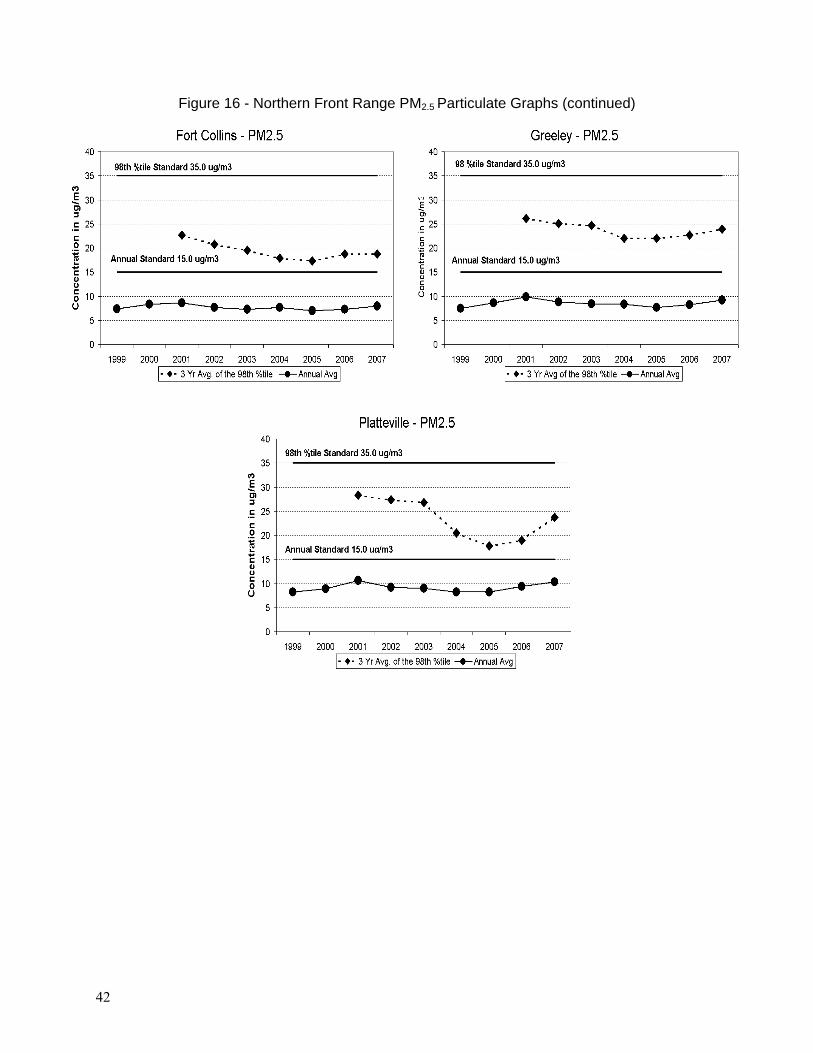
42
Figure 16 - Northern Front Range PM2.5 Particulate Graphs (continued)
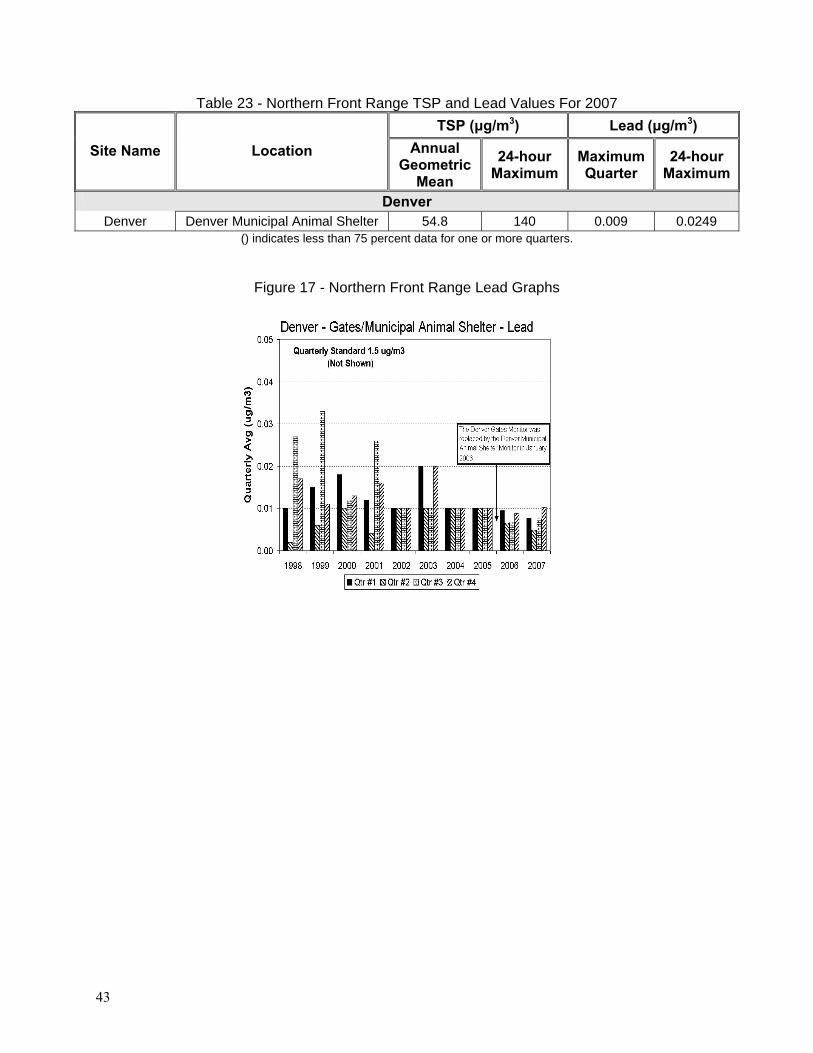
43
Table 23 - Northern Front Range TSP and Lead Values For 2007 TSP (μg/m3) Lead (μg/m3)
Site Name Location Annual Geometric
Mean 24-hour
Maximum Maximum Quarter
24-hour Maximum
Denver Denver Denver Municipal Animal Shelter 54.8 140 0.009 0.0249
() indicates less than 75 percent data for one or more quarters.
Figure 17 - Northern Front Range Lead Graphs
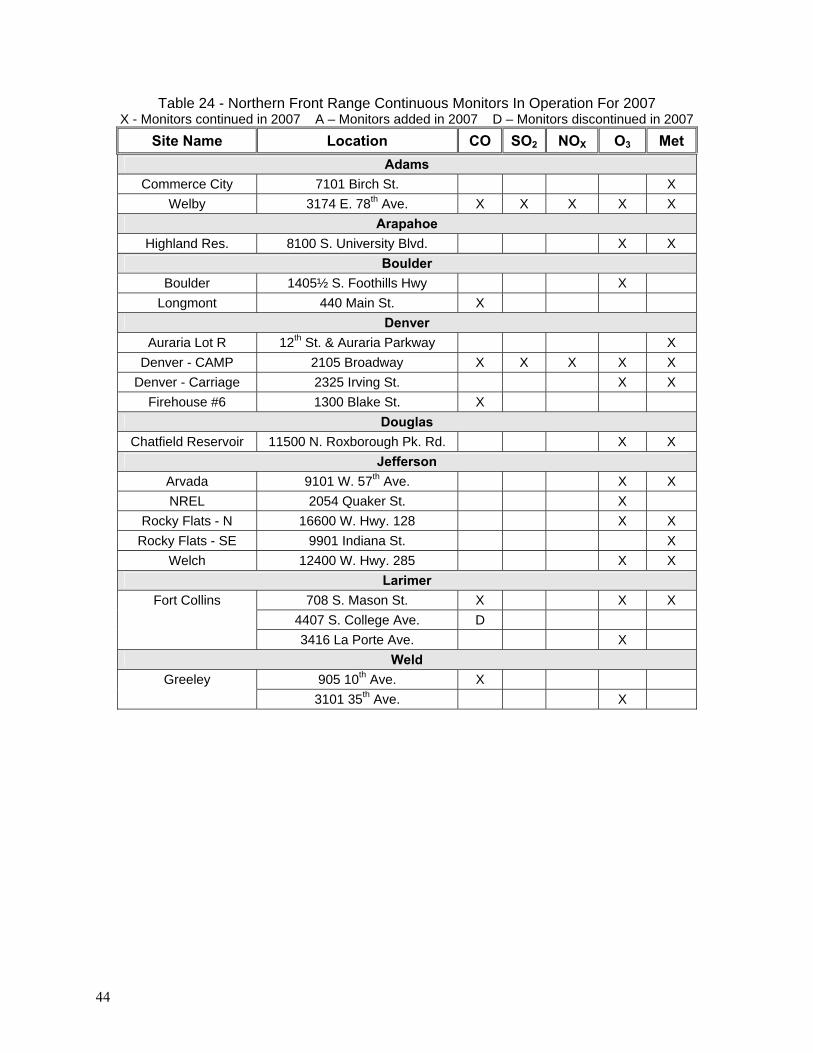
44
Table 24 - Northern Front Range Continuous Monitors In Operation For 2007 X - Monitors continued in 2007 A – Monitors added in 2007 D – Monitors discontinued in 2007
Site Name Location CO SO2 NOX O3 Met Adams
Commerce City 7101 Birch St. X Welby 3174 E. 78th Ave. X X X X X
Arapahoe Highland Res. 8100 S. University Blvd. X X
Boulder Boulder 1405½ S. Foothills Hwy X
Longmont 440 Main St. X Denver
Auraria Lot R 12th St. & Auraria Parkway X Denver - CAMP 2105 Broadway X X X X X
Denver - Carriage 2325 Irving St. X X Firehouse #6 1300 Blake St. X
Douglas Chatfield Reservoir 11500 N. Roxborough Pk. Rd. X X
Jefferson Arvada 9101 W. 57th Ave. X X NREL 2054 Quaker St. X
Rocky Flats - N 16600 W. Hwy. 128 X X Rocky Flats - SE 9901 Indiana St. X
Welch 12400 W. Hwy. 285 X X Larimer
Fort Collins 708 S. Mason St. X X X 4407 S. College Ave. D 3416 La Porte Ave. X
Weld Greeley 905 10th Ave. X
3101 35th Ave. X
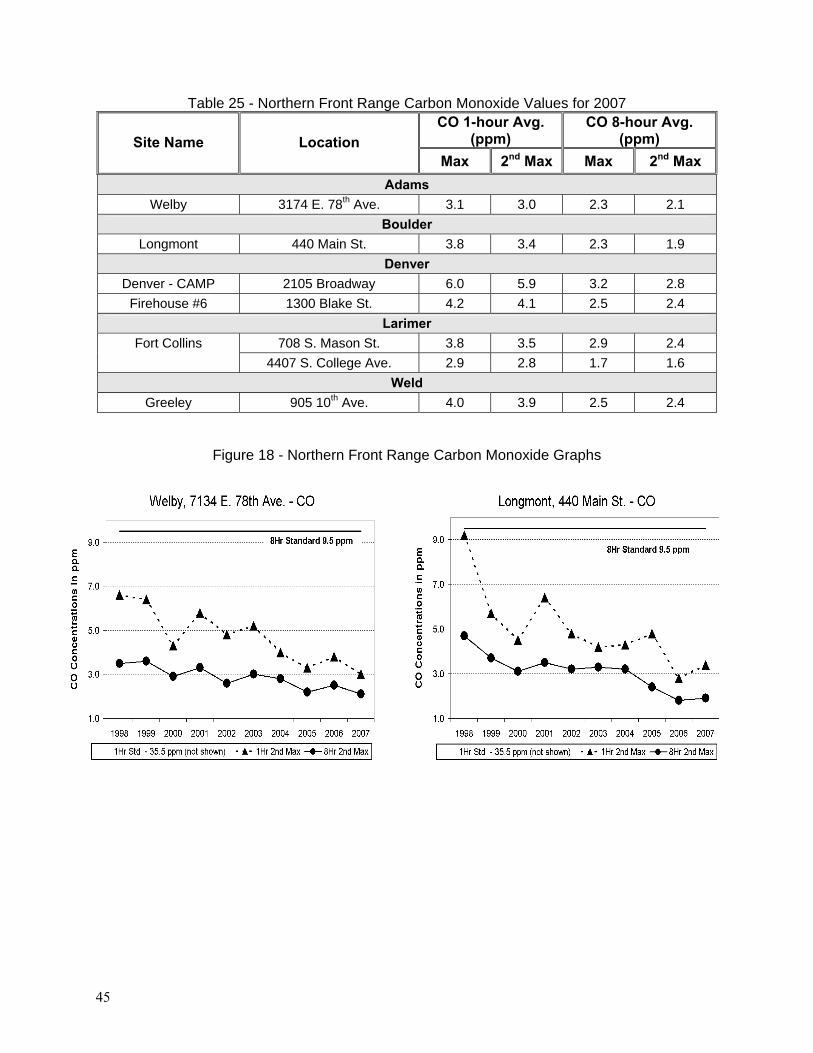
45
Table 25 - Northern Front Range Carbon Monoxide Values for 2007 CO 1-hour Avg.
(ppm) CO 8-hour Avg.
(ppm) Site Name Location Max 2nd Max Max 2nd Max
Adams Welby 3174 E. 78th Ave. 3.1 3.0 2.3 2.1
Boulder Longmont 440 Main St. 3.8 3.4 2.3 1.9
Denver Denver - CAMP 2105 Broadway 6.0 5.9 3.2 2.8
Firehouse #6 1300 Blake St. 4.2 4.1 2.5 2.4 Larimer
Fort Collins 708 S. Mason St. 3.8 3.5 2.9 2.4 4407 S. College Ave. 2.9 2.8 1.7 1.6
Weld Greeley 905 10th Ave. 4.0 3.9 2.5 2.4
Figure 18 - Northern Front Range Carbon Monoxide Graphs
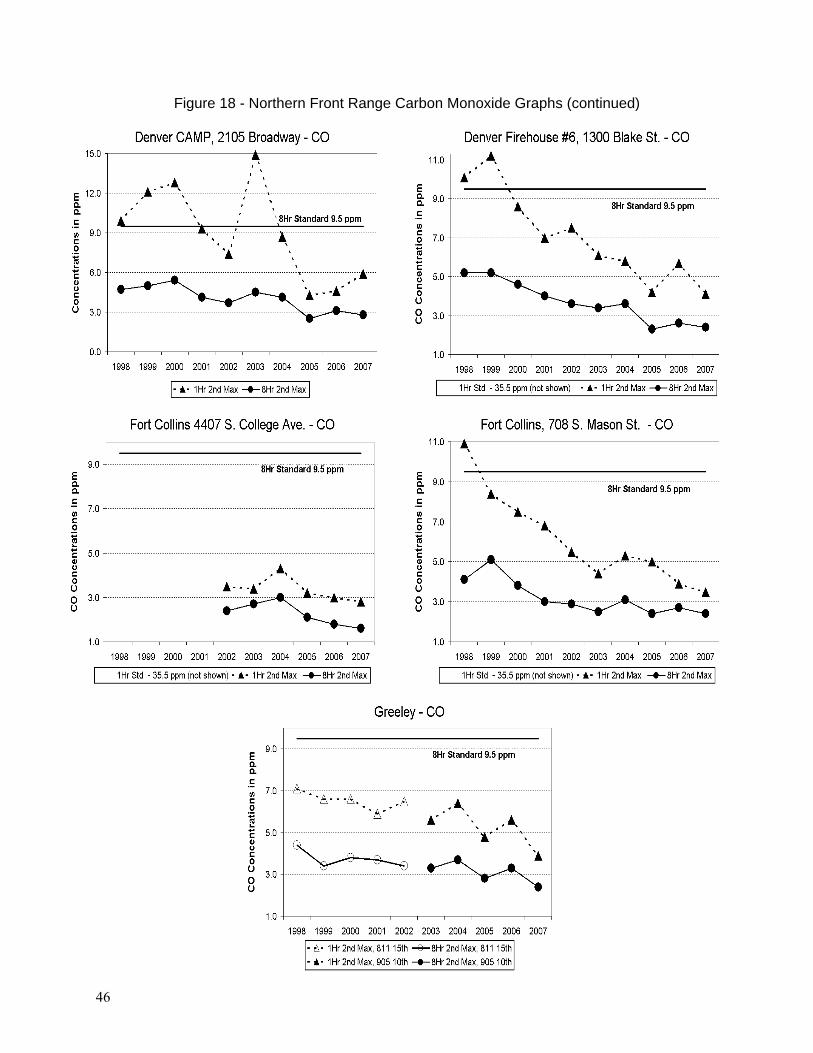
46
Figure 18 - Northern Front Range Carbon Monoxide Graphs (continued)
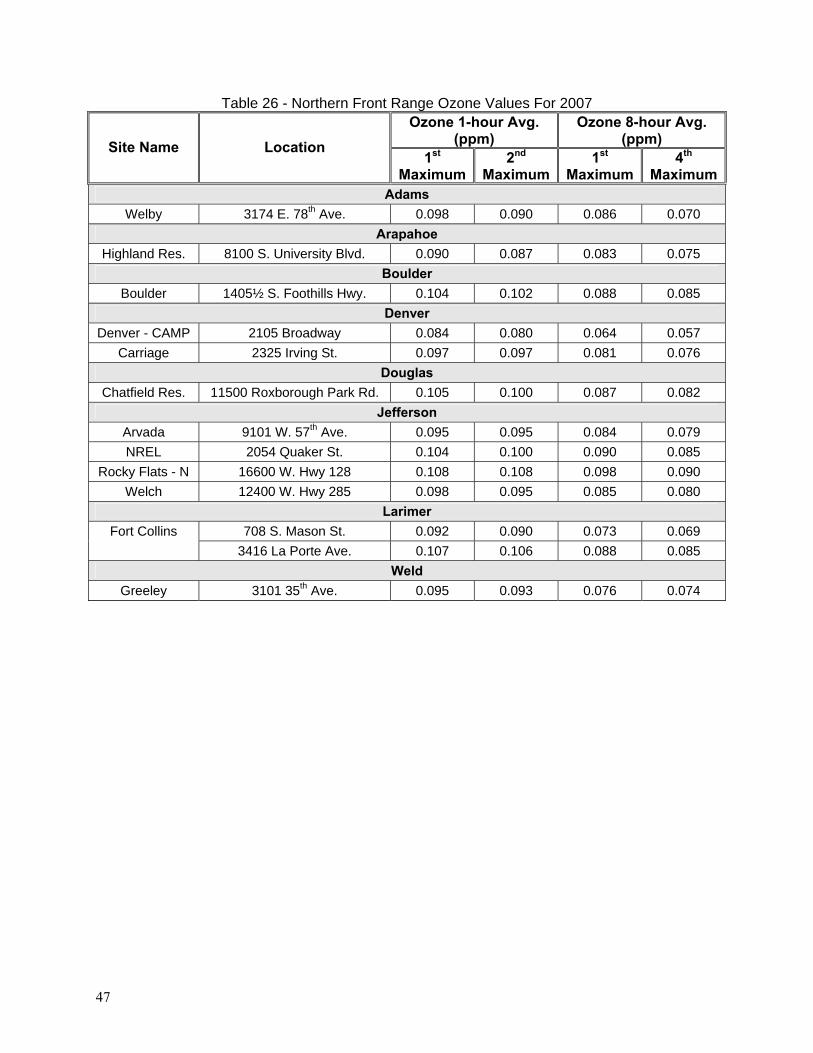
47
Table 26 - Northern Front Range Ozone Values For 2007 Ozone 1-hour Avg.
(ppm) Ozone 8-hour Avg.
(ppm) Site Name Location 1st
Maximum2nd
Maximum1st
Maximum 4th
MaximumAdams
Welby 3174 E. 78th Ave. 0.098 0.090 0.086 0.070 Arapahoe
Highland Res. 8100 S. University Blvd. 0.090 0.087 0.083 0.075 Boulder
Boulder 1405½ S. Foothills Hwy. 0.104 0.102 0.088 0.085 Denver
Denver - CAMP 2105 Broadway 0.084 0.080 0.064 0.057 Carriage 2325 Irving St. 0.097 0.097 0.081 0.076
Douglas Chatfield Res. 11500 Roxborough Park Rd. 0.105 0.100 0.087 0.082
Jefferson Arvada 9101 W. 57th Ave. 0.095 0.095 0.084 0.079 NREL 2054 Quaker St. 0.104 0.100 0.090 0.085
Rocky Flats - N 16600 W. Hwy 128 0.108 0.108 0.098 0.090 Welch 12400 W. Hwy 285 0.098 0.095 0.085 0.080
Larimer Fort Collins 708 S. Mason St. 0.092 0.090 0.073 0.069
3416 La Porte Ave. 0.107 0.106 0.088 0.085 Weld
Greeley 3101 35th Ave. 0.095 0.093 0.076 0.074
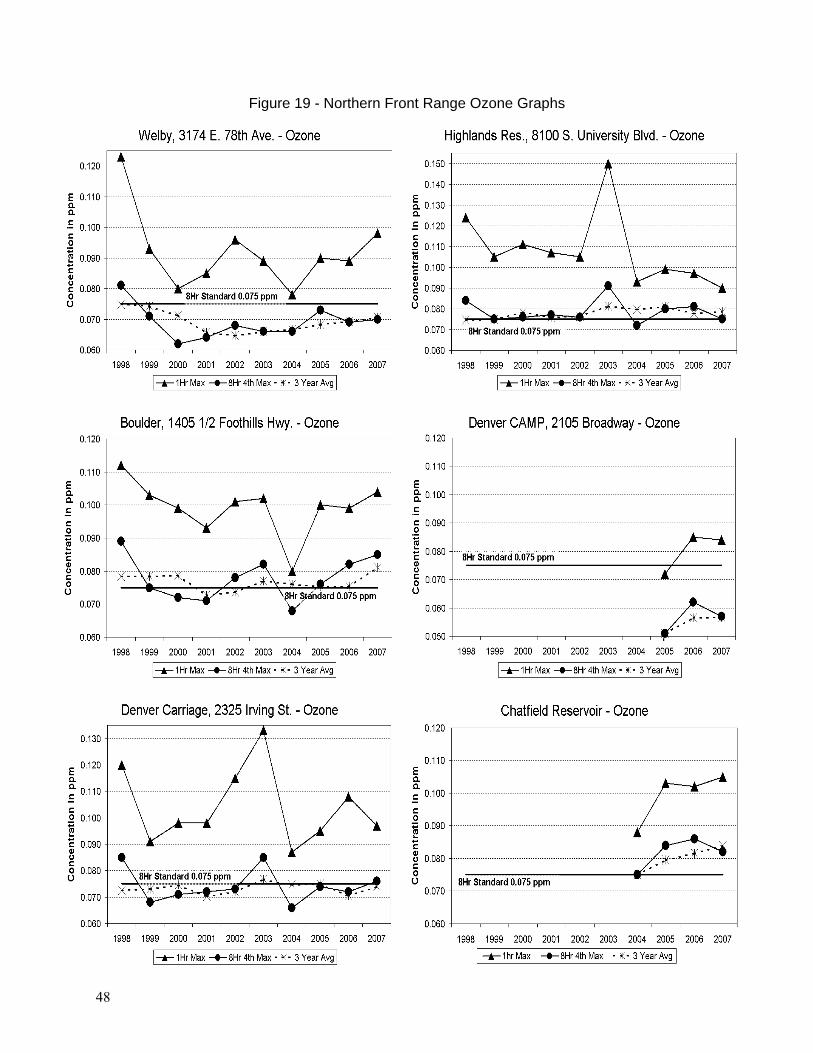
48
Figure 19 - Northern Front Range Ozone Graphs
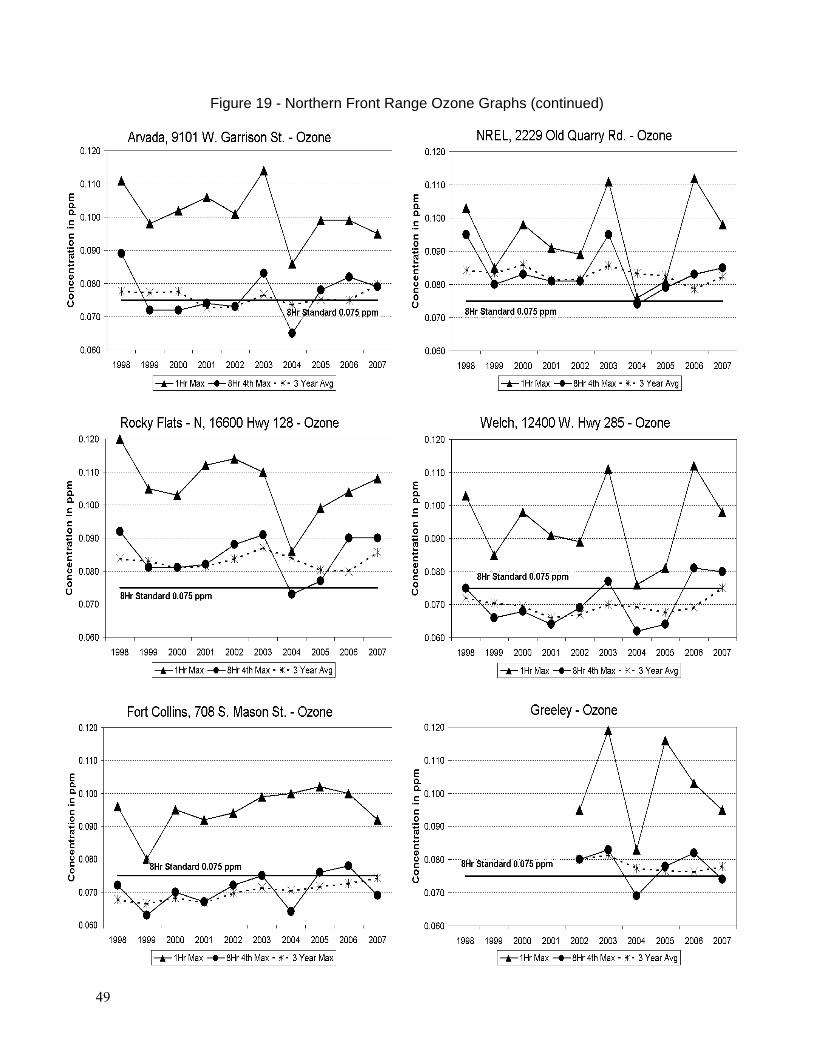
49
Figure 19 - Northern Front Range Ozone Graphs (continued)
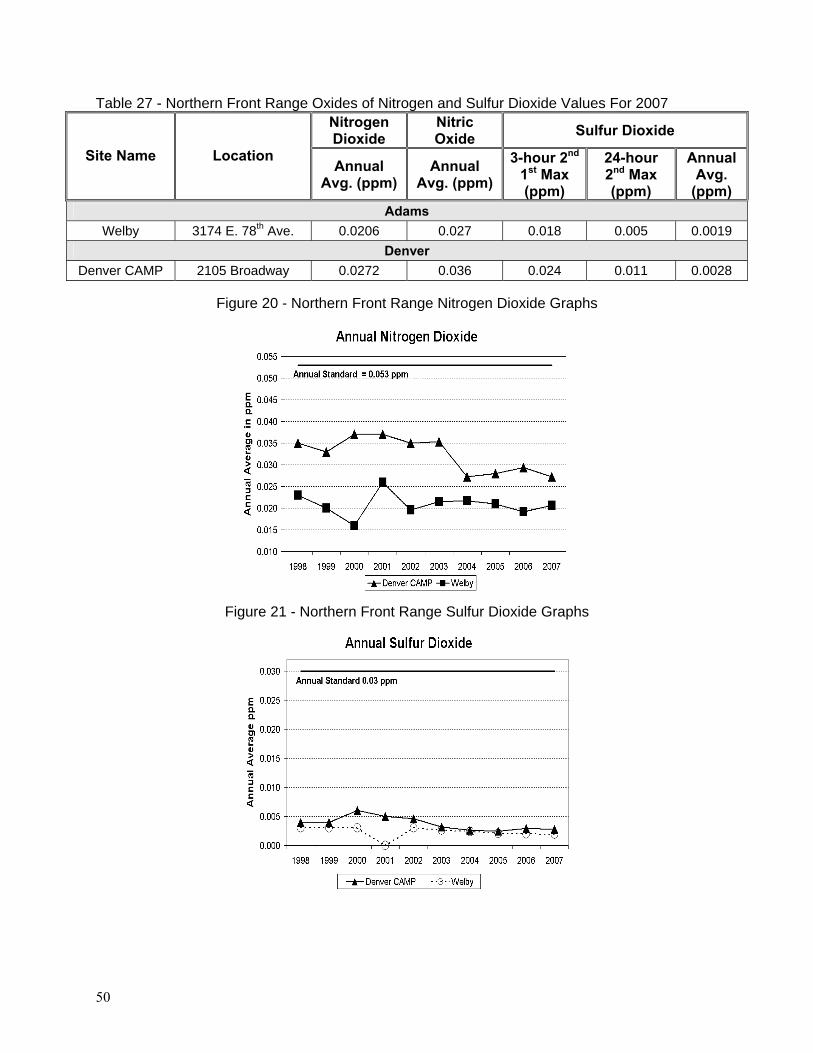
50
Table 27 - Northern Front Range Oxides of Nitrogen and Sulfur Dioxide Values For 2007 Nitrogen Dioxide
Nitric Oxide Sulfur Dioxide
Site Name Location Annual
Avg. (ppm) Annual
Avg. (ppm) 3-hour 2nd
1st Max (ppm)
24-hour 2nd Max (ppm)
Annual Avg.
(ppm) Adams
Welby 3174 E. 78th Ave. 0.0206 0.027 0.018 0.005 0.0019 Denver
Denver CAMP 2105 Broadway 0.0272 0.036 0.024 0.011 0.0028
Figure 20 - Northern Front Range Nitrogen Dioxide Graphs
Figure 21 - Northern Front Range Sulfur Dioxide Graphs
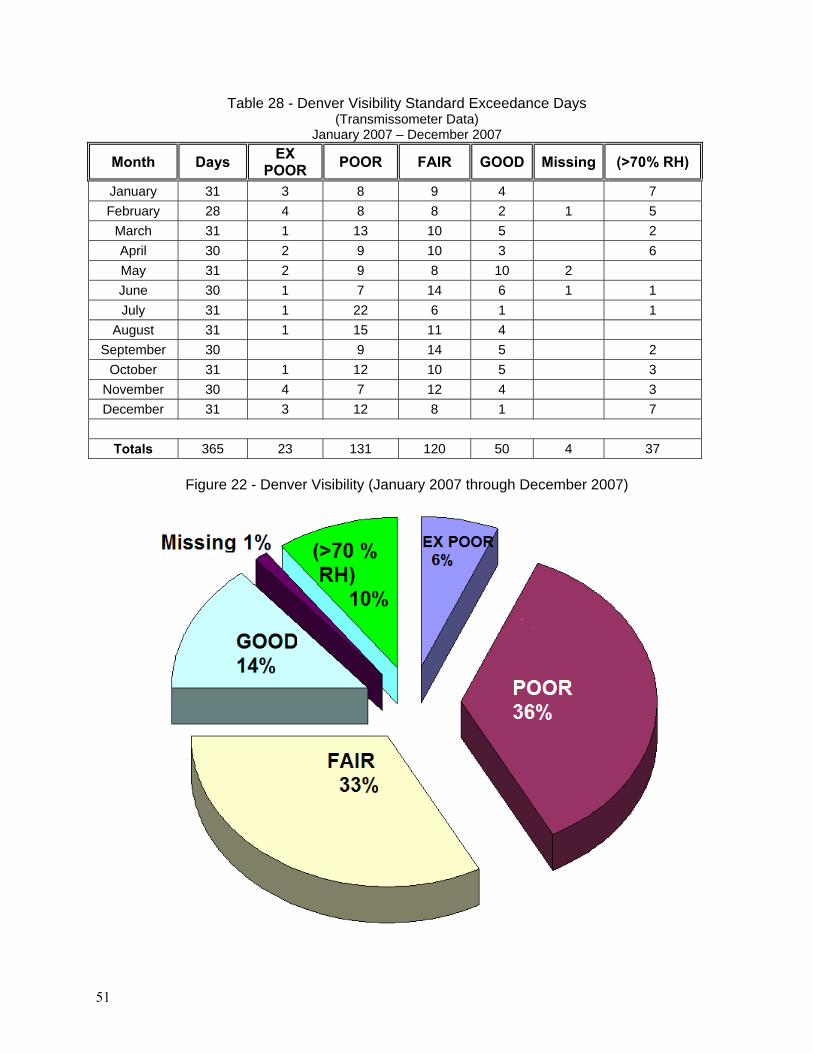
51
Table 28 - Denver Visibility Standard Exceedance Days (Transmissometer Data)
January 2007 – December 2007
Month Days EX POOR POOR FAIR GOOD Missing (>70% RH)
January 31 3 8 9 4 7 February 28 4 8 8 2 1 5
March 31 1 13 10 5 2 April 30 2 9 10 3 6 May 31 2 9 8 10 2 June 30 1 7 14 6 1 1 July 31 1 22 6 1 1
August 31 1 15 11 4 September 30 9 14 5 2
October 31 1 12 10 5 3 November 30 4 7 12 4 3 December 31 3 12 8 1 7
Totals 365 23 131 120 50 4 37
Figure 22 - Denver Visibility (January 2007 through December 2007)
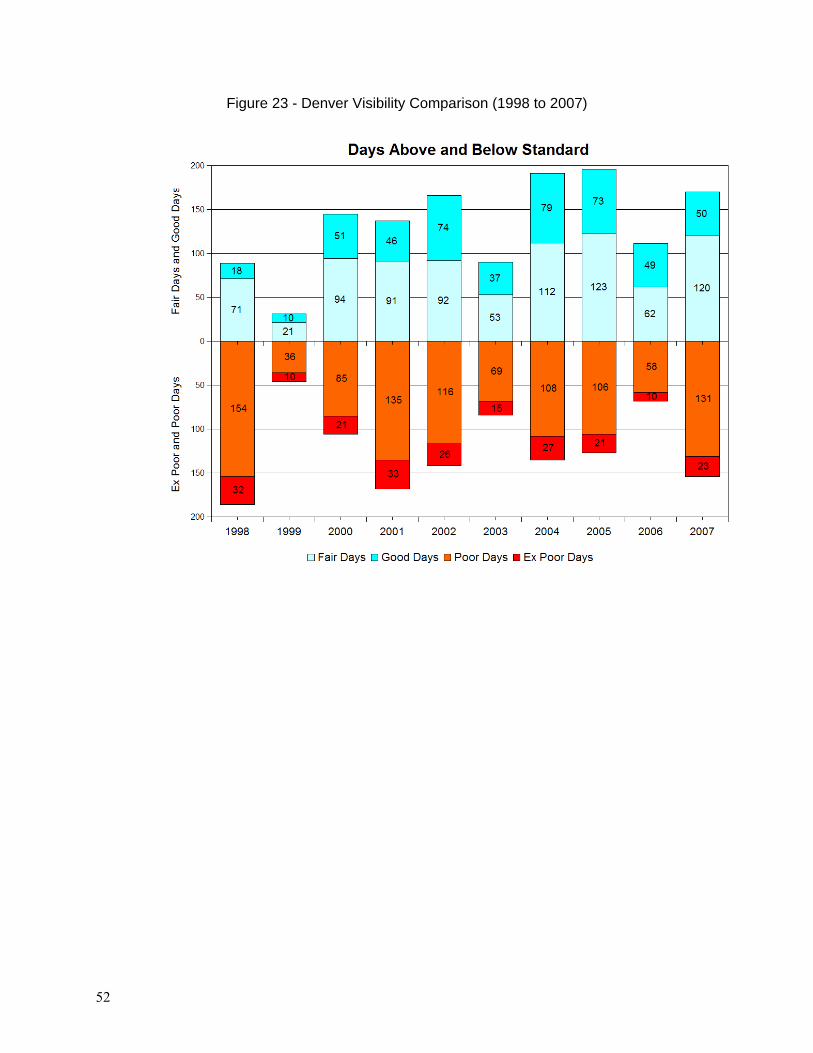
52
Figure 23 - Denver Visibility Comparison (1998 to 2007)
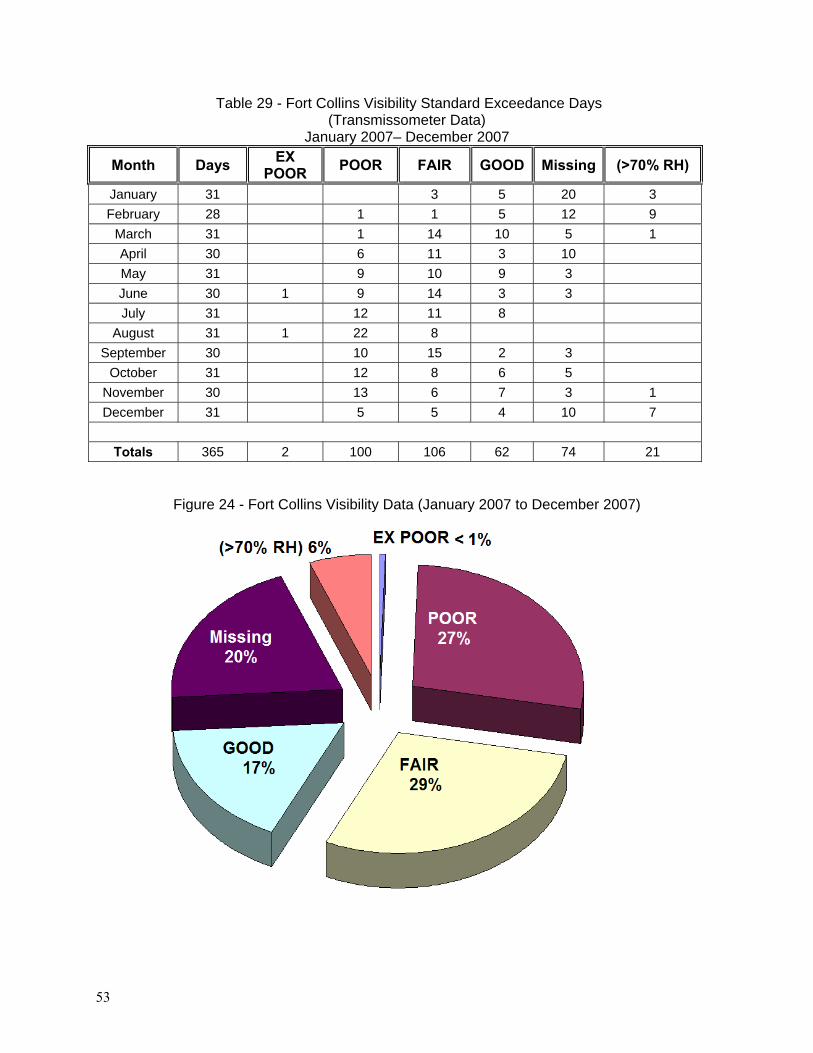
53
Table 29 - Fort Collins Visibility Standard Exceedance Days (Transmissometer Data)
January 2007– December 2007
Month Days EX POOR POOR FAIR GOOD Missing (>70% RH)
January 31 3 5 20 3 February 28 1 1 5 12 9
March 31 1 14 10 5 1 April 30 6 11 3 10 May 31 9 10 9 3 June 30 1 9 14 3 3 July 31 12 11 8
August 31 1 22 8 September 30 10 15 2 3
October 31 12 8 6 5 November 30 13 6 7 3 1 December 31 5 5 4 10 7
Totals 365 2 100 106 62 74 21
Figure 24 - Fort Collins Visibility Data (January 2007 to December 2007)
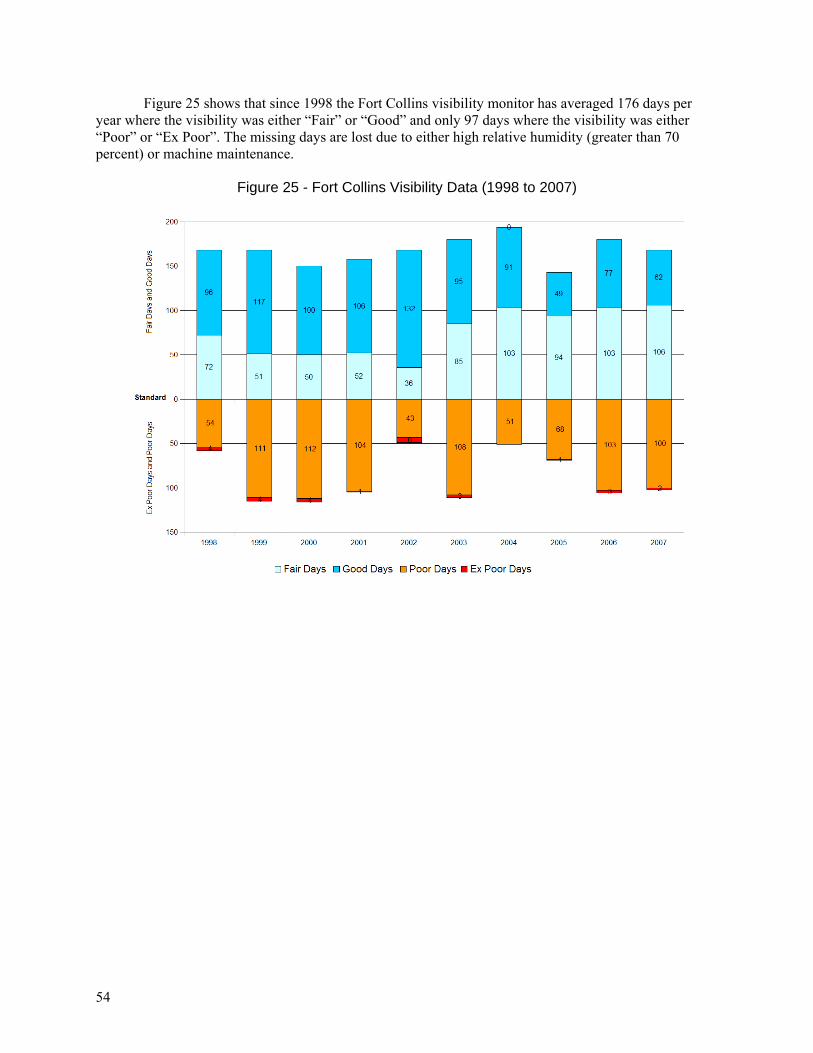
54
Figure 25 shows that since 1998 the Fort Collins visibility monitor has averaged 176 days per year where the visibility was either “Fair” or “Good” and only 97 days where the visibility was either “Poor” or “Ex Poor”. The missing days are lost due to either high relative humidity (greater than 70 percent) or machine maintenance.
Figure 25 - Fort Collins Visibility Data (1998 to 2007)
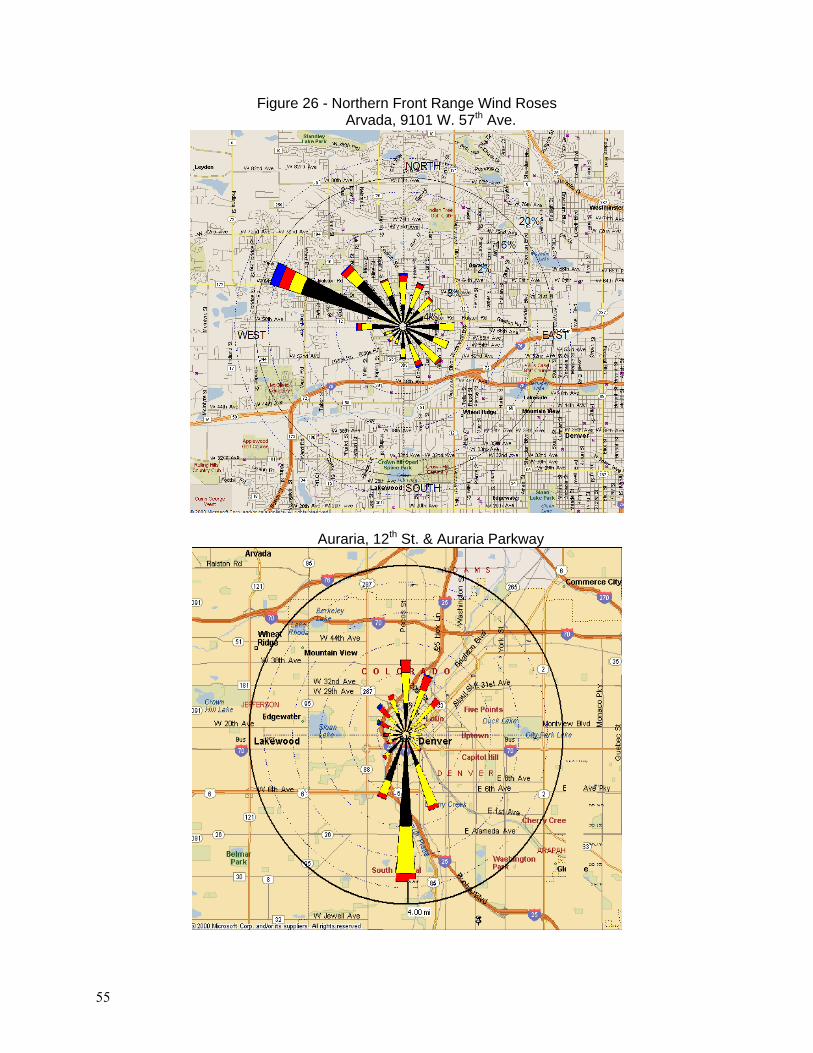
55
Figure 26 - Northern Front Range Wind Roses Arvada, 9101 W. 57th Ave.
Auraria, 12th St. & Auraria Parkway
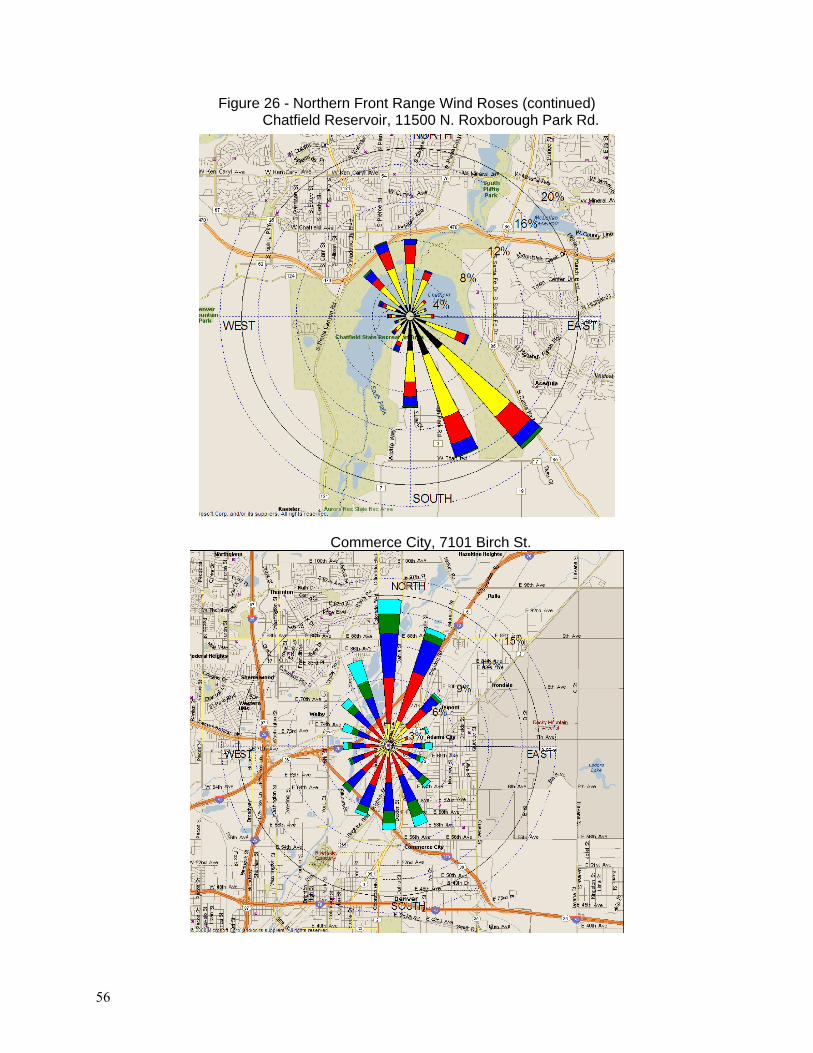
56
Figure 26 - Northern Front Range Wind Roses (continued) Chatfield Reservoir, 11500 N. Roxborough Park Rd.
Commerce City, 7101 Birch St.
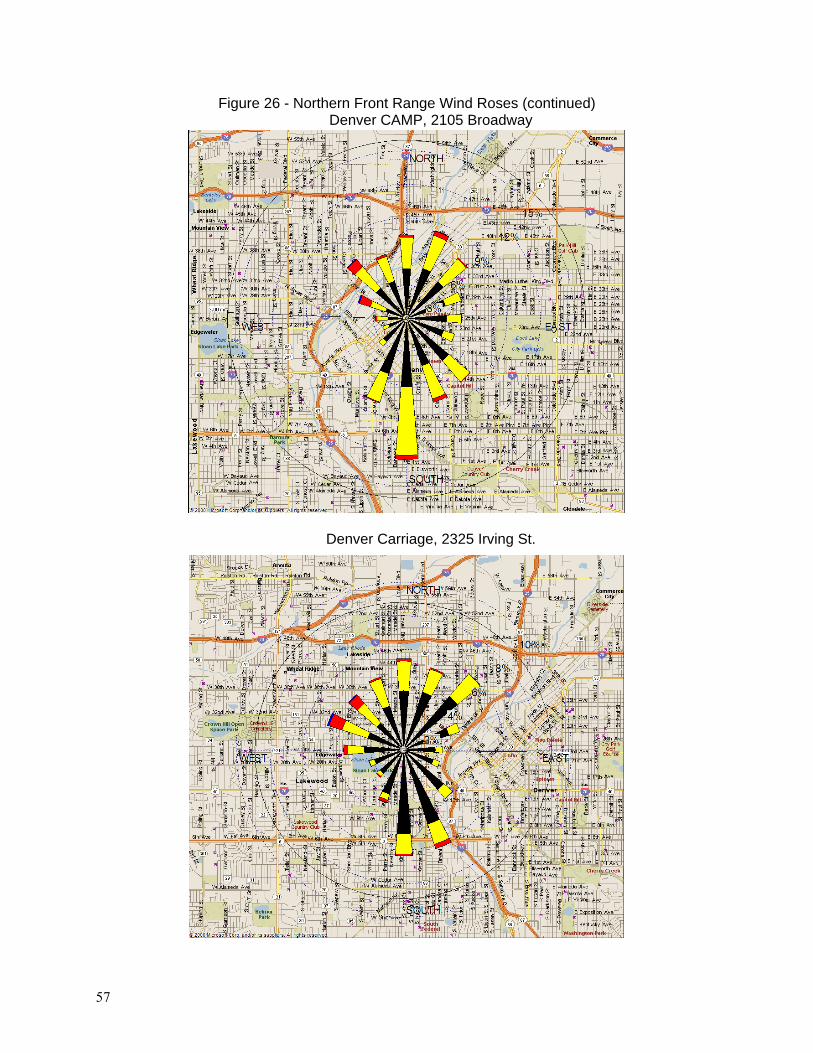
57
Figure 26 - Northern Front Range Wind Roses (continued) Denver CAMP, 2105 Broadway
Denver Carriage, 2325 Irving St.
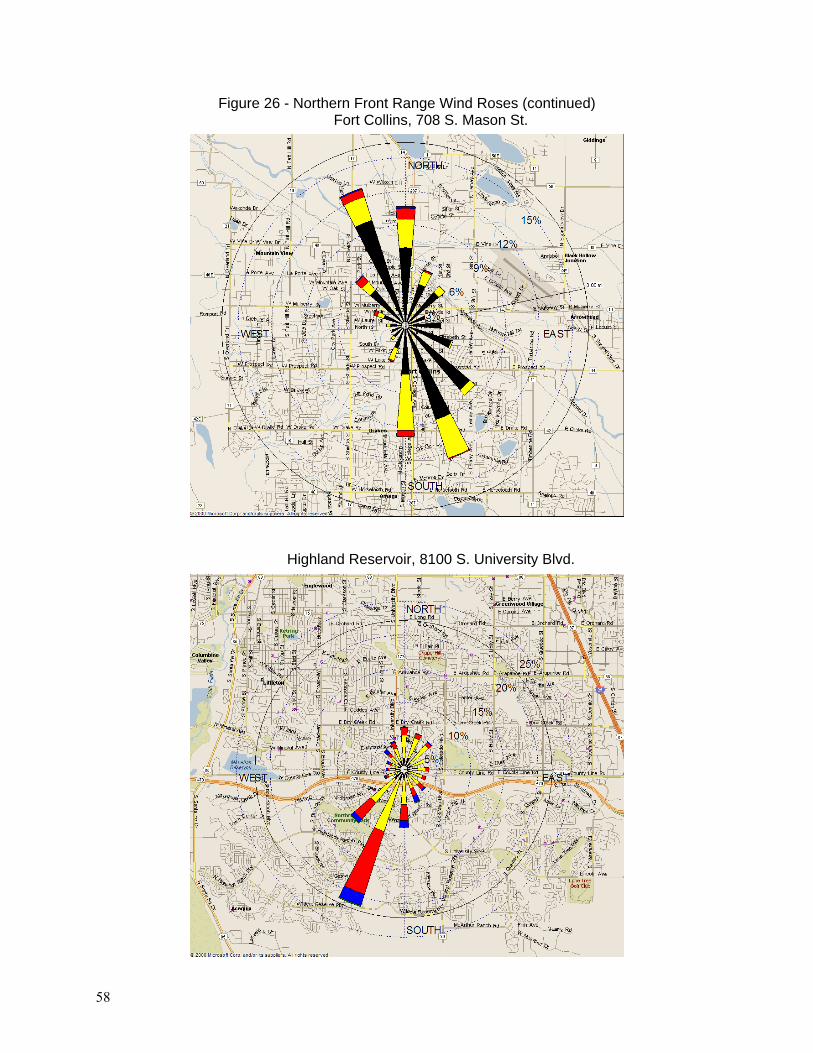
58
Figure 26 - Northern Front Range Wind Roses (continued) Fort Collins, 708 S. Mason St.
Highland Reservoir, 8100 S. University Blvd.
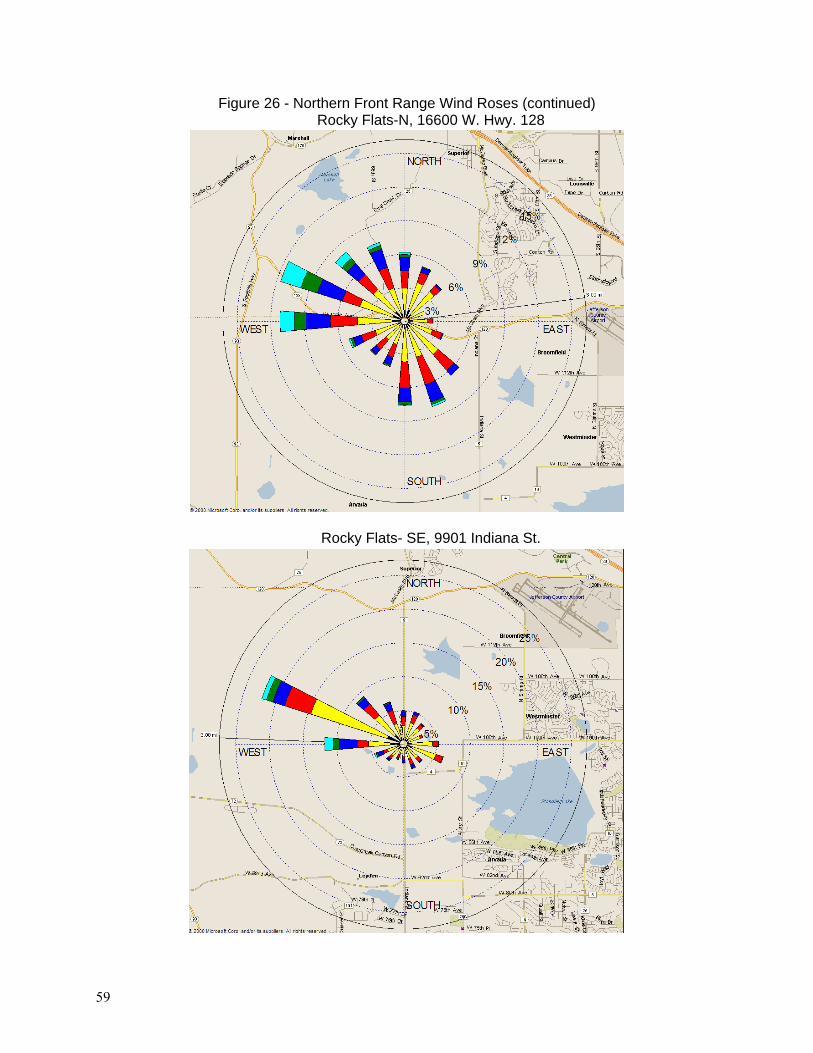
59
Figure 26 - Northern Front Range Wind Roses (continued) Rocky Flats-N, 16600 W. Hwy. 128
Rocky Flats- SE, 9901 Indiana St.
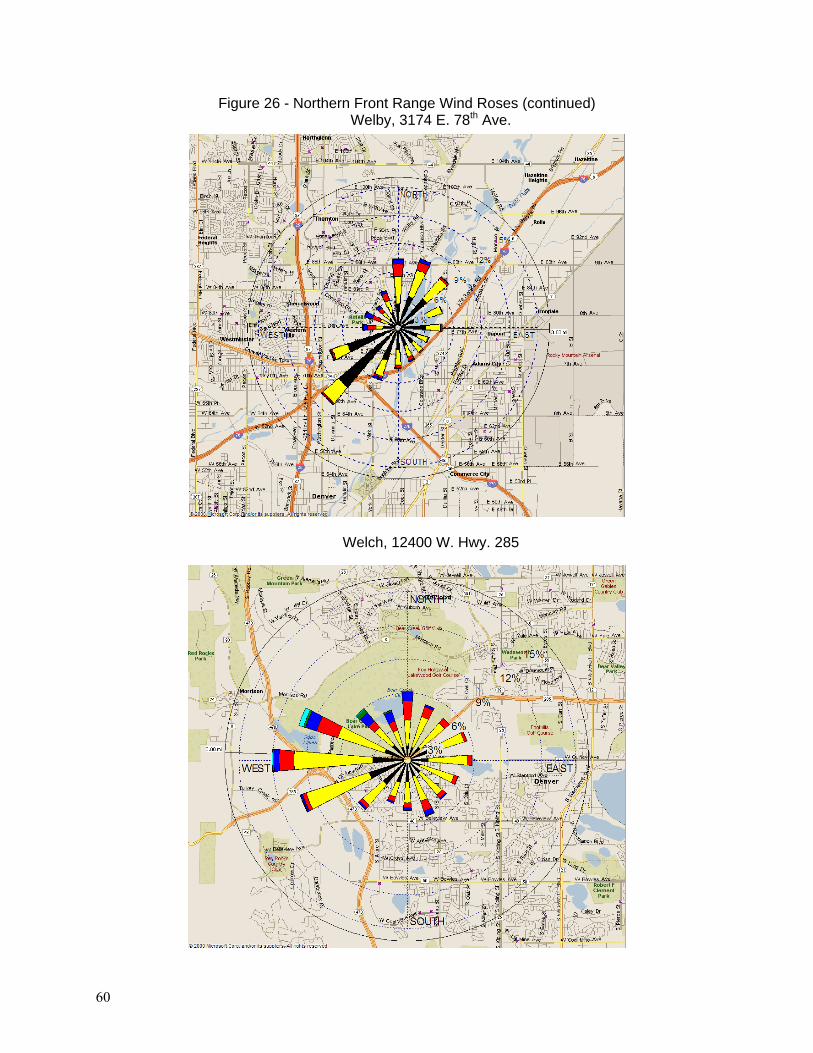
60
Figure 26 - Northern Front Range Wind Roses (continued) Welby, 3174 E. 78th Ave.
Welch, 12400 W. Hwy. 285
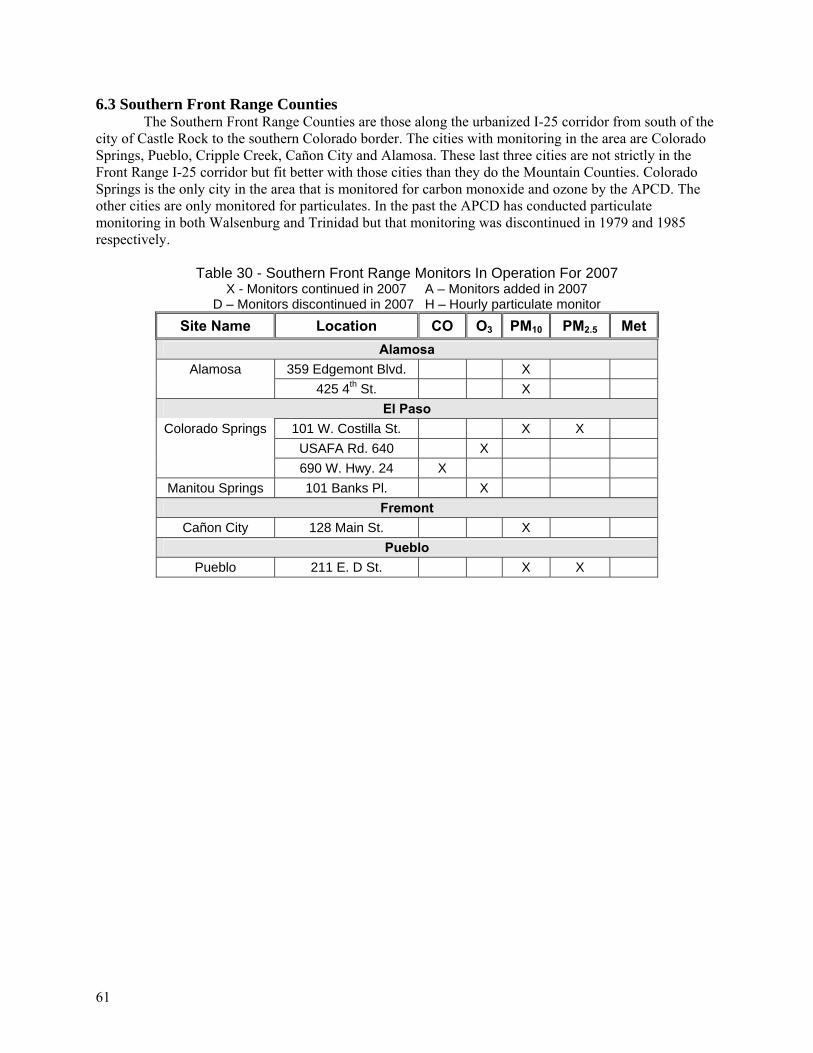
61
6.3 Southern Front Range Counties The Southern Front Range Counties are those along the urbanized I-25 corridor from south of the
city of Castle Rock to the southern Colorado border. The cities with monitoring in the area are Colorado Springs, Pueblo, Cripple Creek, Cañon City and Alamosa. These last three cities are not strictly in the Front Range I-25 corridor but fit better with those cities than they do the Mountain Counties. Colorado Springs is the only city in the area that is monitored for carbon monoxide and ozone by the APCD. The other cities are only monitored for particulates. In the past the APCD has conducted particulate monitoring in both Walsenburg and Trinidad but that monitoring was discontinued in 1979 and 1985 respectively.
Table 30 - Southern Front Range Monitors In Operation For 2007 X - Monitors continued in 2007 A – Monitors added in 2007
D – Monitors discontinued in 2007 H – Hourly particulate monitor Site Name Location CO O3 PM10 PM2.5 Met
Alamosa Alamosa 359 Edgemont Blvd. X
425 4th St. X El Paso
Colorado Springs 101 W. Costilla St. X X USAFA Rd. 640 X 690 W. Hwy. 24 X
Manitou Springs 101 Banks Pl. X Fremont
Cañon City 128 Main St. X Pueblo
Pueblo 211 E. D St. X X
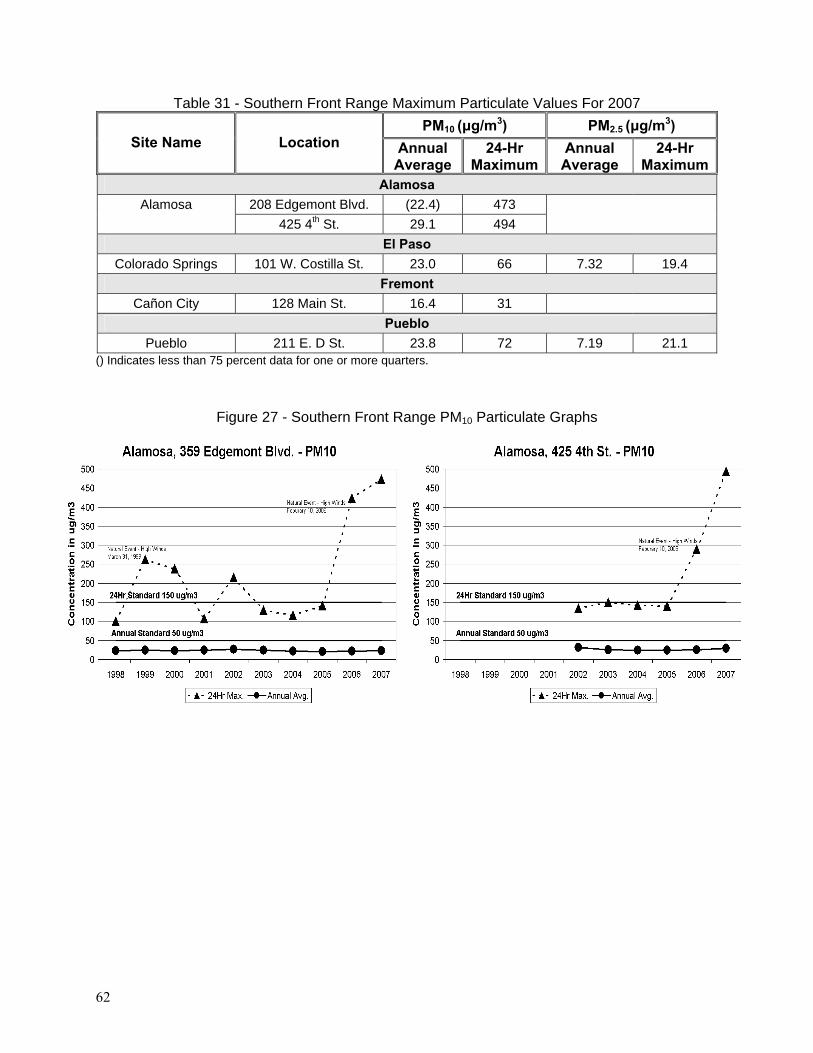
62
Table 31 - Southern Front Range Maximum Particulate Values For 2007 PM10 (μg/m3) PM2.5 (μg/m3)
Site Name Location Annual Average
24-Hr Maximum
Annual Average
24-Hr Maximum
Alamosa Alamosa 208 Edgemont Blvd. (22.4) 473
425 4th St. 29.1 494 El Paso
Colorado Springs 101 W. Costilla St. 23.0 66 7.32 19.4 Fremont
Cañon City 128 Main St. 16.4 31 Pueblo
Pueblo 211 E. D St. 23.8 72 7.19 21.1 () Indicates less than 75 percent data for one or more quarters.
Figure 27 - Southern Front Range PM10 Particulate Graphs
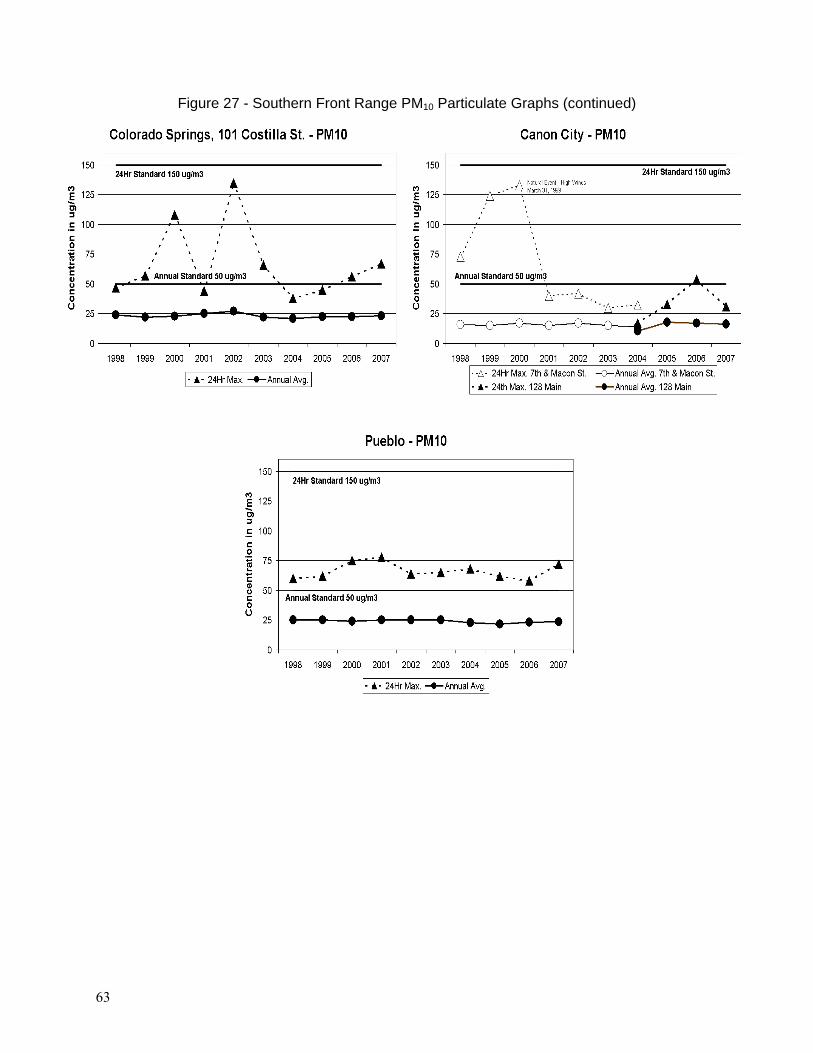
63
Figure 27 - Southern Front Range PM10 Particulate Graphs (continued)
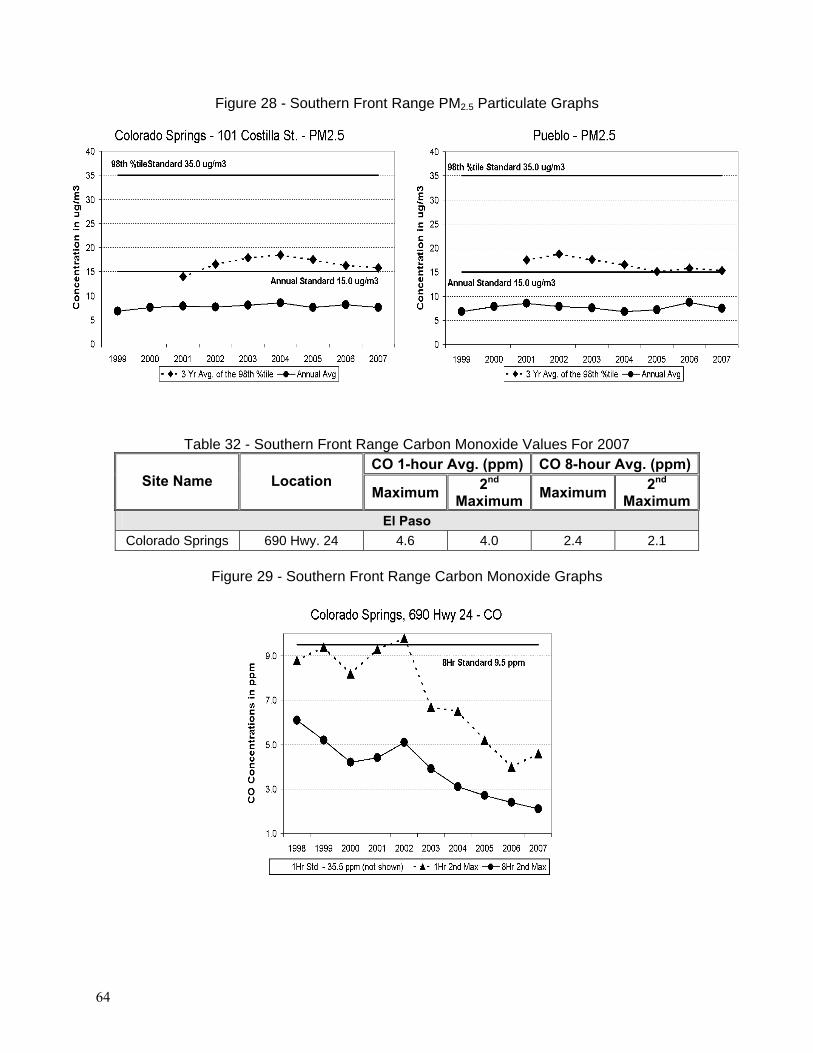
64
Figure 28 - Southern Front Range PM2.5 Particulate Graphs
Table 32 - Southern Front Range Carbon Monoxide Values For 2007 CO 1-hour Avg. (ppm) CO 8-hour Avg. (ppm)
Site Name Location Maximum 2nd
Maximum Maximum 2nd Maximum
El Paso Colorado Springs 690 Hwy. 24 4.6 4.0 2.4 2.1
Figure 29 - Southern Front Range Carbon Monoxide Graphs
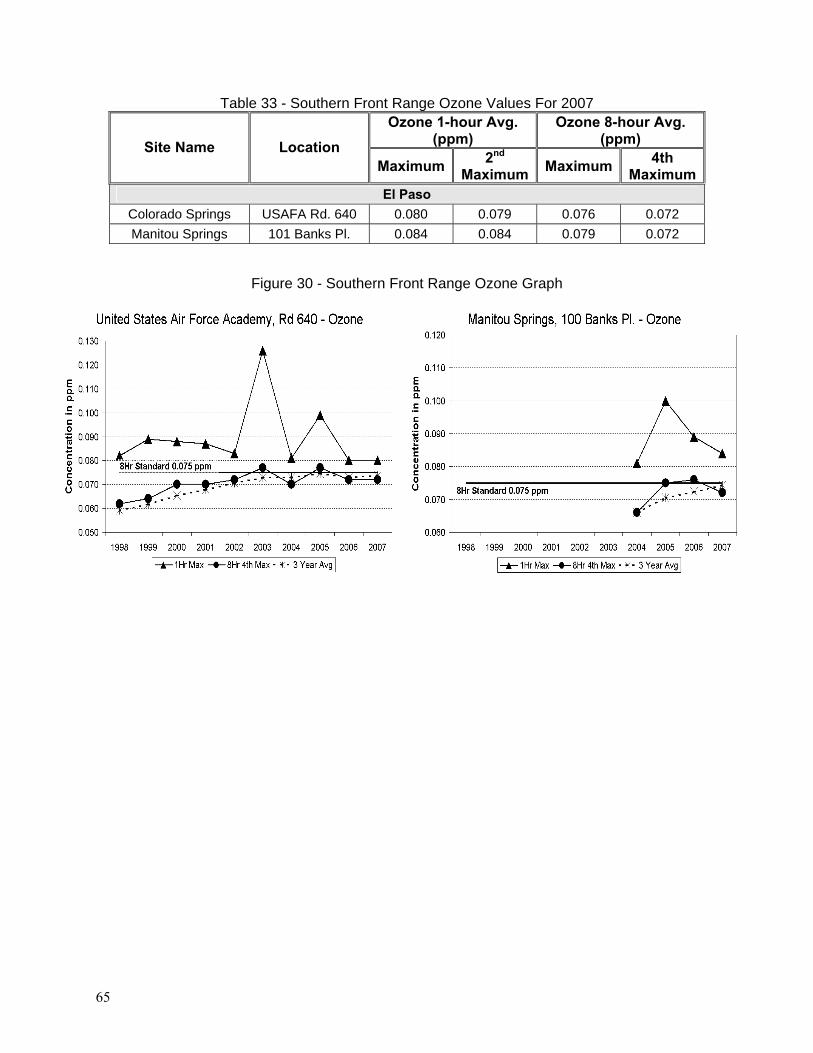
65
Table 33 - Southern Front Range Ozone Values For 2007 Ozone 1-hour Avg.
(ppm) Ozone 8-hour Avg.
(ppm) Site Name Location Maximum 2nd
Maximum Maximum 4th Maximum
El Paso Colorado Springs USAFA Rd. 640 0.080 0.079 0.076 0.072 Manitou Springs 101 Banks Pl. 0.084 0.084 0.079 0.072
Figure 30 - Southern Front Range Ozone Graph
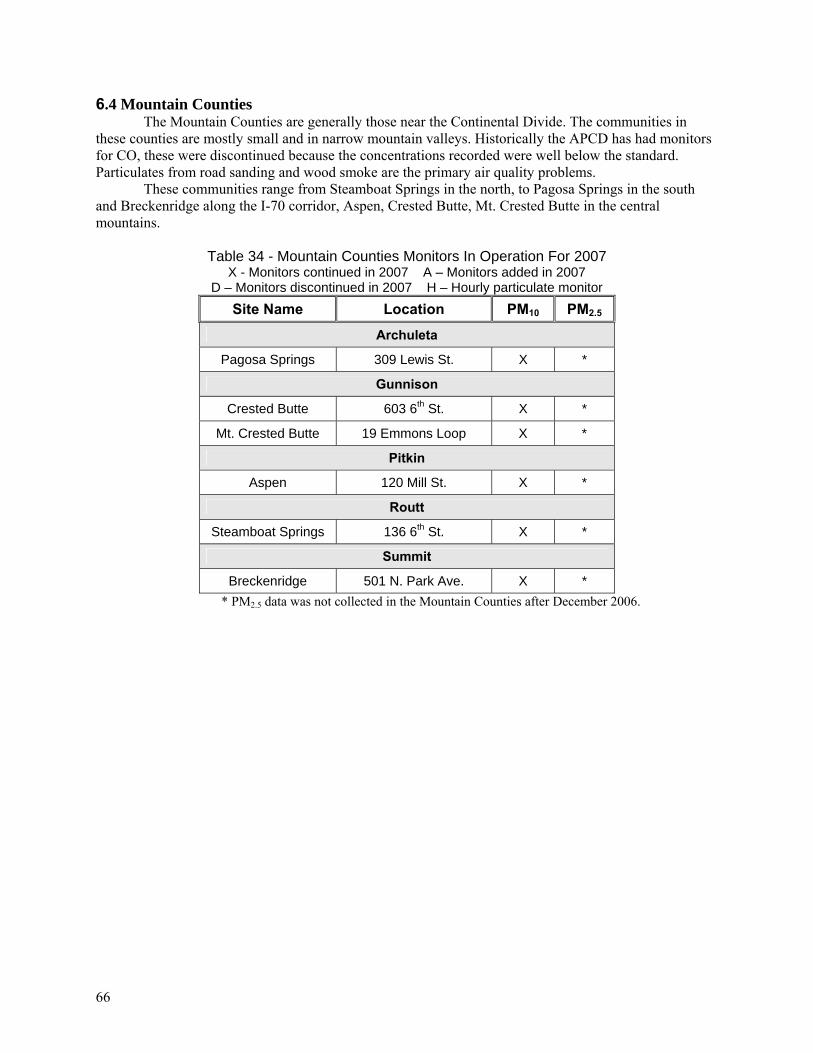
66
6.4 Mountain Counties The Mountain Counties are generally those near the Continental Divide. The communities in
these counties are mostly small and in narrow mountain valleys. Historically the APCD has had monitors for CO, these were discontinued because the concentrations recorded were well below the standard. Particulates from road sanding and wood smoke are the primary air quality problems.
These communities range from Steamboat Springs in the north, to Pagosa Springs in the south and Breckenridge along the I-70 corridor, Aspen, Crested Butte, Mt. Crested Butte in the central mountains.
Table 34 - Mountain Counties Monitors In Operation For 2007 X - Monitors continued in 2007 A – Monitors added in 2007
D – Monitors discontinued in 2007 H – Hourly particulate monitor Site Name Location PM10 PM2.5
Archuleta
Pagosa Springs 309 Lewis St. X *
Gunnison
Crested Butte 603 6th St. X *
Mt. Crested Butte 19 Emmons Loop X *
Pitkin
Aspen 120 Mill St. X *
Routt
Steamboat Springs 136 6th St. X *
Summit
Breckenridge 501 N. Park Ave. X * * PM2.5 data was not collected in the Mountain Counties after December 2006.
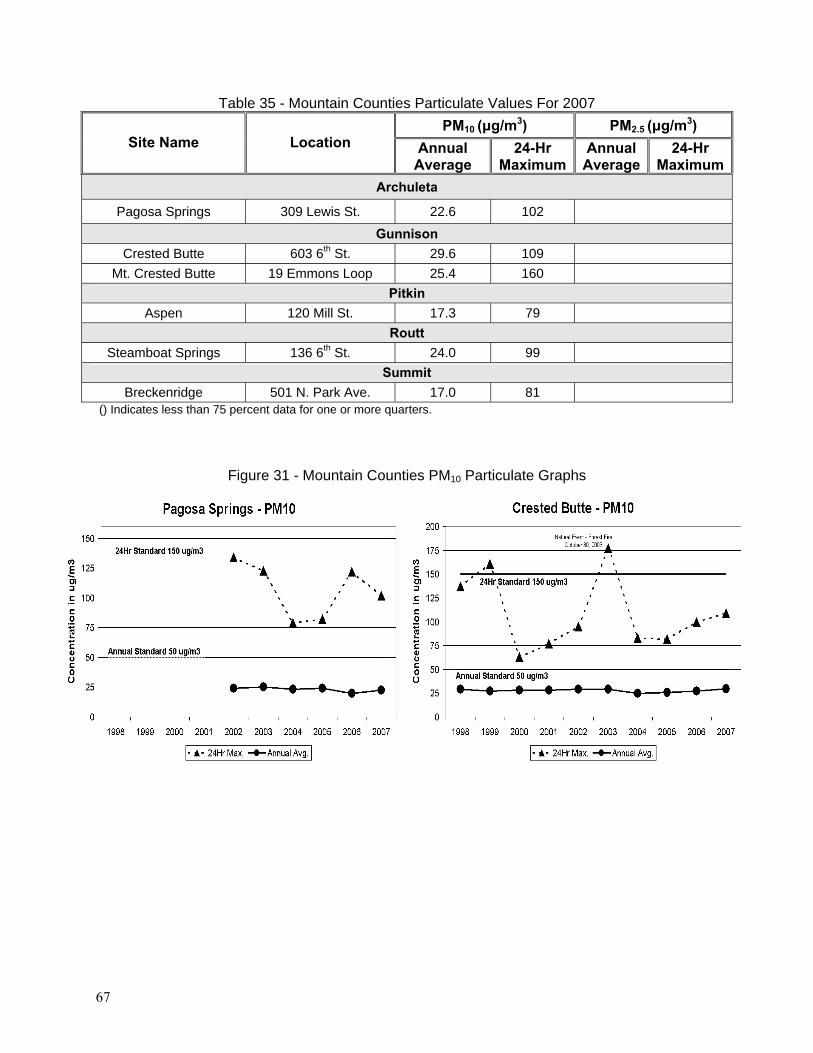
67
Table 35 - Mountain Counties Particulate Values For 2007 PM10 (μg/m3) PM2.5 (μg/m3)
Site Name Location Annual Average
24-Hr Maximum
Annual Average
24-Hr Maximum
Archuleta
Pagosa Springs 309 Lewis St. 22.6 102
Gunnison Crested Butte 603 6th St. 29.6 109
Mt. Crested Butte 19 Emmons Loop 25.4 160 Pitkin
Aspen 120 Mill St. 17.3 79 Routt
Steamboat Springs 136 6th St. 24.0 99 Summit
Breckenridge 501 N. Park Ave. 17.0 81 () Indicates less than 75 percent data for one or more quarters.
Figure 31 - Mountain Counties PM10 Particulate Graphs
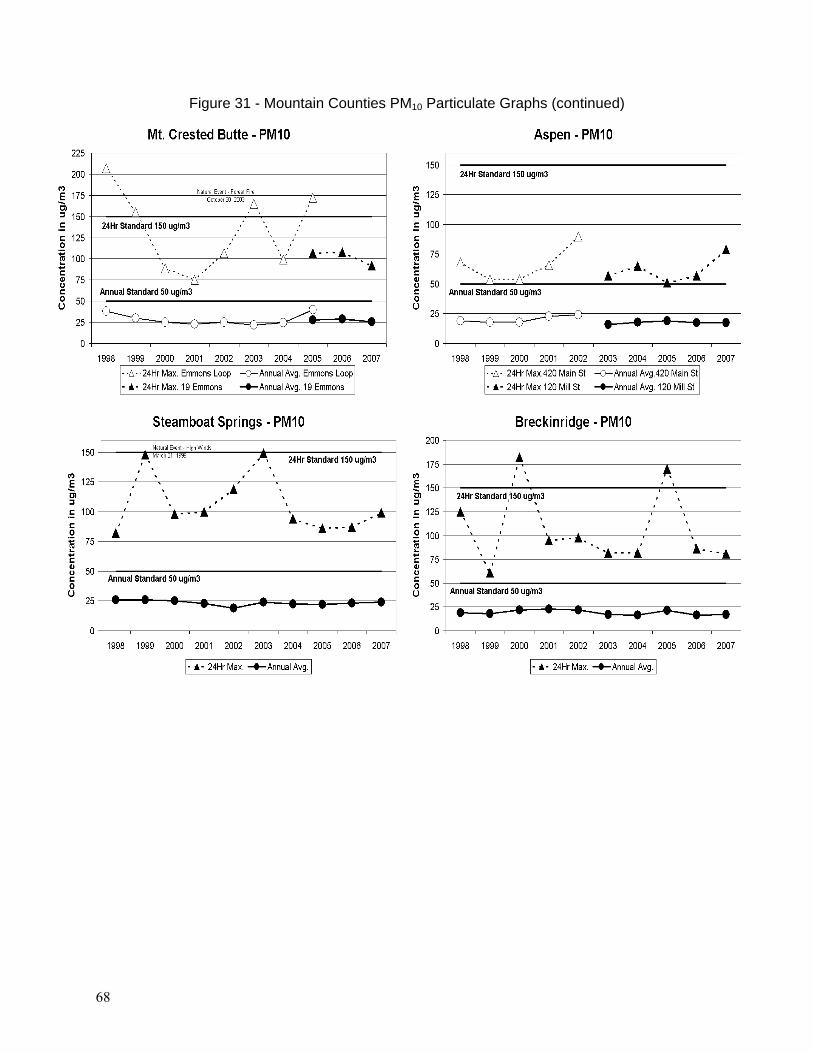
68
Figure 31 - Mountain Counties PM10 Particulate Graphs (continued)
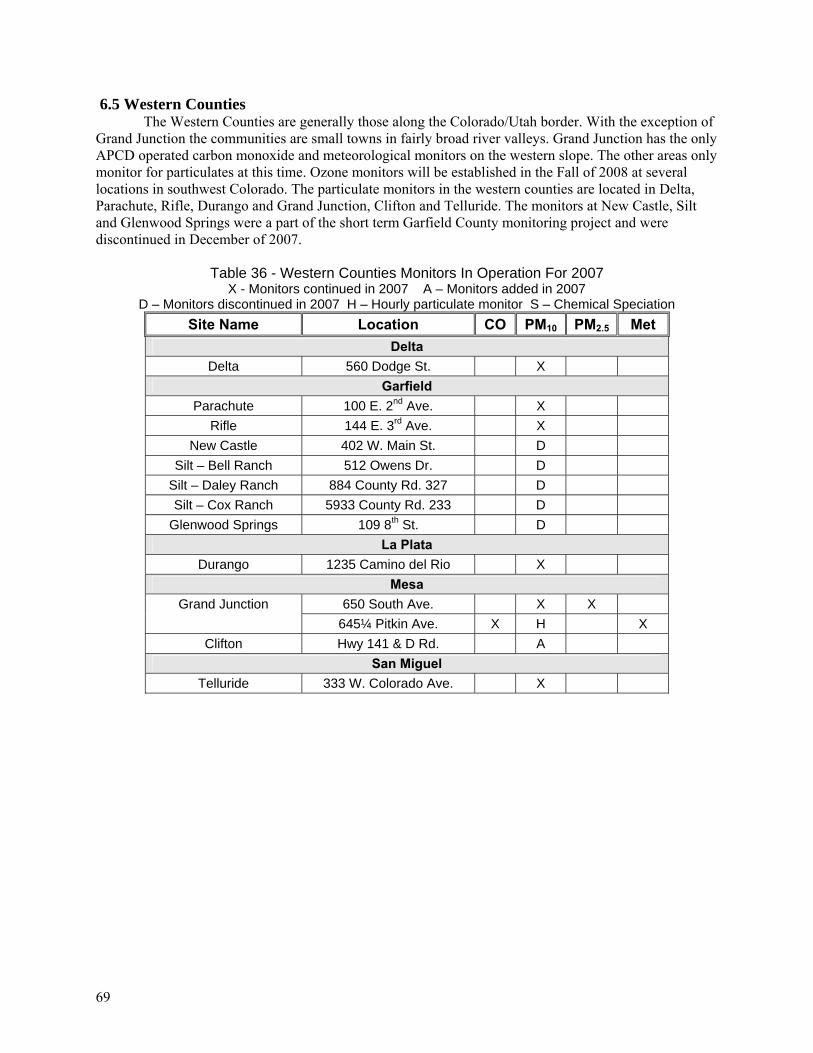
69
6.5 Western Counties The Western Counties are generally those along the Colorado/Utah border. With the exception of
Grand Junction the communities are small towns in fairly broad river valleys. Grand Junction has the only APCD operated carbon monoxide and meteorological monitors on the western slope. The other areas only monitor for particulates at this time. Ozone monitors will be established in the Fall of 2008 at several locations in southwest Colorado. The particulate monitors in the western counties are located in Delta, Parachute, Rifle, Durango and Grand Junction, Clifton and Telluride. The monitors at New Castle, Silt and Glenwood Springs were a part of the short term Garfield County monitoring project and were discontinued in December of 2007.
Table 36 - Western Counties Monitors In Operation For 2007 X - Monitors continued in 2007 A – Monitors added in 2007
D – Monitors discontinued in 2007 H – Hourly particulate monitor S – Chemical Speciation Site Name Location CO PM10 PM2.5 Met
Delta Delta 560 Dodge St. X
Garfield Parachute 100 E. 2nd Ave. X
Rifle 144 E. 3rd Ave. X New Castle 402 W. Main St. D
Silt – Bell Ranch 512 Owens Dr. D Silt – Daley Ranch 884 County Rd. 327 D Silt – Cox Ranch 5933 County Rd. 233 D
Glenwood Springs 109 8th St. D La Plata
Durango 1235 Camino del Rio X Mesa
Grand Junction 650 South Ave. X X 645¼ Pitkin Ave. X H X
Clifton Hwy 141 & D Rd. A San Miguel
Telluride 333 W. Colorado Ave. X
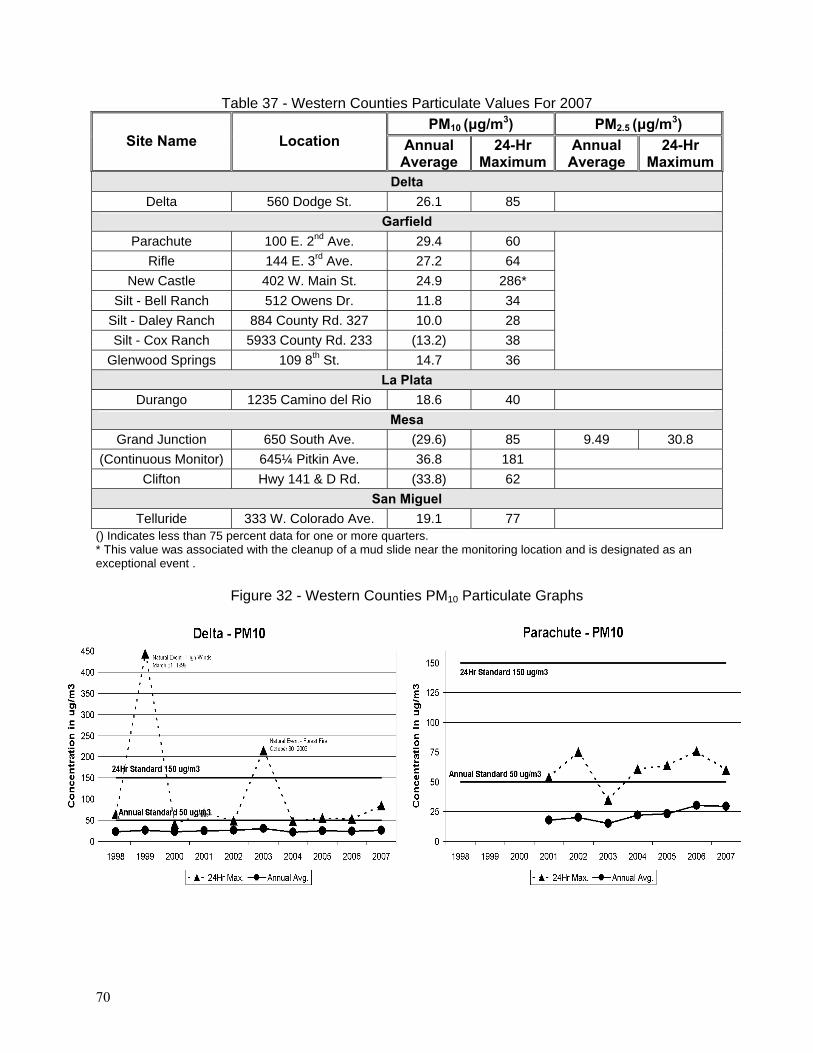
70
Table 37 - Western Counties Particulate Values For 2007 PM10 (μg/m3) PM2.5 (μg/m3)
Site Name Location Annual Average
24-Hr Maximum
Annual Average
24-Hr Maximum
Delta Delta 560 Dodge St. 26.1 85
Garfield Parachute 100 E. 2nd Ave. 29.4 60
Rifle 144 E. 3rd Ave. 27.2 64 New Castle 402 W. Main St. 24.9 286*
Silt - Bell Ranch 512 Owens Dr. 11.8 34 Silt - Daley Ranch 884 County Rd. 327 10.0 28 Silt - Cox Ranch 5933 County Rd. 233 (13.2) 38
Glenwood Springs 109 8th St. 14.7 36 La Plata
Durango 1235 Camino del Rio 18.6 40 Mesa
Grand Junction 650 South Ave. (29.6) 85 9.49 30.8 (Continuous Monitor) 645¼ Pitkin Ave. 36.8 181
Clifton Hwy 141 & D Rd. (33.8) 62 San Miguel
Telluride 333 W. Colorado Ave. 19.1 77 () Indicates less than 75 percent data for one or more quarters. * This value was associated with the cleanup of a mud slide near the monitoring location and is designated as an exceptional event .
Figure 32 - Western Counties PM10 Particulate Graphs
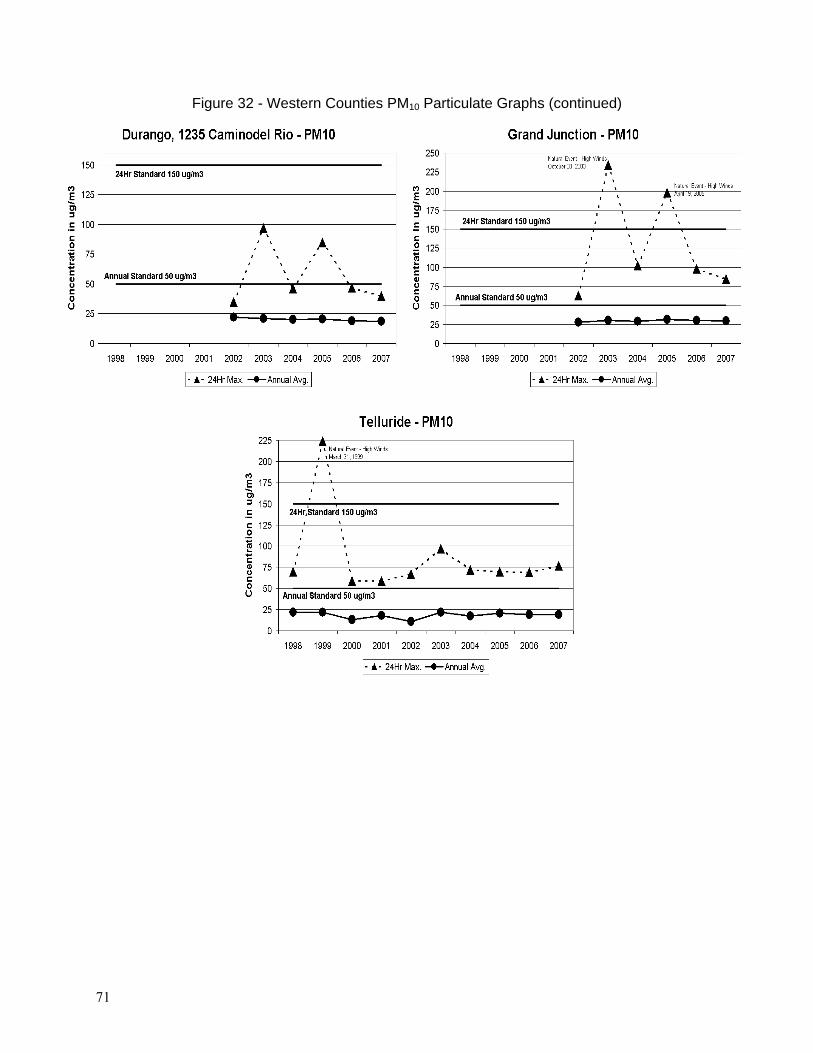
71
Figure 32 - Western Counties PM10 Particulate Graphs (continued)
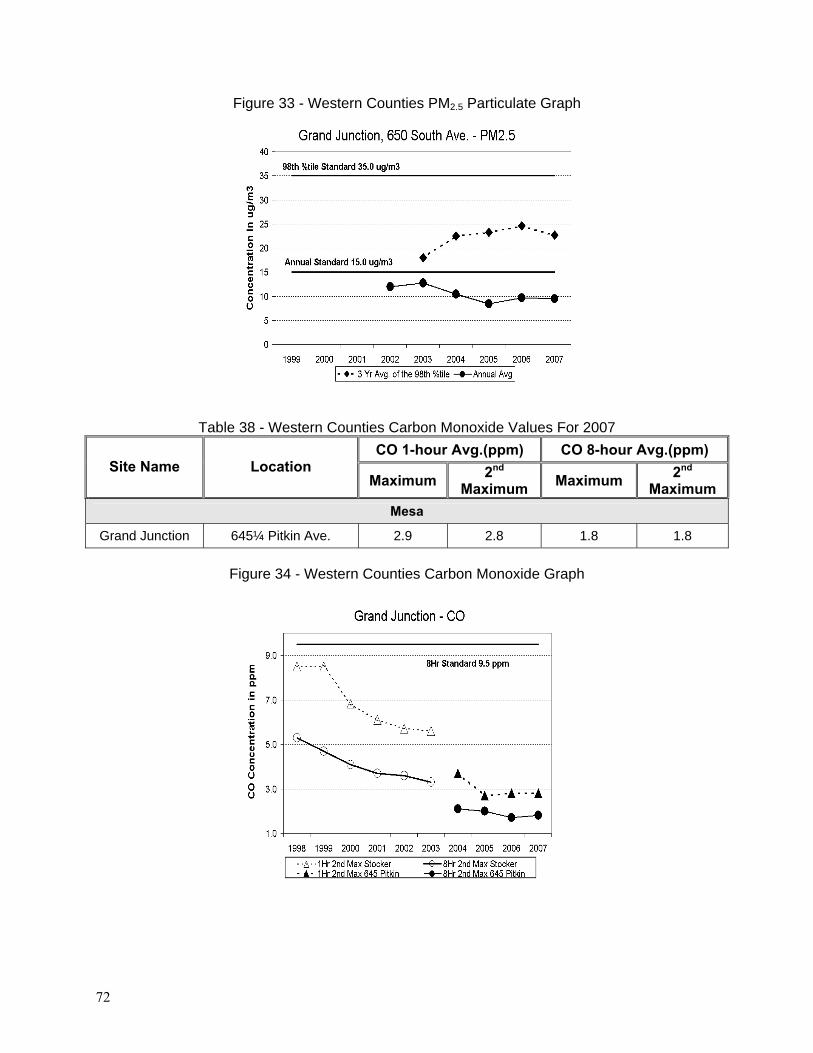
72
Figure 33 - Western Counties PM2.5 Particulate Graph
Table 38 - Western Counties Carbon Monoxide Values For 2007
CO 1-hour Avg.(ppm) CO 8-hour Avg.(ppm) Site Name Location
Maximum 2nd Maximum Maximum 2nd
Maximum Mesa
Grand Junction 645¼ Pitkin Ave. 2.9 2.8 1.8 1.8
Figure 34 - Western Counties Carbon Monoxide Graph
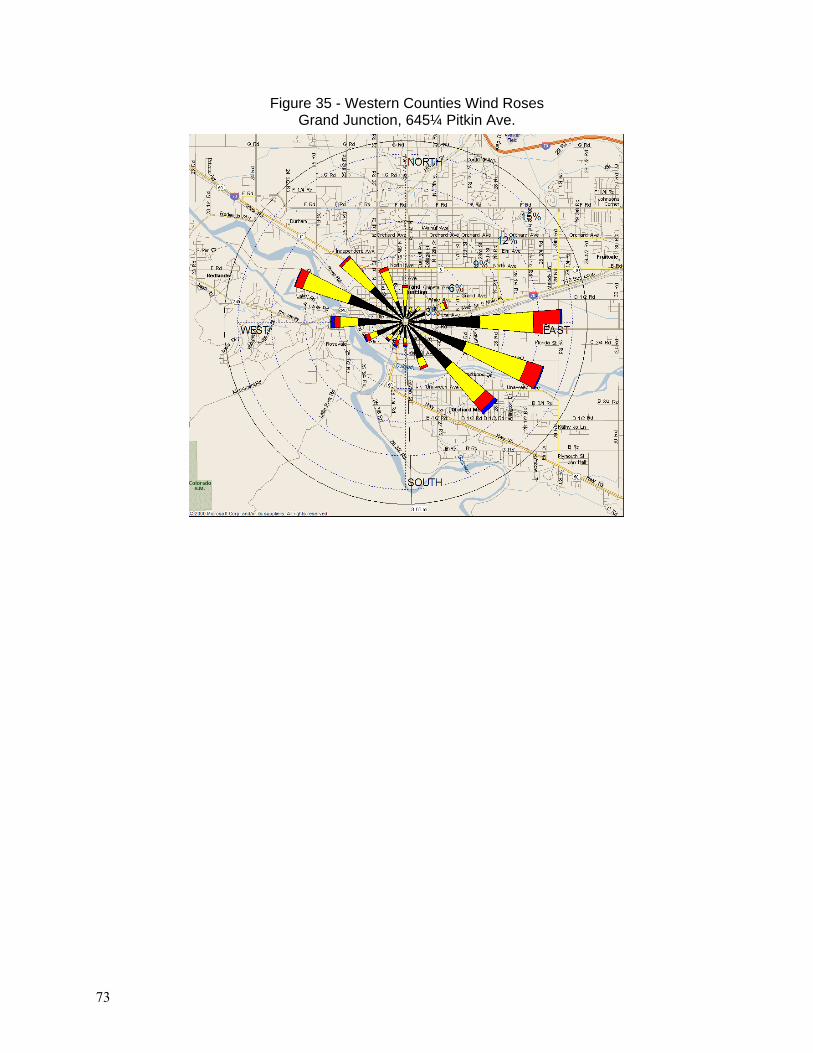
73
Figure 35 - Western Counties Wind Roses Grand Junction, 645¼ Pitkin Ave.
74
References 1 National Primary and Secondary Ambient Air Quality Standards, Title 40 Code of Federal
Regulation, Pt. 50. 1999 ed. 2 United States Environmental Protection Agency – Air Trends, Carbon Monoxide, March 1, 2006 3 National Primary and Secondary Ambient Air Quality Standards for Carbon Monoxide, Title 40
Code of Federal Regulations, Pt. 50.8. 1999 ed. 4 United States Environmental Protection Agency – Air Trends, Carbon Monoxide, March 1, 2006. 5 United States Environmental Protection Agency – Air Trends, Carbon Monoxide, March 1, 2006. 6 United States Environmental Protection Agency – Air Trends, Carbon Monoxide, March 1, 2006. 7 Air Pollution Control Division, Colorado Implementation Plan for Carbon Monoxide Support Document, Chapter #6, Colorado Department of Public Health and Environment, October, 1994. 8 United States Environmental Protection Agency Air Emissions Trends – Carbon Monoxide
www.epa.gov/air/airtrends/2007/emissions_summary_2007.html 9 United States Environmental Protection Agency Air Emissions Trends – Carbon Monoxide
http://www.epa.gov/air/airtrends/2005/emissions_summary_2005.html
10 United States Environmental Protection Agency Air Emissions Trends – Carbon Monoxide www.epa.gov/air/airtrends/2006/emissions_summary_2006.html
11 United States Environmental Protection Agency Ground Level Ozone, http://www.epa.gov/air/airtrends/ozone.html
12 United States Environmental Protection Agency – Air Trends, Ozone, March 1, 2006. 13 United States Environmental Protection Agency Ground Level Ozone,
www.epa.gov/air/airtrends/ozone.html
14 United States Environmental Protection Agency Ground Level Ozone, http://www.epa.gov/air/airtrends/ozone.html
15 United States Environmental Protection Agency – Basic Information – Six Common Pollutants Sulfur Dioxide, March 6, 2007 16 National Primary and Secondary Ambient Air Quality Standards for Sulfur Dioxide, Title 40
Code of Federal Regulations, Pt. 50.5. 1999 ed. 17 United States Environmental Protection Agency – Air Trends, Sulfur Dioxide, March 1, 2006. 18 Visibility Protection for Federal Class I Areas, codified at Title 49 Code of Federal Regulations, Pt. 51.300-309.
75
19 United States Environmental Protection Agency – Basic Information – Six Common Pollutants Sulfur Dioxide, March 6, 2007 20 United States Environmental Protection Agency Air Emissions Trends – Sulfur Dioxide
www.epa.gov/air/airtrends/2006/emissions_summary_2005.html
21 Environmental Protection Agency Strategies and Air Standards Division, Preliminary Assessment of Health and Welfare Effects Associated with Nitrogen Oxides for Standards Setting Purposes, U.S. Government Printing Office, Washington: October 1981, pp i-iii.
22 Environmental Protection Agency, Aerometric Information Retrieval System, Quick Look Report, Nitrogen Dioxide, June 2007. 23 Air Pollution Control Division, Mobile Sources Vehicles Travel Projections, January 1997 24 United States Environmental Protection Agency – Air Trends, Nitrogen Dioxide, March 1, 2006. 25 AirNow - Particulate Pollution and Your Health, What is particulate pollution,
www.airnow.gov/index.cfm/actionparticle.airborne 26 National Primary and Secondary Ambient Air Quality Standards for Particulate Matter, Title 40
Code of Federal Regulation, Pt. 50.7. 1999 ed. 27 The Perils of Particulates, American Lung Association, New York, New, York, March 1994. 28 The Perils of Particulates, American Lung Association, New York, New, York, March 1994. 29 United States Environmental Protection Agency – Air Trends, Particulate Matter, May 4, 2006. 30 United States Environmental Protection Agency Air Emissions Trends – PM10
www.epa.gov/air/airtrends/2007/emissions_summary_2007.html
31 United States Environmental Protection Agency , Basic Information – Fine Particle (PM2.5) Designations www.epa.gov/pmdesignations/basicinfo.htm, June 19, 2008. 32 United States Environmental Protection Agency , Basic Information – Fine Particle (PM2.5) Designations www.epa.gov/pmdesignations/basicinfo.htm, June 19, 2008. 33 United States Environmental Protection Agency Air Emissions Trends – PM2.5
www.epa.gov/air/airtrends/2007/emissions_summary_2007.html 34 United States Environmental Protection Agency Air Emissions Trends – PM2.5
www.epa.gov/air/airtrends/2007/emissions_summary_2007.html
35 United States Environmental Protection Agency – Basic Information – Six Common Pollutants Lead, March 6, 2007 36 National Primary and Secondary Ambient Air Quality Standards for Lead, Title 40 Code of Federal Regulation, Pt. 50.7. 1999 ed.
76
37 United States Environmental Protection Agency – Air Trends, Lead, May 4, 2006. 38 United States Environmental Protection Agency Air Emissions Trends – Lead
www.epa.gov/air/airtrends/2007/emissions_summary_2007.html 39 United States Environmental Protection Agency Air Emissions Trends – Lead
www.epa.gov/air/airtrends/2007/emissions_summary_2007.html
40 Clean Air Act as amended in 1977, section 169a (42 USC 7491) 41 Visibility Protection for Federal Class I Areas, codified at Title 40 Code of Federal Regulations,
Pt. 51.300-309. 42 Environmental Protection Agency, Air Quality Criteria for Oxides of Nitrogen, December, 1982,
AP 600/8-82-029aF. 43 United States Environmental Protection Agency – Air Trends, Toxic Air Pollutants, May 4, 2004. 44 United States Environmental Protection Agency – Air Trends, Toxic Air Pollutants, May 4, 2004. 45 Environmental Protection Agency, Air Quality System, Quick Look Report, Carbon Monoxide, June 2007. 46 Environmental Protection Agency, Air Quality System, Quick Look Report, Carbon Monoxide,
June 2007. 47 Environmental Protection Agency, Air Quality System, Quick Look Report, Ozone, June 2007. 48 Environmental Protection Agency, Air Quality System, Quick Look Report, Sulfur Dioxide, June
2007. 49 Environmental Protection Agency, Air Quality System, Quick Look Report, Nitrogen Dioxide,
June 2007. 50 Environmental Protection Agency, Air Quality System, Quick Look Report, Particulates, June
2007. 51 Environmental Protection Agency, Air Quality System, Quick Look Report, Lead, June 2007. 52 United States Environmental Protection Agency – Air Trends, Carbon Monoxide, June 2007. 53 United States Environmental Protection Agency – Carbon Monoxide : Efforts to Reduce CO, www.epa.gov/air/urbanair/co/effrt1.html, May 9, 2008. 54 United States Carbon Monoxide Air Quality Monitors (2007), Monitor Ranking Report,
Available: www.epa.gov/air/data/monvals.html. Ranking [June 2007]. 55 United States Ozone Air Quality Monitors (2007), Monitor Ranking Report, Available:
www.epa.gov/air/data/monvals.html. Ranking [June 2007]. 56 United States Environmental Protection Agency – Air Trends, Ozone, June 2007.
77
57 United States Ozone Air Quality Monitors (2007), Monitor Ranking Report, Available:
www.epa.gov/air/data/monvals.html. Ranking [June 2007]. 58 United States Environmental Protection Agency – Air Trends, Sulfur Dioxide, May 4, 2004. 59 United States Environmental Protection Agency – Sulfur Dioxide| Air Emissions Sources www.epa.gov/air/emissions/so2.html May 9, 2008. 60 United States Sulfur Dioxide Air Quality Monitors (2007), Monitor Ranking Report, Available:
www.epa.gov/air/data/monvals.html. Ranking [June 2007]. 61 United States Environmental Protection Agency – Air Trends, Nitrogen Dioxide, May 4, 2006. 62 United States Nitrogen Dioxide Air Quality Monitors (2007), Monitor Ranking Report,
Available: www.epa.gov/air/data/monvals.html. Ranking [June 2007]. 63 United States PM10 Air Quality Monitors (2007), Monitor Ranking Report, Available:
www.epa.gov/air/data/monvals.html. Ranking [June 2007]. 64 United States PM10 Air Quality Monitors (2007), Monitor Ranking Report, Available:
www.epa.gov/air/data/monvals.html. Ranking [June 2007]. 65 United States Environmental Protection Agency – Air Trends, PM2.5, May 4, 2007. 66 United States PM2.5 Air Quality Monitors (2007), Monitor Ranking Report, Available:
www.epa.gov/air/data/monvals.html. Ranking [June 2007]. 67 United States Environmental Protection Agency – Air Trends, Lead, May 4, 2007. 68 United States Lead Air Quality Monitors (2007), Monitor Ranking Report,
Available:www.epa.gov/air/data/monvals.html. Ranking [August 2008]. 69 United States Lead Air Quality Monitors (2007), Monitor Ranking Report, Available:www.epa.gov/air/data/monvals.html. Ranking [August 2008].