Embed Size (px)
Citation preview

The Heart of Our Town:
Colwyn Bay T0wn Centre Review 2015-19
November 2019

Table of Contents
Executive Summary ................................................................................................................ 3
Introduction ............................................................................................................................ 9
Origins ............................................................................................................................. 9
The System ...................................................................................................................... 9
The Place .................................................................................................................................11
Commercial Units ................................................................................................................ 11
KPI1: Commercial Units; Use Class ................................................................................11
KPI2: Commercial Units; Comparison versus Convenience ........................................ 13
KPI3: Commercial Units; Trader Types ......................................................................... 14
KPI4: Commercial Units; Vacancy Rates ....................................................................... 16
Cross-Town Trends ............................................................................................................. 16
KPI5: Markets ................................................................................................................ 16
KPI 6 AND 7: Zone A Retail Rents and Prime Retail Property Yields .......................... 16
KPI 8: Footfall ................................................................................................................ 17
KPI 9: Car Parking ..........................................................................................................23
The People ......................................................................................................................... 26
KPI 10: Business Confidence Survey ............................................................................ 26
KPI 11: Town Centre Users Survey ................................................................................ 37
KPI 12: Shoppers Origin Survey .................................................................................... 50

Executive Summary This report has been prepared by the People & Places Partnership on behalf of Conwy County Borough Council. Its purpose is to record and present key evidence about the current performance of Colwyn Bay town centre and track changes over recent years. In addition, by comparing data for collected since 2015, it is possible to track the impact of changes over the last five years. This will help in understanding and responding to current challenges and future opportunities. The measures gathered here are known as Key Performance Indicators -or KPI’s for short- and can be compared with similar towns and used to track the impact of improvements over coming years.
Town Centre Function The core KPIs for Colwyn Bay help in understanding its function and planning for investment and enhanced future activity. Notable KPIs that help further interpret this include:
• The business data for Colwyn Bay in 2018 indicates that 56% of businesses in the town centre are shops and that this is now only slightly higher than other benchmarked towns nationally. Of the other businesses there are a significant number of food and drink establishments (17%) and financial institutions (8%); both of which are also higher than the national averages large towns.
• Further analysis of the retail businesses in Colwyn Bay town centre indicates that the vast majority are comparison retailers (91%) and that this is a higher proportion than other benchmarked large towns nationally. Whilst this percentage of comparison retailers indicates Colwyn Bay is an established local shopping destination, it also suggests a vulnerability to competition from neighbouring centres and on-line retail.
• The data for Colwyn Bay indicates a below average proportion of key attractors (3%) compared to small and especially larger towns; and a slightly lower that average number of national multiples (19%) compared to other benchmarked towns. These percentages have been reduced by closures of national chains over the last year. There is a high proportion (75%) of businesses in the town centre that are independently owned compared to benchmarked towns nationally and this offers a distinctive retail experience.
“The high percentage of comparison retailers indicates a continued vulnerability to competition from neighbouring centres and on-line.”
“Improving a town centre without first understanding it, is like baking a cake without knowing the ingredients.”
Great British High Street Campaign

• The responses from the town centre users indicate a sample from this mid-week survey that comprises a majority of females (66%). There was a limited spread of age categories with an older age profile for the local population compared to other nationally benchmarked towns. Most people are in town for comparison shopping (27%), followed by leisure (22%), convenience shopping (18%) and to access services (18%). The relatively high per centage of comparison shoppers is a positive indicator for the high proportion of such retailers that are based in the town.
• A third of town centre users (33%) spend more than £20 on a visit to the town centre. This is slightly lower than national averages (38%).
Town Centre Trends The analysis of KPIs for Colwyn Bay trends indicates fluctuating footfall with adequate parking though businesses that are still very vulnerable to localised changes and long-term economic trends :
• Indicative footfall counts show that Colwyn Bay is less busy than benchmarked large towns nationally with 174 passers-by per 10 minutes on a Market Day and 148 on a quieter day. It also suggests that overall footfall has decreased around the town since 2015 and from peak levels in 2017.
• Footfall counters installed in 2017 show a decrease in footfall between the Bayview Shopping Centre and Station Road consistent with the indicative counts although the level of decrease is only 9-15% over the summer months. Elsewhere these footfall counters they show a 50% increase in footfall between the new Council offices and the town centre.
-
10,000
20,000
30,000
40,000
50,000
60,000
Se
p-1
7
Oct
-17
No
v-17
De
c-17
Jan
-18
Feb
-18
Mar
-18
Ap
r-18
May
-18
Jun
-18
Jul-1
8
Au
g-1
8
Se
p-1
8
Oct
-18
No
v-18
De
c-18
Jan
-19
Feb
-19
Mar
-19
Ap
r-19
May
-19
Jun
-19
Jul-1
9
Au
g-1
9
Se
p-1
9
Footfall Conway Road near Coed Pella
Coed Pella side Hawarden Road side
“Footfall counters show a 50% increase in footfall between the new Council offices and the town centre.”

• The Colwyn Bay promenade showed a decline in footfall in May to July 2019 though August and September showed an increase over 2018 of around 10%. Similarly, the underpass between the promenade and the town shows an increase in footfall in August and September 2019, up 20% on the same period in 2018.
• Station Road and Princess Drive are respectively logging on average 130,000 and 100,000 people passing per month. This equates to around 70,000 fewer people passing the counters.
• Footfall monitoring in the Bayview Centre shows a broadly positive trend over the summer months of 2019 compared to 2018 as the chart below indicates. This is largely accredited to the opening of the new Home Bargains store following the previous closure of Poundland.
• The data indicates that overall Colwyn Bay is a moderately easy place to find a parking space in during the week with 33% of spaces available on a market day and a normal day. These figures are comparable with benchmarked towns nationally. Parking usage does not show a significant difference on market day.
• This indicative data also suggests that parking availability has not been adversely affected by construction of the new council offices and consequent reduction in space. Parking availability has consistently been 32-33% over the last three years.
-10.00%
-5.00%
0.00%
5.00%
10.00%
15.00%
20.00%
24-Jun 04-Jul 14-Jul 24-Jul 03-Aug 13-Aug 23-Aug 02-Sep
Bayview 2018 to 2019 footfall change
“Indicative data suggests that parking availability has not been adversely affected by construction of the new council offices and consequent reduction in space.”
“August and September 2019 showed an increase of around 10% on the promenade compared to 2018.”

• There is an indication that the availability of on-street parking is no longer approaching a critical situation as in 2018. This may be due to the introduction of stricter enforcement regimes to ensure a suitable turn-over of spaces.
• Data was also made available this year on car park usage at the Bayview Shopping Centre; specifically, the weekly totals of hourly parkers as recorded on exit. This shows more erratic use in 2019 though an uplift to 2018 levels from mid-August in a way that is consistent with the Bayview’s footfall
• In terms of recent business performance, 66% said that turnover had increased or stayed the same over the last year. This combined figure is comparable to the national average of 77% for large towns and is significantly improved on the previous year’s figure (55%). Indeed, the trend in business turnover in Colwyn Bay town centre has been progressively positive over the last five years.
• Looking to the future, Colwyn Bay businesses are markedly more positive than the last two years with 72% expecting turnover to increase or stay the same compared to 59% and 43% in 2018 and 2017 respectively.
“The trend in business turnover in Colwyn Bay has been progressively positive over the last five years”.
“Looking to the future, Colwyn Bay businesses are markedly more positive than the last two years with 72% expecting turnover to increase or stay the same compared to 59% and 43% in 2018 and 2017 respectively.”
0%
10%
20%
30%
40%
50%
60%
National % Colwyn Bay 2015%
Colwyn Bay 2016%
Colwyn Bay 2017%
Colwyn Bay 2018%
Colwyn Bay 2019%
Colwyn Bay Changes in Projected Turnover
Increase Stay the same Decrease

Current Issues and Priorities
The surveys of businesses and town centre customers highlight their positive and negative current perceptions and point to potential future priorities. Town centre customers were the more positive and highlighted slightly different priorities.
Positives
• Businesses in Colwyn Bay value the potential for local customers (66%), transport links (66%), geographical location (48%), potential for tourist customers (37%), physical appearance (37%).
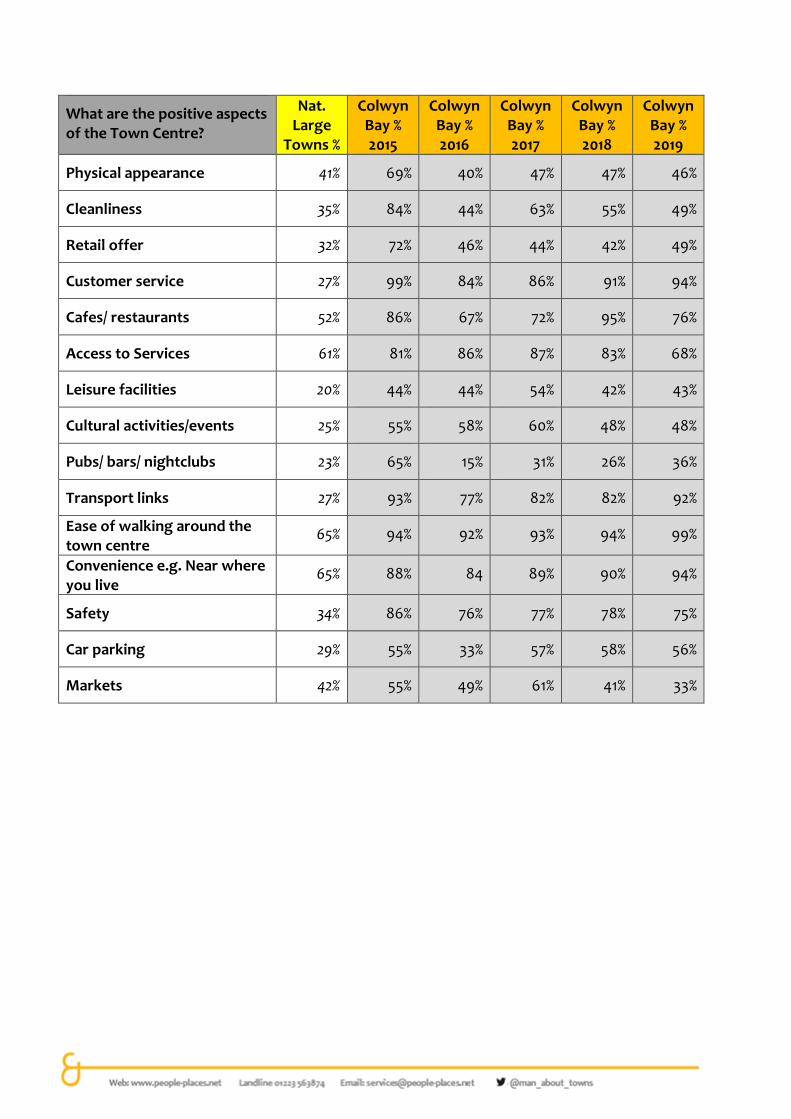
• When asked about the positive aspects of Colwyn Bay town centre, its users are markedly more positive than businesses: cafes/restaurants (95%); ease of walking around the town centre (94%); access to services (87%); customer service (91%); convenience (90%); transport links (82%); and safety (78%) were once again given a positive response by over two-thirds of respondents. All these levels of response compare very favourably with other towns nationally.
Negatives
• In terms of negative perceptions about being located in Colwyn Bay town centre, businesses are only significantly negative about car parking (53%), the prosperity of the town (38%) and competition from out-of-town shopping (36%). This is much more moderate than 2018 when a majority of businesses that responded considered car parking (77%), physical appearance (76%), empty properties (73%), footfall (55%) and competition from the internet (55%) to be key negative issues.
• In terms of negatives, there were fewer responses than positives, with only physical appearance (54%), cleanliness (50%) and retail offer (48%) rating poorly with more than a third of town centre users. All of these issues are perceived as worse than in benchmarked towns nationally.
• Nearly two-thirds of businesses who responded (64%) were positive about the impact of the new council offices compared to 27% who were negative. Anecdotally, the suggestion is that negative perceptions relate to issues connected with anti-social behaviour of some council clients though effectively this has not changed. There may also be some negative perceptions about the impacts on town centre car parking although usage data suggests that there has not been a negative effect.
Priorities
• When businesses in Colwyn Bay were asked what two things that would improve the town centre the main issues related to parking, opportunities to improve the retail mix, marketing/events and the physical appearance of the town centre. There were proportionally fewer concerns about local, civic leadership and property cost compared to 2018.
“Nearly two-thirds of businesses who responded (64%) were positive about the impact of the new council offices compared to 27% who were negative.”

• When customers of Colwyn Bay were asked what two things would improve the town centre, the most popular responses related to the appearance of the town including a desire to fill empty premises. Parking improvements and calls for more diverse shops were also prominent responses.
The word cloud below gives an indication of the most popular words used by town centre users to sum-up Colwyn Bay.
Such a word cloud, whilst only indicative, is useful in understanding how the town centre is perceived by current users who are familiar with it. It can be helpful in determining how the town can be honestly promoted to potential new users in a way that creates achievable expectations. All of the most prominent words are a mixture of positive words, such as nice, convenient, pleasant and interesting, or negative words such as rundown, average, dying and tired. Collectively these words paint a picture of a partially appealing place to visit that is in need of some updating and revitalisation.
“The most prominent words are a mixture of positive and negative phrases that collectively paint a picture of a partially appealing place to visit that is in need of continued updating and revitalisation.”

Introduction Origins
Town Benchmarking was initially developed to address how to understand, measure, evaluate and ultimately improve the economic viability of town centres. The approach has been used increasingly widely since 2004 and offers a simple way of capturing data on town centre Key Performance Indicators (KPIs) selected by those involved in town centre revitalisation. By having the tools to measure performance, strategic decision making is both encouraged and improved whilst action planning can be more focused and effective.
The System
The People & Places Town Centre Benchmarking system has been developed to address the real issues of how to understand measure, evaluate and ultimately improve town centres. The approach offers a simple way of capturing data on 12 Key Performance Indicators selected by those involved in town centre management. By having the tools to measure performance, strategic decision-making is both encouraged and improved. By considering performance, forward strategies and action planning can be more focused and effective.
The Benchmarking system is divided into two sections:
• large towns; consisting of those localities with more than 250 units
• small towns; consisting of those localities with less than 250 units
Towns, depending on their size, contribute to either the large or small town analysis. Colwyn Bay with 272 business units is classed as large town. The analysis provides data on each KPI for the Benchmarked town individually and in a national context for comparison. The National figure is the average for all the towns which participated in Benchmarking during 2016, as previously used.
The Reports
The Benchmarking report provides statistical analysis of each of the KPI’s. Individual towns are encouraged to add their own commentary using local knowledge to provide specific explanations. The reports are used by a variety of key stakeholders such as local authorities, town and parish councils, local partnerships, Town Teams, Chambers of Trade, BIDs, Neighbourhood Plan groups to help:
• provide baseline data to understand individual town centres issues
• identify strengths, weaknesses, and opportunities for improvement
• assist in preparing local action plans to address identified issues
• monitor impact of local town centre regeneration over several years
• benchmark towns clusters and share good practice
• act as an evidence base for funding applications

Methodology
Each KPI is collected in a standardised manner as highlighted in the table below. This table provides a summary of KPIs collected as part of the core economic benchmarking process as well as an outline of additional benchmarks charting the wider social and economic value of town centres:
KEY PERFORMANCE INDICATOR METHODOLOGY
Core Economic Indicators
The Place: Commercial Units
KPI 1: Use Class Visual Survey
KPI 2: Comparison/Convenience Visual Survey
KPI 3: Trader Type Visual Survey
KPI 4: Vacancy Rates Visual Survey
The Place: Cross-town Trends
KPI 5: Markets Visual Survey
KPI 6 & 7: Zone A Retail Rents Valuation Office Agency/ Local Agents
KPI 7: Prime Retail Property Yields Valuation Office Agency/ Local Agents
KPI 8: Footfall Survey on a Market & Quiet Day
KPI 9: Car Parking Audit on Busy and Quiet Day
The People: Stakeholder Surveys
KPI 10: Business Confidence Surveys Postal Survey
KPI 11: Town Centre Users Surveys Face to Face Surveys/ Online Survey
KPI 12: Shoppers Origin Surveys Shoppers Origin Survey
Added Social and Economic Value (not included for this survey)
Cultural and Community Function
KPI A: Cultural Facilities Online and Local Research
KPIB: Community Services Online and Local Research
KPI C: Cultural and Community Events Online and Local Research
Built Environment
KPI D: Impressions Score Visual Survey
KPI E: Number of Listed Buildings Online Research
KPI F: Development Land Online Research
Economic Diversity
KPI G: Evening Economy Visual Survey
KPI H: Local Food and Drink Visual Survey
KPI I: Accommodation Online Research
KPI J: Self-reliance Online Research
Local Leadership and Delivery
KPI K: Partnership Progression Telephone Interview
KPI L: Planning and Delivery Telephone Interview
Before any KPI data is collected the core commercial area of the town centre is defined. The town centre area thus includes the core shopping streets and car parks attached or adjacent to these streets.

The Place Commercial Units
KPI1: Commercial Units; Use Class
It is important to understand the scale and variety of the “commercial offer” throughout the town. A variety of shops and a wide range of services in a town are important to its ability to remain competitive and continue to attract customers. Sustaining a balance between the different aspects of buying and selling goods and services ensures that the local population (and visitors from outside) can spend time and money there, keeping the generated wealth of the town within the local economy. Importantly, it forms the employment base for a substantial proportion of the community too, helping to retain the population rather than lose it to nearby towns and cities.
The following table provides a detailed breakdown of each of the Use Classes.
Class Type of Use Class Includes
A1 Shops Shops, retail warehouses, hairdressers, travel and ticket agencies, post offices (but not sorting offices), pet shops, sandwich bars, showrooms, domestic hire shops, dry cleaners, funeral directors and internet cafes
A2 Financial and Professional Services
Financial services such as banks and building societies, professional services (other than health and medical services) including estate and employment agencies and betting offices
A3 Restaurants and Cafes
Food and drink for consumption on the premises- restaurants, snack bars and cafes
A4 Drinking Establishments
Public houses, wine bars or other drinking establishments (but not nightclubs)
A5 Hot Food Takeaways Sale of hot food for consumption off the premises
B1 Businesses Offices (other than those that fall within A2) research and development of products and processes, light industry appropriate in a residential area
B2 General Industrial General Industrial
B8 Storage and Distribution
Warehouses, includes open air storage

C1 Hotels Hotels, boarding and guest houses where no significant element of care is provided (excludes hostels)
C2 Residential Institutions
Residential care homes, hospitals, nursing homes, boarding schools, residential colleges and training centres.
C2A Secure Residential Institution
Use for a provision of secure residential accommodation, including use as a prison, young offenders institution, detention centre, secure training centre, custody centre, short term holding centre, secure hospital, secure local authority accommodation or use as a military barracks.
D1 Non Residential Institutions
Clinics, health centres, crèches, day centres, schools, art galleries (other than for sale or hire), museums, libraries, halls, places of worship, church halls, law court. Non-residential education and training centres.
D2 Assembly and Leisure Cinemas, music and concert halls, bingo and dance halls (but not nightclubs), swimming baths, skating rinks, gymnasiums or area for indoor or outdoor sports and recreations (except for motor sports, or where firearms are used).
SG Sui Generis ("unique" establishments)
Theatres, hostels providing no significant element of care, scrap yards, petrol filling stations and shops selling and/ or displaying motor vehicles, retail warehouse clubs, nightclubs, launderettes, taxi business, amusement centres, casinos, haulage yards, transport depots, veterinary clinics, dog parlours, tanning and beauty salons and tattoo studios.
There were 277 business premises identified in the town centre and these are listed in Appendix 1. There were 35 vacant business units recorded in the audit at the end of July, 2019.
The following table provides a detailed analysis of the commercial offering in the town centre by Use Class. The figures are presented as a percentage of the 242 occupied units recorded.

National Large
Towns %
Colwyn Bay % 2015
Colwyn Bay % 2016
Colwyn Bay % 2017
Colwyn Bay % 2018
Colwyn Bay
(number)
Colwyn Bay % 2019
A1 52% 66% 65% 60% 60% 156 56%
A2 13% 11% 9% 10% 9% 22 8%
A3* 10%
16% 17% 18% 20% 46 17% A4 4%
A5 3%
B1 3% 2% 1% 3% 1% 2 1%
B2 1% 0 0 0 0 0
B8 0 0 0 0 0 0
C1 1% 0 0 0 0 0
C2 0 0 0 0 0 0
C2A 0 0 0 0 0 0
D1 5% 1% 3% 2% 2% 4 1%
D2 1% 1% 0 0 2% 4 1%
SG 6% 2% 3% 7% 6% 6 2%
Not Recorded
0 0 0 0 0 0 0
*In Wales, Use Classes A3-5 are all combined in to A3.
The business data for Colwyn Bay in 2019 indicates that 56% of businesses in the town centre are shops and that this is now only slightly higher than other benchmarked towns nationally. Of other businesses there are a significant number of food and drink establishments (17%) and financial institutions (8%); both of which are also higher than the national averages large towns.
KPI2: Commercial Units; Comparison versus Convenience
A1 Retail units selling goods can be split into two different types Comparison and Convenience.
Convenience goods – low-cost, everyday items that consumers are unlikely to travel food and non-alcoholic drinks
• tobacco
• alcohol
• newspapers and magazines
• non-durable household goods.

Comparison goods – all other retail goods.
• books
• clothing and Footwear
• furniture, floor coverings and household textiles
• audio-visual equipment and other durable goods
• hardware and DIY supplies
• chemists goods
• jewelry, watches and clocks
• bicycles
• recreational and Miscellaneous goods
• hairdressing
The presence of a variety of shops in a town centre is important to its ability to remain competitive and continue to attract customers. A balance of both comparison and convenience retail units is therefore ideal in terms of encouraging visitors / potential customers.
National Large
Towns %
Colwyn Bay % 2015
Colwyn Bay % 2016
Colwyn Bay % 2017
Colwyn Bay % 2018
Colwyn Bay
(number)
Colwyn Bay % 2019
Comparison 85% 90% 91% 91 92% 135 91%
Convenience 15% 10% 9% 9% 8% 12 9%
The table indicates that the majority of businesses in Colwyn Bay town centre are comparison retailers (91%) and that this is a higher proportion than other benchmarked large towns nationally. Whilst this percentage of comparison retailers indicates Colwyn Bay is an established local shopping destination, it suggests a vulnerability to competition from neighbouring centres and on-line retail.
KPI3: Commercial Units; Trader Types
The vitality of a town centre depends highly on the quality and variety of retailers represented. National retail businesses are considered ‘Key Attractors’ and are particularly important in terms of attracting visitors and shoppers to a town. The character and profile of a town often also depends, however, on the variety and mix of independent shops that can give a town a “unique selling point” and help distinguish it from other competing centres. A sustainable balance of Key Attractors and multiple names alongside local independent shops is therefore likely to have the greatest positive impact on the vitality and viability of a town. The following shops are considered Key Attractors by Experian Goad.

Department Stores H & M
Debenhams New Look
House of Fraser River Island
John Lewis Topman
Marks and Spencer Topshop
Regional Dept. Stores Burton
Mixed Goods Retailers Next
Argos Zara
Boots Other Retailers
TK Maxx Superdrug
WH Smith Clarks
Wilkinson Clintons
Supermarkets HMV
Sainsbury’s Carphone Warehouse
Tesco O2
Waitrose Three
Morrisons Phones 4 U
Clothing Vodafone
Primark Waterstones
Dorothy Perkins
Multiple traders have a countrywide presence and are well known household names. Regional shops are identified as those with stores / units in several towns throughout one geographical region only and independent shops are identified as those that are specific to a particular town.
The following table provides a percentage of the A1 Shops which are Key Attractors, Multiples, Regional and Independent to the locality.
The data for Colwyn Bay indicates a below average proportion of key attractors (3%) compared larger towns; and a slightly lower that average number of national multiples (19%) compared to other benchmarked towns. There is a high proportion (73%) of businesses in the town centre that are independently owned compared to benchmarked towns nationally and this offers a distinctive retail experience.
Nat.
Large Towns %
Colwyn Bay % 2015
Colwyn Bay % 2016
Colwyn Bay % 2017
Colwyn Bay % 2018
Colwyn Bay
(number)
Colwyn Bay % 2019
Key attractor 9% 5% 4% 5% 4% 6 3%
Multiple 27% 21% 18% 20% 19% 28 19%
Regional 7% 1% 3% 2% 4% 6 4%
Independent 57% 73% 75% 73% 73% 106 75%
The last 12 months has seen the loss of some chains nationally such as New Look and this has impacted towns everywhere. Colwyn Bay has additionally been hit by the closure of some mobile phone shops that are defined as key attractors. The Factory
Outlet store has also closed. Home Bargains has moved into a bigger store though the old unit is now temporarily empty. More positively Trespass has opened a store.
KPI4: Commercial Units; Vacancy Rates
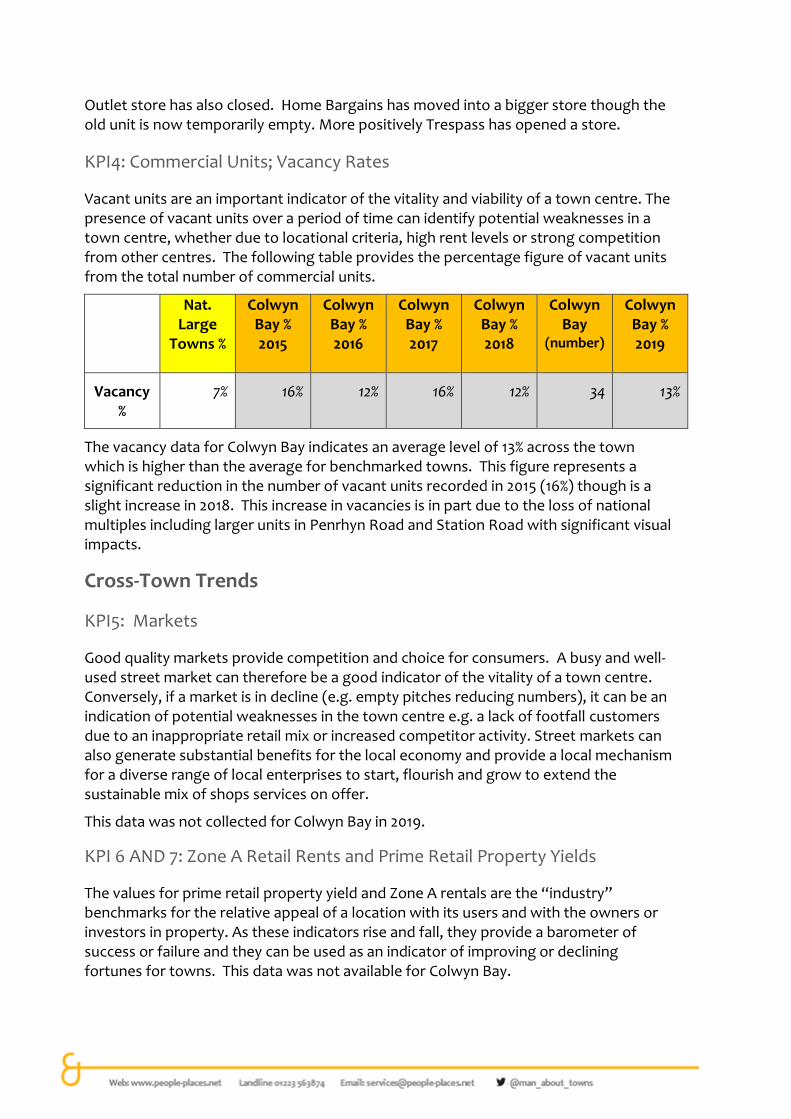
Vacant units are an important indicator of the vitality and viability of a town centre. The presence of vacant units over a period of time can identify potential weaknesses in a town centre, whether due to locational criteria, high rent levels or strong competition from other centres. The following table provides the percentage figure of vacant units from the total number of commercial units.
Nat.
Large Towns %
Colwyn Bay % 2015
Colwyn Bay % 2016
Colwyn Bay % 2017
Colwyn Bay % 2018
Colwyn Bay
(number)
Colwyn Bay % 2019
Vacancy %
7% 16% 12% 16% 12% 34 13%
The vacancy data for Colwyn Bay indicates an average level of 13% across the town which is higher than the average for benchmarked towns. This figure represents a significant reduction in the number of vacant units recorded in 2015 (16%) though is a slight increase in 2018. This increase in vacancies is in part due to the loss of national multiples including larger units in Penrhyn Road and Station Road with significant visual impacts.
Cross-Town Trends
KPI5: Markets
Good quality markets provide competition and choice for consumers. A busy and well-used street market can therefore be a good indicator of the vitality of a town centre. Conversely, if a market is in decline (e.g. empty pitches reducing numbers), it can be an indication of potential weaknesses in the town centre e.g. a lack of footfall customers due to an inappropriate retail mix or increased competitor activity. Street markets can also generate substantial benefits for the local economy and provide a local mechanism for a diverse range of local enterprises to start, flourish and grow to extend the sustainable mix of shops services on offer.
This data was not collected for Colwyn Bay in 2019.
KPI 6 AND 7: Zone A Retail Rents and Prime Retail Property Yields
The values for prime retail property yield and Zone A rentals are the “industry” benchmarks for the relative appeal of a location with its users and with the owners or investors in property. As these indicators rise and fall, they provide a barometer of success or failure and they can be used as an indicator of improving or declining fortunes for towns. This data was not available for Colwyn Bay.

KPI 8: Footfall
The arrival and movement of people, whether as residents, workers, visitors or a shopper is vital to the success of the majority of businesses within the town centre. The more people that are attracted to the town, the better it trades and the more prosperous the businesses in it become, provided there is ample available disposable income in that population. Measuring passing people in a consistent manner in the same place, at the same time builds up a picture of the town, its traders and their relative success over the weeks and months.
Indicative footfall counts
Nat. Large Towns
Colwyn Bay 2015
Colwyn Bay 2016
Colwyn Bay 2017
Colwyn Bay 2018
Colwyn Bay 2019
Market Day (Bayview)
332 212 261 285 254 174
Market Day (Station Road)
- - 227 251 228 156
Quiet Day (Bayview)
218 137 180 204 232 148
Quiet Day (Station Road)
- - 143 186 193 118
The table above provides the average number of people per 10 minutes between 10am and 1pm from the busiest footfall location in Colwyn Bay (Bayview Shopping Centre entrance) as well as nearby Station Road. Data for the bottom of Station Road is also provided for comparison.
This indicative data shows that Colwyn Bay is less busy than benchmarked large towns nationally with 174 passers-by per 10 minutes on a Market Day and 148 on a quieter day. It also suggests that overall footfall has decreased around the town since 2015 and from peak levels in 2017.
Footfall monitors
Since July 2017 footfall counters have been in place around Colwyn Bay provided by
Linetop Ltd. This enables much more in-depth reporting of footfall as reported below.
These counters show a decrease in footfall between the Bayview Shopping Centre and
Station Road consistent with the indicative counts although the level of decrease is only
9-15% over the summer months. Elsewhere they show a 50% increase in footfall between
the new Council offices and the town centre.
Key findings
1. Since the opening of Coed Pella there has been a 50% increase in footfall on the pavement between the Coed Pella offices and the town. This is an additional 8,000 people passing the counter per month.

2. The counters on Station Road are logging on average 130,000 people passing per month. The summer of 2019 (May - August) has seen a decline in footfall of around 10%. This equals around 70,000 fewer people passing the counters.
3. Princess Drive is averaging around 100,000 people passing the counter each month. The counters show a similar trend to Station Road, with the 2019 summer period (May - August) showing a decline of 15% compared to 2018. Again this equals 70,000 fewer people passing the counters.
4. The counters on Abergele Road near to St Paul’s and Rhiw Road show a different trend. There are on average just under 20,000 people passing the counter each month with numbers remaining consistent compared to previous years and showing a smaller seasonal variation.
5. The Colwyn Bay promenade showed a decline in footfall in May to July 2019 when compared to the same period the previous year, part of which is the results of fewer counts at the 2019 Prom Xtra event. August and September 2019 showed an increase over 2018 of around 10%.
6. The underpass between the promenade and the town shows erratic data, probably due to the promenade closures since 2017. The data shows an increase in footfall in August and September 2019, up 20% on the same period in 2018.
7. Overall, it can be seen that the Coed Pella offices and the Promenade improvements look to have increased footfall around those areas, but as yet, the improvements are not following through or are too small so far, to impact on declines in Station Road and Princess Drive.
Conway Road near to Coed Pella
Counters are placed either side of the traffic lights outside the Sterling Estate Agents and the Barclays Bank. Data from the two counters cannot be added together because people travelling from Coed Pella and crossing at the traffic lights will be counted twice.
The data shows a gap between June and August 2018 because of road works during the Coed Pella build.
-
10,000
20,000
30,000
40,000
50,000
60,000
Sep
-17
Oct
-17
No
v-17
De
c-17
Jan
-18
Feb
-18
Mar
-18
Ap
r-18
May
-18
Jun
-18
Jul-1
8
Au
g-1
8
Sep
-18
Oct
-18
No
v-18
De
c-18
Jan
-19
Feb
-19
Mar
-19
Ap
r-19
May
-19
Jun
-19
Jul-1
9
Au
g-1
9
Sep
-19
Footfall Conway Road near Coed Pella
Coed Pella side Hawarden Road side

• Prior to the opening of Coed Pella, the counter on the Coed Pella side of the road (blue bars above) were logging on average 17,000 people passing per month. Since the opening this has increased to 25,000 people passing per month, an increase of 50% or 8,000 people.
• The Hawarden Road side of Conway Road (Orange bars above) sees a much higher footfall averaging at 43,000 per month prior to the Coed Pella opening and 48,000 since the opening, an increase of 5,000 people passing the counters.
• The data shows a slight seasonal trend with a drop in footfall over the winter months on the Hawarden side of the road of around 20% and the Coed Pella side of the road of around 12%.
Station Road
There are four counters to cover the width of Station Road that are located towards the bottom end near to the clock. Data from these four counters has been added together to give a trend for the Road.
• Over the last 12 months there have been on average 130,000 people passing the counters per month.
• The summer of 2019 (May - August) has seen a decline in footfall of around 10%. This equals around 70,000 fewer people passing the counters.
• The data shows a slight seasonal trend with numbers falling by 15% to 20% over the winter months. There is an obvious spike in footfall in December in both 2017 and 2018, suggesting the town is picking up some Christmas trade.
Princess Drive and Sea View Road
There is one counter on Princess Drive to count people on the route between the Bay View Centre and Station Road. There are also counters on Sea View Road outside of the Bayview Centre, but due to the layout of the area it was not possible to place counters to cover all of the route. This means that a significant amount of the footfall will not be caught by the Sea View Road counters, although they still provide a trend over time.
-
20,000
40,000
60,000
80,000
100,000
120,000
140,000
160,000
180,000
Jul-1
7
Au
g-1
7
Sep
-17
Oct
-17
No
v-17
De
c-17
Jan
-18
Feb
-18
Mar
-18
Ap
r-18
May
-18
Jun
-18
Jul-1
8
Au
g-1
8
Sep
-18
Oct
-18
No
v-18
De
c-18
Jan
-19
Feb
-19
Mar
-19
Ap
r-19
May
-19
Jun
-19
Jul-1
9
Au
g-1
9
Sep
-19
Station Road

• Princess Drive is averaging around 100,000 people passing the counter each month.
• The princess Drive counter shows a similar trend to Station Road, with the 2019 summer period (May - August) showing a decline of 15% compared to 2018. This equals 70,000 fewer people passing the counter in that period.
• The Sea View Road counter also shows a decline over the 2019 summer period, although slightly smaller at -9% compared to the same period in 2018.
• Again similar to Station Road, the data shows a slight seasonal trend with numbers falling by around 20% over the winter months.
Abergele Road near St Paul’s Church
The counter is placed on the St Paul’s side of Abergele Road catching footfall between Rhiw Road and the Bus Stop.
• The counter is logging footfall of around 19,000 people each month.
-
20,000
40,000
60,000
80,000
100,000
120,000
140,000Ju
l-17
Au
g-1
7
Sep
-17
Oct
-17
No
v-17
De
c-17
Jan
-18
Feb
-18
Mar
-18
Ap
r-18
May
-18
Jun
-18
Jul-1
8
Au
g-1
8
Sep
-18
Oct
-18
No
v-18
De
c-18
Jan
-19
Feb
-19
Mar
-19
Ap
r-19
May
-19
Jun
-19
Jul-1
9
Au
g-1
9
Sep
-19
Footfall Princess Drive cut through between BayView and Station RoadFootfall Sea View Road outside the BayView Centre
Princess Drive Sea View Road
-
5,000
10,000
15,000
20,000
25,000
Sep
-17
Oct
-17
No
v-17
De
c-17
Jan
-18
Feb
-18
Mar
-18
Ap
r-18
May
-18
Jun
-18
Jul-1
8
Au
g-1
8
Sep
-18
Oct
-18
No
v-18
De
c-18
Jan
-19
Feb
-19
Mar
-19
Ap
r-19
May
-19
Jun
-19
Jul-1
9
Au
g-1
9
Sep
-19
Footfall Abergele Road near St. Pauls

• Unlike other parts of the town, this data shows a smaller seasonal variation, with numbers falling by between 5% and 10% over the winter months.
• Also unlike the other counters on Station Road and Princess Drive, this part of town shows no decline in footfall in 2019.
Colwyn Bay Promenade
Due to the design of the promenade there is no ideal place for a footfall counter. This one is placed midway between Porth Eirias and the old pier site.
• As expected, the promenade shows significant season variation with footfall increasing from around 15,000 to 20,000 during the winter months to 40,000+ at the peak of summer.
• The Colwyn Bay promenade showed a decline in footfall in May to July 2019 when compared to the same period the previous year, part of which is the results of fewer counts at the Prom Xtra event on the 11th May 2019. August and September 2019 showed an increase over 2018 of around 10%.
Underpass between the prom and the town
• This route is split into two with one counter covering each side. In the chart below they are called upper and lower.
• The underpass between the promenade and the town shows quite erratic data, probably due to several promenade closures since 2017. The peak in June and July 2018 is likely because the section of promenade between the old Pier site and the Toad Public House was closed and pedestrian traffic re-directed up this underpass into Colwyn Bay.
• Since re-opening the promenade, the route is still well used, with between 20,000 and 40,000 people passing the counters each month.
• The data shows an increase in footfall in August and September 2019, up 20% on the same period in 2018.
•
-
10,000
20,000
30,000
40,000
50,000
60,000
Jul-1
7
Au
g-1
7
Sep
-17
Oct
-17
No
v-17
De
c-17
Jan
-18
Feb
-18
Mar
-18
Ap
r-18
May
-18
Jun
-18
Jul-1
8
Au
g-1
8
Sep
-18
Oct
-18
No
v-18
De
c-18
Jan
-19
Feb
-19
Mar
-19
Ap
r-19
May
-19
Jun
-19
Jul-1
9
Au
g-1
9
Sep
-19
Footfall Colwyn Bay Prom between pier and Porth Eirias

Bayview Shopping Centre
Footfall monitoring in the Bayview shows a broadly positive trend over the summer months of 2019 compared to 2018 as the chart below indicates. This is largely accredited to the opening of the new Home Bargains store following the previous closure of Poundland.
-
10,000
20,000
30,000
40,000
50,000
60,000Se
p-1
7
Oct
-17
No
v-17
De
c-17
Jan
-18
Feb
-18
Mar
-18
Ap
r-18
May
-18
Jun
-18
Jul-1
8
Au
g-1
8
Sep
-18
Oct
-18
No
v-18
De
c-18
Jan
-19
Feb
-19
Mar
-19
Ap
r-19
May
-19
Jun
-19
Jul-1
9
Au
g-1
9
Sep
-19
Footfall Underpass between Prom and Town
Upper Lower
-10.00%
-5.00%
0.00%
5.00%
10.00%
15.00%
20.00%
24-Jun 04-Jul 14-Jul 24-Jul 03-Aug 13-Aug 23-Aug 02-Sep
Bayview 2018 to 2019 footfall change

KPI 9: Car Parking
Usually, a large proportion of spending customers in a town centre come by car. In the rural setting, the car tends to be an essential tool, used by both those who come to spend and those who come to work. The provision of adequate and convenient car parking facilities is therefore a key element of town centre vitality. An acceptable number of available spaces with a regular, quick turn-over for shoppers are the ideal while adequate longer stay, less convenient spaces for local owners/ workers and visitors must be considered too.
The table overleaf provides a summary of the car parking offer in the town. The data is broken down into the following categories:
• Percentage number of spaces in designated car parks and on-street
• Percentage number of short-stay, long stay and disabled spaces in designated car
parks and on-street
• Percentage of vacant spaces in designated car parks on a Market/ Busy Day and on a non-market/ quiet day
The data indicates that overall Colwyn Bay is a moderately easy place to find a parking space in during the week with 33% of spaces available on a market day and a normal day. These figures are comparable with benchmarked towns nationally. Parking usage does not show a significant difference on market day.
This indicative data also suggests that parking availability has not been adversely affected by construction of the new council offices and consequent reduction in space. Parking availability has consistently been 32-33% over the last three years.
There is an indication that the availability of on-street parking is no longer approaching a critical situation as in 2018. This may be due to the introduction of stricter enforcement regimes to ensure a suitable turn-over of spaces.
More detailed analysis would be required to examine how distribution around town matches users’ needs.

Nat.
Large Towns %
Colwyn Bay % 2016
Colwyn Bay % 2017
Colwyn Bay % 2018
Colwyn Bay
(number)
Colwyn Bay % 2019
Car Parks
Total spaces: 90% 75% 75% 75% 612 70%
Short stay spaces: (4 hours and under)
41% 23% 23% 23% 114 19%
Long stay spaces: (over 4 hours)
50% 67% 67% 67% 440 72%
Disabled spaces: 5% 6% 6% 6% 58 9%
Vacant spaces on a busy day:
31% 43% 33% 36% 210 34%
Vacant spaces on a quiet day:
38% 45% 36% 41% 217 35%
On-street
Total spaces: 10% 25% 25% 25% 273 30%
Short stay spaces: (4 hours and under)
84% 83% 83% 82% 211 77%
Long stay spaces: (over 4 hours)
6% 15% 15% 16% 58 21%
Disabled spaces: 19% 2% 2% 2% 4 1%
Vacant spaces on a busy day:
13% 28% 22% 15% 84 31%
Vacant spaces on a quiet day:
19% 23% 19% 18% 71 26%
Totals
Total spaces: 100% 100% 100% 100% 885 100%
Short stay spaces: (4 hours and under)
45% 41% 41% 40% 325 37%
Long stay spaces: (over 4 hours) 45% 54% 54% 55% 498 56%
Disabled spaces: 5% 5% 5% 5% 62 7%
Vacant spaces on a busy day:
30% 39% 30% 31% 294 33%
Vacant spaces on a quiet day:
36% 40% 32% 32% 288 33%

Data was also made available this year on car park usage at the Bayview Shopping Centre; specifically, the weekly totals of hourly parkers as recorded on exit. This shows more erratic use in 2019 though an uplift to 2018 levels from mid-August in a way that is consistent with the Bayview’s footfall.
0
5000
10000
15000
20000
25000
Bayview Parking Use 2018 & 2019
Hourly parkers 2018 Hourly parkers 2019

The People KPI 10: Business Confidence Survey
Survey forms were distributed to all the town centre businesses in Colwyn Bay with an agreed focus on independents in the town centre streets rather than multiples. The following percentage figures are based on the 103 returned Business Confidence Surveys. This represents 43% of the towns businesses and is both much higher than the return rate in recent years and national benchmarks of 25%.
Nat. Large
Towns %
Colwyn Bay % 2015
Colwyn Bay % 2016
Colwyn Bay % 2017
Colwyn Bay % 2018
Colwyn Bay
(number)
Colwyn Bay % 2019
Nature of business
Retail 57% 72% 79% 75% 64% 67 66%
Financ’l services 16% 11% 8% 8% 0 8 8%
Public sector 1% 0 0 0 0 1 1%
Food and drink 5% 13% 13% 13% 18% 17 17%
Accommodation 8% 4% 0 0 0 1 0
Other 12% 0 0 4% 18% 8 8%
Type of business
Multiple trader 11% 13% 17% 17% 18% 17 17%
Regional 11% 9% 4% 4% 5% 12 12%
Independent 78% 78% 79% 79% 77% 72 71%
How long has your business been in the town
Less than a year 5% 7% 4% 4% 18% 10 10%
One to five years 24% 14% 29% 21% 23% 25 24%
Six to ten years 11% 19% 4% 0 5% 11 11%
More than 10 yrs. 60% 60% 63% 75% 55% 57 55%
Compared to last year has your turnover
Increased 41% 25% 9% 17% 14% 32 32%
Stayed the same 29% 32% 35% 29% 41% 34 34%
Decreased 29% 43% 57% 54% 45% 35 35%
Compared to last year has your profit
Increased 36% 25% 9% 21% 27% 19 21%
Stayed the same 29% 21% 26% 25% 41% 37 41%
Decreased 35% 55% 65% 54% 32% 35 38%
Over the next 12 months do you think your turnover will
Increase 43% 25% 17% 17% 14% 30 31%
Stay the same 38% 21% 43% 26% 45% 40 41%
Decrease 20% 29% 39% 57% 41% 27 28%

Positive aspects of being located in town centre
National Large
Towns %
Colwyn Bay %
2015
Colwyn Bay %
2016
Colwyn Bay %
2017
Colwyn Bay %
2018
Colwyn Bay %
2019
Physical appearance 44% 19% 29% 17% 18% 37%
Prosperity of the town 42% - 13% 0 9% 26%
Environment 11% 6% 4% - - 20%
Geographical location 50% 33% 33% 21% 41% 48%
Mix of retail offer 36% 25% 38% 33% 18% 29%
Potential tourist customers 40% 42% 58% 17% 23% 37%
Potential local customers 60% 67% 58% 75% 59% 66%
Affordable housing 33% 6% 4% 17% 0% 25%
Transport links 28% 27% 42% 29% 23% 66%
Footfall 34% - - 29% 9% 30%
Car parking 25% 19% 17% 17% 5% 20%
Rental values/ property costs
24% 25% 13% 29% 27% 25%
Market (s) 23% 12% 21% 17% 14% 25%
Events/ activities 20% 8% 29% 21% 14% 27%
Marketing/ promotions 17% - 13% 0 5% 21%
Local partnerships/ organisations
12% - 4% 0 9% 22%

Negative aspects of being located in town centre
National Large
Towns %
Colwyn Bay % 2015
Colwyn Bay % 2016
Colwyn Bay % 2017
Colwyn Bay % 2018
Colwyn Bay % 2019
Physical appearance 18% - 38% 50% 76% 21%
Prosperity of the town 20% 47% 29% 50% 41% 38%
Labour pool 15% - 8% 13% 18% 20%
Geographical location 12% 13% 8% 0 5% 11%
Mix of Retail Offer 21% 26% 17% 8% 32% 31%
Empty units 46% - 67% 67% 73%
Potential tourist customers 9% 6% 13% 8% 36% 32%
Potential local customers 3% 2% 17% 8% 14% 9%
Affordable housing 14% 9% 4% 4% 14% 14%
Transport links 16% 6% 8% 4% 5% 7%
Footfall 16% - 42% 29% 64% 35%
Car parking 58% 62% 71% 63% 77% 53%
Rental values/ property costs 34% 34% 25% 21% 27% 20%
Market (s) 8% 11% 25% 4% 14% 31%
Local business competition 23% 21% 21%| 13% 18% 18%
Competition from localities 19% 26% 33% 8% 27% 23%
Competition from out of town 27% - 38% 33% 41% 36%
Competition from the internet 37% 36% 54% 17% 55% 43%
Events/ activities 22% - 13% 25% 32% 21%
Marketing/ promotions 21% - 13% 17% 27% 24%
Local partnerships/ organisations
4% - 4% 13% 14% 26%
Other 5% 17% 8% 13% 0 0

0% 10% 20% 30% 40% 50% 60% 70% 80% 90%
Physical appearance
Prosperity of the town
Labour pool
Geographical location
Mix of Retail Offer
Empty units
Potential tourist customers
Potential local customers
Affordable housing
Transport links
Footfall
Car parking
Rental values/ property costs
Market (s)
Local business competition
Competition from localities
Competition from out of town
Competition from the internet
Events/ activities
Marketing/ promotions
Local partnerships/ organisations
Other
Businesses' Changing Negative Perceptions 2015-19
Colwyn Bay % 2019 Colwyn Bay % 2018 Colwyn Bay % 2017
Colwyn Bay % 2016 Colwyn Bay % 2015 National Large Towns %

Do you believe that the new CCBC office development will have a positive or negative effect on business?
Positive 64%
Negative 27%
Undecided 9%
Two suggestions to improve the town centre
When businesses in Colwyn Bay were asked what two things that would improve the town centre, the main issues related to parking, opportunities to improve the retail mix, marketing/events and the physical appearance of the town centre.
Car Parking
• Better long stay parking
• Better parking for stores on Abergele Rd
• Car parking
• Free car parking
• Free or cheap parking
• Free parking
• Free parking
• Free parking
• Free parking
• Free parking facilities.
National Large
Towns %
Colwyn Bay %
2016
Colwyn Bay %
2017
Colwyn Bay %
2018
Colwyn Bay %
2019
Has your business suffered from any crime over the last 12 months?
Yes 36% 22% 42% 45% 43%
No 64% 78% 58% 55% 57%
Type of Crime
Theft 63% 56% 17% 32% 61%
Abuse 39% 22% 21% 18% 36%
Criminal damage
17% 44% 17% 9% 52%
Other 16% 22% 8% 0 2%

• Free parking for 2 hrs on all roads
• Free parking for at least 2 hours
• Improve parking
• Improve the town centre/street parking
• Increase local parking restrictions from 1 hour to 2 hours
• Long stay parking in the town centre
• Longer parking available on the streets
• Longer parking time limits for customers
• More free local parking
• More free parking
• More free parking
• More free parking for businesses as this would improve profits and jobs
• More parking
• More parking. More shops that aren't charity shops or pound shops
• No restriction on parking
• Off road parking a must to improve footfall at the east end of town
• Open station Rd or more free parking
• Parking
• Parking, lack of parking for customers, we should be like Llandudno free parking for 2-3 hours then pay and display
• Residents parking will help
• Stop/reduce significantly the cost of parking at the station and on the promenade
• stopping people parking all day in 1-2 hour slots and outside shops illegally stopping potential customers seeing shops and parking to visit them.
• Free parking for at least 1 hour so that it encourages people to come.
Retail Mix
• An active control/plan for the proper distribution of a variety of outlets, rather than the saturation of coffee and charity shops mixed with hairdressers
• Attract a major high street trader to the town
• Attract businesses into Station Rd and improve appearance of commercial units there and also on Abergele Rd and Conway Rd
• Attracting a big high street name such as M&S
• Bigger brand stores opening in the area
• Choice of retailers. Affordable rents. Marketing of events needs improving
• Clothes shops
• Continue to attract small businesses in retail units
• Increase independent trades
• Increase shop variety. Increase police presence. Shop watch. Shoplifting issues need to be tackled. Tackle homelessness
• Larger high street names trading in the town
• Less food licenses and salons

• Less pound shops and attract more quality shops where you can buy shoes or a nice outfit, customers go out of town for these things at the moment
• More variety in the mix of retail available in the area, less cafes and charity shops
• Too many food outlets. Less of the same type of shops, too many doing the same. Need variety again to bring more people in.
• Try to attract a new major retailer
• Close the supermarket
• More shops/ bakery
Business Rates and Property Costs
• Cheaper rates for businesses
• Firmer approach to making sure properties are maintained
• Lower business rates. Tackle homelessness
• Lower council tax
• Lower rates to encourage customers and businesses
• Lower the rates. Sort out drug and alcohol problems. More free parking. More PCSOs. Make the town more inviting and clean up the empty shops
• Reduce business rates
• Reducing rates
Marketing and Events
• Advertise positive attributes such as Porth Eirias, beaches and Eirias Park
• Advertising local events properly
• Advertising the whole of the towns shopping areas
• Better advertising for the stores already here
• Better publicity of all the events taking place in town
• Local events
• Make businesses aware of the events that are going on in the town, ie the 1940s weekend
• Make the town more appealing to younger people
• Making it more friendly to dog owners and dog tourists
• More events
• More events to encourage shoppers and visitors
• More local events like the 1940s weekend
• More local marketing to increase footfall
• More open events in the town
• More tourists
• Promote events and activities more, eg U20s six nations
• Rather than event after event and then nothing, the council should be organised
• Where is the appeal for someone to come to Colwyn Bay
• Have an indoor market
• It is a pass through town for most people

• More awareness. More signage. Lightning in the tunnel between beach and town.
Leadership
• Changes must be made at national level to really make a difference
• Listening to people who want to make a change to work together
• Help for struggling businesses financially
• Money spent on the town
• More money spent on town by the council. More signage to the pier
• Regeneration grants to be more readily accessible and not limited to one street at each time
Physical Appearance
• Cleaner town, more bins and emptied more regular before the bay gets a bad name for been scruffy.
• More frequent bin collections for businesses
• Sort out the refuse, as this is a big issue and people tend not to come back to the area or the theatre
• The town looks dirty and unkempt
• Tidy up empty premises
• Tidy up the Greenfield Rd looks awful as a new visitor driving in
• Weekly bin collections
• Appearance
• Maintain rotting buildings
• More road sweepers to make the rest of the town look nice, not just the council offices, it looks like the 3rd world behind the theatre
• Shop facias on the high street need a facelift
• Streetlights also very poor in the winter, Christmas lighting has also decreased in recent years
• Tidy the area
BID
• Don't see what positive outcome has come to my business for the BID
• Get rid of BID, they have bankrupted small businesses who are barely breaking even
• Get rid of congregations of undesirables hanging around
• Get rid of the BID, it's done nothing
• Hold the Colwyn BID accountable for actions and expenditure
• Scrap the BID and encourage local businesses to make their own improvement
• Stop the BID as it's poorly managed. Open station Rd to traffic
Empty Shops
• Attempt to fill empty premises
• Less empty shops, attract more businesses.
• Endeavour to quickly fill any empty premises with appropriate tenants

• Fill empty shop units
• Fill empty units quicker
Safety
• Higher police presence
• More PCSOS seen in the town moving on undesirables who loiter
• More police
• More police presence within the town
• More policing on the streets
• More policing to move on vagrants around the town, this would make shoppers feel safer and create a better atmosphere in the town
Social issues
• Better control of homelessness and drug use
• Removal of beggars, drunks, tramps and numerous unsavoury characters
• Too much attention on rehabers not working, local clientele
• Get the homeless off the streets, they put people off from walking around with their constant begging, drinking and swearing
Traffic and transport
• Better flow of traffic to be directed through the town, rather than in and past the shops then back on the A55
• Better signage coming off A55 to encourage people to head more towards Stermat rather than shopping centre
• Bus from shopping centre with stops along Penrhyn Rd
• Connection between beach to the town
• Improve the link between town and promenade
• Links between prom and town urgently need improvement
• Traffic lights to enable crossing outside Colwyn theatre
• Traffic wardens that use their brains, not all is black and white
Miscellaneous
• Sell the land next to the train station
• Use local companies to do surveys like these

0%
10%
20%
30%
40%
50%
60%
70%
2015 2016 2017 2018 2019
Changing Profitability of Colwyn Bay Businesses
Increased Stayed the same Decreased
0%
10%
20%
30%
40%
50%
60%
National % Colwyn Bay 2015%
Colwyn Bay 2016%
Colwyn Bay 2017%
Colwyn Bay 2018%
Colwyn Bay 2019%
Colwyn Bay Changes in Projected Turnover
Increase Stay the same Decrease

Analysis
Of the businesses that responded to the survey, 66% were retailers of which 17% were national or regional multiples and 21% were independents. This is representative of the mix of business types in the town. 66% of the businesses are also long-established in Colwyn Bay having been based there for more than six years.
In terms of recent business performance, 66% said that turnover had increased or stayed the same over the last year. This combined figure is comparable to the national average of 77% for large towns and is significantly improved on the previous year’s figure (55%). Indeed, the trend in business turnover in Colwyn Bay has been progressively positive over the last five years.
The proportion of Colwyn Bay businesses that had increased or maintained their profitability in the last 12 months was 62% . This is slightly lower than the national averages for large towns (65%) and n the previous year’s figure for the town (68%). The trend in business profitability over the last five years is nevertheless, broadly positive from a low in 2016 of 35%.
Looking to the future, Colwyn Bay businesses are markedly more positive than the last two years with 72% expecting turnover to increase or stay the same compared to 59% and 43% in 2018 and 2017 respectively.
Businesses in Colwyn Bay value the potential for local customers (66%), transport links (66%), geographical location (48%), potential for tourist customers (37%), physical appearance (37%). As 2019 is the first year when the new beach was fully operable, there might be a greater focus on tourist customers in future years.
Businesses in Colwyn Bay are only significantly negative about car parking (53%), the prosperity of the town (38%) and competition from out-of-town shopping (36%). This is much more moderate than 2018 when a majority of businesses that responded considered car parking (77%), physical appearance (76%), empty properties (73%), footfall (55%) and competition from the internet (55%) to be key negative issues. Indeed, though variability in sample size means trends are uncertain to define, overall businesses’ negative perceptions have declined markedly over the five years since 2015.
Nearly two-thirds of businesses who responded (64%) were positive about the impact of the new council offices compared to 27% who were negative. Anecdotally, the suggestion is that negative perceptions relate to issues connected with anti-social behaviour of some council clients though effectively this has not changed. There may also be some negative perceptions about the impacts on town centre car parking although usage data suggests that there has not been a negative effect.
When businesses in Colwyn Bay were asked what two things that would improve the town centre the main issues related to parking, opportunities to improve the retail mix, marketing/events and the physical appearance of the town centre. There were proportionally fewer concerns about local, civic leadership and property cost compared to 2018.

KPI 11: Town Centre Users Survey
The aim of the Town Centre Users Survey is to establish how your town is seen by those people who use it. By asking visitors, of all types, a more detailed picture can be obtained from different perspectives -as what matters to regular visitors can be very different to someone who has never been to the place before.
The following percentage figures are based upon the 100 completed Town Centre User Surveys.
Nat.
Large Towns %
Colwyn Bay % 2015
Colwyn Bay % 2016
Colwyn Bay % 2017
Colwyn Bay % 2018
Colwyn Bay % 2019
Gender
Male 36% 36% 48% 50% 38% 34%
Female 64% 64% 52% 50% 62% 66%
Age
16-25 8% 4% 11% 7% 4% 8%
26-35 15% 4% 10% 6% 5% 5%
36-45 20% 7% 2% 5% 7% 5%
46-55 21% 14% 13% 18% 15% 11%
56-65 18% 23% 19% 17% 25% 27%
Over 65 18% 48% 45% 43% 45% 44%
What do you generally visit the Town Centre for?
Work 15% 7% 3% 11% 21% 15%
Convenience shopping
32% 26% 50% 35% 46% 18%
Comparison shopping
13% 21% 17% 25% 17% 27%
Access services
17% 14% 16% 17% 4% 18%
Leisure 14% 3% 11% 8% 3% 22%

Nat. Large
Towns %
Colwyn Bay % 2015
Colwyn Bay % 2016
Colwyn Bay % 2017
Colwyn Bay % 2018
Colwyn Bay % 2019
How often do you visit Town Centre?
Daily 21% 13% 28% 3% 21% 27%
More than once a week
34% 31% 46% 50% 46% 40%
Weekly 20% 21% 6% 34% 17% 9%
Fortnightly 7% 3% 5% 1% 4% 11%
More than once a Month
5% 5% 8% 2% 3% 5%
Once a Month or Less
11% 16% 3% 5% 6% 2%
First visit 1% 12% 4% 3% 4% 0%
How do you normally travel to Town Centre?
On foot 28% 26% 34% 31% 22% 38%
Bicycle 2% 0% 1% 0 3% 0%
Motorbike 0 0% 1% 0 1% 0%
Car 58% 49% 36% 55% 58% 54%
Bus 9% 17% 23% 10% 14% 8%
Train 1% 5% 0 0 1% 0%
Other 2% 3% 4% 3% 0% 0%
On your normal visit to the Town Centre how much do you normally spend?
Nothing 3% 4% 9% 6% 6% 2%
£0.01-£5.00 10% 7% 12% 22% 18% 11%
£5.01-£10.00 20% 22% 26% 19% 23% 25%
£10.01-£20.00 29% % 17% 25% 22% 28%
£20.01-£50.00 28% 25% 23% 12% 20% 31%
More than £50.00 10% 8% 13% 15% 10% 2%
What are the positive aspects of the Town Centre?
Nat. Large
Towns %
Colwyn Bay % 2015
Colwyn Bay % 2016
Colwyn Bay % 2017
Colwyn Bay % 2018
Colwyn Bay % 2019
Physical appearance 41% 69% 40% 47% 47% 46%
Cleanliness 35% 84% 44% 63% 55% 49%
Retail offer 32% 72% 46% 44% 42% 49%
Customer service 27% 99% 84% 86% 91% 94%
Cafes/ restaurants 52% 86% 67% 72% 95% 76%
Access to Services 61% 81% 86% 87% 83% 68%
Leisure facilities 20% 44% 44% 54% 42% 43%
Cultural activities/events 25% 55% 58% 60% 48% 48%
Pubs/ bars/ nightclubs 23% 65% 15% 31% 26% 36%
Transport links 27% 93% 77% 82% 82% 92%
Ease of walking around the town centre
65% 94% 92% 93% 94% 99%
Convenience e.g. Near where you live
65% 88% 84 89% 90% 94%
Safety 34% 86% 76% 77% 78% 75%
Car parking 29% 55% 33% 57% 58% 56%
Markets 42% 55% 49% 61% 41% 33%

What are the negative aspects of the Town Centre?
Nat. Large
Towns %
Colwyn Bay % 2015
Colwyn Bay % 2016
Colwyn Bay % 2017
Colwyn Bay % 2018
Colwyn Bay % 2019
Physical appearance 32% 46% 35% 36% 35% 54%
Cleanliness 23% 27% 32% 21% 19% 50%
Retail offer 43% 43% 38% 43% 41% 48%
Customer service 9% 3% 2% 5% 1% 4%
Cafes/ restaurants 9% 9% 6% 4% 2% 4%
Access to Services 6% 9% 6% 5% 8% 24%
Leisure facilities 18% 12% 8% 6% 11% 19%
Cultural activities/events 17% 5% 11% 10% 8% 23%
Pubs/ bars/ nightclubs 18% 9% 14% 12% 13% 14%
Transport links 17% 5% 6% 10% 6% n/a
Ease of walking around town centre
8% 5% 3% 5% 3% 1%
Convenience e.g. Near where you live
6% 5% 8% 7% 5% 5%
Safety 11% 12% 15% 16% 7% 18%
Car parking 43% 16% 37% 21% 18% 28%
Markets 15% 46% 25% 22% 36% 51%

0% 20% 40% 60% 80% 100%
Physical appearance
Cleanliness
Retail offer –groceries
Independent shops
National chains
Value for money
Customer service
Cafes/restaurants
Access to services
Leisure facilities
Cultural activities/ events
Pubs/ bars
Road links
Traffic
Public transport
Ease of walking
Convenience
Safety
Car parking
Markets
Customers'Perception of Colwyn Bay
Positive Neutral Negative

0% 20% 40% 60% 80% 100%
Physical appearance
Cleanliness
Retail offer
Customer service
Cafes/ restaurants
Access to Services
Leisure facilities
Cultural activities/events
Pubs/ bars/ nightclubs
Transport links
Ease of walking
Convenience
Safety
Car parking
Markets
Changing Customer Positive Perceptions for Colwyn Bay
2019 2018 2017 2016 2015 National Large Towns

When customers of Colwyn Bay were asked what two things would improve the town centre, the most popular responses related to the appearance of the town including a desire to fill empty premises. Parking improvements and calls for more diverse shops were also prominent responses.
Retail Mix
• Less charity shops, less empty shops.
• ATM on station Rd
• Banking facilities as the Halifax has just closed
• Better shops on high street
• Clothing shops are limited, can't get everything that you need.
• Encourage the bigger chain stores
• Improve the retail offer, less pound shops and more quality shops
• Improve the town centre, less charity shops
• More high street chains. Baby shops, selling pushchairs etc
• More independent businesses, less chains
• More independent shops
• More shops
• More shops to attract people in
• More small independent shops.
• Need to support new shops and businesses in the town
• More shops top open, more support for new independent shops.
Nat. Large Towns %
Colwyn Bay % 2015
Colwyn Bay % 2016
Colwyn Bay % 2017
Colwyn Bay % 2018
Colwyn Bay % 2019
How long do you stay in the Town Centre?
Less than an hour 17% 14% 32% 17% 21% 37%
1-2 hours 42% 33% 43% 42% 52% 33%
2-4 hours 25% 35% 16% 25% 21% 19%
4-6 hours 6% 10% 5% 3% 2% 4%
All day 9% 8% 4% 11% 5% 7%
Other 1% 0 0 0 21% 0%
Would you recommend a visit to the Town Centre?
Yes 72% 65% 56% 74% 68% 62%
No 28% 35% 40% 25% 32% 38%

• Encourage smaller independent shops
• More chain stores
• More chain stores. More plant shops selling plants and seeds. Florists.
• Better shops.
• Ensure that everything is available in the town, rather than just hairdressers and same shops over and over.
Appearance
• Better cleanliness, especially the gutters
• Better standard of people need to be attractive, change the economy of the area
• Business owners have had enough, all businesses in the town are struggling. People in the town are fed up of surveys! Drains needs to be maintained. Monday, Wednesday need to have street cleaners, as the market has an impact and weekend drinkers on the street scene. Need more bins.
• Clean up the side streets
• Clean up the town
• Clean up the town
• Cleanliness is bad
• Empty the bins. Cleanliness needs to be sorted out. Fill up the empty shops.
• Needs a good revamp as its tired and run down
• Needs tlc, town needs money spending on it.
• Shabby, needs to be tidied up
• Shop fronts are scruffy and need tidying
• Some areas are very dirty and need to be cleaned up.
• Station Hotel needs sorting out.
• Stop spending money on Wales in bloom, spend money on the appearance
• Streets need to be cleaned better.
• The town a lot of tlc
• The town needs lots of care and attention.
• The town needs to improve the obvious issues such as land next to whetherspoons and the Imperial hotel
• Tidy the town up, a bit of tlc
• Tidy up the frontages of the shops and buildings
• Tidy up the level of street furniture
• Tidy up the rear of the Halifax bank, it's a mess.
• Tidy up the shop fronts
• Try to improve the cleanliness of the town.
• Flats in the town centre. Stop knocking down and destroying the towns heritage.
• Imperial hotel needs sorting out
• Imperial hotel needs to be sorted out
• Land next to the Wetherspoons pub needs to be sorted, why is it just a jungle.

• Needs signs that show the way to the beach.
• Parts of the pier are still coming up in the sand and are dangerous
• Signage is lacking down at the boat club, and along the new promo
• The seafront is a mix of good and bad
• Town is drab. Tidy up the lime stained walls as this is the first impression of the town.
• New council officers are an eyesore and not in keeping with the surrounding area.
Traffic and Transport
• Bus transportation is very poor, now facing a reduced service
• Connecting the beach to the town
• Connecting the sea to the town must be a priority
• Connecting the sea to the town, a better road or connection somehow
• Cycle paths down on the promenade are confusing and some areas are not fit for purpose.
• Improve the bus services
• Sort out the pedestrian areas as they have cut off the seafront from the town
• Station Rd and Conwy Rd needs to be improved
• Station Rd needs more clarity around the traffic restrictions as its complex and dangerous
• The drive in is not great, not a positive start to the experience of the town.
• More buses than just the one an hour
• Really bad Pot holes the pavement across the road from the council officers and Parking
• Better parking near the independent shops
• Better parking near whether spoons, for disabled visitors
• Car parking needs to be improved, more convenient parking is required
• Cheaper parking and free parking on the promenade
• Free parking at the seafront. Better parking in the town. Needs something for younger kids to do. Less charity shops.
• Free parking, is essential, will bring customers in
• Improve the amount of carparking
• Sort out parking areas at the new council offices
• Free parking on the sea front.
• Parking improvements needed
• Parking is really bad. Why isn't the council officers parking available during the evenings and weekends as promised. Too many doubles hello lines make parking an issue for visitors.
• Parking near to stermatt is a problem that needs to be sorted, illegal parking is taking place and needs to be tackled
• Parking parking parking
Leisure
• Leisure facilities for younger people. McDonald's restaurant

• More centralised leisure
• Leisure facilities for younger people. McDonald's restaurant
• Needs more leisure facilities
• Youth related leisure, photography and art related facilities
Empty Properties
• Empty shops need filling. Above the shops need sorting out, painting and care.
• Fill the empty shops
• Fill the empty shops
• Fill up the empty shop. Encourage better quality retailers. Improve the parking facilities. Less charity shops. Clean the town centre.
• Fill up the empty shops
• Fill up the empty shops.
• Needs investment and to sort out empty shops.
• Sort out the empty shops and give the town some tlc. Sort out school hours, as they all seem to finish at the same time. After school clubs need to be more flexible.
• Sort out the empty shops.
• Sort out the empty shops. More rubbish bins. More money spent generally on the town.
• Fill the empty shops and buildings.
• Less empty shops in the high street
Business Rates
• Encourage the small independent shops, reduce business rates.
• Instead of business rates, have a local profit business tax
• Lower business rates.
• Lower the business rates.
• Lower business rates, to encourage new business
• Lower rents
Leadership
• Town could be fantastic but hasn't got the ambition.
• More community interaction to enable the community to work together to improve the town. Local council needs to be more transparent with meetings and decisions.
• More investment into the high street
• Needs to improve the economic performance of the area
• Regenerate the town centre, focus on the centre rather than retail parks
• Need to encourage pride in the town
Market
• A better market
• Better market

• Farmers market needs to be attached to the main market, organic vegetables for example.
Crime, Safety and Anti-social Behaviour
• Stop youngsters on bikes, causing anti-social behaviour and endangering the public
• Prince Madoc causes anti-social behaviour
• More things for teenagers, clubs and safe hang out spaces
Social Issues
• Day classes for the more vulnerable people
• Deal with the low level anti-social behaviour and the drug taking. Sort out the deprivation experienced by the local community.
• Homelessness is a growing issue here, the community needs to deal with this. Deprivation is a problem in the area.
• Sort out some of the homelessness
• The community is struggling and has signs of deprivation and weakness, ie children smoking and gangs. Not enough police
• Town needs to be cleared of drugs and criminal activity.
• Services that are also appropriate for young adults
• Public toilets are being used as a drugs den, rear of the old Specsavers.
• Improve the levels of anti-social behaviour
• Improve the population
Marketing and Events
• Attract more tourists
• Community pride needs to be embraced and fostered
• Make more of the natural world and the wildlife around the town, information boards etc
• Make more of the seafront, more choices
• More live and activities injected into the town
• More music and dancing in the street
• Needs more of an evening economy
• Needs more stuff to do in the town centre
• Needs to advertise the zoo better
• Seems like lots of money goes to other areas and this isn't fair. This town could also be a tourist destination too.
• Sort the pier out. Need more attractions in the town to attract visitors.
• The area needs to diversify and attract new residents

What word would you use to sum-up the town centre?
The word cloud below gives an indication of the most popular words used by town centre users to sum-up Colwyn Bay.
Such a word cloud, whilst only indicative, is useful in understanding how the town centre is perceived by current users who are familiar with it. It can be helpful in determining how the town can be honestly promoted to potential new users in a way that creates achievable expectations. All of the most prominent words are a mixture of positive words, such as nice, convenient, pleasant and interesting, or negative words such as rundown, average, dying and tired. Collectively these words paint a picture of a partially appealing place to visit that is in need of some updating and revitalisation.

Analysis
The responses from town centre users indicate an overall sample from this mid-week survey that comprises a modest majority of females (66%) and that this is comparable other small towns. There was a limited spread of age categories with an older age profile for the local population compared to other nationally benchmarked towns. Most people are in town for comparison shopping (27%), followed by leisure (22%), convenience shopping (18%) and to access services (18%). The relatively high per centage of comparison shoppers is a positive indicator for the high proportion of such retailers that are based in the town.
The vast majority (76%) of town centre users surveyed visit Colwyn Bay at least once a week, which is slightly higher than other small towns nationally. A relatively high proportion (38%) of the on-street users interviewed came into town on foot whilst a majority travelled by car (54%). These figures are typical for large towns nationally though show a slightly higher than average access on foot.
A third of town centre users (33%) spend more than £20 on a visit to the town centre. This is slightly lower than national averages (38%). Over a third of the users (37%) spend less than 1 hour in town and are therefore relatively functional in their use of Colwyn Bay compared to towns nationally (17%). This is much higher than benchmarked towns nationally (21%) which highlights the need and opportunity to encourage town centre users to dwell longer in Colwyn Bay. A further third (33%) 1- 2 hours in the town centre.
When asked about the positive aspects of Colwyn Bay town centre, ease of walking around the town centre (99%), convenience (94%), customer service (94%), transport links (92%), cafes/restaurants (76%), safety (75%) and access to services (68%), were all valued by more than three-quarters of town centre users. All of these levels of response are higher than for averages benchmarked towns nationally.
These positive perceptions have been fairly consistent over the last 5 years. Perceptions about the market and access to services have become less positive over this period. The latter may reflect recent bank closures.
In terms of negatives, there were fewer responses than positives, with only physical appearance (54%), cleanliness (50%) and retail offer (48%) rating poorly with more than a third of town centre users. All of these issues are perceived as worse than in benchmarked towns nationally.
These negative perceptions are broadly consistent with users’ priorities to improve the diversity of shops and enhance the appearance of the town centre. Parking in contrast, however, was viewed positively by a majority of town centre users (56%).
When asked to give one word that sums-up Colwyn Bay town centre, the most prominent words are a mixture of positive and negative words that indicate a partially appealing place to visit that is in need of continued revitalisation.

KPI 12: Shoppers Origin Survey
The Shoppers Origin Survey tracks the general area that your town centre visitors originate from. The data can be used to target local marketing or promotional literature. It can also be used as evidence of the success of such campaigns by gauging the penetration into the population.
The postcodes gathered from businesses are split into 3 categories to be able to compare with other towns. The categories are:
• Locals; those who live within a Post Code covering the town
• Visitors; those who live within a Post Code less than a 30 minute drive away
• Tourists; those who live within a Post Code further than a 30 minute drive away
National Large Towns %
Colwyn Bay % 2016
Colwyn Bay % 2017
Colwyn Bay % 2019
Locals 57% 56% 64% 68%
Visitors 27% 40% 27% 19%
Tourists 16% 4% 8% 14%
The 2019 figures for shoppers’ origin for Colwyn Bay from this survey indicate a slightly higher proportion of tourists (14%). Over two-thirds of users (68%) come from the town itself and this is slightly higher than benchmarked towns nationally (57%).
Shoppers Origins 2019
Local 68%
Visitors 19%
Tourists 14%


![005014911 00161 · MINCHIN Edward Corker [411] 15 August Probate of the Will of Edward Corker Minchin £órmerly of 97 Stephen's. Dublin and Barberry Hill Colwyn Bay County Denbigh](https://img.pdfslide.net/doc/110x75/5e6f6b39aa1d1144ac296a57/005014911-minchin-edward-corker-411-15-august-probate-of-the-will-of-edward-corker.jpg)