Embed Size (px)
Citation preview

Combined health impact assessment
of noise and air quality
in urban agglomerations An explorative study
ETC/ACM Technical Paper 2017/12 April 2018
Danny Houthuijs, Frank de Leeuw
The European Topic Centre on Air Pollution and Climate Change Mitigation (ETC/ACM) is a consortium of European institutes under contract of the European Environment Agency
RIVM Aether CHMI CSIC EMISIA INERIS NILU ÖKO-Institut ÖKO-Recherche PBL UAB UBA-V VITO 4Sfera

Front page picture: High-rise blocks in agglomeration (free of copyright) Author affiliation: Danny Houthuijs, Frank de Leeuw (RIVM, NL)
DISCLAIMER
© ETC/ACM, 2017. ETC/ACM Technical Paper 2017/12 European Topic Centre on Air Pollution and Climate Change Mitigation PO Box 1 3720 BA Bilthoven The Netherlands Phone +31 30 2748562 Fax +31 30 2744433 Email [email protected] Website http://acm.eionet.europa.eu/
This ETC/ACM Technical Paper has not been subjected to European Environment Agency (EEA) member country review. It does not represent the formal views of the EEA.

Contents Executive summary .................................................................................................. 5
1 Introduction ...................................................................................................... 6
2 Data and methodology .................................................................................... 7
2.1 Introduction ............................................................................................. 7
2.2 Road traffic noise .................................................................................... 7
2.2.1 Exposure ................................................................................................. 7
2.2.2 Health effects .......................................................................................... 7
2.3 Air quality ................................................................................................ 9
2.3.1 Exposure ................................................................................................. 9
2.3.2 Health effects ........................................................................................ 11
2.4 Disability-adjusted life years .................................................................. 14
2.4.1 Introduction ........................................................................................... 14
2.4.2 Road traffic noise .................................................................................. 14
2.4.3 Air quality .............................................................................................. 15
2.5 Statistical analysis ................................................................................. 16
3 Results ............................................................................................................ 18
3.1 Assessment in 479 agglomerations ...................................................... 18
3.2 Exposure to road traffic noise and air quality ........................................ 18
3.3 Clusters of agglomerations based on environmental quality ................. 19
3.4 Burden of disease due to road traffic noise and air quality .................... 19
3.5 Clusters of agglomerations based on burden of disease per 100,000 inhabitants ......................................................................... 21
3.6 Clusters of agglomerations based on burden of disease as percentage of total burden of disease .............................................. 22
3.7 Combined burden of disease per agglomeration ................................... 24
3.8 Ranking agglomerations on the combined burden of disease ............... 27
4 Discussion ...................................................................................................... 33
4.1 Introduction ........................................................................................... 33
4.2 Uncertainties ......................................................................................... 33
4.2.1 Selection of health endpoints with sufficient proof of a causal relation .. 33
4.2.2 Assessment of population exposure distributions ................................. 34
4.2.3 Identification of exposure-response relations in dimensions compatible with the exposure distributions ............................................ 35
4.2.4 Estimation of the number of cases with the specific health endpoint .... 35
4 ETC/ACM Technical Paper 2017/12
4.2.5 Estimation of the duration and of selection of appropriate weighing factors .................................................................................... 36
4.2.6 Computation of the total health burden ................................................. 36
4.3 Comparison with results from other studies .......................................... 37
4.4 The use of DALYs for comparison of noise and air pollution impacts ... 39
6 Conclusions ................................................................................................... 40
References .............................................................................................................. 41
Annex 1 Update of methodology for health impact assessment of noise .... 45

Integrated health impact assessment of noise and air quality in urban agglomerations. An explorative study. 5
Executive summary Noise and air pollution are two (closely related) important environmental and social issues. Elevated levels of noise and air pollution are found in densely populated areas, like agglomerations. To give insight in the combined risks of noise and air pollution, we carried out a health assessment in urban areas in Europe that builds upon data reported by the EU Member States under the Environmental Noise Directive (END) (EU, 2002) and the Air Quality Directive (EU, 2008). An urban agglomeration was defined as an agglomeration that was included in the second round of noise mapping in 2012 according to the END. We included in the assessment road traffic noise, particulate matter, ozone and nitrogen dioxide.
The key messages from this report are:
• We were successful in ranking 497 urban agglomerations in Europe on their combined health impact of road traffic noise and air pollution.
• The combined health impact of road traffic noise and air pollution in agglomerations is, on average, 1,745 DALYs per year per 100.000 inhabitants. This corresponds with 6.2% of the total burden of disease for all causes per year.
• Particulate air pollution contributes, on average, for 45% to the total impact, followed by nitrogen dioxide with 33%. Road traffic noise is associated with 21% and ozone with 2% of the combined burden of disease by road traffic noise and air pollution.
• There is a 7 to 9 fold difference in the health impact between the highest and lowest ranked agglomeration. This difference indicate that there is ample room for improvement of the health of citizens in European agglomerations by policy measures aiming at further reduction of road traffic noise and air pollution.
• Several points of improvements were identified in the combined health impact
assessment for road traffic noise and air pollution. Therefore the results of this report should be considered as explorative.
6 ETC/ACM Technical Paper 2017/12
1 Introduction It is well documented that the exposure to noise and air pollution may lead to adverse health effects. Noise exposure can lead to annoyance, sleep disturbance and increases the risk of hypertension and cardiovascular disease. Hypertension and cardiovascular disease are important risk factors for premature mortality; noise exposure can indirectly reduce life expectancy as well. Exposure to air pollution may lead to premature mortality and morbidity, mainly related to respiratory and cardiovascular diseases. Transport, in particular road transport, and industry are important sources both for noise and air pollution. High exposure levels can be found in densely populated areas. Reporting under the Environmental Noise Directive (END) (EU, 2002) shows that 42 million urban residents are exposed to noise levels exceeding 55 dB Lden (Houthuijs et al., 2014). According to the EEA (2017) 82-85 % of the urban population in the EU-28 are exposed to PM2.5 concentration exceeding the air quality guidelines (AQG) as recommended by the WHO (2006). However, the difference in the definition of “urban areas” as applied in both studies disables an estimation of the cumulative risk of noise and air pollution in urban regions. The objective of this study is to assess the combined burden of disease attributable to the exposure to environmental noise and ambient air pollution in urban agglomerations in Europe. A second objective was to explore if urban agglomerations in Europe could be ranked based on the impact of the combined exposure. In this report the definition of an urban agglomeration is according to the one given in the END. The reason to use the END definition as a starting point is that countries report on the aggregated noise exposure distribution which cannot be unravelled to assess the distribution for other areas. The health assessment builds upon data reported by the EU Member States under the Environmental Noise Directive (EU, 2002) and the Air Quality Directive (EU, 2008). Environmental noise is limited in this report to road traffic noise, since in the Noise in Europe 2014 report (EEA, 2014) it was identified that about 90% of the health impact of transport and industrial noise may be related to road traffic noise. Chapter 2 discusses the methodology of the combined assessment. The sources of the exposure distribution for road traffic noise and air pollution, the exposure/concentration –response relations and additional data to quantify the health impacts for noise and air pollution are described. The concept of burden of disease that was used to integrate the health impact of road traffic noise and air pollution is introduced. The results of the health impact assessment are given in Chapter 3. The contribution of the health risks to the overall burden of disease is given. Regions in Europe with a similar pattern for the combined exposure and for the combined health impact of road traffic noise and air pollution in agglomerations are identified. A summary of the health impact in European capitals and in agglomerations with more than 2 million inhabitants is presented. Also, the top 15 of the best and the worst agglomerations is given. The report ends with a discussion (Chapter 4) and conclusions (Chapter 5).

Integrated health impact assessment of noise and air quality in urban agglomerations. An explorative study. 7
2 Data and methodology 2.1 Introduction
In section 2.2 the source of the exposure distribution and the relevant exposure response relations for road traffic noise are described. This is done for air quality in section 2.3. To be able to express the health impact of air pollution and road traffic noise in the same units, we expressed their burden of disease into disability-adjusted life years section (2.4). Chapter 2 ends with a section on the applied statistical methods. 2.2 Road traffic noise
2.2.1 Exposure
The noise exposure distribution in the agglomerations is based upon information from the EEA’s member countries for 2012 obtained using noise modelling and measurement methods, and reported to the EEA up to 15 April 2016. The exposure data related to major roads and major railways in agglomerations is not complete (Blanes et al., 2016). Gap filling has been applied in order to estimate the noise exposure distribution in all agglomerations under study. The methodology is described in a working paper (ETC/ACM, 2015) based on previous work done by Extrium (2013). Health and well-being risks due to noise are also present at noise levels below the lowest values of Lden (55 dB) and Lnight (50 dB) that are commonly applied in the END assessments. The END results were extrapolated to lower noise levels using a statistical approach to estimate the complete population exposure distribution of road traffic noise during the 24 hour (Lden) and the night period (Lnight). Also the noise exposure distribution was refined from 5 to 1 dB (Houthuijs et al., 2015). 2.2.2 Health effects
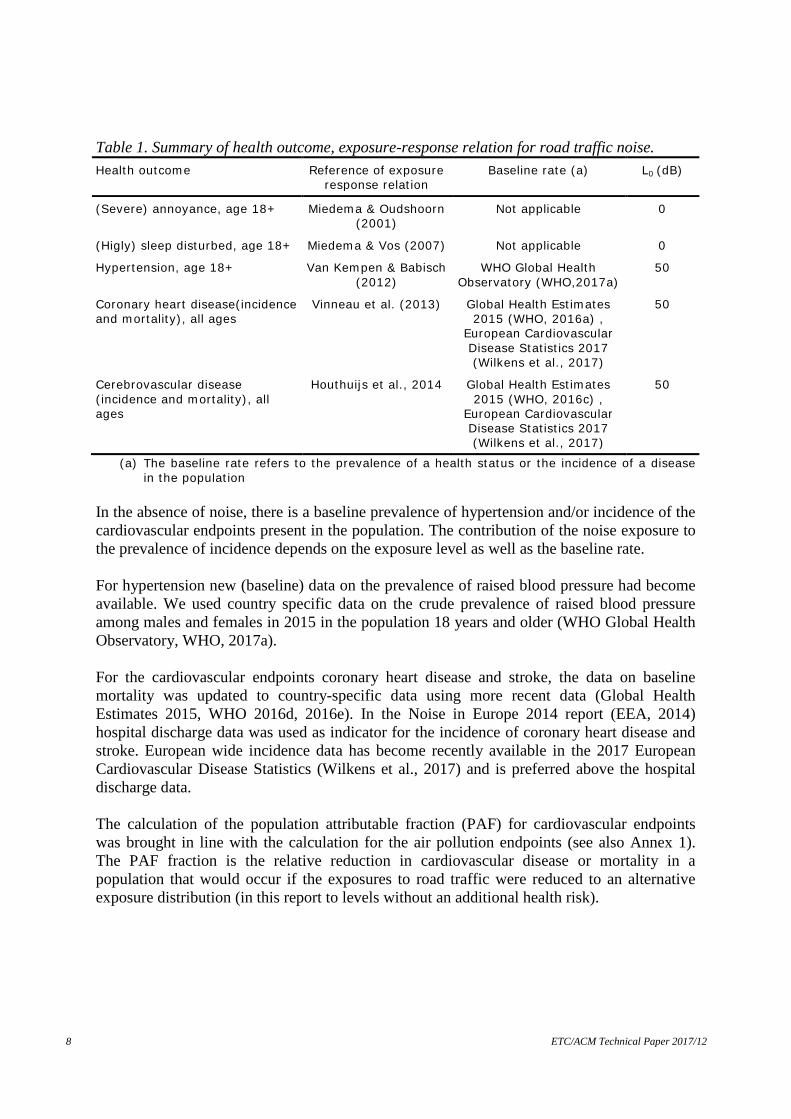
The health impact assessment was carried out with the exposure response relations that were used for the health impacts assessment reported in the Noise in Europe 2014 report (EEA, 2014). A summary of the relevant health outcomes and exposure-response relations for road traffic noise is given in Table 1. Details of the method of the health impact assessment are described in Houthuijs et al. (2014). For this report, we updated some of the baseline data and we applied a slightly different calculation method for cardiovascular endpoints (for details, see Annex 1). The exposure-response relations for severe annoyance and highly sleep disturbed only depend on the noise level (Lden and Lnight respectively), so they can be applied directly when the noise level is known. Often the relations are applied as a polynomial with a forced starting point for the exposure-response functions (L0 is Table 1) at 42 dB Lden or 40 dB Lnight. In this report we applied the original derived exposure-response relations from the papers (Miedema and Oudshoorn, 2001; Miedema and Vos, 2007) which makes extrapolation of the exposure-response relation to lower noise levels than 42 dB Lden or 40 dB Lnight possible.
8 ETC/ACM Technical Paper 2017/12
Table 1. Summary of health outcome, exposure-response relation for road traffic noise. Health outcome Reference of exposure
response relation Baseline rate (a) L0 (dB)
(Severe) annoyance, age 18+ Miedema & Oudshoorn (2001)
Not applicable 0
(Higly) sleep disturbed, age 18+ Miedema & Vos (2007) Not applicable 0
Hypertension, age 18+ Van Kempen & Babisch (2012)
WHO Global Health Observatory (WHO,2017a)
50
Coronary heart disease(incidence and mortality), all ages
Vinneau et al. (2013) Global Health Estimates 2015 (WHO, 2016a) ,
European Cardiovascular Disease Statistics 2017 (Wilkens et al., 2017)
50
Cerebrovascular disease (incidence and mortality), all ages
Houthuijs et al., 2014 Global Health Estimates 2015 (WHO, 2016c) ,
European Cardiovascular Disease Statistics 2017 (Wilkens et al., 2017)
50
(a) The baseline rate refers to the prevalence of a health status or the incidence of a disease in the population
In the absence of noise, there is a baseline prevalence of hypertension and/or incidence of the cardiovascular endpoints present in the population. The contribution of the noise exposure to the prevalence of incidence depends on the exposure level as well as the baseline rate. For hypertension new (baseline) data on the prevalence of raised blood pressure had become available. We used country specific data on the crude prevalence of raised blood pressure among males and females in 2015 in the population 18 years and older (WHO Global Health Observatory, WHO, 2017a). For the cardiovascular endpoints coronary heart disease and stroke, the data on baseline mortality was updated to country-specific data using more recent data (Global Health Estimates 2015, WHO 2016d, 2016e). In the Noise in Europe 2014 report (EEA, 2014) hospital discharge data was used as indicator for the incidence of coronary heart disease and stroke. European wide incidence data has become recently available in the 2017 European Cardiovascular Disease Statistics (Wilkens et al., 2017) and is preferred above the hospital discharge data. The calculation of the population attributable fraction (PAF) for cardiovascular endpoints was brought in line with the calculation for the air pollution endpoints (see also Annex 1). The PAF fraction is the relative reduction in cardiovascular disease or mortality in a population that would occur if the exposures to road traffic were reduced to an alternative exposure distribution (in this report to levels without an additional health risk).

Integrated health impact assessment of noise and air quality in urban agglomerations. An explorative study. 9
Assuming a log-linear relationship between the noise exposure level (L) and relative risk (RR), the relative risk is given by: 𝑅𝑅𝑅𝑅 = 𝑒𝑒−𝛽𝛽 ∆𝐿𝐿 [1] where β is the exposure-response factor and ΔL= (L – L0) is the difference between the actual noise exposure level L and a threshold level L0 below which no additional health risk is expected. Once the relative risks have been estimated, the fraction of the baseline incidence attributable to the given exposure difference (PAF) is:
PAF = ∑ (fi ∙ RRi )−1 i∑ (fi ∙ RRi ) i
[2]
where the summation is over all the 1 dB noise exposure classes in an agglomeration, fi is the fraction of the population in the exposure class. For each agglomeration the expected burden of disease attributable to road traffic noise is given by:
aa PopMRPAFE ⋅⋅= [3] where E is the expected burden of disease (e.g. number of new cases with coronary heart disease per year); MRa is the baseline incidence of the given health effect (e.g. the total number of new cases of coronary heart disease per 100,000 people per year); Popa is the size of population in each agglomeration. The health impact assessment for road traffic noise in this report is based on the combination of reported data, ‘gap filled’ data and the extrapolation to lower noise levels. 2.3 Air quality
2.3.1 Exposure
Air quality concentration maps (annual mean concentration for PM2.5, PM10 and NO2; SOMO35 for ozone) prepared by the European Topic Centre on Air and Climate Change (ETC/ACM, Horálek et al. (2016, 2017).) have been used as input to the health impact assessment. The maps are based on the interpolation of annual statistics of monitoring data from 2014, reported by EEA member and cooperating countries. The mapping method is based primarily on air quality measurements. It combines concentrations observed at background stations with additional spatial information (such as the results from chemical transport models, meteorological data, altitude, population density map). The method is a linear regression model followed by kriging of the residuals produced from that model (residual kriging). A computational spatial resolution of 1*1 km is used; this fine resolution enables to account for the smaller urbanisations.

10 ETC/ACM Technical Paper 2017/12
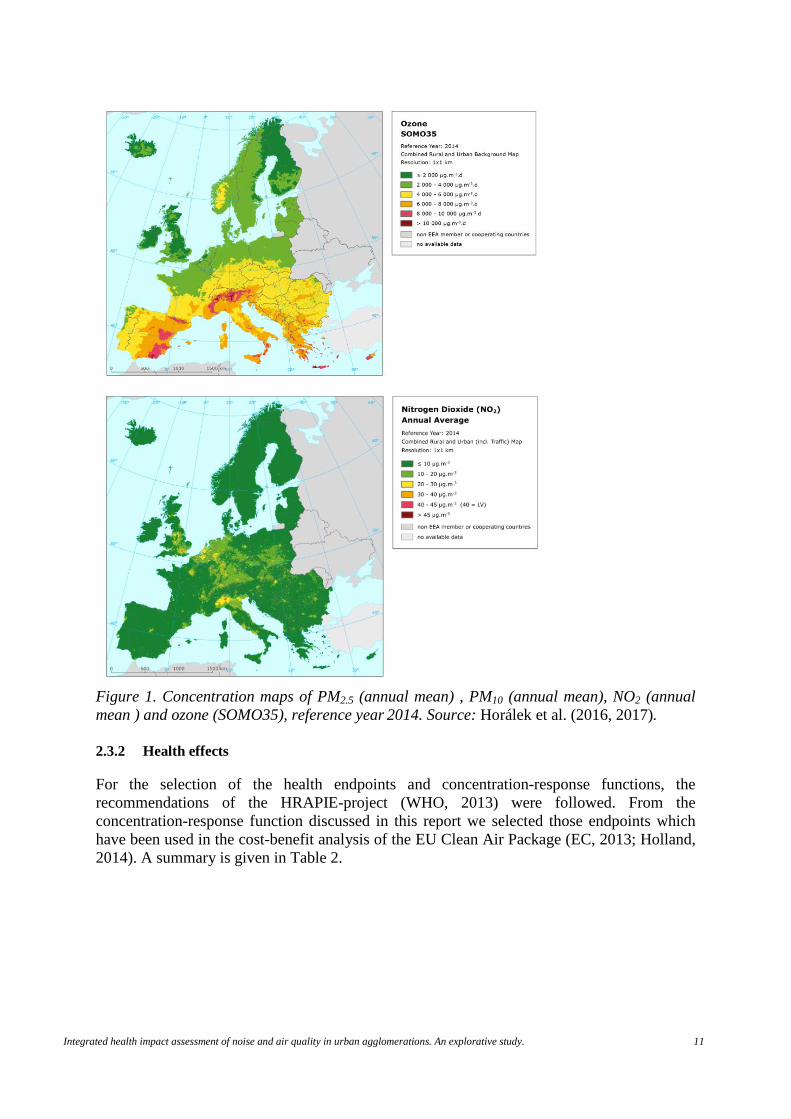
To increase the spatial coverage of the PM2.5 measurements, so-called pseudo PM2.5 stations data were used in addition to measured PM2.5 data. Pseudo PM2.5 stations data are estimated using PM10 measured data, surface solar radiation, latitude and longitude. The mapping of NO2 concentrations includes measurement data from traffic stations in combination with land cover data and road data. Details of the mapping procedures and the data used are described by Horálek et al. (2016, 2017). Annual concentrations (Figure 1) are used for PM2.5, PM10 and NO2; for ozone the SOMO35, that is, the sum of maximum daily 8-hour means over 35 ppb (70 µg/m3) is used.
Integrated health impact assessment of noise and air quality in urban agglomerations. An explorative study. 11
Figure 1. Concentration maps of PM2.5 (annual mean) , PM10 (annual mean), NO2 (annual mean ) and ozone (SOMO35), reference year 2014. Source: Horálek et al. (2016, 2017). 2.3.2 Health effects
For the selection of the health endpoints and concentration-response functions, the recommendations of the HRAPIE-project (WHO, 2013) were followed. From the concentration-response function discussed in this report we selected those endpoints which have been used in the cost-benefit analysis of the EU Clean Air Package (EC, 2013; Holland, 2014). A summary is given in Table 2.

12 ETC/ACM Technical Paper 2017/12
Table 2. Summary of health outcome, concentration-response relation for air pollution. Pollutant Health outcome RR (95% CI)
per 10 µg/m3 Baseline (a) C0
(µg/m3)
PM2.5 Mortality, all cause (natural); age 30+
1.062 (1.040- 1.083)
European mortality database
(WHO,2016b)
2.5
PM10 Postneonatal infant mortality, all causes age
1-12 months
1.04 (1.02 – 1.07)
European Health for all database (WHO,
2016c)
3.8
O3 Mortality, all cause (natural) all ages
1.0029 (1.0014 – 1.0043)
European mortality database
(WHO,2016b)
70
NO2 Mortality, all cause (natural); age 30+
1.039 (1.022-1.056)
European mortality database
(WHO,2016b)
10
PM2.5 cardiovascular hospital admissions, all ages
1.0091 (1.0017-1.-166
Eurostat (2017a,b) 2.5
PM2.5 Respiratory hospital admissions, all ages
1.019 (0.9982 -1.0402)
Eurostat (2017a,b) 2.5
PM2.5 Restricted activity days (RAD) all ages
1.047 (1.042-1.053)
HRAPIE project(WHO,2013)
2.5
PM2.5 Work days lost; age 20-64 1.046 (1.039 – 1.053)
European Health for all database (WHO,
2016c). Eurostat(2017c)
2.5
PM10 Prevalence of bronchitis in children (age 6-12)
1.08 ( 0.98 – 1.19)
HRAPIE project(WHO,2013)
3.8
PM10 Incidence of chronic bronchitis in adults (age
18+)
1.117 ( 1.040 – 1.189)
HRAPIE project(WHO,2013)
3.8
PM10 Incidence of asthma symptoms in asthmatic
children, aged 5-19
1.04 (1.02-1.07)
European Health for all database (WHO,
2016c).
3.8
O3 Respiratory hospital admissions, age 65+
1.0044 (1.0007- 1.0083)
Eurostat (2017a,b) 70
O3 cardiovascular hospital admissions (excluding
stroke), age 65+,
1.0089 (1.005 – 1.0127)
Eurostat (2017a,b) 70
O3 Minor restricted activity days (MRAD)
1.0154 (1.006 – 1.0249)
HRAPIE project(WHO,2013)
70
(a) see main text and de Leeuw and Horálek (2017) for further details. The estimated health impact is sensitive for the assumption of the counterfactual concentration (C0 in Table 2). For PM2.5 we have adopted a value of 2.5 µg/m3. In the health impact assessments made for the Clean Air Package (EC, 2013), impacts are estimated for the (modelled) anthropogenic contribution to PM2.5 which implies that a (natural) background contribution is not considered. In the Global Burden of Disease 2013-study (Burnett et al., 2014), impacts are estimated only above a counterfactual concentration of 5.8 to 8.8 µg/m3. In the GBD-2015 study (GBD 2015 risk factor collaborators, 2016) the range was lowered to 2.4 – 5.9 µg/m3. A C0- value of 2.5 µg/m3 corresponds to the lower boundaries of the updated GBD range. This level of 2.5 µg/m3 also corresponds to the lowest value found in populated

Integrated health impact assessment of noise and air quality in urban agglomerations. An explorative study. 13
areas in the interpolated concentration map and is therefore seen as a realistic estimate of the European background concentration. Given a European averaged PM2.5/PM10 ratio of 0.65 (de Leeuw and Horálek, 2009), the PM10 counterfactual concentrations was set to 3.8 µg/m3. Restricted activity days (RAD) includes days when people reduce their normal activities, including absenteeism from work or school. The effects of PM on work days lost, hospitalization, asthmatic symptoms and the prevalence of bronchitis in children are estimated according to specific concentration-response function (Table 2). To avoid double counting the total number of RAD has been corrected for these more specific outcomes. The ozone exposure estimates are based on SOMO35 levels. SOMO35 is defined as the yearly sum of excess of daily maximum 8-h running average over a cut-off of 70 µg/m3 (35 ppb). To estimate the effects of long-term NO2 exposure on all-cause mortality, a relative risk of 1.055 (95% CI 1.031 to 1.08) has been recommended (WHO, 2013); the NO2 impact has to be calculated for levels above 20 µg/m3. The material as available in the HRAPIE review did not suggest that there is no effect below 20 µg/m3; the studies rather showed that the size of the effect is less certain below 20 µg/m3. However, this recommendation might be too conservative, as indicated by Héroux et al. (2015). A Danish study (Raaschou-Nielsen et al., 2012) showed a significant correlation between NO2 concentrations and health outcomes throughout the full range of observed concentrations (10.5 to 59.6 µg/m3 with a median of 15.1 µg/m3). Also in a large Dutch cohort study a linear relation between NO2 and mortality risk was seen for concentrations between 10 and 20 µg/m3
(Fischer et al., 2015). It should be noted that, as concentrations are (sometimes strongly) correlated, the impacts estimated for PM2.5 and NO2 may not be added to determine the total impact attributable to exposure to air pollution. This may lead to a double counting of up to 30 % of the effects of PM2.5 and NO2 (WHO, 2013). To account for this overlap, in this paper a relative risk downward adjusted by 30% (1.039 (95% CI 1.022- 1.056) is used in combination with a counterfactual concentration of 10 µg/m3. Assuming a log-linear relationship between air pollutant concentration (C) and relative risk (RR), the relative risk is given by: RR = e−β ∆C [4] where β is the concentration-response factor and ΔC= (C – C0) is the difference between the actual concentration and the above described the counterfactual concentration. Once the relative risks have been estimated, the fraction of the baseline incidence attributable to the given concentration difference (population attributable factor, PAF) is:
PAF = ∑ (fi ∙ RRi )−1 i∑ (fi ∙ RRi ) i
[5]
where the summation is over all the 1x1 km grid cells in an agglomeration, fi is the fraction of the population in the grid cell.

14 ETC/ACM Technical Paper 2017/12
For each agglomeration the expected burden of disease attributable to air pollution is given by:
aa PopMRPAFE ⋅⋅= [6] where E is the expected burden of disease (e.g. number of premature deaths or number of hospital admissions due to outdoor air pollution); MRa is the baseline incidence of the given health effect (e.g. the total or cause specific number of deaths per 100,000 people per year); Popa is the size of population in each agglomeration. The number of years of life lost due to premature mortality is calculated according to: YLL = ∑(Ei ∙ Li) [7] where Ei is the number of deaths in age class i attributable to air pollution and Li is the life expectancy at age of death (in years). The summation is done for each 5-year age class 2.4 Disability-adjusted life years
2.4.1 Introduction
The disability-adjusted life year (DALY) is a measure of overall disease burden, expressed as the number of years lost due to ill-health, disability or early death. The DALY was developed by the World Bank as a way of comparing the overall health and life expectancy of different countries. DALYs for a disease or health outcome are calculated as the sum of the years of life lost due to premature mortality (YLL) and the years lost due to disability (YLD) for morbidity outcome: DALY = YLL + YLD [8] To estimate YLD for a particular health outcome the number of attributable cases is multiplied by the average duration of the disease and a weight factor that reflects the severity of the disease on a scale from 0 (perfect health) to 1 (death) ((WHO, 2017b): YLD = E ∙ DW ∙ L [9] Where E is the number of attributable cases, DW is a disability weight and L is the average duration. An alternative for the calculation is to multiple the population attributable fraction of a risk factor with the estimated total YLLs and YLDs for the specific disease. 2.4.2 Road traffic noise
Highly sleep disturbed and cardiovascular morbidity and mortality were taken into account as health endpoints related to road traffic noise in the calculation of DALYs. Annoyance is a clear effect of noise, but was not recommended by a working group of WHO (2012) as an endpoint to be quantify in burden of disease calculations for environmental noise. We did not quantify the impact of raised blood pressure. We consider raised blood pressure as an

Integrated health impact assessment of noise and air quality in urban agglomerations. An explorative study. 15
important risk factor for cardiovascular disease and mortality. There is a large probability of overlap in road traffic noise attributable burden of disease when DALYs for raised blood pressure as well as cardiovascular endpoints are calculated separately: adding them together will lead to an overestimation. The cases of highly sleep disturbed among adults (duration one year) were multiplied with a disability weight of 0.06 to obtain the YLD. WHO (2011) derived a mean weight of 0.07 from 4 studies. We looked again into the original studies, since the distribution of the DWs is rather skewed. Van Kempen (1998) reported a mean disability weight of 0.10 for severe sleep disturbance due to noise, based on a pilot study in the Netherlands among 13 medical experts. De Hollander (2004) expanded Van Kempen’s study to 35 public health professionals and assessed a median disability weight of 0.08 (mean: 0.10; range 0-0.45). Müller-Wenk (2002) assessed a median disability of 0.04 (mean: 0.055; range: 0.02-0.31) for those highly sleep-disturbed by night-time road noise, in on a survey of 42 Swiss physicians. In a later study of Knoblauch and Müller-Wenk (2005) the mean judgement of 14 general practitioners was that noise-related sleep disturbance has a mean severity of 0.9 times the severity of primary insomnia (range: 0-2.1), which resulted in a disability weight of 0.09. Like in the other studies, the distribution was rather skewed; the median severity ratio was 0.63 which corresponds with to a median DW of 0.06. Given the rather skewed distributions of the reported disability weights, we used the median (0.06) of the medians of De Hollander (0.08), Müller-Wenk (0.04) and Knoblauch & Müller-Wenk (0.06). Previous used (Houthuijs et al., 2014) information on YLLs and YLDs for coronary heart disease and stroke for the Worldbank/WHO regions “high-income countries” and “European Region (low- and middle-income countries)” were updated to estimates of the burden of disease by cause per WHO member state for 2015 using WHO Global Health Estimates (WHO, 2016d, 2016e). We extracted DALYs for all causes and YLLs and YLDs for ischaemic heart disease (similar to coronary heart disease) and stroke (similar to cerebrovascular disease). The population attributable fraction related to the noise exposure (Eq [2]) was used to calculate the health impact for coronary heart and cerebrovascular disease in YLLs and YLDs per agglomeration. The DALY for all causes was used to express the road traffic noise (and air quality) impact as percentage of the total burden of disease. 2.4.3 Air quality
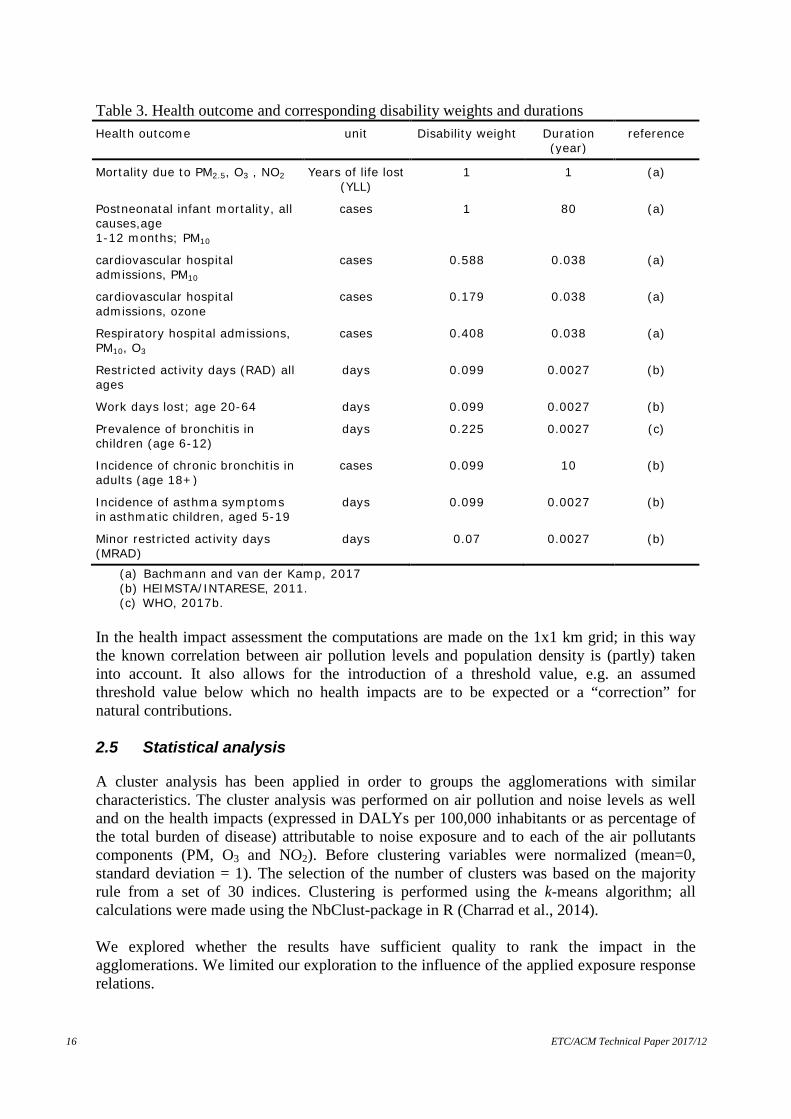
Table 3 summarises the disability weights and durations of the selected health outcomes that were used for the calculation of the DALYs related to air quality. The disability weight and duration for the calculation of YLD according to Eq[9] are based on the results reported by Bachmann and van der Kamp (2017), HEIMSTA/INTARESE (2011) and WHO (2017b). The YLL due to PM2.5, O3 and NO2 corresponds to the number of deaths multiplied by the life expectancy at the age of death (Eq [7]).
16 ETC/ACM Technical Paper 2017/12
Table 3. Health outcome and corresponding disability weights and durations Health outcome unit Disability weight Duration
(year) reference
Mortality due to PM2.5, O3 , NO2 Years of life lost (YLL)
1 1 (a)
Postneonatal infant mortality, all causes,age 1-12 months; PM10
cases 1 80 (a)
cardiovascular hospital admissions, PM10
cases 0.588 0.038 (a)
cardiovascular hospital admissions, ozone
cases 0.179 0.038 (a)
Respiratory hospital admissions, PM10, O3
cases 0.408 0.038 (a)
Restricted activity days (RAD) all ages
days 0.099 0.0027 (b)
Work days lost; age 20-64 days 0.099 0.0027 (b)
Prevalence of bronchitis in children (age 6-12)
days 0.225 0.0027 (c)
Incidence of chronic bronchitis in adults (age 18+)
cases 0.099 10 (b)
Incidence of asthma symptoms in asthmatic children, aged 5-19
days 0.099
0.0027 (b)
Minor restricted activity days (MRAD)
days 0.07 0.0027 (b)
(a) Bachmann and van der Kamp, 2017 (b) HEIMSTA/INTARESE, 2011. (c) WHO, 2017b.
In the health impact assessment the computations are made on the 1x1 km grid; in this way the known correlation between air pollution levels and population density is (partly) taken into account. It also allows for the introduction of a threshold value, e.g. an assumed threshold value below which no health impacts are to be expected or a “correction” for natural contributions. 2.5 Statistical analysis
A cluster analysis has been applied in order to groups the agglomerations with similar characteristics. The cluster analysis was performed on air pollution and noise levels as well and on the health impacts (expressed in DALYs per 100,000 inhabitants or as percentage of the total burden of disease) attributable to noise exposure and to each of the air pollutants components (PM, O3 and NO2). Before clustering variables were normalized (mean=0, standard deviation = 1). The selection of the number of clusters was based on the majority rule from a set of 30 indices. Clustering is performed using the k-means algorithm; all calculations were made using the NbClust-package in R (Charrad et al., 2014). We explored whether the results have sufficient quality to rank the impact in the agglomerations. We limited our exploration to the influence of the applied exposure response relations.

Integrated health impact assessment of noise and air quality in urban agglomerations. An explorative study. 17
These relations have statistical uncertainty, expressed in the 95% confidence intervals of the relations. If we ignore this statistical uncertainty, the total impact has no uncertainty and the ranking of agglomerations is unquestionable. If we include uncertainty in the calculations, the ranking may change, depending on the contribution of the various health endpoints and the uncertainty of the exposure response relations. A health endpoint with a large uncertain exposure response relation might hardly affect the ranking if the average contribution to the total burden is very low. Vice versa, an endpoint with a relative small uncertainty could influence the rank substantially if the contribution of this endpoint to the overall impact is large. We calculated the standard deviation of the impact of each of the separate health endpoints per agglomeration (expressed in DALYs per 100.000 inhabitants). Subsequently, we simulated 100 times the uncertainty in the calculation of the total impact per agglomeration. Per simulation, we took a different set of random values from the normal probability distribution for the various health endpoints and calculated in combination with their standard deviation a combined impact per agglomeration. Subsequently, we calculated the reliability of the ranking (rankability) over the 100 simulated datasets by relating heterogeneity to uncertainty within (σ2) and between agglomerations (τ2) (Van Dishoek et al., 2011). Rankability = τ2/(τ2 +median(σ2)) [10] Lingsma et al. (2010) suggested that any ranking is meaningless when rankability is low (<0.50). Simple integer ranks are appropriate when the rankabilty is high (>0.75).
18 ETC/ACM Technical Paper 2017/12
3 Results 3.1 Assessment in 479 agglomerations
The total END-dataset contains 482 agglomerations. Three agglomerations, all located on the Canarias, could not be included due to missing air pollution data, so the assessment was carried out for 479 agglomerations. The total number of inhabitants is 177.6 million. 3.2 Exposure to road traffic noise and air quality
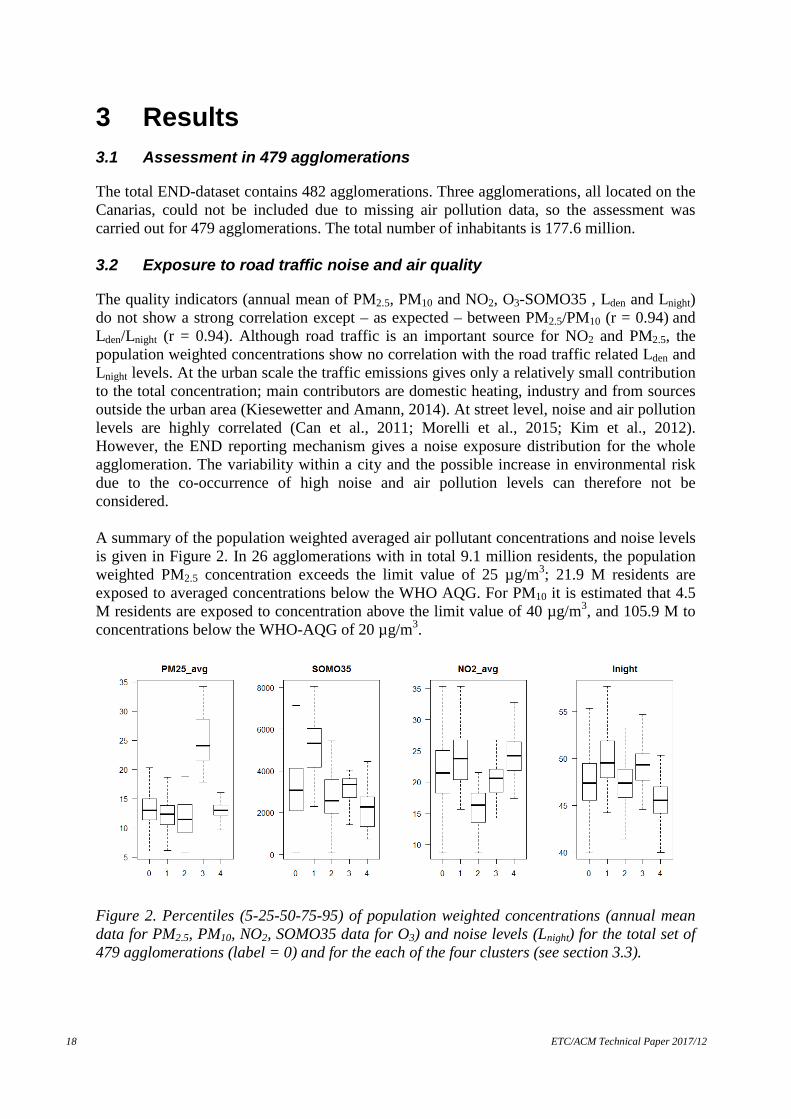
The quality indicators (annual mean of PM2.5, PM10 and NO2, O3-SOMO35 , Lden and Lnight) do not show a strong correlation except – as expected – between PM2.5/PM10 (r = 0.94) and Lden/Lnight (r = 0.94). Although road traffic is an important source for NO2 and PM2.5, the population weighted concentrations show no correlation with the road traffic related Lden and Lnight levels. At the urban scale the traffic emissions gives only a relatively small contribution to the total concentration; main contributors are domestic heating, industry and from sources outside the urban area (Kiesewetter and Amann, 2014). At street level, noise and air pollution levels are highly correlated (Can et al., 2011; Morelli et al., 2015; Kim et al., 2012). However, the END reporting mechanism gives a noise exposure distribution for the whole agglomeration. The variability within a city and the possible increase in environmental risk due to the co-occurrence of high noise and air pollution levels can therefore not be considered. A summary of the population weighted averaged air pollutant concentrations and noise levels is given in Figure 2. In 26 agglomerations with in total 9.1 million residents, the population weighted PM2.5 concentration exceeds the limit value of 25 µg/m3; 21.9 M residents are exposed to averaged concentrations below the WHO AQG. For PM10 it is estimated that 4.5 M residents are exposed to concentration above the limit value of 40 µg/m3, and 105.9 M to concentrations below the WHO-AQG of 20 µg/m3.
Figure 2. Percentiles (5-25-50-75-95) of population weighted concentrations (annual mean data for PM2.5, PM10, NO2, SOMO35 data for O3) and noise levels (Lnight) for the total set of 479 agglomerations (label = 0) and for the each of the four clusters (see section 3.3).

Integrated health impact assessment of noise and air quality in urban agglomerations. An explorative study. 19
3.3 Clusters of agglomerations based on environmental quality
A cluster analysis was performed on the levels of PM2.5, NO2, O3 and Lnight. PM10 and Lden were not included as they are highly correlated with PM2.5 and Lnight, respectively. The dataset was separated into four clusters (Figure 3).
Figure 3. Map of agglomerations clustered in four group, based on environmental quality (cluster codes 1 to 4: red, blue, green, black) The first cluster (the red dots in Figure 3) is characterized by high ozone, NO2 and noise levels (see Figure 2 in section 3.2), the agglomerations are mainly located in Spain, Italy and the eastern and south-eastern part of France (Figure 3). Cluster 2 (blue dots) is mainly located in west and northwest Europe along the coasts of the Atlantic Ocean, North Sea and Baltic Sea. Cluster 2 has the best air quality, in particular low NO2 concentrations and moderated noise levels. The averaged population density for cluster 2 is the lowest among the four clusters. Cluster 3 (green dots), mainly located in the eastern Member States, has by far the highest PM2.5 concentrations together with high noise levels. Cluster 4 (black dots) is mainly located in Germany, Benelux-area and England; NO2 concentrations are relatively high; the levels of the other air quality and noise indicators are moderate to low. 3.4 Burden of disease due to road traffic noise and air quality
For all 497 agglomerations, the combined burden of disease due to air quality and road traffic noise is 3.10 million DALYs per year which corresponds with 1,745 DALYs per year per 100,000 inhabitants and to 6.2% of the total burden of disease (total number of DALYs per year per 100.000 inhabitants due to all causes). In Figure 4, the contribution of the air quality components and road traffic noise to the combined burden of disease given (left hand pie of Figure 4); the contribution is also split

20 ETC/ACM Technical Paper 2017/12
into YLL and YLD for road traffic noise and the combined air quality components (right hand pie). Road traffic noise exposure contributes 21% to this combined burden of disease; exposure to particulate matter accounts for 45% (left hand pie in Figure 4). From the right hand pie of Figure 4 it appears that for the combined air pollution components the effects on mortality (YLL) are most important whereas road traffic noise exposure contributes for the most part to the years lost due to disability (YLD). The population that is highly sleep disturbed due to road traffic noise is responsible for the large contribution to YLD; exposure to levels below 50 dB Lnight give a substantial contribution (32%) to the total burden of disease due to road traffic noise (see Figure 5).
Figure 4. Fractions of burden of disease related to air quality components and road traffic noise (left) and to years of life lost (YLL) and years lost due to disability (YLD) for road traffic noise and the combined air pollution components; totals for 479 agglomerations.
Figure 5. Burden of disease related to 24 hour (Lden left) and night time (Lnight right) road traffic noise levels per 5 dB exposure class.
noise_YLD
noise_YLL
AP_YLD
AP_YLL
road traffic
PM
O3
NO2

Integrated health impact assessment of noise and air quality in urban agglomerations. An explorative study. 21
3.5 Clusters of agglomerations based on burden of disease per 100,000 inhabitants
A cluster analysis performed on the DALYs (expressed per 100,000 inhabitants) attributable to PM, O3, NO2, and road traffic noise, resulted in three distinctive clusters (Figure 6).
Figure 6. Map of agglomerations clustered in three groups, based on combined burden of disease per 100,000 inhabitants from road traffic noise and air quality (cluster codes 1 to 3: red, blue, green) The distribution of the contribution of PM, O3, NO2, and road traffic noise of these three clusters to the burden of disease expressed as DALYs per 100,000 inhabitants is shown in Figure 7.
Figure 7. Percentiles (5-25-50-75-95) of DALYs per 100,000 inhabitants for PM, O3, NO2 and road traffic noise for the total set of 479 agglomerations (label = 0) and for the each of the three clusters.

22 ETC/ACM Technical Paper 2017/12
Relative low contributions for all four environmental exposures are found in the (extended) coastal regions of Atlantic and North Sea and in the Baltic countries (cluster 2, blue dots in Figure 5). The largest contributions from road traffic noise and PM are observed in the eastern part of Europe (cluster 3, green dots in Figure 6). In the central and southern part of Europe a larger contribution from O3 and NO2 is seen (cluster 1, red dots in Figure 6) The health impact of air quality and road traffic noise is unequally distributed in Europe (see Table 4). In cluster 2, the average environmental burden is almost1,300 DALYs per 100,000 inhabitants. 38% of the total population in the 479 agglomerations lives in cities of cluster 2 where 28% of the attributable burden of disease can be found. In cluster 3, the health impact of air quality and road traffic noise per capita is twice as high: on average, 2,650 DALYs per 100,000 inhabitants. 21% of the combined burden of disease precipitates among 14% of the population. Table 4. Burden of disease for PM, O3, NO2, road traffic noise and combined expressed as DALYs per 100,000 inhabitants for three clusters cluster Burden of disease expressed as DALYs per 100,000 inhabitants Population
(*1,000) PM O3 NO2 Road traffic noise
Total
1 753 36 723 344 1,8567 84,945
2 565 18 410 280 1,273 67,784
3 1,490 29 503 626 2,649 24,910
Total 785 28 573 359 1,745 177,640
3.6 Clusters of agglomerations based on burden of disease as percentage
of total burden of disease
We also expressed the attributable burden of disease PM, O3, NO2, and road traffic noise as percentage of the total burden of disease, since there is a large variation in total disease within Europe. Again a cluster analysis was carried out; this led to four distinctive clusters (Figure 8).

Integrated health impact assessment of noise and air quality in urban agglomerations. An explorative study. 23
Figure 8. Map of agglomerations clustered in four group, based on combined burden of disease from road traffic noise and air quality expressed as percentage of the total burden of disease (cluster codes 1 to 4: red, blue, green, black) The first cluster (the red dots in Figure 8) is characterized by a high contribution of PM to the total burden of disease (see Figure 9). Also road traffic noise adds to the burden of disease. The agglomerations are mainly located in the eastern Member States. The cluster corresponds with cluster 4 in Figure 3 based on environmental quality. The average contribution of the combined exposure to the total burden of disease is 8.3%: three quarter of the burden is due to air pollution (see Table 5). Cluster 2 (blue dots) corresponds with cluster 2 in Figure 3 and has the best air quality, in particular low NO2 concentrations and moderated noise levels. It is mainly located in west and northwest Europe along the coasts of the Atlantic Ocean, North Sea and Baltic Sea. The environmental burden of disease in cluster 2 (4.4%) is almost half of cluster 1. Road traffic noise is responsible for about 30% of the burden in cluster 2 (see Table 5). Cluster 3 (green dots) is characterized by a relative large contribution of NO2 and road traffic noise to the total burden of disease. The cluster corresponds with cluster 1 in Figure 3. The agglomerations are mainly located in Spain, Italy and the eastern and south-eastern part of France (Figure 8). Although high ozone concentrations are a common characteristic in this cluster, the contribution of ozone to the combined burden of 7.1% is limited (<3%).
24 ETC/ACM Technical Paper 2017/12
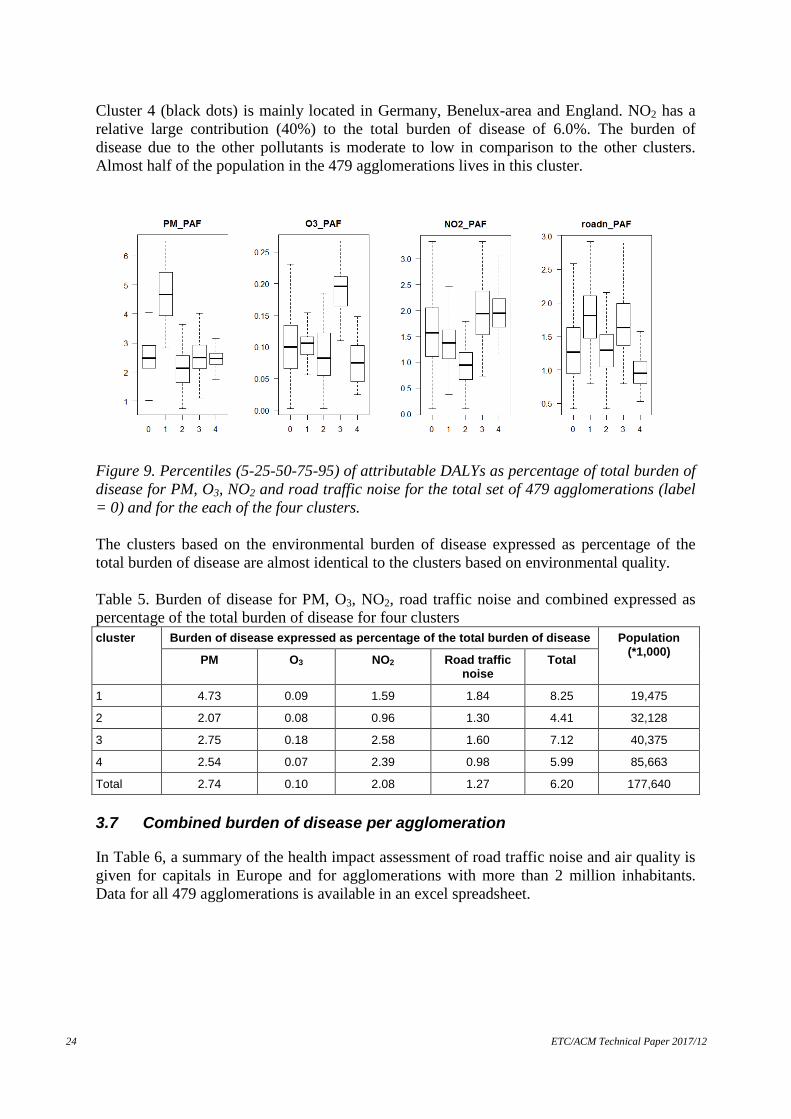
Cluster 4 (black dots) is mainly located in Germany, Benelux-area and England. NO2 has a relative large contribution (40%) to the total burden of disease of 6.0%. The burden of disease due to the other pollutants is moderate to low in comparison to the other clusters. Almost half of the population in the 479 agglomerations lives in this cluster.
Figure 9. Percentiles (5-25-50-75-95) of attributable DALYs as percentage of total burden of disease for PM, O3, NO2 and road traffic noise for the total set of 479 agglomerations (label = 0) and for the each of the four clusters. The clusters based on the environmental burden of disease expressed as percentage of the total burden of disease are almost identical to the clusters based on environmental quality. Table 5. Burden of disease for PM, O3, NO2, road traffic noise and combined expressed as percentage of the total burden of disease for four clusters cluster Burden of disease expressed as percentage of the total burden of disease Population
(*1,000) PM O3 NO2 Road traffic noise
Total
1 4.73 0.09 1.59 1.84 8.25 19,475
2 2.07 0.08 0.96 1.30 4.41 32,128
3 2.75 0.18 2.58 1.60 7.12 40,375
4 2.54 0.07 2.39 0.98 5.99 85,663
Total 2.74 0.10 2.08 1.27 6.20 177,640
3.7 Combined burden of disease per agglomeration
In Table 6, a summary of the health impact assessment of road traffic noise and air quality is given for capitals in Europe and for agglomerations with more than 2 million inhabitants. Data for all 479 agglomerations is available in an excel spreadsheet.

Integrated health impact assessment of noise and air quality in urban agglomerations. An explorative study. 25
Table 6. Summary of health impact assessment for road traffic noise and air quality in captials in Europe and agglomerations with more than 2 million inhabitants (sorted by country). Agglomeration Country Population
Size Road traffic noise Air quality Combined road traffic noise and air quality
YLL/yr YLD/yr YLL/yr YLD/yr Total DALY/yr DALY/yr per 100,000
inhabitants
% of total disease burden
All 479 agglomerations - 177,640,000 442,101 196,044 138,275 2,323,709 3,100,130 1,745 6,2
Wien AT 1,741,330 1,915 4,476 23,389 1,419 31,199 1,792 6.7
Brussels BE 999,896 752 2,386 14,973 784 18,894 1,890 6.9
Sofia BG 1,377,532 8,557 5,367 40,576 2,231 56,732 4,118 10
Bern CH 350,791 290 915 3,145 226 4,576 1,305 5.6
Nicosia CY 204,029 201 527 1,296 216 2,239 1,097 5.4
Praha agglomeration CZ 1,234,005 3,506 3,917 18,427 1,228 27,078 2,194 7.1
Berlin DE 3,331,248 1,850 6,739 54,160 3,193 65,941 1,979 6.6
Copenhagen DK 1,163,001 921 3,197 10,872 745 15,734 1,353 5.1
Tallinn EE 401,142 1,328 1,287 2,556 194 5,365 1,337 3.9
Madrid ES 3,269,860 2,184 8,561 39,870 2,148 52,764 1,614 6.6
Helsinki FI 570,577 711 1,469 3,470 261 5,911 1,036 3.7
Paris FR 9,665,898 3,193 19,133 140,868 6,677 169,870 1,757 6.9
Athens GR 745,517 1,187 1,813 14,019 761 17,780 2,385 8.3
Zagreb HR 790,015 1,570 1,942 13,866 755 18,133 2,295 6.6
Budapest agglomeration HU 2,158,869 4,146 5,174 46,142 2,261 57,723 2,674 7.2
Dublin IE 1,273,101 1,068 3,378 4,927 585 9,957 782 3.6
The Great Reykjavik Area IS 191,999 80 388 526 67 1,061 552 2.8
Roma IT 2,546,802 1,161 5,831 50,130 2,542 59,664 2,343 8.6
Vilnius LT 554,097 2,066 1,427 8,018 488 11,999 2,165 5.2
Luxembourg LU 133,962 132 390 1,068 86 1,676 1,251 5.7
Riga agglomeration LV 659,416 1,868 1,664 10,235 575 14,343 2,175 5.1

26 ETC/ACM Technical Paper 2017/12
Table 6 (Continued). Summary of health impact assessment for road traffic noise and air quality in captials in Europe and agglomerations with more than 2 million inhabitants. Agglomeration Country Population
Size Road traffic noise Air quality Combined road traffic noise and air quality
YLL/yr YLD/yr YLL/yr YLD/yr Total DALY/yr DALY/yr per 100,000
inhabitants
% of total disease burden
Greater Valletta (Zabbar to Naxxar) MT 270,004 191 556 1,947 254 2,949 1,092 4.4
Amsterdam / Haarlem NL 1,615,332 995 3,673 19,282 1,230 25,180 1,559 6.1
Oslo NO 906,319 730 2,549 5,938 461 9,678 1,068 4.6
Warszawa PL 1,714,447 3,266 4,762 35,633 2,317 45,978 2,682 8.4
Lisboa PT 547,737 409 1,324 6,038 361 8,132 1,485 5.2
Bucharest RO 1,677,987 6,856 5,390 39,612 2,038 53,897 3,212 8.4
Stockholm SE 795,164 480 1,601 3,707 323 6,110 768 3.0
Ljubljana SI 274,464 372 738 3,792 240 5,141 1,873 6.7
Bratislava, agglomeration SK 528,124 1,042 1,461 6,153 468 9,123 1,727 5.6
Greater London Urban Area UK 9,302,002 4,772 19,967 137,802 5,869 168,410 1,810 7.0
West Midlands Urban Area UK 2,431,998 1,256 5,282 30,377 1,518 38,434 1,580 6.1
Greater Manchester Urban Area UK 2,403,000 1,488 5,511 29,390 1,474 37,862 1,576 6.1

Integrated health impact assessment of noise and air quality in urban agglomerations. An explorative study. 27
In Figure 10, the impact based on the exposure to road traffic noise and to air pollutants in the capitals of the EU-28 is compared with the perceived quality of the noise levels and the air pollution using data from the survey on Quality of Life in European Cities 2015.
Figure 10. Perceived quality of the noise level (left hand side) and of the air pollution (right hand side) in European capitals Percentiles related to the impact of road traffic noise and air pollution expressed in DALYs/year per 100,000 inhabitants. The capitals are label with the ISO code for country. The perceived quality of the air in European capitals seems more closely related to the health impact of air pollution than is the case for noise. This could be explained by that only road traffic noise was included in the health impact assessment for noise and that the perceived noise level may also include noise from other transport sources, shops and neighbours. 3.8 Ranking agglomerations on the combined burden of disease
The reliability of the ranking of the agglomerations on the combined burden of disease of road traffic noise and air pollution expressed as DALYs per 100.000 inhabitants was 0.92. The standard deviation was, on average, 10% of the mean of the combined burden of disease (standard deviation is 177 with an average of 1,745 DALYS per 100.000 inhabitants). The rankability based on the impact of road traffic noise and air pollution expressed as percentage of the total burden of disease was 0.87. Given the high rankability of these two indicators (>0.75), ranking of the agglomerations is possible. In Table 7, the 15 agglomeration with the lowest burden of disease due to combined exposure to road traffic noise and air quality are ranked according to DALYs/year per 100.000 inhabitants. In Table 8, the 15 agglomerations with the highest burden of disease are found. We choose to show the top 15, since the information of 15 agglomerations fits nicely on a page. In the Table 9 and 10 the top 15 agglomerations with the lowest and highest burden of disease are shown when the ranking is based on impact of road traffic noise and air pollution as percentage of total burden of disease The top 15’s of agglomerations with the lowest combined burden are dominated by agglomerations from Finland, Iceland, Norway and Sweden. The top 15’s of agglomerations with the highest combined burden consist of agglomerations from Bulgaria, Italy, Poland and Romania.

28 ETC/ACM Technical Paper 2017/12
There is more than a 9 fold difference in combined impact of road traffic noise and air quality between the agglomeration with the highest burden of disease (4,540 DALY/year per 100,000 inhabitants) and the lowest burden of disease (481 DALY/year per 100,000 inhabitants). For the impact expressed in percentage of the total burden of disease, the difference between the highest and the lowest is slightly smaller (7 fold difference).
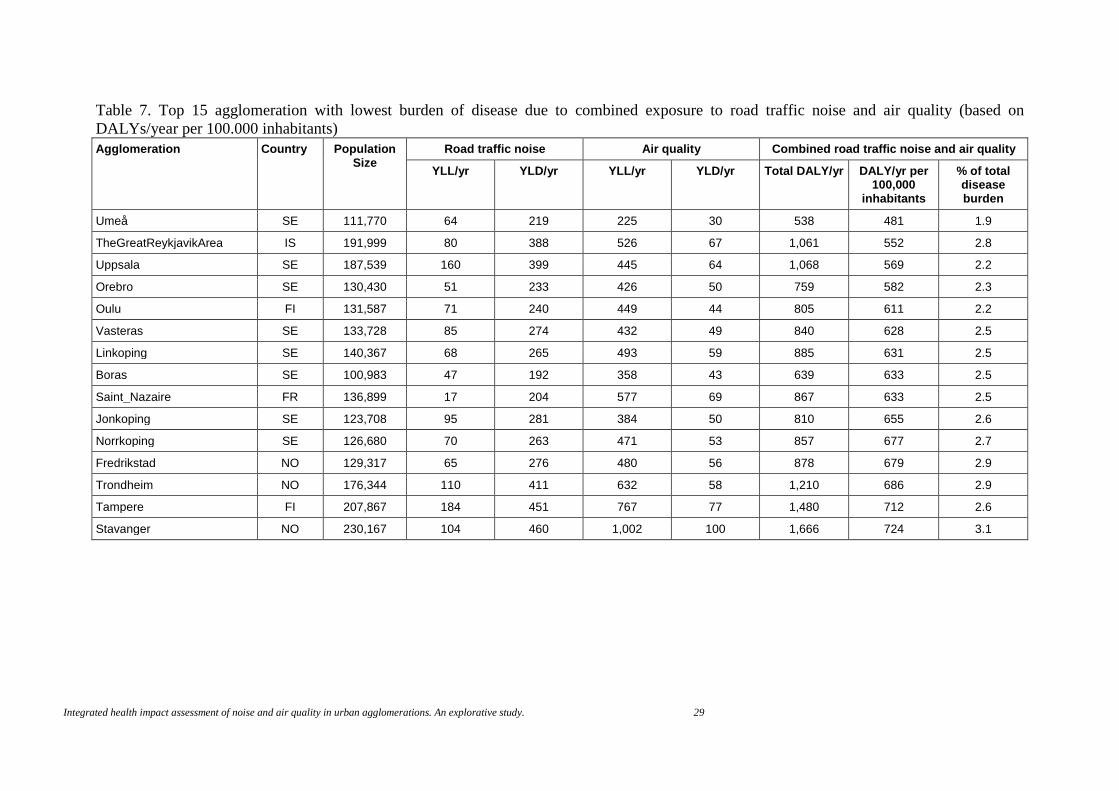
Integrated health impact assessment of noise and air quality in urban agglomerations. An explorative study. 29
Table 7. Top 15 agglomeration with lowest burden of disease due to combined exposure to road traffic noise and air quality (based on DALYs/year per 100.000 inhabitants) Agglomeration Country Population
Size Road traffic noise Air quality Combined road traffic noise and air quality
YLL/yr YLD/yr YLL/yr YLD/yr Total DALY/yr DALY/yr per 100,000
inhabitants
% of total disease burden
Umeå SE 111,770 64 219 225 30 538 481 1.9
TheGreatReykjavikArea IS 191,999 80 388 526 67 1,061 552 2.8
Uppsala SE 187,539 160 399 445 64 1,068 569 2.2
Orebro SE 130,430 51 233 426 50 759 582 2.3
Oulu FI 131,587 71 240 449 44 805 611 2.2
Vasteras SE 133,728 85 274 432 49 840 628 2.5
Linkoping SE 140,367 68 265 493 59 885 631 2.5
Boras SE 100,983 47 192 358 43 639 633 2.5
Saint_Nazaire FR 136,899 17 204 577 69 867 633 2.5
Jonkoping SE 123,708 95 281 384 50 810 655 2.6
Norrkoping SE 126,680 70 263 471 53 857 677 2.7
Fredrikstad NO 129,317 65 276 480 56 878 679 2.9
Trondheim NO 176,344 110 411 632 58 1,210 686 2.9
Tampere FI 207,867 184 451 767 77 1,480 712 2.6
Stavanger NO 230,167 104 460 1,002 100 1,666 724 3.1

30 ETC/ACM Technical Paper 2017/12
Table 8. Top 15 agglomeration with highest burden of disease due to combined exposure to road traffic noise and air quality (based on DALYs/year per 100.000 inhabitants) Agglomeration Country Population
Size Road traffic noise Air quality Combined road traffic noise and air quality
YLL/yr YLD/yr YLL/yr YLD/yr Total DALY/yr DALY/yr per 100,000
inhabitants
% of total disease burden
Plovdiv BG 342,200 2,933 1,519 10,447 638 15,536 4,540 11.0
Sofia BG 1,377,532 8,557 5,367 40,576 2,231 56,732 4,118 10.0
Varna BG 320,300 2,772 1,600 7,091 433 11,896 3,714 9.0
Milano IT 1,256,211 2,534 5,286 36,611 1,688 46,119 3,671 13.4
Craiova RO 243,767 1,523 1,034 5,827 355 8,739 3,585 9.4
Ruda Sl|eska PL 143,395 520 566 3,447 241 4,775 3,330 10.5
Zabrze PL 187,676 598 669 4,593 318 6,178 3,292 10.4
Pleven BG 140,966 539 316 3,546 226 4,627 3,283 7.9
Chorzow PL 113,008 332 360 2,799 189 3,679 3,256 10.2
Bucharest RO 1,677,987 6,856 5,390 39,612 2,038 53,897 3,212 8.4
Torino agglomeration IT 1,278,521 1,081 3,084 34,880 1,612 40,657 3,180 11.6
Gliwice PL 196,171 476 571 4,752 336 6,135 3,127 9.8
Rybnik PL 141,372 354 432 3,371 244 4,402 3,114 9.8
Bytom PL 182,748 439 596 4,345 303 5,682 3,109 9.8
Katowice PL 311,179 564 819 7,579 515 9,476 3,045 9.6

Integrated health impact assessment of noise and air quality in urban agglomerations. An explorative study. 31
Table 9. Top 15 agglomeration with lowest burden of disease due to combined exposure to road traffic noise and air quality (based on percentage of total burden of disease) Agglomeration Country Population
Size Road traffic noise Air quality Combined road traffic noise and air quality
YLL/yr YLD/yr YLL/yr YLD/yr Total DALY/yr DALY/yr per 100,000
inhabitants
% of total disease burden
Umeå SE 111,770 64 219 225 30 538 481 1.9
Oulu FI 131,587 71 240 449 44 805 611 2.2
Uppsala SE 187,539 160 399 445 64 1,068 569 2.2
Orebro SE 130,430 51 233 426 50 759 582 2.3
Vasteras SE 133,728 85 274 432 49 840 628 2.5
Linkoping SE 140,367 68 265 493 59 885 631 2.5
Saint_Nazaire FR 136,899 17 204 577 69 867 633 2.5
Boras SE 100,983 47 192 358 43 639 633 2.5
Tampere FI 207,867 184 451 767 77 1,480 712 2.6
Jonkoping SE 123,708 95 281 384 50 810 655 2.6
Lahti FI 99,998 83 215 399 41 738 738 2.6
Norrkoping SE 126,680 70 263 471 53 857 677 2.7
The Great Reykjavik Area IS 191,999 80 388 526 67 1,061 552 2.8
Turku FI 175,285 176 414 761 64 1,415 807 2.9
Fredrikstad NO 129,317 65 276 480 56 878 679 2.9

32 ETC/ACM Technical Paper 2017/12
Table 10. Top 15 agglomeration with highest burden of disease due to combined exposure to road traffic noise and air quality (based on percentage of total burden of disease) Agglomeration Country Population
Size Road traffic noise Air quality Combined road traffic noise and air quality
YLL/yr YLD/yr YLL/yr YLD/yr Total DALY/yr DALY/yr per 100,000
inhabitants
% of total disease burden
Milano IT 1,256,211 2,534 5,286 36,611 1,688 46,119 3,671 13.4
Torino agglomeration IT 1,278,521 1,081 3,084 34,880 1,612 40,657 3,180 11.6
Plovdiv BG 342,200 2,933 1,519 10,447 638 15,536 4,540 11.0
Ruda Sl|eska PL 143,395 520 566 3,447 241 4,775 3,330 10.5
Zabrze PL 187,676 598 669 4,593 318 6,178 3,292 10.4
Chorzow PL 113,008 332 360 2,799 189 3,679 3,256 10.2
Sofia BG 1,377,532 8,557 5,367 40,576 2,231 56,732 4,118 10.0
Gliwice PL 196,171 476 571 4,752 336 6,135 3,127 9.8
Rybnik PL 141,372 354 432 3,371 244 4,402 3,114 9.8
Bytom PL 182,748 439 596 4,345 303 5,682 3,109 9.8
Katowice PL 311,179 564 819 7,579 515 9,476 3,045 9.6
Lodz PL 742,385 2,150 2,784 16,460 1,097 22,490 3,029 9.5
Krakow PL 754,996 1,224 1,844 18,423 1,178 22,670 3,003 9.4
Craiova RO 243,767 1,523 1,034 5,827 355 8,739 3,585 9.4
Vicenza IT 115,927 166 351 2,318 140 2,975 2,566 9.4
Integrated health impact assessment of noise and air quality in urban agglomerations. An explorative study. 33
4 Discussion 4.1 Introduction
To our knowledge this is the first time that a combined health impact assessment of air quality and noise on a European level has been carried out that is built upon data reported by the EU Member States under the Environmental Noise Directive (END) (EU, 2002) and the Air Quality Directive (EU, 2008). The objectives were to assess the combined burden of disease attributable to the exposure to environmental noise and ambient air pollution in urban agglomerations in Europe and to explore if the agglomerations could be ranked based on the impact of the combined exposure. The disability-adjusted life year (DALY) was chosen as the indicator for the integrated health impact assessment. The concept was already applied in the 90s to describe the environmental burden of disease (de Hollander et al., 1999). More recently, the environmental burden of disease in six European countries was compared using DALYs (Hänninen and Knol, 2011; Hänninen et al., 2014). We considered quantifying the combined impact of noise and air pollution by estimating the total cost of these externalities. To our knowledge there is not an accepted method in Europe how to quantify the combined impact of both factors. In cost benefit analyses of environmental noise often a benefit of 25 Euro per household per decibel per year above noise levels of 50–55 dB Lden is used. This value is based on a meta-analysis of willingness to pay studies by Navrud (2002). However willingness to pay studies were not included in the cost benefit study that was carried out for the Clean Air Policy Package (Holland, 2014) so it is difficult to apply a common method that does do justice to the methods already applied in the fields of noise and air pollution. In this chapter we discuss the uncertainties in the assessment and we compare our finding with results from other studies. 4.2 Uncertainties
We discuss the uncertainties in the results following the steps that can be distinguished in the process of calculation DALYs. 4.2.1 Selection of health endpoints with sufficient proof of a causal relation
It was expected that the WHO regional office for Europe (WHO/Europe) would have completed their Environmental Noise Guidelines for the European Region so their findings and recommendations could be used for the health impact assessment. Unfortunately this was not the case when this report was prepared. The review of WHO focuses on sleep disturbance, annoyance, cognitive impairment, mental health and wellbeing, cardiovascular diseases, hearing impairment and tinnitus and adverse birth outcomes. Sleep disturbance and cardiovascular diseases (coronary heart disease and stroke) were taken into account is this report. It is unknown if WHO will judge whether the evidence for stoke is sufficient. This endpoint was not part of the previous WHO evaluation (WHO, 2011) and the relation

34 ETC/ACM Technical Paper 2017/12
between noise and stroke has been evaluated in a limited number of studies. If not, the consequence for the health impact assessment is limited since the contribution of stroke to the overall burden in the 479 agglomerations is less than 10% (see Annex 1). For the selection of the health endpoints related to air pollution results from the recent HRAPIE-project (WHO, 2013) were used. Since then, a number of new studies on the health effects of air pollution have been published. It is not expected that the addition of new health endpoints like Parkinson disease or a re-evaluation of the used health endpoints would lead to substantial differences in the health impacts assessment. Years of life lost due to premature mortality have the largest contribution to the burden of disease. In this study we used total mortality as endpoint, since the information about the base-line mortality risk is easily available and the calculation of the YYL is straightforward. If the impact had been calculated for cause specific mortality, the estimated impact is probably lower. In the EBODE study (Hänninen and Knol, 2011) the difference was about 25%. 4.2.2 Assessment of population exposure distributions
As indicated before the assessment is built upon data reported by the EU Member States under the Environmental Noise Directive (END) (EU, 2002) and the Air Quality Directive (EU, 2008). It was necessary to generate, from the reported data, exposure distributions for road traffic noise, PM, O3 and NO2 that cover the entire population in the considered agglomerations. Health risks of noise and air quality are also present in situations that are not considered as hotspots. This study could make use of the datasets produced by separate and unrelated studies on the exposure assessment of road traffic noise and of air quality (Houthuijs et al., 2015; Horálek et al, 2016 and Horálek et al, 2017). Since noise data is in the framework of the END only reported for hotspots like agglomerations with a population in excess of 100,000 inhabitants, the combined assessment was limited to the almost 500 END agglomerations in Europe. The uncertainties in the air pollution exposure data are described in Horálek et al, 2016 and Horálek et al, 2017. In general, the precision of the interpolated data is within plus or minus 20% of the concentrations measured. The mapping methodology fulfilled the model data quality objectives as set by the Air Quality Directive (EC, 2008). For the reported noise exposure data, there is concern about the comparability of the noise assessment in the various member states. Recently, Houthuijs et al. (2018) compared the reported fraction above 55 dB Lden for END agglomerations in 2012 with the modelled fraction based on population and road network density grids of 1 by 1 km. Systematic differences were found between countries. The correlation between the reported and modelled fraction improved from 0.30 to 0.70 when systematic differences between countries were taken into account. Non comparability of results was also identified for the first round of noise mapping in Europe (De Vos and Licitra, 2013). The non-comparability can have a substantial influence on the contribution of health endpoints with an assumed threshold, like the cardiovascular endpoints. It is not possible to quantify the magnitude of the uncertainties introduced by systematic differences between countries, nor is it possible to quality the consequences for the ranking of agglomerations. In addition, the noise exposure distribution for road traffic noise was extrapolated below 55 dB Lden and 50 dB Lnight. The uncertainty in this part of the exposure distribution is unknown. The results from the health impact assessment suggest that the impact of the uncertainty could be limited. The exposure levels below 50 dB Lnight contribute for 32% to the health impact of noise, so the uncertainty of the
Integrated health impact assessment of noise and air quality in urban agglomerations. An explorative study. 35
extrapolation is confined to this part. For cardiovascular endpoints the contribution of noise level below 55 dB Lden is very limited (see Figure 5). This study estimates the attributable burden due to air pollution and road traffic noise in major European agglomerations. We are hesitant to extrapolate noise levels from other noise sources to lower levels. For example, a common policy of airports is to avoid or reduce aircraft flights over densely populated areas like agglomerations. It is therefore difficult to assess for individual agglomerations how the reported population sizes per 5 dB exposure category relate to the population size at lower noise levels. Road traffic noise is for the endpoints evaluated the most important contributor within agglomerations. Railway noise within agglomerations accounts for about 10% (Houthuijs et al, 2015). The contribution of aircraft noise (within and outside agglomerations) to the size of the (highly) sleep disturbed population is about a factor 4 smaller than the contribution of road traffic in agglomerations. The contribution of aircraft noise to coronary heart disease and cerebrovascular disease is small compared to the other sources (Houthuijs et al., 2015; Vienneau et al., 2015). By including only road traffic noise in the health assessment, the total burden of disease from noise might be underestimated by 20-25%. 4.2.3 Identification of exposure-response relations in dimensions compatible with the
exposure distributions
The exposure response relations used for road traffic noise were all based on meta-analyses or pooled analyses of multiple studies (see Houthuijs et al., 2014). Exposure indicators were transformed to Lden or Lnight where necessary. The exposure response relation for highly sleep disturbed was extrapolated to lower night-time noise levels (<40 dB Lnight). The uncertainty related to the extrapolation is limited since these lower levels only contribute less than 20% of the burden of noise. We applied a threshold of 50 dB Lden for the cardiovascular effect of noise. It is unknown if WHO will declare a threshold for cardiovascular effect of noise and, if yes, what the value of this threshold will be. The exposure response relations for air pollution were based on the HRAPIE study (WHO, 2013). We discussed in the methods section already that the recommendations from HRAPIE for NO2 about a possible threshold value of 20 µg/m3 might be too conservative, so we applied a counterfactual concentration of 10 µg/m3. To avoid a possible overlap in risk with particulate matter, we adjusted the relative risk for NO2 downwards to 1.039 per 10 µg/m3, although this risk estimate is still higher than the interim value (1.025 per 10 µg/m3) suggested by COMEAP (2015) or the for PM10 adjusted NO2 estimate (1.02 per 10 µg/m3) in Fischer et al. (2015) For the other endpoints we followed the HRAPIE study. We acknowledge that there is discussion about the use of the association between particulate matter and chronic bronchitis. Recently, COMEAP (2016) recommended not to include an association between long-term exposure to ambient air pollution and chronic bronchitis in core health impact assessments, but only in sensitivity analysis. The committee indicated that the considered evidence does not sufficiently establish causality. Chronic bronchitis contributes about 3.5% to the total DALYs attributable to air pollution in this report. 4.2.4 Estimation of the number of cases with the specific health endpoint
We used country specific data on population characteristics like the age distribution. Specific data for agglomerations is not easily available; we do not expect that using country instead of city baseline data will have a large influence on the results. Also recent baseline country specific data for the incidence, mortality, hospital admissions and the burden of disease of cardiovascular or respiratory disease was used. Exceptions are

36 ETC/ACM Technical Paper 2017/12
the prevalence and incidence of (chronic) bronchitis and of (minor) restricted activity days for which one baseline value for all countries was used. Recent comparable European wide data on bronchitis or restricted activities days is missing, so it is difficult to evaluate the uncertainty introduced by adopting the same prevalence or incidence in all agglomerations. For sleep disturbance it is assumed that the same exposure response relation is applicable in all agglomerations. The relation is based on the Lnight assessed at the highest façade of the building. It is expected that there are difference between the indoor and outdoor night-time level between the agglomerations, given the variation in climate and housing standards in Europe. So far as we know, there is no literature describing the validity of the assumption that the relation between night-time noise and sleep disturbance is generally applicable. 4.2.5 Estimation of the duration and of selection of appropriate weighing factors
The duration and weighing factors for the majority of the air pollution endpoints (mortality, cardiovascular and respiratory hospital admissions) were derived from the recent study of Bachmann and van der Kamp (2017). They compared and analysed the duration and weights from various studies and derived up-to-date values for them. In addition, we calculated DALYs for restricted activity days, works days lost, bronchitis and asthma. The uncertainties related to the duration and severity will have limited impact, since the contribution of all health endpoints of air pollution to the YLDs is less than 6% of the combined burden of disease of road traffic noise and air pollution. For road traffic noise a different approach was followed. For the cardiovascular endpoints, the population attributable fraction was directly applied on the total YLD and YLL that was estimated by WHO for each of the countries. For sleep disturbance we applied a weighting factor of 0.06 which is slightly less than applied in other assessments (WHO, 2011; Hänninen et al., 2014). We derived the value from the same studies but, instead of the mean, we used the median given the skewed distributions. In recent Global Burden of Disease studies the assessment of the severity weights was improved by using paired comparison (Haagsma et al., 2015). It is recommended to update the severity weight of sleep disturbance, since the underlying studies applied different methods. 4.2.6 Computation of the total health burden
For this report, we updated for the health impact of noise some of the baseline data and we applied a slightly different calculation method for cardiovascular endpoints than in previous assessment (for details see Annex 1). The update of the baseline data and refinement of the method did not lead, on a European level, to major deviations of previous reported results. The methodology to assess the health impact of air pollution used here corresponds to the methodology used in the impact assessments presented in the annual Air Quality reports published by the EEA (2015, 2016, 2017). The year-to-year changes noted in the EEA reports largely stems from changes in the concentration fields. The sensitivity on the assumption of counterfactual concentration has been shown in the 2017-report (EEA, 2017). In comparison to the EEA results, we have adjusted the relative risk factor for NO2 as discussed above. Ranking agglomerations on all kinds of aspect is very popular, especially in the lay press. We carried out a quantitative assessment of the uncertainty in the parameters of the exposure response relations and their consequence in the uncertainty in the total impact. The lower and upper 95% confidence limits of the combined burden of disease in each of the agglomerations are, on average, plus and minus 20% of the calculated total impact. It appears
Integrated health impact assessment of noise and air quality in urban agglomerations. An explorative study. 37
that this size of uncertainty is small in comparison with the variation in combined impact between the agglomerations. Therefore the rankability of the agglomerations is good. For future assessments it is recommended to expand the analysis to other sources of uncertainty (exposure distribution, variation in thresholds, baseline health risks, etc.). It might be possible to assess which source of uncertainty is the most relevant for the total impact, so improvements in the assessment can be target to the most relevant factor(s). We identified in the paragraphs above various points of improvements in the health impact assessment for road traffic noise and air pollution. Although not quantified, we see as the most important points of attention the incomparability of the road traffic noise exposure data between agglomerations, the uncertainty about a threshold value for NO2 and the potential overlap in health risks between NO2 and particulate matter. 4.3 Comparison with results from other studies
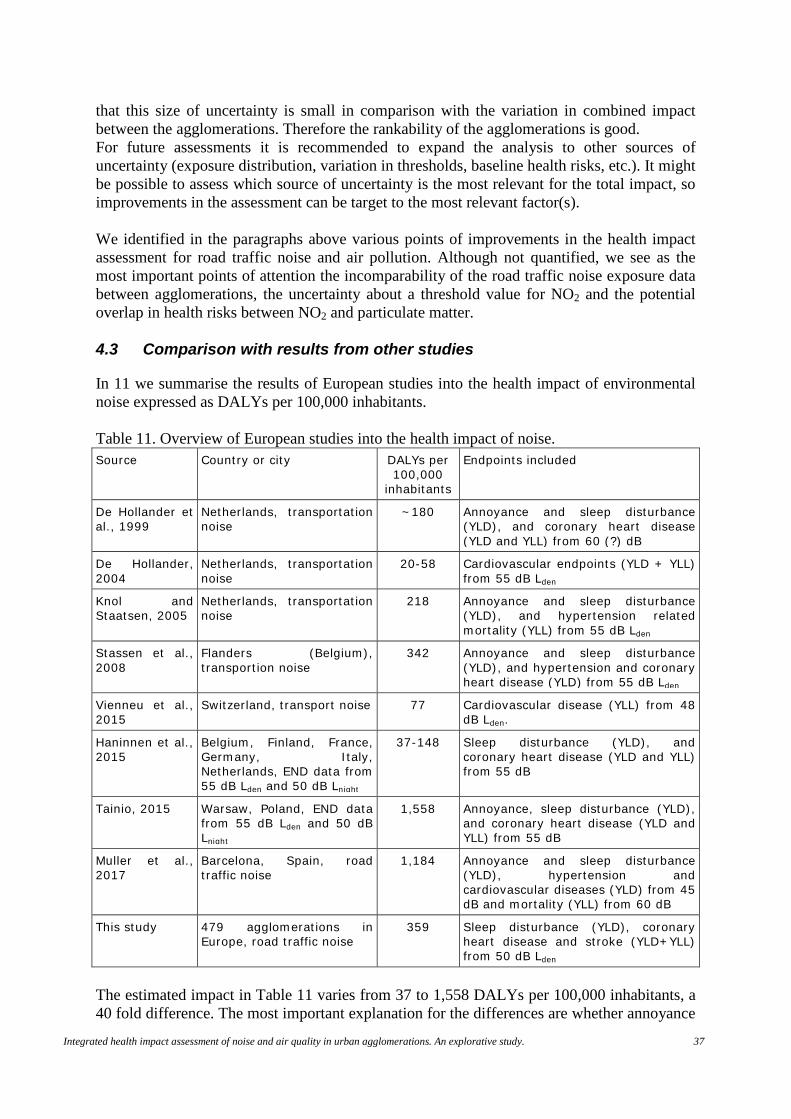
In 11 we summarise the results of European studies into the health impact of environmental noise expressed as DALYs per 100,000 inhabitants. Table 11. Overview of European studies into the health impact of noise. Source Country or city DALYs per
100,000 inhabitants
Endpoints included
De Hollander et al., 1999
Netherlands, transportation noise
~180 Annoyance and sleep disturbance (YLD), and coronary heart disease (YLD and YLL) from 60 (?) dB
De Hollander, 2004
Netherlands, transportation noise
20-58 Cardiovascular endpoints (YLD + YLL) from 55 dB Lden
Knol and Staatsen, 2005
Netherlands, transportation noise
218 Annoyance and sleep disturbance (YLD), and hypertension related mortality (YLL) from 55 dB Lden
Stassen et al., 2008
Flanders (Belgium), transportion noise
342 Annoyance and sleep disturbance (YLD), and hypertension and coronary heart disease (YLD) from 55 dB Lden
Vienneu et al., 2015
Switzerland, transport noise 77 Cardiovascular disease (YLL) from 48 dB Lden.
Haninnen et al., 2015
Belgium, Finland, France, Germany, Italy, Netherlands, END data from 55 dB Lden and 50 dB Lnight
37-148 Sleep disturbance (YLD), and coronary heart disease (YLD and YLL) from 55 dB
Tainio, 2015 Warsaw, Poland, END data from 55 dB Lden and 50 dB Lnight
1,558 Annoyance, sleep disturbance (YLD), and coronary heart disease (YLD and YLL) from 55 dB
Muller et al., 2017
Barcelona, Spain, road traffic noise
1,184 Annoyance and sleep disturbance (YLD), hypertension and cardiovascular diseases (YLD) from 45 dB and mortality (YLL) from 60 dB
This study 479 agglomerations in Europe, road traffic noise
359 Sleep disturbance (YLD), coronary heart disease and stroke (YLD+YLL) from 50 dB Lden
The estimated impact in Table 11 varies from 37 to 1,558 DALYs per 100,000 inhabitants, a 40 fold difference. The most important explanation for the differences are whether annoyance

38 ETC/ACM Technical Paper 2017/12
is included in the calculation of the burden of disease and the applied severity weights for annoyance and sleep disturbance. In the (oldest) studies in the Netherlands and Belgium annoyance and sleep disturbance were included in the calculation of the burden of disease, but relative low severity weights were applied (0.01 or 0.02). In later studies higher disability weights (0.02 and 0.07) were used referring to the report on the Burden of Disease of Environmental Noise report (WHO, 2011). In later report of WHO (2012), it was recommended not to use annoyance in burden of disease calculation. This was implemented in the EBODE study (Hanninen et al., 2015) and in this report, but not in the assessments in Warsaw and Barcelona (Taino, 2015 and Muller et al., 2017). In Barcelona annoyance contributed 37% to the total health impact of noise; in Warsaw 49%. The evidence about the association between noise and cardiovascular disease has changed over time, since results from new studies have become available. In the older health impact assessment studies on noise a threshold of 55 or 60 dB was applied for the risk of hypertension or cardiovascular disease which leads to smaller impacts. There are differences in the location of the assessments in the studies. In a country wide assessment (the first 6 references in Table 11) the average exposure level will be lower than in assessments in agglomerations. Also in some studies, the full exposure distribution for noise is not available (Haninnen et al., 2015 and Tainio, 2015), or only one source of transportation noise is quantified (Muller et al. 2017 and this study). These observations illustrate that it is not possible to compare the results of this report with the outcomes of European studies on the health impact of environmental noise, given the various differences in the methods applied. The largest contributor to the health impact of air pollution is premature mortality. In earlier health impact studies only particulate matter was linked to mortality. For example the EBODE study in 6 European countries estimated an impact of 600-1,000 DALYs per year per 100,000 inhabitants for the exposure to PM2.5. Our results (on average, 785 DALYs per year per 100,000 inhabitants) are in line with these results from EBODE (Hanninen et al., 2015). Particulate matter is therefore the most important environmental contributor to the overall burden of disease. The HRAPIE study of WHO (2013) indicated that there is an independent association of nitrogen dioxide and mortality. In this report the mortality of NO2 contributes to 40% of the total health impact of air pollution in agglomerations (on average, 573 DALYs per year per 100,000 inhabitants). From the studies in Table 11, only in the health impact assessment for Warsaw the impact of NO2 was quantified (20% contribution to the total impact of air pollution, about 300 DALYs per year per 100,000 inhabitants). We already mentioned earlier the uncertainty about the threshold value for NO2 and the potential overlap in health risks between NO2 and particulate matter. Differences in the appreciation of these uncertainties could easily lead to different implementations of exposure response relations for NO2 in future health impact assessments. Several health impact assessments concluded in the past that in the prioritising of environmental risks factor it is particulate matter “first”, and noise “second”. The results of this report suggest that for agglomerations the health impact of NO2 is, on average, larger than the health impact of road traffic noise. In 292 of the 479 agglomerations (61%) the impact of NO2 was larger than the impact of road traffic noise. We have identified in the report several improvements for the health impact assessment of NO2 and for road traffic noise, so we do not conclude that NO2 is of more importance than road traffic noise. The comparison of the results of this report had led to the notion that for some of the 479 agglomerations results of health impact assessments on environmental noise and air pollution
Integrated health impact assessment of noise and air quality in urban agglomerations. An explorative study. 39
separately or combined are already available. It is likely that the results from these studies will differ from the results in this report. We emphasize that an important objective of this report is to get insight in the “average” burden of disease due to noise and air pollution in agglomerations in Europe and to explore if ranking of the agglomerations is possible. For this reason, we applied a common methodology for all agglomerations. We acknowledge that other choices in the quantification of the health impacts are possible. We expect that in local or country specific studies the selection of the health endpoints, exposure response relations and other relevant aspects have been discussed and agreed with stakeholders so that the methodology will be based on more detailed information and is therefore more tailored to the local situation than is possible in a European wide assessment. If results of the health impact assessment from this report differ from the results described in local or country reports, we recommend valuing the results from the local or country reports as leading. 4.4 The use of DALYs for comparison of noise and air pollution impacts
It should be noted that DALYs give, at the best, an indication of the potential, relative order of the magnitude of different environmental health impacts in the agglomerations or about the relative order of the combined health impact in the agglomerations. The burden of disease cannot be interpreted as absolute or completely representative numbers in the light of the discussion about the representative of the exposure distributions and the exposure response relations for individual agglomerations, the selection of the health endpoints, disability weights and durations, etc. Prioritisation should therefore not be done on DALYs solely (Knol et al., 2009). DALYs are only useful, and not more than a tool, in situations where environmental factors with different and incomparable health states have to be compared or summed in the same unit to be used for a ranking of the combined impact. Comparability in the calculation of the impact of different environmental factors and assessment of the exposure in similar ways are crucial otherwise the use of DALYs as an integrated indicator cannot be justified (Knol et al., 2009). The concept of DALYs is particularly useful when comparing the effectiveness of abatement measures to reduce the environmental health impacts. Overall, we are confident that for the majority of the agglomerations the ranking of the agglomerations is robust. Unfortunately, it is difficult to quantify how comparable noise exposure distributions reported in the framework of the END are between agglomerations. There are agglomerations with a relative small impact for road traffic noise. In some cases, we have serious doubts about the quality of the reported data. Second, there are differences between the calculation of the impact of noise and the calculation of air pollution and in the appreciation of the health endpoints. We choose to make use of authoritative reviews or literature (WHO, CAFÉ, EEA, etc.). However, it should be noted that most of these reviews are orientated on or noise or air pollution, and not on the combination of both. The results of the relative small number of papers where both environmental factors are quantified indicate that study findings are difficult to compare between papers given the different methods that were used. This does not mean that the applied methods are not appropriate. As pointed out above, DALYs should be used for relative and not for absolute comparisons which could lead to different choices. Nevertheless, the field of integrated health impact assessment would benefit if the methods for health impact assessment of environmental noise and air pollution are more harmonised. For this reason, we added as sub title to this paper “An explorative study”.

40 ETC/ACM Technical Paper 2017/12
5 Conclusions It is possible to rank large agglomerations in Europe on their combined health impact of road traffic noise and air pollution. Rankings based on the percentage of the total burden of disease or based on DALYs per 100,000 inhabitants may slightly differ. Thirteen agglomerations can be found in both top15’s with the lowest burden. These agglomerations are mainly located in the Nordic countries; population numbers are below 250,000. Agglomerations with the highest burden are located in eastern Europe and Italy. A wide range in size is seen: population numbers range from 113,000 to 1.4 million. Twelve agglomerations are included in the two listings of the top15 having the highest burden. The combined health impact is 1,745 DALYs per year per 100.000 inhabitants. This corresponds with 6.2% of the total burden of disease for all causes per year. 1.3% Of the burden is by noise and 5.0% by air pollution. There is a 7 to 9 fold difference in the health impact between the highest and lowest ranked agglomeration, so there is ample room for improvement of the health impact of road traffic noise and air pollution in a large number of European agglomerations. Particulate air pollution contributes, on average, for 45% to the total impact, followed by nitrogen dioxide with 33%. Road traffic noise is associated with 21% and ozone with 2% of the combined burden of disease by road traffic noise and air pollution. The impact of air pollution is for 94% related to premature mortality and for 6% to years lost with a disability. For road traffic noise, 30% is related to premature mortality and 70% to years lost with a disability. The health impact is not homogenous distributed over Europe. Three clusters of agglomerations can be spatially distinguished. • Relative low contributions from particulate matter, ozone, nitrogen dioxide and road
traffic noise are found in the (extended) coastal regions of the Atlantic and North Sea and in the Baltic countries (total impact is, on average, 1,273 DALYs per year per 100.000 inhabitants);
• In the central and southern part of Europe, relative large contributions of nitrogen dioxide and ozone are seen (total impact is, on average, 1,857 DALYs per year per 100.000 inhabitants), and
• In the eastern part of the EU the impact is almost twice as high as in the coastal areas. Particulate matter and road traffic noise contribute to the relative high total impact (on average, 2,649 DALYs per year per 100.000 inhabitants).
Within these clusters, there can be substantial differences between agglomerations. This report identified various points of improvements in the health impact assessment for road traffic noise and air pollution itself and for the combined assessment. Important points of attention are the incomparability of the road traffic noise exposure data between agglomerations, the lack of information about noise exposures levels below 55 dB Lden and 50 dB Lnight, and the uncertainty about a threshold value for NO2 and the potential overlap in health risks between NO2 and particulate matter.
Integrated health impact assessment of noise and air quality in urban agglomerations. An explorative study. 41
References Bachmannn TM, van der Kamp J (2017) Expressing air pollution-induced health-related
externalities in physical terms with the help of DALYs. Environmental International 103, 39-50.
Blanes N, Fons J, Houthuijs D, Swart W, Sáinz de la Maza M, José Ramos M-J, Castell N, van Kempen E (2016) Noise in Europe 2017: updated assessment. ETC/ACM Technical Paper 2016/13.
Burnett RT, Pope CA, III, Ezzati M, Olives C, Lim SS, Mehta S, Shin HH, Singh G, Hubbell B, Brauer M, Anderson HR, Smith KS, Kan H, Laden F, Pruess A, Turner MC, Thun M, Cohen A. (2014) An integrated risk function for estimating the global burden of disease attributable to ambient fine particulate matter exposure. Environmental Health Perspectives, 122, 397–403.
Can A, Rademaker M, van Renterghem T, Mishra V, van Poppel M, Touhafi A, Theunis J, De Baets B, Botteldooren (2011) Correlation analysis of noise and ultrafine particle counts in a street canyon. Sci. Tot. Environ. 409, 564-572. Charrad M, Ghazzali N, Boiteau V, Niknafs A (2014) NbClust: an R package for determining the relevant number of clusters in a data set. J. Stat. Softw. 61, 1-36.
Charrad M, Ghazzali N, Boiteau V, Niknafs (2014) Nbclust: an R package for determining the relevant number of clusters in a data set. J Statistical Software 61(6) , 1-36
COMEAP (2015) Interim statement on quantifying the association of long-term average concentrations of nitrogen dioxide and mortality. Public Health England.
COMEAP (2016) Long-term exposure to air pollution and chronic bronchits. A report by the Committee on the Medical Effects of Air Pollutants. Public Health England.
De Hollander AEM (2004). Assessing and evaluating the health impact of environmental exposures: “deaths, DALYs or dollars?” (thesis). Utrecht, University of Utrech, 2004.
De Hollander, A.E.M., Melse, J.M., Lebret, E., Kramers, P.G.N. An aggregate public health indicator to represent the impact of multiple environmental exposures (1999) Epidemiology, 10 (5), pp. 606-617.
De Leeuw F and Horálek J. (2009) Assessment of the health impacts of exposure to PM2.5 at a European level. ETC/ACC Technical Paper 2009/1.
De Leeuw F and Horálek J (2017) Quantifying the health impacts of ambient air pollution: methodology and input data. ETC/ACM Technical paper 2016/5.
De Vos P, Litricia G (2013) Noise maps in the European Union. An overview. In: Litricia G (ed). Noise mapping in the EU. Models and Procedures. CRC Press. Boca Raton.
EC (2013) European Commission, ‘The Clean Air Package’ http://ec.europa.eu/environment/air/clean_air_policy.htm
Eurostat (2017a) Hospital discharges by diagnosis, in-patients, total number. http://data.europa.eu/euodp/data/dataset/RqN2qVUUzSIRKd0Lz8Kthg
Eurostat (2017b) In-patient average length of stay (days). http://ec.europa.eu/eurostat/web/products-datasets/product?code=HLTH_CO_INPST.
Eurostat (2017c) Employment rate of the total population, men and women, age group 20-64. http://ec.europa.eu/eurostat/web/products-datasets/-/tesem010
EEA, 2014, Noise in Europe 2014, EEA Report No 10/2014, European Environment Agency (http://www.eea.europa.eu/publications/noise-in-europe-2014).
EEA (2015) Air quality in Europe -2015 report. EEA Report No. 5/2015. EEA (2016) Air quality in Europe -2016 report. EEA Report No. 28/2016. EEA (2017) Air quality in Europe -2017 report. EEA Report No. 13/2017.

42 ETC/ACM Technical Paper 2017/12
ETC/ACM (2015) Methodological proposal to interpolate a complete coverage on noise exposure at EU level. ETC/ACM working paper.
EU (2002) Directive 2002/49/EC of the European Parliament and of the Council of 25 June 2002 relating to the assessment and management of environmental noise. Official Journal, L 189, 18.7.2002, p. 12–25.
EU, 2008, Directive 2008/50/EC of the European Parliament and of the Council of 21 May 2008 on ambient air quality and cleaner air for Europe. Official Journal, L 152, 11.6.2008, p. 1–44.
Extrium, 2013, Technical note to the European Environment Agency on forecasting ENDRM DF4_8 data to 2020, 2030 and 2050, 29 November 2013 (http://forum.eionet.europa.eu/nrc-noise/library/noise-report-2014).
GBD 2015 Risk Factors Collaborators (2016) Global, regional, and national comparative risk assessment of 79 behavioural, environmental and occupational, andmetabolic risks or clusters of risks, 1990–2015: a systematic analysis for the Global Burden of Disease Study 2015. Lancet 388: 1659–724.
Haagsma, J.A., de Noordhout, C.M., Polinder, S., Vos, T., Havelaar, A.H., Cassini, A., Devleesschauwer, B., Kretzschmar, M.E., Speybroeck, N., Salomon, J.A. Assessing disability weights based on the responses of 30,660 people from four European countries (2015) Population Health Metrics, 13 (1), art. no. 10.
Hänninen O, Knol A, eds. 2011. European Perspectives on Environmental Burden of Disease: Estimates for Nine Stressors in Six Countries. Available: http://www.thl.fi/thl-client/pdfs/b75f6999-e7c4-4550-a939-3bccb19e41c1
Hänninen, O., Knol, A.B., Jantunen, M., Lim, T.-A., Conrad, A., Rappolder, M., Carrer, P., Fanetti, A.-C., Kim, R., Buekers, J., Torfs, R., Iavarone, I., Classen, T., Hornberg, C., Mekel, O.C.L. Environmental burden of disease in Europe: Assessing nine risk factors in six countries (2014) Environmental Health Perspectives, 122 (5), pp. 439-446.
HEIMTSA/INTARESE (2011) D 153 Final report of the Common Case Study. http://www.integrated-assessment.eu/eu/sites/default/files/CCS_FINAL_REPORT_final.pdf
Héroux, M.-E., Anderson, H. T., Atkinson, R., Brunekreef, B., Cohen, A. Forastiere, F., Hurley, F., Katsouyanni, K., Krewski, D., Krzyzanowski, M., Künzli, N., Mills, I., Querol, X., Ostro, B. Walton, H., 2015, 'Quantifying the health impacts of ambient air pollutants: recommendations of a WHO/Europe project', International Journal of Public Health 60, pp. 619-627.
Holland M (2014) Cost - benefit Analysis of Final Policy Scenarios for the EU Clean Air Package. EMRC. http://ec.europa.eu/environment/air/pdf/TSAP%20CBA.pdf
Horálek, J., de Smet, P., de Leeuw, F., Kurfurst, P, Benešová, N. (2016) European air quality maps for 2014. PM10, PM2.5, ozone, NO2 and NOx; spatial estimates and their uncertainties. ETC/ACM Technical Paper 2016/6.
Horálek, J., de Smet, P., de Leeuw, F., Kurfurst, P. (2017) European NO2 air quality map for 2014. Improved mapping methodology using land cover and traffic data. ETC/ACM Technical Paper 2017/6.
Houthuijs DJM, Van Beek AJ, Swart WJR, Van Kempen EEMM. (2014) Health implication of road, railway and aircraft noise in the European Union. Provisional results based on the 2nd round of noise mapping. RIVM Report 2014-00130. RIVM, Bilthoven.
Houthuijs D, Swart W, van Beek A, van Kempen E, de Leeuw F (2015) Health impact assessment for noise in Europe. ETC/ACM Technical Paper 2014/9.
Houthuijs D, Fons J, Sáinz de la Maza M, Swart W (2018) Method to estimate the road traffic noise exposure distribution in Europe. Improvement of the grid estimations. ETC/ACM Technical Paper 2017/10.

Integrated health impact assessment of noise and air quality in urban agglomerations. An explorative study. 43
Kiesewetter G and Amann M (2014). Urban PM2.5 levels under the EU clean air policy package. TSAP report 12, IIASA, Laxenburg.
Kim KH, Ho DX, Broen RJC, Oh JM, Park CG, Ryu IC (2012) Some insights into the relationship between urban air pollution and noise levels. Sci Tot Environ 424, 271-279
Knoblauch A, Müller-Wenk R. Insomnia and noise-related sleep disturbance. In: Quantifying burden of disease from environmental noise: second technical meeting report, Bern, Switzerland, 15–16 December 2005. Copenhagen, WHO Regional Office for Europe, 2005
Knol, A.B., Staatsen, B.A.M., 2005. Trends in the environmental burden of disease in the Netherlands 1980-2020. Report of the National Institute of Public Health and the Environment no. 500029001/2005), Bilthoven.
Knol, A., Van Kamp, I., De Hollander, G., Van Kempen, E., Schram, D., Houthuijs, D., Lebret, E. DALYs are the answer, but what was the question? (2009) 38th International Congress and Exposition on Noise Control Engineering 2009, INTER-NOISE 2009, 4, pp. 2458-2468.
Lingsma, H.F., Steyerberg, E.W., Eijkemans, M.J.C., Dippel, D.W.J., Scholte Op Reimer, W.J.M., van Houwelingen, H.C. Comparing and ranking hospitals based on outcome: Results from The Netherlands Stroke Survey (2009) QJM, 103 (2), art. no. hcp169, pp. 99-108.
Miedema HME, CGM. Oudshoorn (2001) Annoyance from Transportation Noise: Relationships with Exposure Metrics DNL and DENL and Their Confidence Intervals. Environ Health Perspect 109(2001) 409–416
Miedema HME, H Vos (2007) Associations between self-reported sleep disturbance and environmental noise based on reanalyses of pooled data from 24 studies. Behavioral Sleep Medicine 5 (2007) 1-20.
Morelli X, Foraster M, Aguilera I, Basagana X, Corradi.E., A. Deltell, R. Ducret-Stich R., H. Phuleria H., M.S. Ragettli MS. , M. Rivera M., A. Thomasson A., N. Künzli N., R. Slama (2015) Short-term associations between traffic-related noise, particle number and traffic flow in three European cities. Atmospheric Environment 103, 25-33.Müller-Wenk R (2002) Attribution to road traffic of the impact of noise on health. Environmental Series. No. 339. Swiss Agency for the Environment, Forests. Bern
Mueller, N., Rojas-Rueda, D., Basagaña, X., Cirach, M., Cole-Hunter, T., Dadvand, P., Donaire-Gonzalez, D., Foraster, M., Gascon, M., Martinez, D., Tonne, C., Triguero-Mas, M., Valentín, A., Nieuwenhuijsen, M. Health impacts related to urban and transport planning: A burden of disease assessment (2017) Environment International, 107, pp. 243-257.
Navrud S (2002) The State of the Art on Economic Valuation of Noise. Final report to the European Commission, DG Environment. April 14th 2002.
Raaschou-Nielsen O, Andersen ZJ, Jensen SS, Ketzel M, Sorensen M, Hansen J, Loft S et al (2012) Traffic air pollution and mortality from cardiovascular disease and all causes: a Danish cohort study. Environ Health 11:60. doi:10.1186/1476-069X-11-60.
Stassen, K.R., Collier, P., Torfs, R. Environmental burden of disease due to transportation noise in Flanders (Belgium) (2008) Transportation Research Part D: Transport and Environment, 13 (6), pp. 355-358.
Tainio, M.Burden of disease caused by local transport in Warsaw, Poland (2015) Journal of Transport and Health, 2 (3), pp. 423-433.
Van Dishoeck, A.-M., Lingsma, H.F., Mackenbach, J.P., Steyerberg, E.W. Random variation and rankability of hospitals using outcome indicators (2011) BMJ Quality and Safety, 20 (10), pp. 869-874.
44 ETC/ACM Technical Paper 2017/12
Van Kempen E, Babisch W (2012) The quantitative relationship between road traffic noise and hypertension: A meta-analysis (2012) Journal of Hypertension, 30 (6), pp. 1075-1086.
Van Kempen EEM (1998). Environmental DALYs. Development of severity weights for environmental endpoints and estimation of the environmental burden (in Dutch) University of Maatricht. Maastricht.
Vienneau D, Perez L, Schindler C, Probst-Hensch N, Röösli M (2013) The relationship between traffic noise exposure and ischemic heart disease: a meta-analysis (2013) In: Proceedings of INTER-NOISE 2013, the 42nd International Congress and Exposition on Noise Control Engineering. Innsbruck, Austria.
Vienneau D, Perez L, Schindler C, Lieb C, Sommer H, Probst-Hensch N, Künzli N, Röösli M (2015) Years of life lost and morbidity cases attributable to transportation noise and air pollution: a comparative health risk assessment for Switzerland in 2010. Int J Hygine Environ Health 218, 514-521.
WHO (2006) Air Quality Guidelines: Global update 2005 — Particulate matter, ozone, nitrogen dioxide and sulphur dioxide. World Health Organization, Regional Office for Europe, Copenhagen.
WHO (2011) Burden of disease from environmental noise. Quantification of healthy life years lost in Europe. World Health Organization Regional Office for Europe, Copenhagen, 2011.
WHO (2012) Methodological guidance for estimating the burden of disease from environmental noise. World Health Organization Regional Office for Europe, Copenhagen, 2012.
WHO (2013) Health risks of air pollution in Europe – HRAPIE project Recommendations for concentration–response functions for cost–benefit analysis of particulate matter, ozone and nitrogen dioxide Recommendations for concentration–response functions for cost–benefit analysis of particulate matter, ozone and nitrogen dioxide.
WHO (2016a). Global Health Estimates 2015: Deaths by Cause, Age, Sex, by Country and by Region, 2000-2015. Summary tables, March 2017. Geneva, World Health Organization; 2016.
WHO (2016b) European Detailed Mortality Database, update July 2016. Copenhagen, WHO Regional Office for Europe; http://data.euro.who.int/dmdb/, accessed 5 April 2017.
WHO (2016c) European Health for all database. http://data.euro.who.int/hfadb/. WHO (2016d). Global Health Estimates 2015: DALYs by Cause, Age, Sex, by Country and
by Region, 2000-2015. Summary tables, December 2016. Geneva, World Health Organization; 2016.
WHO (2016e). Global Health Estimates 2015: Burden of disease by Cause, Age, Sex, by Country and by Region, 2000-2015. Summary tables, December 2016. Geneva, World Health Organization; 2016.
WHO (2017a). World Health Organization. Global Health Observatory (GHO) data. www.who.int/gho. Raised blood pressure (SBP ≥ 140 OR DBP ≥ 90), crude (%), Last updated: 2017-01-10
.WHO (2017b) WHO methods and data sources for global burden of disease estimates 2000-2015. Global Health Estimates, Technical Paper WHO/HIS/IER/GHE/2017.1
Wilkins E, Wilson L, Wickramasinghe K, Bhatnagar P, Leal J, Luengo-Fernandez R, Burns R, Rayner M, Townsend N (2017). European Cardiovascular Disease Statistics 2017. European Heart Network, Brussels.

Integrated health impact assessment of noise and air quality in urban agglomerations. An explorative study. 45
Annex 1 Update of methodology for health impact assessment of noise
Introduction The methodology for health impact assessment of noise has been described in more detail in Houthuijs et al (2014). At that time, the number of additional cases for cardiovascular disease was calculated in line with the calculation of additional cases for reading impairment and hypertension. The consequence was that the results slightly overestimates the attributable number of cases and slightly underestimate the population attributable fraction. However, an adequate calculation of the population attributable fraction was not possible, since a part of the relevant exposure (between 50 and 55 dB Lden) was missed. Population attributable fraction Since in this report the full noise exposure distribution in agglomerations was known, we used the common approach to calculate the population attributable fraction (PAF). The PAF is ‘the proportional reduction in population disease or mortality that would occur if exposure to a risk factor were reduced to an alternative ideal exposure scenario’. The PAF per agglomeration can be calculated with the following equation:
𝑃𝑃𝑃𝑃𝑃𝑃(𝑐𝑐) = ∑ 𝑓𝑓𝑖𝑖𝑖𝑖ℎ𝑎𝑎𝑎𝑎(𝐿𝐿𝐿𝐿𝑒𝑒𝐿𝐿, 𝑐𝑐) ∗ 𝑅𝑅𝑅𝑅(𝐿𝐿𝐿𝐿𝑒𝑒𝐿𝐿)75𝐿𝐿𝐿𝐿𝐿𝐿𝑖𝑖=0 − ∑ 𝑓𝑓𝑖𝑖𝑖𝑖ℎ𝑎𝑎𝑎𝑎(𝐿𝐿𝐿𝐿𝑒𝑒𝐿𝐿𝑎𝑎𝑎𝑎𝑎𝑎, 𝑐𝑐) ∗ 𝑅𝑅𝑅𝑅(𝐿𝐿𝐿𝐿𝑒𝑒𝐿𝐿)75
𝐿𝐿𝐿𝐿𝐿𝐿𝑖𝑖=0
∑ 𝑓𝑓𝑖𝑖𝑖𝑖ℎ𝑎𝑎𝑎𝑎75𝐿𝐿𝐿𝐿𝐿𝐿𝑖𝑖=0 (𝐿𝐿𝐿𝐿𝑒𝑒𝐿𝐿, 𝑐𝑐) ∗ 𝑅𝑅𝑅𝑅(𝐿𝐿𝐿𝐿𝑒𝑒𝐿𝐿)
with:
finhab(Lden, c) fraction of inhabitants per dB Lden per agglomeration
finhab(Lden,alt, c) fraction of inhabitants per dB Lden per agglomeration in alternative ideal exposure scenario
RR(Lden) Relative Risk at exposure level Lden
If we assume that an ideal exposure scenario does not lead to an excess risk (RR=1), the equation can be written as:
𝑃𝑃𝑃𝑃𝑃𝑃(𝑐𝑐) = ∑ 𝑓𝑓𝑖𝑖𝑖𝑖ℎ𝑎𝑎𝑎𝑎(𝐿𝐿𝐿𝐿𝑒𝑒𝐿𝐿, 𝑐𝑐) ∗ (𝑅𝑅𝑅𝑅(𝐿𝐿𝐿𝐿𝑒𝑒𝐿𝐿)75𝐿𝐿𝐿𝐿𝐿𝐿𝑖𝑖=0 − 1)
(∑ 𝑓𝑓𝑖𝑖𝑖𝑖ℎ𝑎𝑎𝑎𝑎75𝐿𝐿𝐿𝐿𝐿𝐿𝑖𝑖=0 (𝐿𝐿𝐿𝐿𝑒𝑒𝐿𝐿, 𝑐𝑐) ∗ (𝑅𝑅𝑅𝑅(𝐿𝐿𝐿𝐿𝑒𝑒𝐿𝐿) − 1)) + 1
In the next step, the number of attributable cases per year can be calculated:
PAF(c) * incidence(c) With:
incidence(c) incidence of disease characteristic per year per agglomeration (country estimate was used)
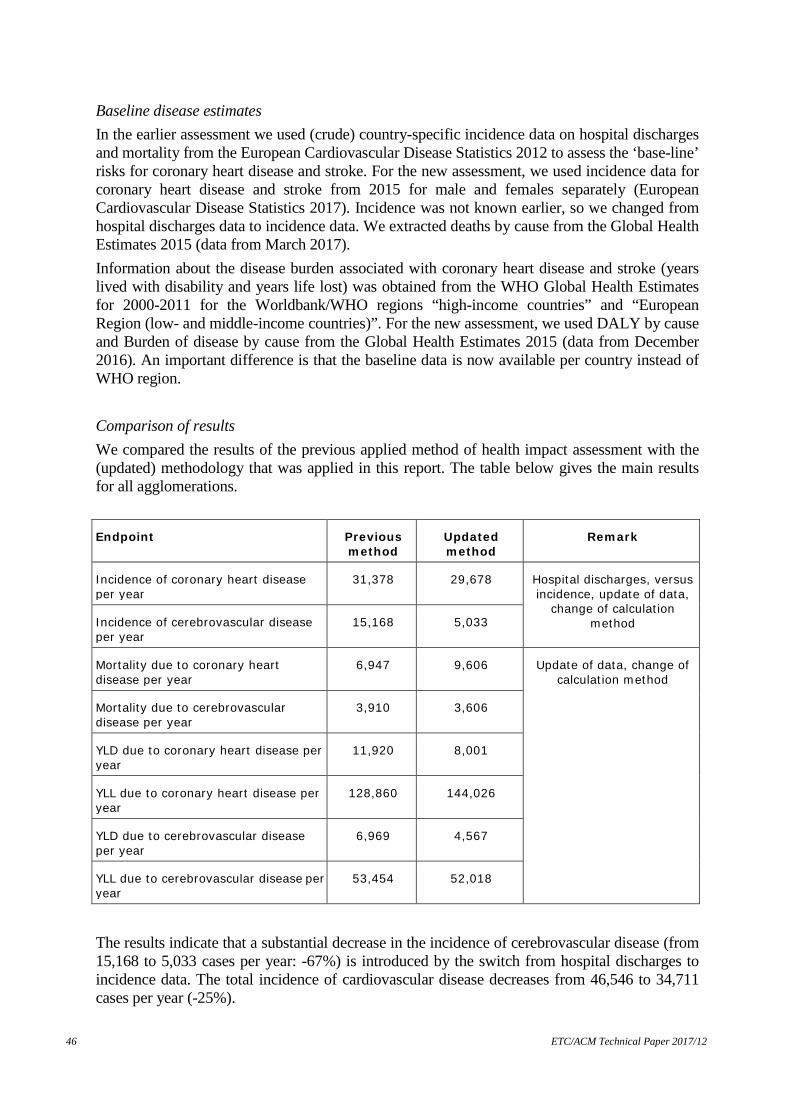
46 ETC/ACM Technical Paper 2017/12
Baseline disease estimates In the earlier assessment we used (crude) country-specific incidence data on hospital discharges and mortality from the European Cardiovascular Disease Statistics 2012 to assess the ‘base-line’ risks for coronary heart disease and stroke. For the new assessment, we used incidence data for coronary heart disease and stroke from 2015 for male and females separately (European Cardiovascular Disease Statistics 2017). Incidence was not known earlier, so we changed from hospital discharges data to incidence data. We extracted deaths by cause from the Global Health Estimates 2015 (data from March 2017). Information about the disease burden associated with coronary heart disease and stroke (years lived with disability and years life lost) was obtained from the WHO Global Health Estimates for 2000-2011 for the Worldbank/WHO regions “high-income countries” and “European Region (low- and middle-income countries)”. For the new assessment, we used DALY by cause and Burden of disease by cause from the Global Health Estimates 2015 (data from December 2016). An important difference is that the baseline data is now available per country instead of WHO region. Comparison of results We compared the results of the previous applied method of health impact assessment with the (updated) methodology that was applied in this report. The table below gives the main results for all agglomerations. Endpoint Previous
method Updated method
Remark
Incidence of coronary heart disease per year
31,378 29,678 Hospital discharges, versus incidence, update of data,
change of calculation method Incidence of cerebrovascular disease
per year 15,168 5,033
Mortality due to coronary heart disease per year
6,947 9,606 Update of data, change of calculation method
Mortality due to cerebrovascular disease per year
3,910 3,606
YLD due to coronary heart disease per year
11,920 8,001
YLL due to coronary heart disease per year
128,860 144,026
YLD due to cerebrovascular disease per year
6,969 4,567
YLL due to cerebrovascular disease per year
53,454 52,018
The results indicate that a substantial decrease in the incidence of cerebrovascular disease (from 15,168 to 5,033 cases per year: -67%) is introduced by the switch from hospital discharges to incidence data. The total incidence of cardiovascular disease decreases from 46,546 to 34,711 cases per year (-25%).
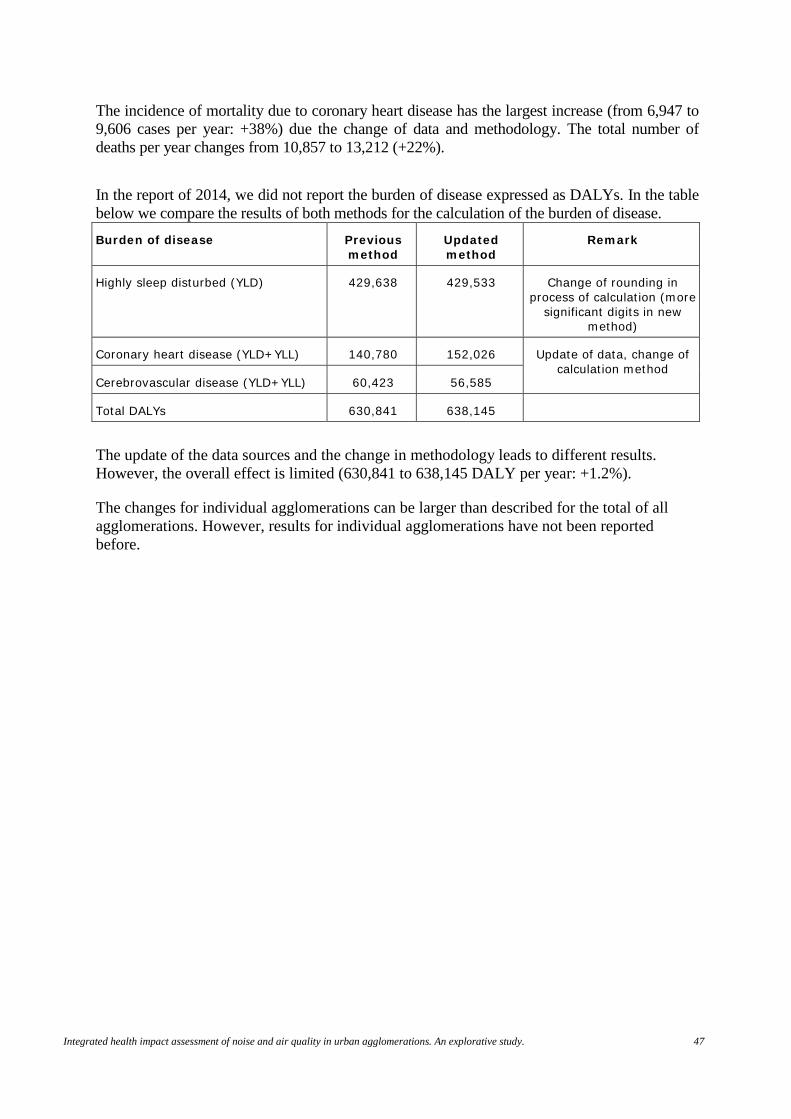
Integrated health impact assessment of noise and air quality in urban agglomerations. An explorative study. 47
The incidence of mortality due to coronary heart disease has the largest increase (from 6,947 to 9,606 cases per year: +38%) due the change of data and methodology. The total number of deaths per year changes from 10,857 to 13,212 (+22%). In the report of 2014, we did not report the burden of disease expressed as DALYs. In the table below we compare the results of both methods for the calculation of the burden of disease. Burden of disease Previous
method Updated method
Remark
Highly sleep disturbed (YLD) 429,638 429,533 Change of rounding in process of calculation (more
significant digits in new method)
Coronary heart disease (YLD+YLL) 140,780 152,026 Update of data, change of calculation method
Cerebrovascular disease (YLD+YLL) 60,423 56,585
Total DALYs 630,841 638,145
The update of the data sources and the change in methodology leads to different results. However, the overall effect is limited (630,841 to 638,145 DALY per year: +1.2%).
The changes for individual agglomerations can be larger than described for the total of all agglomerations. However, results for individual agglomerations have not been reported before.