Embed Size (px)
Citation preview
Combined solar power and storage as cost-competitiveand grid-compatible supply for China’s futurecarbon-neutral electricity systemXi Lua,b,c,1,2
, Shi Chena,d,1, Chris P. Nielsend, Chongyu Zhanga
, Jiacong Lia, He Xue, Ye Wua,c, Shuxiao Wanga
,Feng Songf, Chu Weif, Kebin Hea,b, Michael B. McElroyd,g,2, and Jiming Haoa,c
aSchool of Environment, State Key Joint Laboratory of Environment Simulation and Pollution Control, Tsinghua University, Beijing 100084, China; bInstitutefor Carbon Neutrality, Tsinghua University, Beijing 100084, China; cBeijing Laboratory of Environmental Frontier Technologies, Tsinghua University, Beijing100084, China; dHarvard John A. Paulson School of Engineering and Applied Sciences, Harvard University, Cambridge, MA 02138; eCollege of EnvironmentalScience and Engineering, Nankai University, Tianjin 300350, China; fSchool of Applied Economics, Renmin University of China, Beijing 100872, China;and gDepartment of Earth and Planetary Sciences, Harvard University, Cambridge, MA 02138
Edited by Gunnar Luderer, Potsdam Institute for Climate Impact Research, Potsdam, Germany, and accepted by Editorial Board Member Hans J. SchellnhuberAugust 30, 2021 (received for review February 24, 2021)
As the world’s largest CO2 emitter, China’s ability to decarbonizeits energy system strongly affects the prospect of achieving the 1.5 °Climit in global, average surface-temperature rise. Understandingtechnically feasible, cost-competitive, and grid-compatible solarphotovoltaic (PV) power potentials spatiotemporally is criticalfor China’s future energy pathway. This study develops an in-tegrated model to evaluate the spatiotemporal evolution of thetechnology-economic-grid PV potentials in China during 2020 to2060 under the assumption of continued cost degression in line withthe trends of the past decade. The model considers the spatializedtechnical constraints, up-to-date economic parameters, and dynamichourly interactions with the power grid. In contrast to the PV pro-duction of 0.26 PWh in 2020, results suggest that China’s technicalpotential will increase from 99.2 PWh in 2020 to 146.1 PWh in 2060along with technical advances, and the national average powerprice could decrease from 4.9 to 0.4 US cents/kWh during the sameperiod. About 78.6% (79.7 PWh) of China’s technical potential willrealize price parity to coal-fired power in 2021, with price parityachieved nationwide by 2023. The cost advantage of solar PV allowsfor coupling with storage to generate cost-competitive and grid-compatible electricity. The combined systems potentially could sup-ply 7.2 PWh of grid-compatible electricity in 2060 to meet 43.2% ofthe country’s electricity demand at a price below 2.5 US cents/kWh.The findings highlight a crucial energy transition point, not only forChina but for other countries, at which combined solar power andstorage systems become a cheaper alternative to coal-fired electric-ity and a more grid-compatible option.
solar photovoltaic power | electricity potential | economiccompetitiveness | solar plus storage
Coal has been the dominant energy source fueling the swiftgrowth of China’s economy over the past 40 y. Primary en-
ergy consumption in China increased by a factor greater than 8.5from 1978 to 2019, while the fraction of coal in the energy supplydeclined only modestly, from 66.8 to 57.6%, over the same timeperiod (1). China is responsible now for ∼28.8% of the total CO2emissions worldwide, nearly twice that of the United States,the world’s second largest emitter (1). Due largely to the samereasons, severe air pollution episodes have occurred frequentlyover central and eastern regions of China, where the vast majorityof its population is concentrated (2). China pledged to peak itscarbon emissions by at least 2030 and achieve carbon neutrality by2060 during the United Nations General Assembly in 2020 (3).Decarbonization of the energy system is recognized as a priorityfor China to address the intertwined challenges of domestic airpollution and global climate change (4). One of the biggest chal-lenges facing China is to deploy low- or zero-carbon power gen-eration capacity to meet the increased demand for electricity and
to substitute for existing coal-fired capacity in the longer term(5, 6). Among alternative sources, solar photovoltaic (PV) powergeneration is expected to play an important role in this process inChina given abundant solar resources and huge PV manufacturingcapacity (7–10).The global capacity of solar PV generation has nearly tripled
over the last half decade, increasing from 304.3 GW in 2016 to760.4 GW in 2020 (11, 12). Solar power has been the fastestgrowing power source globally, comprising 50% of global invest-ment in renewable energy from 2010 to 2019 and ranking first innet added generation capacity (13). The top 10 countries in termsof new installations in 2020, together totaling 78% of the globalmarket, included 6 in the Asia-Pacific region (China, India, Japan,Vietnam, Australia, and Korea), 2 in Europe (Germany and theNetherlands), and 2 in the Americas (Brazil and the United States).China retained the leading position in terms of total installedcapacity, accounting for almost one-third of the global total (12).
Significance
Solar photovoltaic power is gaining momentum as a solutionto intertwined air pollution and climate challenges in China,driven by declining capital costs and increasing technical effi-ciencies. The dynamic spatial trajectory of cost-competitive andgrid-compatible penetration potentials for solar power will bea critical determinant of the speed of energy system decar-bonization in China. This study develops an integrated modelto assess solar photovoltaic potentials and their cost competi-tiveness throughout 2020 to 2060 considering multiple spa-tiotemporal factors. We find that the cost competitiveness ofsolar power allows for pairing with storage capacity to supply7.2 PWh of grid-compatible electricity, meeting 43.2% of Chi-na’s demand in 2060 at a price lower than 2.5 US cents/kWh.
Author contributions: X.L., S.C., M.B.M., and J.H. designed research; X.L. and S.C. per-formed research; X.L., S.C., C.Z., J.L., H.X., Y.W., S.W., F.S., C.W. and K.H. contributednew analytic tools; X.L., S.C., and C.P.N. analyzed data; and X.L., S.C., C.P.N., M.B.M.,and J.H. wrote the paper.
The authors declare no competing interest.
This article is a PNAS Direct Submission. G.L. is a guest editor invited by theEditorial Board.
This open access article is distributed under Creative Commons Attribution-NonCommercial-NoDerivatives License 4.0 (CC BY-NC-ND).
See online for related content such as Commentaries.1X.L. and S.C. contributed equally to this work.2To whom correspondence may be addressed. Email: [email protected] or [email protected].
This article contains supporting information online at https://www.pnas.org/lookup/suppl/doi:10.1073/pnas.2103471118/-/DCSupplemental.
Published October 11, 2021.
PNAS 2021 Vol. 118 No. 42 e2103471118 https://doi.org/10.1073/pnas.2103471118 | 1 of 8
SUST
AINABILITY
SCIENCE
ENVIRONMEN
TAL
SCIENCE
S
Dow
nloa
ded
by g
uest
on
Nov
embe
r 25
, 202
1
The rocketing growth of solar PV in China started with the in-troduction in 2011 of a nationwide incentive policy of feed-intariffs (14). With its total installed capacity of solar PV surpassingthat of the United States in 2013 and Germany in 2015 (15, 16),China has maintained its leading global position in terms of not onlythe deployment of solar power but also the manufacture of PVmodules. With addition of 48.2 GW in 2020, China’s installedcapacity of solar PV rose to 253.4 GW (12), far ahead of a target of105 GW set for 2020 in the 13th 5-y plan (17).The large-scale installation of solar power both globally and in
China has promoted improvements in PV conversion efficienciesand reductions in generation costs. Capital costs of utility-scalesolar PV per kW fell by 63.3% between 2011 and 2018 in China,accompanied by a number of downward adjustments in the levelsof subsidies (18). With the advantage of the lowered cost, solar isexpected to play a key role in the future power system. Previousstudies have discussed the economic competitiveness of solarpower in China at city or provincial levels, but these analyseseither were static snapshots of the solar industry in individual orseveral discrete years or failed to capture the spatial differencesacross the nation (19–21). From a power-system perspective, manylarge-scale simulations for China have projected the solar PVcapacity shares in the future (22–24). However, the role of solarPV in future energy systems is often underestimated with highcapital cost assumptions, which did not fully reflect the recent costdecline trend of the solar PV (25–27). The stepwise deploymentof large-scale solar capacity (23, 28, 29) requires in-depth re-search of the spatiotemporal characteristics of solar potentialsfrom technical and economic perspectives. In addition, the costreduction of solar power, and similar trends in storage technol-ogies like lithium-ion batteries (28), brings an opportunity tointegrate storage systems into solar power stations. Such com-bined systems would be able not only to generate cost-competitiveelectricity but also bring additional benefits to balance solar var-iability and better meet demand. According to the 2019 to 2020Energy Storage Action Plan jointly issued by the National EnergyAdministration and three other related ministries in China (30),the application of energy storage technology will be promoted incoordination with utility-scale renewable power generation. Andprovinces including Shandong, Shanxi, Xinjiang, Henan, and InnerMongolia have explicitly required newly built solar power stationsto pair with storage capacity (31). For a dynamic and quantitativeunderstanding of these prospects, it is imperative to know preciselywhen, where, and to what extent subsidy-free solar PV power plus
storage may be not only technically feasible and cost competitivebut also grid compatible.In this study, we developed an integrated technical, economic,
and grid-compatible solar resource assessment model to analyzethe spatial distribution and temporal evolution of the cost com-petitiveness of utility-scale solar power and its viable grid pene-tration potential in China from 2020 to 2060. Solar radiation andtemperature data were derived from the Goddard Earth Observ-ing System Forward Processing Version 5 (GEOS-5 FP) of theData Assimilation System with a spatial resolution of 0.25° latitudeby 0.3125° longitude and a temporal resolution of 1 h (32). Thestudy adopted the assimilation data for a continuous 6-y intervalfrom 2014 to 2019 to generate hourly technical potentials thataccount for the interannual variability of solar radiation andtemperature, with spatial distribution calibrated by the long-termyearly average data from Global Solar Atlas (33). The technicalpotential of utility-scale solar PV was evaluated with considerationof multiple factors including resource endowment, topographicaland land-use constraints, latitude-dependent PV configurations,and time-varying efficiency factors, following the approach de-scribed by Chen et al. (34). Building on this, the prices and thedynamic cost-competitive parity potential of solar PV power weremodeled spatially across China over the study period tuned withthe up-to-date economic parameters. In addition, the grid pene-tration potentials of the solar-plus-storage systems were furtherquantified spatiotemporally for China through the integration ofthe techno-economic model and an hourly power dispatch model.
ResultsTechnical Potential.The total annual technical potential of solar PVgeneration is estimated to be as high as 99.2 PWh in 2020,equivalent to ∼13.2 times the electricity demand for China in thesame year, and corresponding to a potential generating capacity of64.3 TW. The capacity factor of this potential, that is, the pro-jected unit electricity output divided by the nameplate maximumoutput, is estimated to be 17.6% on average. The generatingpotential is estimated to increase to 118.2 PWh in 2030 and 146.1PWh in 2060, responding to improvements in conversion effi-ciency and system performance. With an increasingly importantrole for electricity in meeting future growth in energy end uses,electricity demand in China is projected to grow to 16.7 PWh in2060, more than doubling the demand in 2018 (35). Should 50%of the incremental demand for electricity in 2060 relative to 2020be met by solar PV power, it would require roughly 2,871 GW of
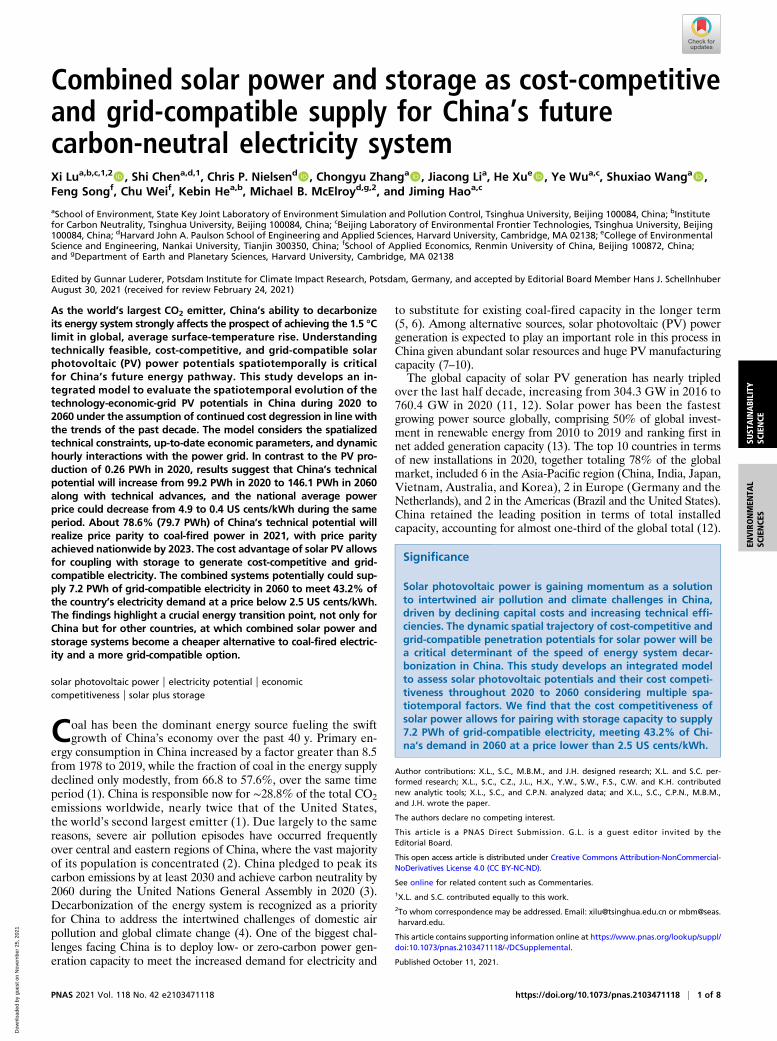
Fig. 1. Distribution of technical potentials of utility-scale solar PV of China in 2020. (A) Distribution of capacity factors by grid cell. (B) Distribution of po-tential capacity expressed in megawatts per square kilometer.
2 of 8 | PNAS Lu et al.https://doi.org/10.1073/pnas.2103471118 Combined solar power and storage as cost-competitive and grid-compatible supply for
China’s future carbon-neutral electricity system
Dow
nloa
ded
by g
uest
on
Nov
embe
r 25
, 202
1
installed capacity assuming the national average capacity factor,accounting for 4.5% of the total technical potential capacity in2020. There is great variation in regional solar generating poten-tial reflecting multiple influences, including solar resources, landavailability, and latitude-dependent installation densities. The so-lar PV potentials of Tibet and the three northern power grids in2020, including the Northwest, North China, and Northeast grids,exceed their respective total regional generation by more than afactor of 12 (reference SI Appendix, Fig. S1 for the grid and pro-vincial potential distribution). By contrast, the potential of solar PVto serve power demand in southern power grids is relatively low,especially for the East China grid, which accounts for 20.7% ofnational electricity demand, 18.9% of the population, and 27.5%of gross domestic product. The capacity factors and potential ca-pacity show similar spatial distributions (Fig. 1 A and B), whichindicate that the regions with larger available areas and installationdensities per unit land area also tend to have greater solar re-sources. The top five provinces with the highest potential capacitiesinclude Xinjiang, Inner Mongolia, Tibet, Qinghai, and Gansu, eachwith a potential capacity higher than 3.6 TW. The total potentialcapacity of these provinces reaches 54.9 TW in 2020, accountingfor 85.4% of the national potential capacity. The regions with thehighest capacity factors are concentrated in the Qinghai-TibetPlateau, Gansu, Ningxia, and Inner Mongolia, in contrast to thelowest capacity factors, in southeast China.A large share of the early development of solar power in China
occurred in the above-mentioned favorable areas. For example,the newly installed capacities of Xinjiang and Gansu, two north-western provinces, alone accounted for 50.8% of the national totalin 2013 (36). Solar power stations in these provinces suffer fromhigh curtailment rates due primarily to short-term overcapacityrelative to local electric power demand. The curtailment rates inXinjiang and Gansu reached as high as 32.2 and 30.5%, respec-tively, in 2016 (37). In contrast, solar PV power initially developedslowly in China’s central and eastern regions. Driven by a com-bination of limited capacity to integrate variable solar power intothe local power systems of the western region and air pollutioncontrol policies that increasingly constrain coal use in easternChina, there has been an evident west-to-east shift of solar PV
development in China. By the end of 2020, the share of nationalsolar PV capacity installed in the Northwest grid had declined to24%, while the share in the East China and Central China gridshad increased to 19 and 13%, respectively (38).
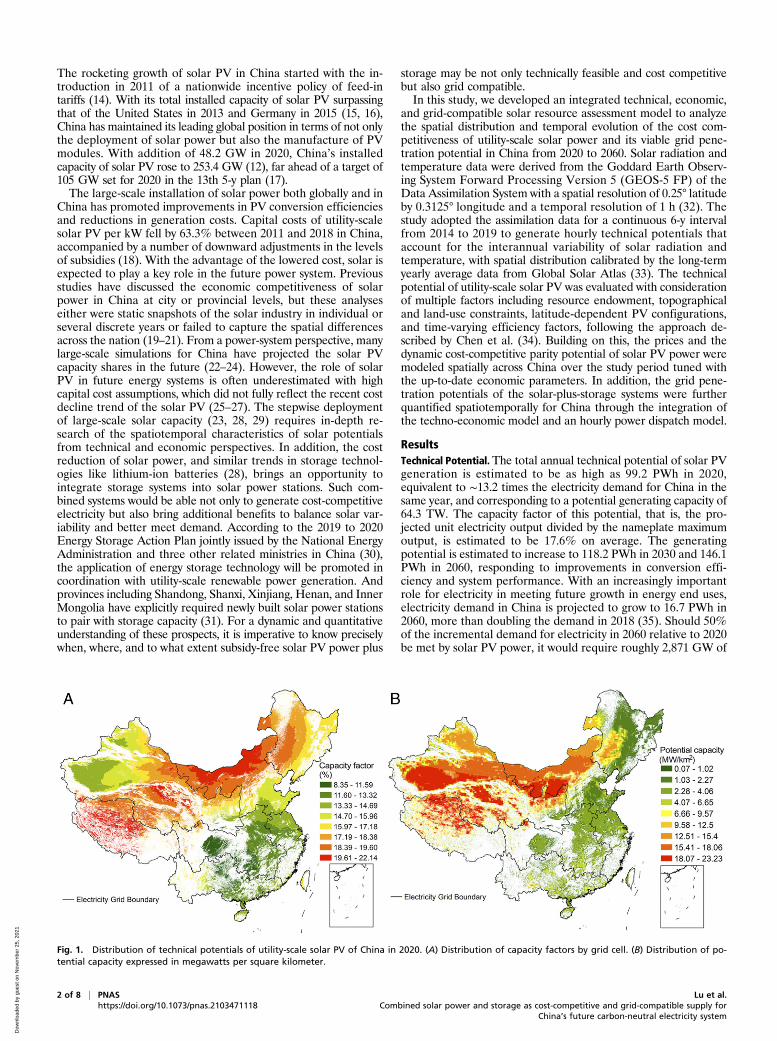
Economic Parity Potential. Bus-bar prices denote the lowest powerselling prices acceptable for solar power stations under reasonableexpectations for profit (Materials and Methods). The geographicdistribution of calculated solar bus-bar prices for 2020 features lowvalues in the west and north and high values in the east and south(Fig. 2A). The arithmetic national average bus-bar price in Chinais 0.34 CNY(Chinese yuan)/kWh (4.93 US cents/kWh, expressedin 2019 currency, the same below), with the Tibet grid displayingthe lowest bus-bar price across the country at 0.29 CNY/kWh(4.20 US cents/kWh) and Central China the highest, averaging0.43 CNY/kWh (6.23 US cents/kWh). And the population-weighted national average bus-bar price in the same year reaches0.40 CNY/kWh (5.80 US cents/kWh) due to the mismatch of solarresource and population distribution (reference SI Appendix, Fig.S2 for national average price from 2020 to 2060). Fig. 2B furthershows the distribution of economic potentials varying with thebus-bar price for each regional grid in 2020. There is greater totaleconomic potential at given bus-bar prices in low-priced regionsdue to the greater areal share of resource-favorable conditions. Thelow-priced potential is concentrated in the Tibet and Northwestgrids, reflecting the higher capacity factors of solar power in theseresource-abundant regions. The bimodal distribution for theNorthwest reflects the differential solar resources of Qinghai(located mainly on the Tibetan Plateau) versus other northwestprovinces. High-priced potentials are seen in the East China,South China, and Central China grids, where the solar radiationresource is inferior to that in the inland regions.The temporal evolution of spatial cost competitiveness between
solar and coal is shown in Fig. 3. Supply curves in Fig. 3A show thetemporal evolution of the relationship between electricity pricesand the corresponding economically viable solar potential. Thecurves move downward from 2020 to 2060 due primarily to therapidly decreasing costs of capital driven by the reduced costs ofPV modules, balance of system (BOS), and operation and main-tenance (O&M), along with an improvement in efficiencies for
Fig. 2. Spatial distribution of the solar power price and economic potential in China. (A) Distribution of the utility-scale solar bus-bar prices in 2020. All bus-bar prices in the study are expressed in 2019 CNY and US cents according to the 2019 exchange rate of 6.9:1 (CNY:USD). (B) Distribution of solar potentials bybus-bar price in 2020. The color and height of the bars indicate the source grids of the solar potential and the amounts of available economic potential,respectively.
Lu et al. PNAS | 3 of 8Combined solar power and storage as cost-competitive and grid-compatible supply forChina’s future carbon-neutral electricity system
https://doi.org/10.1073/pnas.2103471118
SUST
AINABILITY
SCIENCE
ENVIRONMEN
TAL
SCIENCE
S
Dow
nloa
ded
by g
uest
on
Nov
embe
r 25
, 202
1
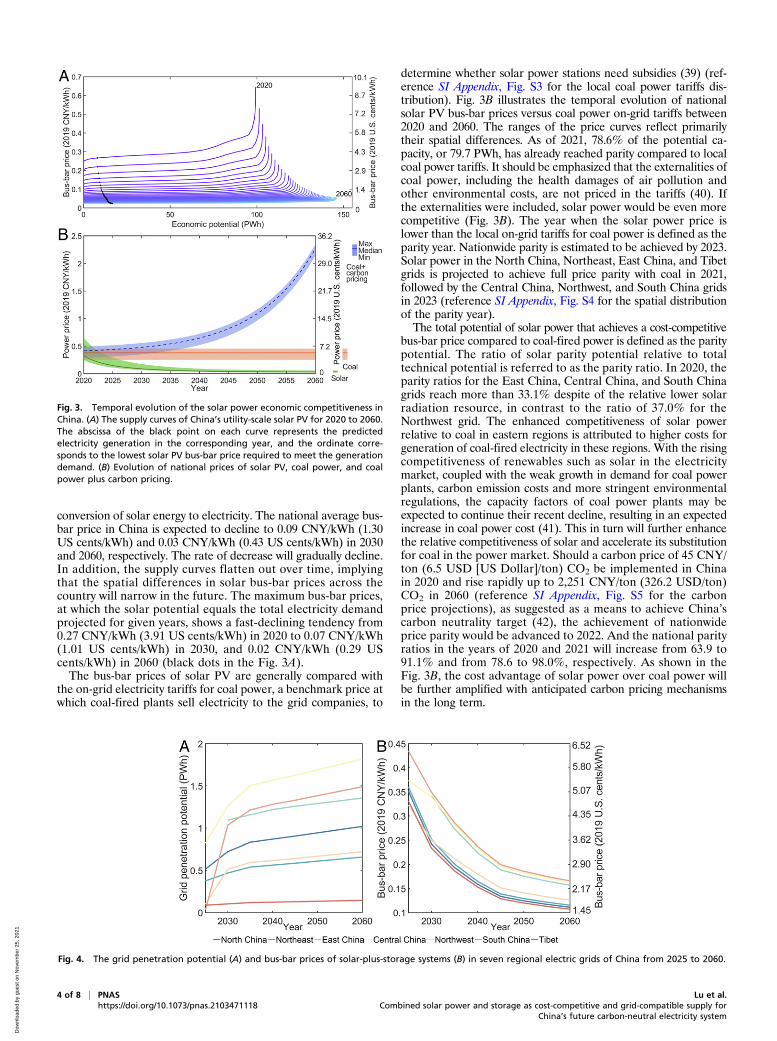
conversion of solar energy to electricity. The national average bus-bar price in China is expected to decline to 0.09 CNY/kWh (1.30US cents/kWh) and 0.03 CNY/kWh (0.43 US cents/kWh) in 2030and 2060, respectively. The rate of decrease will gradually decline.In addition, the supply curves flatten out over time, implyingthat the spatial differences in solar bus-bar prices across thecountry will narrow in the future. The maximum bus-bar prices,at which the solar potential equals the total electricity demandprojected for given years, shows a fast-declining tendency from0.27 CNY/kWh (3.91 US cents/kWh) in 2020 to 0.07 CNY/kWh(1.01 US cents/kWh) in 2030, and 0.02 CNY/kWh (0.29 UScents/kWh) in 2060 (black dots in the Fig. 3A).The bus-bar prices of solar PV are generally compared with
the on-grid electricity tariffs for coal power, a benchmark price atwhich coal-fired plants sell electricity to the grid companies, to
determine whether solar power stations need subsidies (39) (ref-erence SI Appendix, Fig. S3 for the local coal power tariffs dis-tribution). Fig. 3B illustrates the temporal evolution of nationalsolar PV bus-bar prices versus coal power on-grid tariffs between2020 and 2060. The ranges of the price curves reflect primarilytheir spatial differences. As of 2021, 78.6% of the potential ca-pacity, or 79.7 PWh, has already reached parity compared to localcoal power tariffs. It should be emphasized that the externalities ofcoal power, including the health damages of air pollution andother environmental costs, are not priced in the tariffs (40). Ifthe externalities were included, solar power would be even morecompetitive (Fig. 3B). The year when the solar power price islower than the local on-grid tariffs for coal power is defined as theparity year. Nationwide parity is estimated to be achieved by 2023.Solar power in the North China, Northeast, East China, and Tibetgrids is projected to achieve full price parity with coal in 2021,followed by the Central China, Northwest, and South China gridsin 2023 (reference SI Appendix, Fig. S4 for the spatial distributionof the parity year).The total potential of solar power that achieves a cost-competitive
bus-bar price compared to coal-fired power is defined as the paritypotential. The ratio of solar parity potential relative to totaltechnical potential is referred to as the parity ratio. In 2020, theparity ratios for the East China, Central China, and South Chinagrids reach more than 33.1% despite of the relative lower solarradiation resource, in contrast to the ratio of 37.0% for theNorthwest grid. The enhanced competitiveness of solar powerrelative to coal in eastern regions is attributed to higher costs forgeneration of coal-fired electricity in these regions. With the risingcompetitiveness of renewables such as solar in the electricitymarket, coupled with the weak growth in demand for coal powerplants, carbon emission costs and more stringent environmentalregulations, the capacity factors of coal power plants may beexpected to continue their recent decline, resulting in an expectedincrease in coal power cost (41). This in turn will further enhancethe relative competitiveness of solar and accelerate its substitutionfor coal in the power market. Should a carbon price of 45 CNY/ton (6.5 USD [US Dollar]/ton) CO2 be implemented in Chinain 2020 and rise rapidly up to 2,251 CNY/ton (326.2 USD/ton)CO2 in 2060 (reference SI Appendix, Fig. S5 for the carbonprice projections), as suggested as a means to achieve China’scarbon neutrality target (42), the achievement of nationwideprice parity would be advanced to 2022. And the national parityratios in the years of 2020 and 2021 will increase from 63.9 to91.1% and from 78.6 to 98.0%, respectively. As shown in theFig. 3B, the cost advantage of solar power over coal power willbe further amplified with anticipated carbon pricing mechanismsin the long term.
Fig. 3. Temporal evolution of the solar power economic competitiveness inChina. (A) The supply curves of China’s utility-scale solar PV for 2020 to 2060.The abscissa of the black point on each curve represents the predictedelectricity generation in the corresponding year, and the ordinate corre-sponds to the lowest solar PV bus-bar price required to meet the generationdemand. (B) Evolution of national prices of solar PV, coal power, and coalpower plus carbon pricing.
Fig. 4. The grid penetration potential (A) and bus-bar prices of solar-plus-storage systems (B) in seven regional electric grids of China from 2025 to 2060.
4 of 8 | PNAS Lu et al.https://doi.org/10.1073/pnas.2103471118 Combined solar power and storage as cost-competitive and grid-compatible supply for
China’s future carbon-neutral electricity system
Dow
nloa
ded
by g
uest
on
Nov
embe
r 25
, 202
1
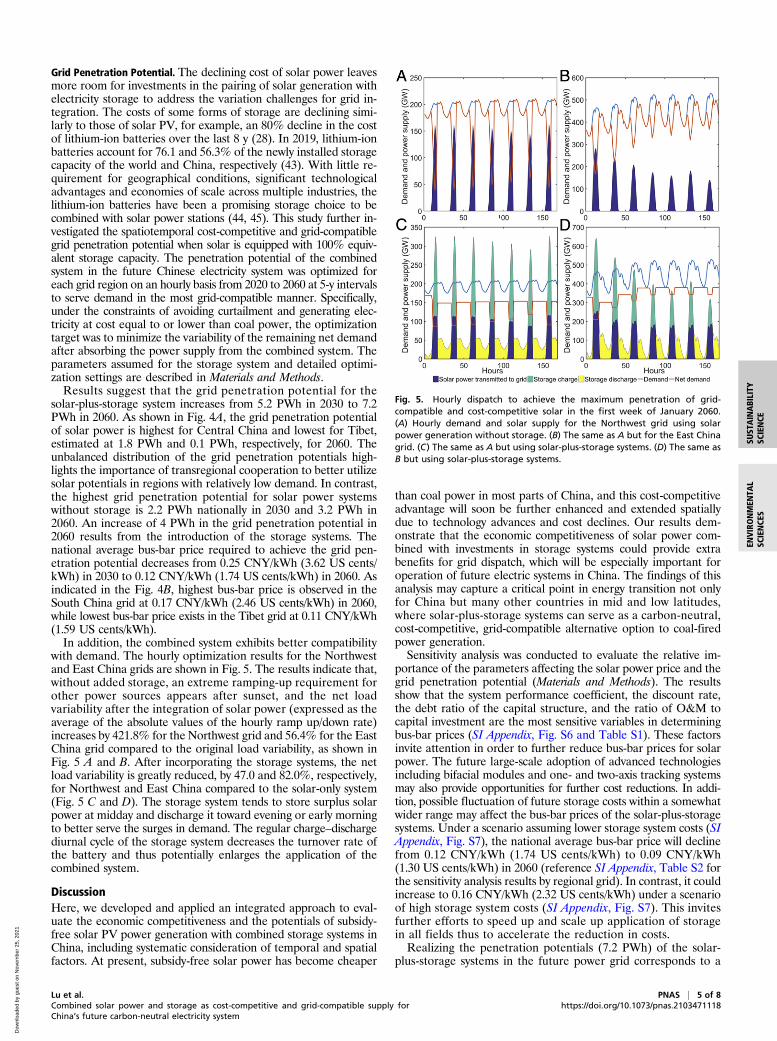
Grid Penetration Potential. The declining cost of solar power leavesmore room for investments in the pairing of solar generation withelectricity storage to address the variation challenges for grid in-tegration. The costs of some forms of storage are declining simi-larly to those of solar PV, for example, an 80% decline in the costof lithium-ion batteries over the last 8 y (28). In 2019, lithium-ionbatteries account for 76.1 and 56.3% of the newly installed storagecapacity of the world and China, respectively (43). With little re-quirement for geographical conditions, significant technologicaladvantages and economies of scale across multiple industries, thelithium-ion batteries have been a promising storage choice to becombined with solar power stations (44, 45). This study further in-vestigated the spatiotemporal cost-competitive and grid-compatiblegrid penetration potential when solar is equipped with 100% equiv-alent storage capacity. The penetration potential of the combinedsystem in the future Chinese electricity system was optimized foreach grid region on an hourly basis from 2020 to 2060 at 5-y intervalsto serve demand in the most grid-compatible manner. Specifically,under the constraints of avoiding curtailment and generating elec-tricity at cost equal to or lower than coal power, the optimizationtarget was to minimize the variability of the remaining net demandafter absorbing the power supply from the combined system. Theparameters assumed for the storage system and detailed optimi-zation settings are described in Materials and Methods.Results suggest that the grid penetration potential for the
solar-plus-storage system increases from 5.2 PWh in 2030 to 7.2PWh in 2060. As shown in Fig. 4A, the grid penetration potentialof solar power is highest for Central China and lowest for Tibet,estimated at 1.8 PWh and 0.1 PWh, respectively, for 2060. Theunbalanced distribution of the grid penetration potentials high-lights the importance of transregional cooperation to better utilizesolar potentials in regions with relatively low demand. In contrast,the highest grid penetration potential for solar power systemswithout storage is 2.2 PWh nationally in 2030 and 3.2 PWh in2060. An increase of 4 PWh in the grid penetration potential in2060 results from the introduction of the storage systems. Thenational average bus-bar price required to achieve the grid pen-etration potential decreases from 0.25 CNY/kWh (3.62 US cents/kWh) in 2030 to 0.12 CNY/kWh (1.74 US cents/kWh) in 2060. Asindicated in the Fig. 4B, highest bus-bar price is observed in theSouth China grid at 0.17 CNY/kWh (2.46 US cents/kWh) in 2060,while lowest bus-bar price exists in the Tibet grid at 0.11 CNY/kWh(1.59 US cents/kWh).In addition, the combined system exhibits better compatibility
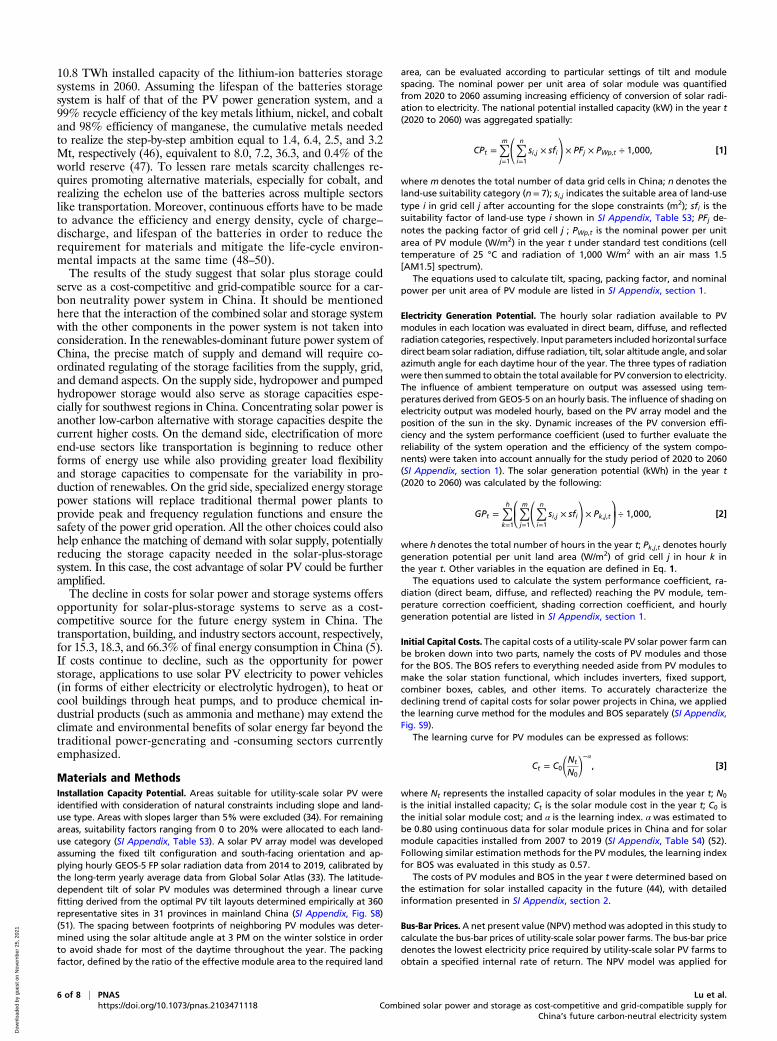
with demand. The hourly optimization results for the Northwestand East China grids are shown in Fig. 5. The results indicate that,without added storage, an extreme ramping-up requirement forother power sources appears after sunset, and the net loadvariability after the integration of solar power (expressed as theaverage of the absolute values of the hourly ramp up/down rate)increases by 421.8% for the Northwest grid and 56.4% for the EastChina grid compared to the original load variability, as shown inFig. 5 A and B. After incorporating the storage systems, the netload variability is greatly reduced, by 47.0 and 82.0%, respectively,for Northwest and East China compared to the solar-only system(Fig. 5 C and D). The storage system tends to store surplus solarpower at midday and discharge it toward evening or early morningto better serve the surges in demand. The regular charge–dischargediurnal cycle of the storage system decreases the turnover rate ofthe battery and thus potentially enlarges the application of thecombined system.
DiscussionHere, we developed and applied an integrated approach to eval-uate the economic competitiveness and the potentials of subsidy-free solar PV power generation with combined storage systems inChina, including systematic consideration of temporal and spatialfactors. At present, subsidy-free solar power has become cheaper
than coal power in most parts of China, and this cost-competitiveadvantage will soon be further enhanced and extended spatiallydue to technology advances and cost declines. Our results dem-onstrate that the economic competitiveness of solar power com-bined with investments in storage systems could provide extrabenefits for grid dispatch, which will be especially important foroperation of future electric systems in China. The findings of thisanalysis may capture a critical point in energy transition not onlyfor China but many other countries in mid and low latitudes,where solar-plus-storage systems can serve as a carbon-neutral,cost-competitive, grid-compatible alternative option to coal-firedpower generation.Sensitivity analysis was conducted to evaluate the relative im-
portance of the parameters affecting the solar power price and thegrid penetration potential (Materials and Methods). The resultsshow that the system performance coefficient, the discount rate,the debt ratio of the capital structure, and the ratio of O&M tocapital investment are the most sensitive variables in determiningbus-bar prices (SI Appendix, Fig. S6 and Table S1). These factorsinvite attention in order to further reduce bus-bar prices for solarpower. The future large-scale adoption of advanced technologiesincluding bifacial modules and one- and two-axis tracking systemsmay also provide opportunities for further cost reductions. In addi-tion, possible fluctuation of future storage costs within a somewhatwider range may affect the bus-bar prices of the solar-plus-storagesystems. Under a scenario assuming lower storage system costs (SIAppendix, Fig. S7), the national average bus-bar price will declinefrom 0.12 CNY/kWh (1.74 US cents/kWh) to 0.09 CNY/kWh(1.30 US cents/kWh) in 2060 (reference SI Appendix, Table S2 forthe sensitivity analysis results by regional grid). In contrast, it couldincrease to 0.16 CNY/kWh (2.32 US cents/kWh) under a scenarioof high storage system costs (SI Appendix, Fig. S7). This invitesfurther efforts to speed up and scale up application of storagein all fields thus to accelerate the reduction in costs.Realizing the penetration potentials (7.2 PWh) of the solar-
plus-storage systems in the future power grid corresponds to a
Fig. 5. Hourly dispatch to achieve the maximum penetration of grid-compatible and cost-competitive solar in the first week of January 2060.(A) Hourly demand and solar supply for the Northwest grid using solarpower generation without storage. (B) The same as A but for the East Chinagrid. (C) The same as A but using solar-plus-storage systems. (D) The same asB but using solar-plus-storage systems.
Lu et al. PNAS | 5 of 8Combined solar power and storage as cost-competitive and grid-compatible supply forChina’s future carbon-neutral electricity system
https://doi.org/10.1073/pnas.2103471118
SUST
AINABILITY
SCIENCE
ENVIRONMEN
TAL
SCIENCE
S
Dow
nloa
ded
by g
uest
on
Nov
embe
r 25
, 202
1
10.8 TWh installed capacity of the lithium-ion batteries storagesystems in 2060. Assuming the lifespan of the batteries storagesystem is half of that of the PV power generation system, and a99% recycle efficiency of the key metals lithium, nickel, and cobaltand 98% efficiency of manganese, the cumulative metals neededto realize the step-by-step ambition equal to 1.4, 6.4, 2.5, and 3.2Mt, respectively (46), equivalent to 8.0, 7.2, 36.3, and 0.4% of theworld reserve (47). To lessen rare metals scarcity challenges re-quires promoting alternative materials, especially for cobalt, andrealizing the echelon use of the batteries across multiple sectorslike transportation. Moreover, continuous efforts have to be madeto advance the efficiency and energy density, cycle of charge–discharge, and lifespan of the batteries in order to reduce therequirement for materials and mitigate the life-cycle environ-mental impacts at the same time (48–50).The results of the study suggest that solar plus storage could
serve as a cost-competitive and grid-compatible source for a car-bon neutrality power system in China. It should be mentionedhere that the interaction of the combined solar and storage systemwith the other components in the power system is not taken intoconsideration. In the renewables-dominant future power system ofChina, the precise match of supply and demand will require co-ordinated regulating of the storage facilities from the supply, grid,and demand aspects. On the supply side, hydropower and pumpedhydropower storage would also serve as storage capacities espe-cially for southwest regions in China. Concentrating solar power isanother low-carbon alternative with storage capacities despite thecurrent higher costs. On the demand side, electrification of moreend-use sectors like transportation is beginning to reduce otherforms of energy use while also providing greater load flexibilityand storage capacities to compensate for the variability in pro-duction of renewables. On the grid side, specialized energy storagepower stations will replace traditional thermal power plants toprovide peak and frequency regulation functions and ensure thesafety of the power grid operation. All the other choices could alsohelp enhance the matching of demand with solar supply, potentiallyreducing the storage capacity needed in the solar-plus-storagesystem. In this case, the cost advantage of solar PV could be furtheramplified.The decline in costs for solar power and storage systems offers
opportunity for solar-plus-storage systems to serve as a cost-competitive source for the future energy system in China. Thetransportation, building, and industry sectors account, respectively,for 15.3, 18.3, and 66.3% of final energy consumption in China (5).If costs continue to decline, such as the opportunity for powerstorage, applications to use solar PV electricity to power vehicles(in forms of either electricity or electrolytic hydrogen), to heat orcool buildings through heat pumps, and to produce chemical in-dustrial products (such as ammonia and methane) may extend theclimate and environmental benefits of solar energy far beyond thetraditional power-generating and -consuming sectors currentlyemphasized.
Materials and MethodsInstallation Capacity Potential. Areas suitable for utility-scale solar PV wereidentified with consideration of natural constraints including slope and land-use type. Areas with slopes larger than 5% were excluded (34). For remainingareas, suitability factors ranging from 0 to 20% were allocated to each land-use category (SI Appendix, Table S3). A solar PV array model was developedassuming the fixed tilt configuration and south-facing orientation and ap-plying hourly GEOS-5 FP solar radiation data from 2014 to 2019, calibrated bythe long-term yearly average data from Global Solar Atlas (33). The latitude-dependent tilt of solar PV modules was determined through a linear curvefitting derived from the optimal PV tilt layouts determined empirically at 360representative sites in 31 provinces in mainland China (SI Appendix, Fig. S8)(51). The spacing between footprints of neighboring PV modules was deter-mined using the solar altitude angle at 3 PM on the winter solstice in orderto avoid shade for most of the daytime throughout the year. The packingfactor, defined by the ratio of the effective module area to the required land
area, can be evaluated according to particular settings of tilt and modulespacing. The nominal power per unit area of solar module was quantifiedfrom 2020 to 2060 assuming increasing efficiency of conversion of solar radi-ation to electricity. The national potential installed capacity (kW) in the year t(2020 to 2060) was aggregated spatially:
CPt = ∑mj=1
(∑ni=1
si,j × sfi) × PFj × PWp,t ÷ 1,000, [1]
where m denotes the total number of data grid cells in China; n denotes theland-use suitability category (n= 7); si,j indicates the suitable area of land-usetype i in grid cell j after accounting for the slope constraints (m2); sfi is thesuitability factor of land-use type i shown in SI Appendix, Table S3; PFj de-notes the packing factor of grid cell j ; PWp,t is the nominal power per unitarea of PV module (W/m2) in the year t under standard test conditions (celltemperature of 25 °C and radiation of 1,000 W/m2 with an air mass 1.5[AM1.5] spectrum).
The equations used to calculate tilt, spacing, packing factor, and nominalpower per unit area of PV module are listed in SI Appendix, section 1.
Electricity Generation Potential. The hourly solar radiation available to PVmodules in each location was evaluated in direct beam, diffuse, and reflectedradiation categories, respectively. Input parameters included horizontal surfacedirect beam solar radiation, diffuse radiation, tilt, solar altitude angle, and solarazimuth angle for each daytime hour of the year. The three types of radiationwere then summed to obtain the total available for PV conversion to electricity.The influence of ambient temperature on output was assessed using tem-peratures derived from GEOS-5 on an hourly basis. The influence of shading onelectricity output was modeled hourly, based on the PV array model and theposition of the sun in the sky. Dynamic increases of the PV conversion effi-ciency and the system performance coefficient (used to further evaluate thereliability of the system operation and the efficiency of the system compo-nents) were taken into account annually for the study period of 2020 to 2060(SI Appendix, section 1). The solar generation potential (kWh) in the year t(2020 to 2060) was calculated by the following:
GPt = ∑hk=1
⎛⎜⎜⎜⎜⎜⎝∑mj=1
(∑ni=1
si,j × sfi) × Pk,j,t
⎞⎟⎟⎟⎟⎟⎠ ÷ 1,000, [2]
where h denotes the total number of hours in the year t; Pk,j,t denotes hourlygeneration potential per unit land area (W/m2) of grid cell j in hour k inthe year t. Other variables in the equation are defined in Eq. 1.
The equations used to calculate the system performance coefficient, ra-diation (direct beam, diffuse, and reflected) reaching the PV module, tem-perature correction coefficient, shading correction coefficient, and hourlygeneration potential are listed in SI Appendix, section 1.
Initial Capital Costs. The capital costs of a utility-scale PV solar power farm canbe broken down into two parts, namely the costs of PV modules and thosefor the BOS. The BOS refers to everything needed aside from PV modules tomake the solar station functional, which includes inverters, fixed support,combiner boxes, cables, and other items. To accurately characterize thedeclining trend of capital costs for solar power projects in China, we appliedthe learning curve method for the modules and BOS separately (SI Appendix,Fig. S9).
The learning curve for PV modules can be expressed as follows:
Ct = C0(Nt
N0)−α, [3]
where Nt represents the installed capacity of solar modules in the year t; N0
is the initial installed capacity; Ct is the solar module cost in the year t; C0 isthe initial solar module cost; and α is the learning index. α was estimated tobe 0.80 using continuous data for solar module prices in China and for solarmodule capacities installed from 2007 to 2019 (SI Appendix, Table S4) (52).Following similar estimation methods for the PV modules, the learning indexfor BOS was evaluated in this study as 0.57.
The costs of PV modules and BOS in the year t were determined based onthe estimation for solar installed capacity in the future (44), with detailedinformation presented in SI Appendix, section 2.
Bus-Bar Prices.A net present value (NPV) method was adopted in this study tocalculate the bus-bar prices of utility-scale solar power farms. The bus-bar pricedenotes the lowest electricity price required by utility-scale solar PV farms toobtain a specified internal rate of return. The NPV model was applied for
6 of 8 | PNAS Lu et al.https://doi.org/10.1073/pnas.2103471118 Combined solar power and storage as cost-competitive and grid-compatible supply for
China’s future carbon-neutral electricity system
Dow
nloa
ded
by g
uest
on
Nov
embe
r 25
, 202
1
each grid cell from 2020 to 2060 to generate a dynamic spatial distributionof bus-bar prices. Cash flows for each year were discounted to the beginningof the construction year at a given discount rate and added to yield the NPV.The bus-bar price was the electricity price under the condition at which NPVequals zero.
Specifically, the NPV can be expressed as follows:
NPV = ∑nt=0
CFt1 + rd( )t , [4]
where CFt refers to the cash flow in year t; n is the lifetime of the utility-scalesolar PV project (n = 26); rd refers to discount rate; and t = 0 represents theconstruction period. Ct can be calculated by the following:
CFt = Rt + Lt − KCt + RVt − LPt −OMt − Tt , [5]
where Rt refers to annual revenue, Lt refers to inflow of loan funds, RVt
refers to residual value of fixed assets, KCt refers to initial capital costs (SIAppendix, Fig. S9), LPt refers to repayment of the loan and interest, OMt
refers to costs of O&M, and Tt denotes payment of taxes.The setting of parameters for the economic model was based on a survey
on solar PV projects in Shanxi, Hebei, and Inner Mongolia in China (SI Ap-pendix, Table S5). The construction period was assumed to be one year andthe operational period 25 y. The debt ratio of the capital structure was as-sumed to be 70%. The loan funds and the interest during the constructionperiod were repaid based on an equivalent annuity over the first 15 y ofoperations. The interest during the construction period was selected here as1% of the total capital expenditures. The decrease of PV module efficiencydue to natural degradation with prolonged usage was assumed at 3% in thefirst operational year and 0.7% for the following operational years. Theresidual values were assumed to be 5% of the fixed assets with linear de-preciation. The annual interest rate was assumed to be 5.5%. The discountrate was assumed to be 8%. The rates for value-added tax, enterprise in-come tax, and combined sales tax and extra charges were assumed be 17, 25,and 11%, respectively. The annual O&M cost per watt was assumed to be 1%of the total capital expenditures per watt (19). The equations used to cal-culate the cash flow are included in SI Appendix, section 2.
Solar-Plus-Storage Dispatch Model. The storage system is assumed to be in-tegrated with the solar power station and will be replaced once in the middleof the operational lifespan of the power station. The power generation andstorage capacity potential data used in the grid optimization model wereaggregated from the grid cell to the regional power grid level with theconstraints that the bus-bar price of the combined solar and storage systemis equal to or lower than the coal power price. The calculation of the bus-barprice of the combined system is shown in Eq. 4, with the capital cost of thestorage capacities included in the initial capital cost.
In the grid optimization model, the main decision variables include thefollowing: hourly solar power generation directly connected to the grid P;hourly battery charge Pc; hourly battery discharge Pd; and hourly state ofcharge of the battery SOC, which are constrained by the equations below:
SOC ≥ SOCmin, [6]
SOC ≤ SOCmax , [7]
SOClth = SOC0, [8]
Pc,k ≥ 0, [9]
Pc,k ≤ Pr × Sk , [10]
Pd,k ≥ 0, [11]
Pd,k ≤ Pr × (1 − Sk), [12]
0 ≤ Pk ≤ GPk , [13]
Pc,k + Pk = GPk , [14]
Pd,k + Pk ≤ Lk , [15]
SOC1 = SOC0 + Pc,1 × ec − Pd,1/ed, [16]
SOCk = SOCk−1 + Pc,k × ec − Pd,k/ed (k ≥ 2), [17]
where SOCmin and SOCmax denote the minimum and maximum states ofcharge, equal to 20 and 100% of the potential storage capacity in the unit ofkWh, respectively; SOClth denotes the state of charge at the end of themodeling cycle; SOC0 the state of charge at the beginning of the cycle; Pr isthe nominal power rating of the storage facilities in the unit of kW, and theduration time is 2 h in the analysis; GPk the solar power generation in thehour k;Lk the load in the hour k; Sk is a binary variable indicating if thestorage capacity is charged (Sk = 1) or discharged (Sk = 0); ec the efficiencyof charge (95%); and ed the efficiency of discharge (95%). The solar capacityand grid penetration potentials were optimized to realize the highest gridcompatibility on an hourly basis. The optimization object of minimizing thenet load variability was used to investigate the grid penetration potential ofsolar-plus-storage system to best serve demand, and the objective functionwas defined as the sum of the square of the net loads:
min∑(Lk − Pk − Pd,k)2. [18]
Sensitivity Analysis. We applied Monte Carlo methods to evaluate the sen-sitivity of bus-bar prices in 2020 to key parameters, including learning ratesfor solar modules and BOS, O&M costs, annual interest rate, debt ratio of thecapital structure, discount rate, and system performance coefficient. A uni-form or normal distribution was selected for all of the above parameters aslisted in SI Appendix, Table S1. The analysis was based on a grid cell withannual potential electricity generation of 459.1 GWh and potential capacityof 303.6 MW in 2020. The simulation was run 10,000 times. In addition, theimpact of storage cost on the bus-bar prices of the combined systems wasmodeled under another two scenarios, one low cost (SI Appendix, Fig. S7)and one high cost (SI Appendix, Fig. S7). The results are shown in SI Ap-pendix, Table S2.
Data Availability. All study data are included in the article and SI Appendix.
ACKNOWLEDGMENTS. This work was supported by the National NaturalScience Foundation of China (Grants 72025401, 71974108, and 71690244),China Postdoctoral Science Foundation Grant BX2021148, Shuimu TsinghuaScholar Program 2021SM014, the Tsinghua University-Inditex SustainableDevelopment Fund, and grants from the Office of the President of HarvardUniversity and the Harvard Global Institute to the Harvard-China Project onEnergy, Economy and Environment.
1. BP Public Limited Company, Statistical review of world energy 2020 (2020).2. M. Li et al., Study on population distribution pattern at the county level of China.
Sustainability 10, 3598 (2018).3. S. Mallapaty, How China could be carbon neutral by mid-century. Nature 586,
482–483 (2020).4. Boston Consulting Group, China climate pathways report (BCG, Beijing,
2020).5. China Electric Power Planning & Engineering Institute, China Energy Development
Report 2018 (EPPEI, Beijing, 2019).6. The Climate Group, RE100: China’s Fast Track to a Renewable Future (RE100, China,
2015).7. W. Liu, H. Lund, B. V. Mathiesen, X. Zhang, Potential of renewable energy systems in
China. Appl. Energy 88, 518–525 (2011).8. D. Zhang et al., Present situation and future prospect of renewable energy in China.
Renew. Sustain. Energy Rev. 76, 865–871 (2017).
9. X. Ruhang, Characteristics and prospective of China′s PV development route: Based
on data of world PV industry 2000–2010. Renew. Sustain. Energy Rev. 56, 1032–1043
(2016).10. G. He et al., SWITCH-China: A systems approach to decarbonizing China’s power
system. Environ. Sci. Technol. 50, 5467–5473 (2016).11. International Energy Agency, Trends in PV applications 2019 (IEA-PVPS, Paris, 2020).12. International Energy Agency, 2020 Snapshot of Global PV Markets (IEA, Paris, 2021).13. Frankfurt School UNEP Centre/BloombergNEF, Global trends in renewable energy
investment 2019 (FS-UNEP Centre/BNEF, Germany, 2020).14. NDRC, Notice on Improvement of the Electricity Price Policy for Solar Photovoltaic
Power Generation (National Development and Reform Commission of China, 2011).15. International Energy Agency, 2014 Snapshot of Global PV Markets (IEA, Paris, 2015).16. International Energy Agency, 2015 Snapshot of Global PV Markets (IEA, Paris, 2016).17. National Energy Administration, 13th Five Year Plan for Solar Energy (NEA, Beijing,
2016).
Lu et al. PNAS | 7 of 8Combined solar power and storage as cost-competitive and grid-compatible supply forChina’s future carbon-neutral electricity system
https://doi.org/10.1073/pnas.2103471118
SUST
AINABILITY
SCIENCE
ENVIRONMEN
TAL
SCIENCE
S
Dow
nloa
ded
by g
uest
on
Nov
embe
r 25
, 202
1
18. China Renewable Energy Engineering Institute, China Renewable Energy Develop-ment Report (CREEI, Beijing, 2019).
19. J. Yan, Y. Yang, P. Elia Campana, J. He, City-level analysis of subsidy-free solar pho-tovoltaic electricity price, profits and grid parity in China. Nat. Energy 4, 709–717(2019).
20. Y. Wang, S. Zhou, H. Huo, Cost and CO2 reductions of solar photovoltaic powergeneration in China: Perspectives for 2020. Renew. Sustain. Energy Rev. 39, 370–380(2014).
21. M. Zhang, Q. Zhang, Grid parity analysis of distributed photovoltaic power genera-tion in China. Energy 206, 118165 (2020).
22. T. Burandt, B. Xiong, K. Löffler, P.-Y. Oei, Decarbonizing China’s energy system–
Modeling the transformation of the electricity, transportation, heat, and industrialsectors. Appl. Energy 255, 113820 (2019).
23. D. Bogdanov et al., Arising role of photovoltaic and wind energy in the power sectorand beyond: Changing the Northeast Asian power landscape. Jap. J. Appl. Phys. 57,08RJ01-1-08RJ01-10 (2018).
24. G. He et al., Rapid cost decrease of renewables and storage accelerates the de-carbonization of China’s power system. Nat. Commun. 11, 2486 (2020).
25. M. Jaxa-Rozen, E. Trutnevyte, Sources of uncertainty in long-term global scenarios ofsolar photovoltaic technology. Nat. Clim. Chang. 11, 266–273 (2021).
26. M. Xiao, T. Junne, J. Haas, M. Klein, Plummeting costs of renewables–Are energyscenarios lagging? Energy Strategy Rev. 35, 100636 (2021).
27. M. Victoria et al., Solar photovoltaics is ready to power a sustainable future. Joule 5,1041–1056 (2021).
28. N. M. Haegel et al., Terawatt-scale photovoltaics: Transform global energy. Science364, 836–838 (2019).
29. E. Vartiainen, G. Masson, C. Breyer, D. Moser, E. Román Medina, Impact of weightedaverage cost of capital, capital expenditure, and other parameters on future utility-scale PV levelised cost of electricity. Prog. Photovolt. Res. Appl. 28, 439–453 (2019).
30. National Energy Administration, Energy Storage Action Plan 2019-2020 Jointly Issuedby Four Ministries (National Energy Administration, 2019).
31. S. Wang, Which provinces have specified the allocation of energy storage for pho-tovoltaic projects during the 14th Five-Year Plan? http://www.escn.com.cn/news/show-1137301.html. Accessed 15 December 2020.
32. Global Modeling and Assimilation Office, File Specification for GEOS-5 FP (ForwardProcessing) (GMAO, 2013).
33. World Bank Group, Global Solar Atlas version 2.0 (Solargis, Slovakia, 2021).34. S. Chen et al., The potential of photovoltaics to power the Belt and Road Initiative.
Joule 3, 1895–1912 (2019).
35. CNPC Economics & Technology Research Institute, China Energy Outlook 2050 (CNPCETRI, Tokyo, 2017).
36. National Energy Administration, Photovoltaic Power Generation Statistics of 2013(NEA, Beijing, 2014).
37. National Energy Administration, Report on the Operation and Grid Connection ofRenewable Energy in Northwest Region in 2016 (NEA, Beijing, 2017).
38. China Renewable Energy Monitoring Center, Installed capacity and power generationof wind and solar power across the country in 2020 (CREMC, Beijing, 2021).
39. J. Yuan et al., Deregulation of power generation planning and elimination of coalpower subsidy in China. Util. Policy 57, 1–15 (2019).
40. International Monetary Fund, Global fossil fuel subsidies remain large: An updatebased on country-level estimates (IMF, Washington, D.C., 2019).
41. C. Zhao et al., The economics of coal power generation in China. Energy Policy 105,1–9 (2017).
42. X. Zhang, Scenario analysis of low-carbon energy transition under the 2060 carbonneutral target (Institute of Energy, Environment and Economy of Tsinghua University,Beijing, 2021).
43. China Center for Information Industry Development, “White paper on the develop-ment of energy storage industry under the vision of carbon neutrality in China”(CCID, Beijing, 2021). https://www.ccidgroup.com/info/1105/32718.htm. Accessed 24September 2021.
44. International Renewable Energy Agency, Future of Solar Photovoltaic (IRENA, AbuDhabi, 2019).
45. International Renewable Energy Agency, Electricity storage and renewables: Costsand markets to 2030 (IRENA, Abu Dhabi, 2017).
46. International Energy Agency, Global EV outlook 2018 (IEA, Paris, 2019).47. U.S. Geological Survey, Mineral commodity summaries 2020 (USGS, Virginia, 2021).48. A. Abdon et al., Techno-economic and environmental assessment of stationary elec-
tricity storage technologies for different time scales. Energy 139, 1173–1187 (2017).49. A. R. Dehghani-Sanij, E. Tharumalingam, M. B. Dusseault, R. Fraser, Study of energy
storage systems and environmental challenges of batteries. Renew. Sustain. EnergyRev. 104, 192–208 (2019).
50. L. Oliveira et al., Environmental performance of electricity storage systems for gridapplications, a life cycle approach. Energy Convers. Manage. 101, 326–335 (2015).
51. Solar Ofweek, Optimal panel tilt of utility-scale solar PV power station for 360 cities inChina (2016). https://solar.ofweek.com/2016-10/ART-260009-8300-30047659.html. Ac-cessed 12 December 2020.
52. International Energy Agency, National survey report of PV power applications inChina 2011-2019 (IEA-PVPS, Paris, 2019).
8 of 8 | PNAS Lu et al.https://doi.org/10.1073/pnas.2103471118 Combined solar power and storage as cost-competitive and grid-compatible supply for
China’s future carbon-neutral electricity system
Dow
nloa
ded
by g
uest
on
Nov
embe
r 25
, 202
1