Embed Size (px)
Citation preview
January 2015 Tableau Software, Inc. Page 1 of 8 Product release timeframes and stated or implied release contents are for general planning only. Roadmap items and schedules may change at any time. This material is not a commitment to deliver and may not be incorporated into any contract. Material provided is confidential and protected by our Mutual Non-‐Disclosure Agreement
Coming Soon in Tableau 9.0
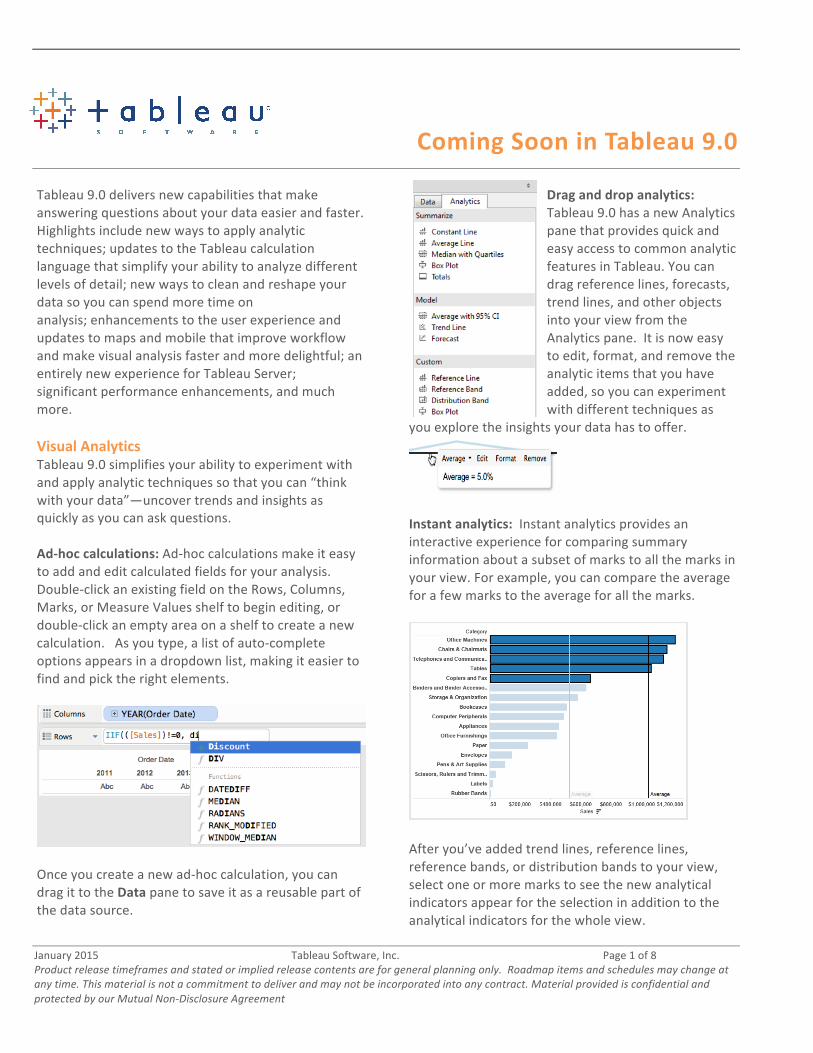
Tableau 9.0 delivers new capabilities that make answering questions about your data easier and faster. Highlights include new ways to apply analytic techniques; updates to the Tableau calculation language that simplify your ability to analyze different levels of detail; new ways to clean and reshape your data so you can spend more time on analysis; enhancements to the user experience and updates to maps and mobile that improve workflow and make visual analysis faster and more delightful; an entirely new experience for Tableau Server; significant performance enhancements, and much more. Visual Analytics Tableau 9.0 simplifies your ability to experiment with and apply analytic techniques so that you can “think with your data”—uncover trends and insights as quickly as you can ask questions. Ad-‐hoc calculations: Ad-‐hoc calculations make it easy to add and edit calculated fields for your analysis. Double-‐click an existing field on the Rows, Columns, Marks, or Measure Values shelf to begin editing, or double-‐click an empty area on a shelf to create a new calculation. As you type, a list of auto-‐complete options appears in a dropdown list, making it easier to find and pick the right elements.
Once you create a new ad-‐hoc calculation, you can drag it to the Data pane to save it as a reusable part of the data source.
Drag and drop analytics: Tableau 9.0 has a new Analytics pane that provides quick and easy access to common analytic features in Tableau. You can drag reference lines, forecasts, trend lines, and other objects into your view from the Analytics pane. It is now easy to edit, format, and remove the analytic items that you have added, so you can experiment with different techniques as
you explore the insights your data has to offer.
Instant analytics: Instant analytics provides an interactive experience for comparing summary information about a subset of marks to all the marks in your view. For example, you can compare the average for a few marks to the average for all the marks.
After you’ve added trend lines, reference lines, reference bands, or distribution bands to your view, select one or more marks to see the new analytical indicators appear for the selection in addition to the analytical indicators for the whole view.
Coming Soon in Tableau 9.0
January 2015 Tableau Software, Inc. Page 2 of 8 Product release timeframes and stated or implied release contents are for general planning only. Roadmap items and schedules may change at any time. This material is not a commitment to deliver and may not be incorporated into any contract. Material provided is confidential and protected by our Mutual Non-‐Disclosure Agreement
New calculation editor: The calculation editor has been redesigned so that you can create calculated fields faster, with fewer keystrokes, and greater accuracy. Now you can: • Move the editor window around the screen and
see how the changes you make affect the view. • Use autocomplete • Drag and drop data fields from the Data pane
directly into the calculation editor. • Drag and drop portions of a calculation from the
editor onto shelves or the Data pane to troubleshoot calculations.
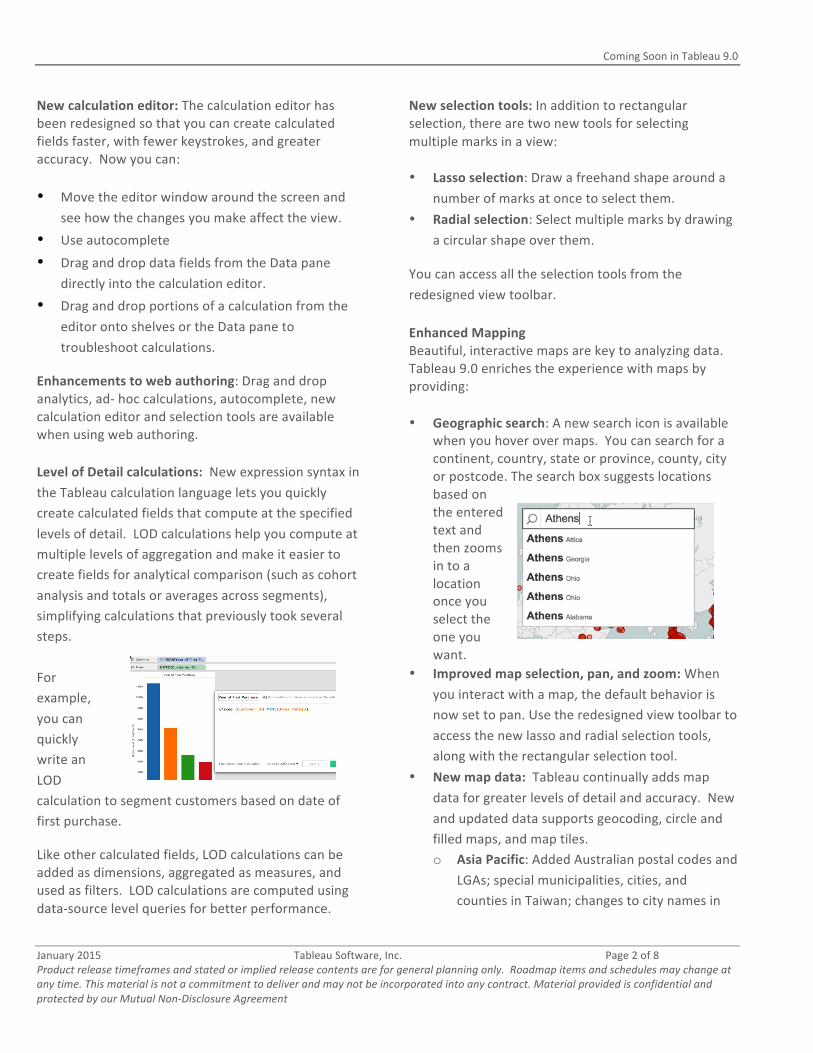
Enhancements to web authoring: Drag and drop analytics, ad-‐ hoc calculations, autocomplete, new calculation editor and selection tools are available when using web authoring. Level of Detail calculations: New expression syntax in the Tableau calculation language lets you quickly create calculated fields that compute at the specified levels of detail. LOD calculations help you compute at multiple levels of aggregation and make it easier to create fields for analytical comparison (such as cohort analysis and totals or averages across segments), simplifying calculations that previously took several steps. For example, you can quickly write an LOD calculation to segment customers based on date of first purchase.
Like other calculated fields, LOD calculations can be added as dimensions, aggregated as measures, and used as filters. LOD calculations are computed using data-‐source level queries for better performance.
New selection tools: In addition to rectangular selection, there are two new tools for selecting multiple marks in a view:
• Lasso selection: Draw a freehand shape around a number of marks at once to select them.
• Radial selection: Select multiple marks by drawing a circular shape over them.
You can access all the selection tools from the redesigned view toolbar. Enhanced Mapping Beautiful, interactive maps are key to analyzing data. Tableau 9.0 enriches the experience with maps by providing: • Geographic search: A new search icon is available
when you hover over maps. You can search for a continent, country, state or province, county, city or postcode. The search box suggests locations based on the entered text and then zooms in to a location once you select the one you want.
• Improved map selection, pan, and zoom: When you interact with a map, the default behavior is now set to pan. Use the redesigned view toolbar to access the new lasso and radial selection tools, along with the rectangular selection tool.
• New map data: Tableau continually adds map data for greater levels of detail and accuracy. New and updated data supports geocoding, circle and filled maps, and map tiles. o Asia Pacific: Added Australian postal codes and
LGAs; special municipalities, cities, and counties in Taiwan; changes to city names in
Coming Soon in Tableau 9.0
January 2015 Tableau Software, Inc. Page 3 of 8 Product release timeframes and stated or implied release contents are for general planning only. Roadmap items and schedules may change at any time. This material is not a commitment to deliver and may not be incorporated into any contract. Material provided is confidential and protected by our Mutual Non-‐Disclosure Agreement
Japan so that you can now search for city names with affixes.
o Europe, Middle East, Africa: Added country information for Egypt and Malawi, district municipalities in South Africa, and German kreise.
o Americas: Added Canadian FSAs, FIPS code values for US county geocoding, Argentinian departmentos, and Brazilian municipalities; updated US ZIP Codes and county names.
Data Preparation New data preparation features help you structure, reshape, and clean your data so you can spend less time preparing and more time analyzing your data. Data Interpreter: Tableau can detect the range of data in your spreadsheets and remove extra headers, footers, and additional “non-‐data” rows and columns to make it easier to analyze messy spreadsheets. You can review the results to understand what changes have been made. Pivot: Now you have an easy way to rotate your data from a cross-‐tab format to the normalized column format that works best for visual analysis and exploration with Tableau. On the Data Source page, select multiple columns and select Pivot from the drop-‐down menu. Data Split: You can now split your data into multiple fields for more effective analysis. You can split the fields by using: • Automatic split: If your data has clear delimiters,
Tableau can detect them and split the field into multiple columns. Automatic split also supports special cases like URLs, emails, and IP addresses.
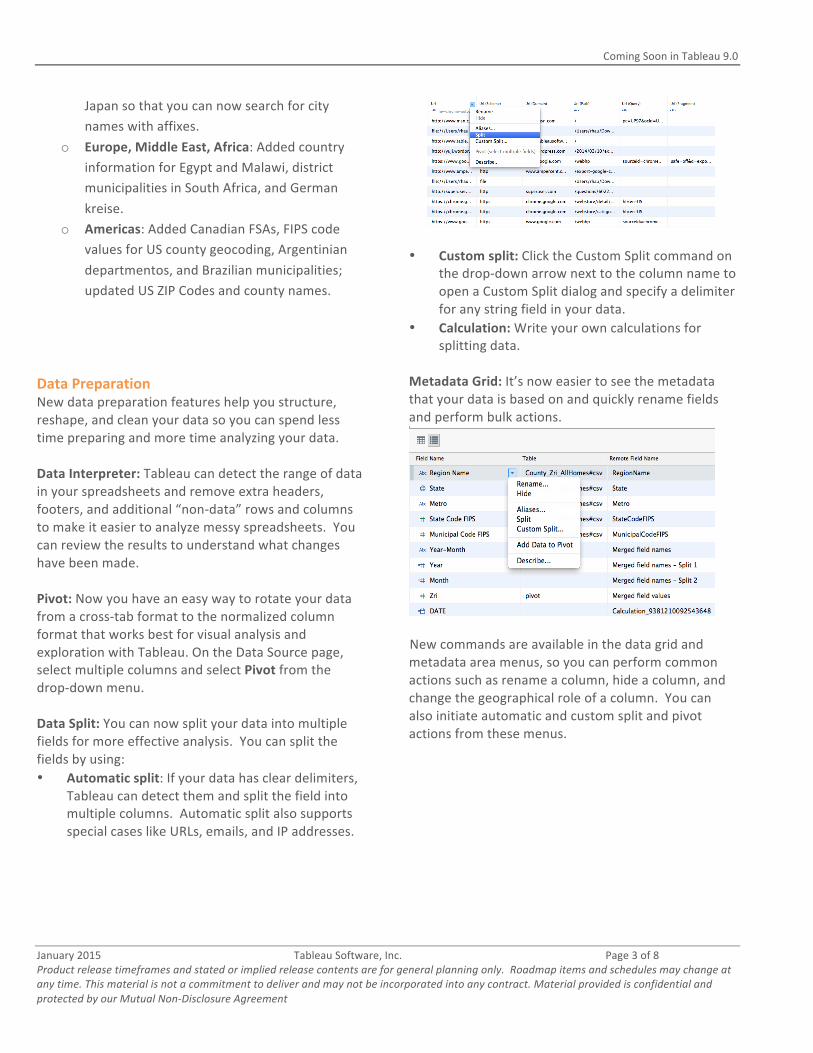
• Custom split: Click the Custom Split command on the drop-‐down arrow next to the column name to open a Custom Split dialog and specify a delimiter for any string field in your data.
• Calculation: Write your own calculations for splitting data.
Metadata Grid: It’s now easier to see the metadata that your data is based on and quickly rename fields and perform bulk actions.
New commands are available in the data grid and metadata area menus, so you can perform common actions such as rename a column, hide a column, and change the geographical role of a column. You can also initiate automatic and custom split and pivot actions from these menus.
Coming Soon in Tableau 9.0
January 2015 Tableau Software, Inc. Page 4 of 8 Product release timeframes and stated or implied release contents are for general planning only. Roadmap items and schedules may change at any time. This material is not a commitment to deliver and may not be incorporated into any contract. Material provided is confidential and protected by our Mutual Non-‐Disclosure Agreement
Connecting to Data Tableau 9.0 continues to improve your data connection experience. Tableau 9.0 also expands support for data sources so that you can get connected and stay connected more seamlessly to the data you need to support your mission. Kerberos support: Kerberos authentication is now available for Microsoft SQL Server, Microsoft Analysis Services, and Cloudera Impala. Kerberos support will provide single sign-‐on from the client to the database, and you can use Kerberos smart card authentication with Tableau. This creates a seamless experience for your customers while leveraging your organization’s IT resources for authentication and data security. Data Extract API for Mac OS: The Data Extract API is now available on Mac OS. This enables Mac developers to build custom applications in C++, Python, and Java to load data into Tableau. New Tableau Server connection experience: When you use Tableau Desktop to connect to a data source on Tableau Server, you can preview the data source in both the data and metadata grids for an easy way to explore and understand the data and columns in various sources. There are also new submenus for Tableau data server, so you can re-‐target your server without leaving your view. New and Improved Connectors: • A new connection experience and more flexible join
options are available for Salesforce.com, and you can take advantage of new options for refining data extracts to improve dashboard performance and load times by up to ten times.
• Analyze your SAS, SPSS, and R data by using the Statistical File connector. This data can be joined and blended like other file-‐based data sources.
• SSL encryption support for MySQL, SQL Server, and PostgreSQL.
• Support for regular expressions has been added for PostgreSQL, TDE, Hive and Oracle so you can use these functions to create calculated fields that match on specific string patterns.
User Experience Enhancements to the overall user experience in Tableau 9.0 improve workflow and make visual analysis faster and more delightful for authors and end users. New features ensure that your experience is responsive, informative, and visually engaging so you can spend more time in the flow of analysis. Redesigned Start and Connect experience: More intuitive navigation and easier ways to move among workbooks, data, and resources optimize workflow with:
• A new start page where you can immediately connect to your data, explore your content, and access valuable training and information.
• A refresh of the connection experience highlighting popular and most recently used data sources, with the ability to expand and search additional ones.
• A new home button so you can always get to the start page quickly; new locations for icons to navigate to different views (like “filmstrip”).
• Updates to sheet tab styles and behaviors, a new Story tab, and a Data tab so you can easily navigate between data and worksheets.
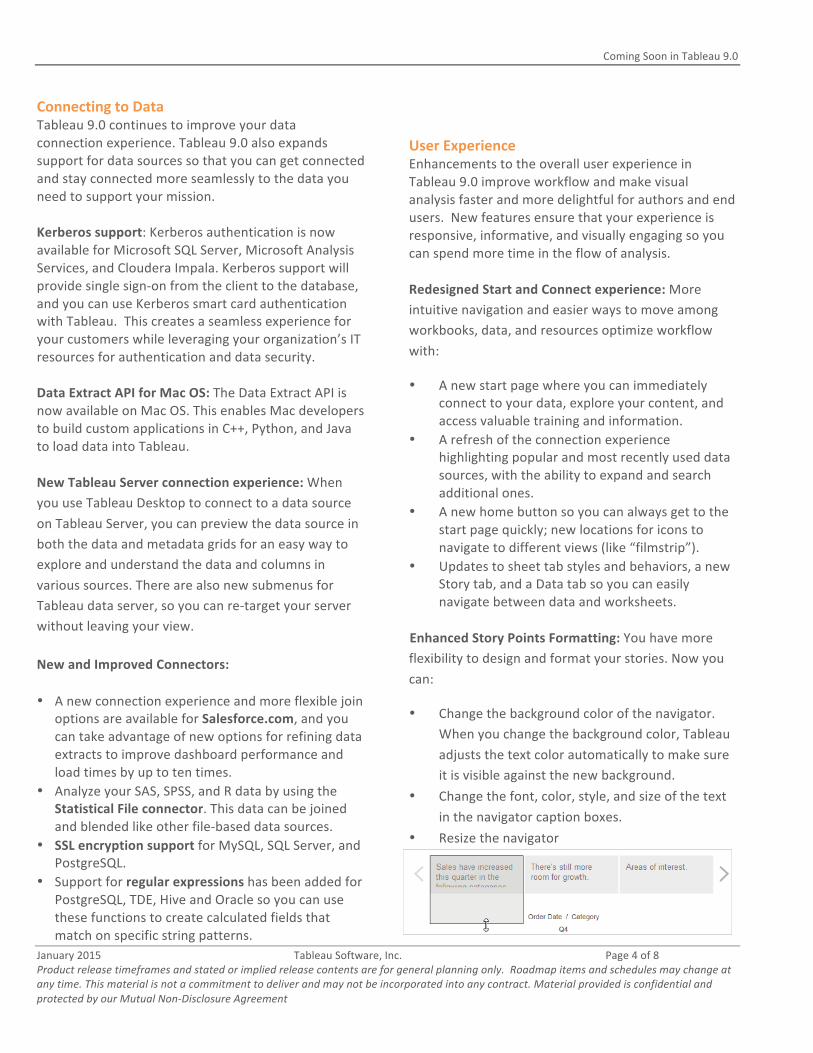
Enhanced Story Points Formatting: You have more flexibility to design and format your stories. Now you can:
• Change the background color of the navigator. When you change the background color, Tableau adjusts the text color automatically to make sure it is visible against the new background.
• Change the font, color, style, and size of the text in the navigator caption boxes.
• Resize the navigator
Coming Soon in Tableau 9.0
January 2015 Tableau Software, Inc. Page 5 of 8 Product release timeframes and stated or implied release contents are for general planning only. Roadmap items and schedules may change at any time. This material is not a commitment to deliver and may not be incorporated into any contract. Material provided is confidential and protected by our Mutual Non-‐Disclosure Agreement
Additional user experience enhancements include:
• Responsive marks in Tableau Desktop changes marks in visual ways (such as bold outline) when you hover near or over them, providing immediate feedback to help focus your attention and make sure you select the correct mark.
• Improved tooltips appear instantly when you hover over a mark and follow your mouse pointer (but helpfully stay out the of the way) as you move around a view.
• The ability to render custom shapes directly in the browser for better performance.
• A reset button in continuous quick filters makes it easier to reset and see all values in the range.
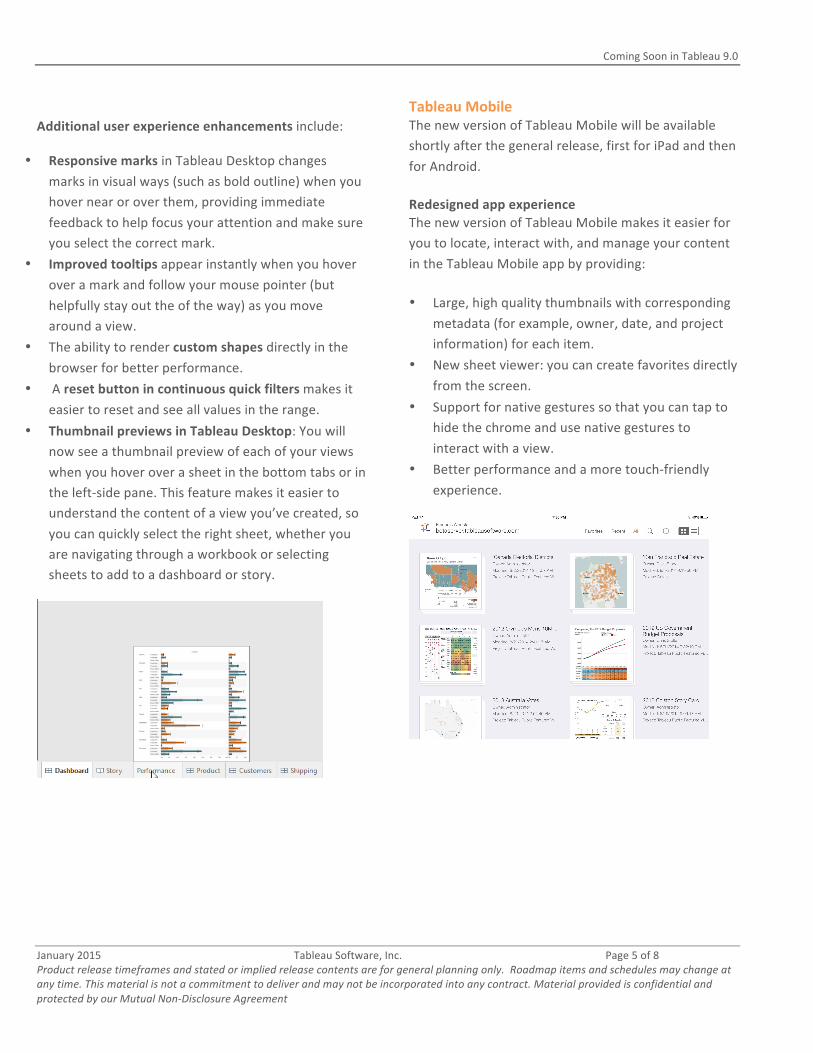
• Thumbnail previews in Tableau Desktop: You will now see a thumbnail preview of each of your views when you hover over a sheet in the bottom tabs or in the left-‐side pane. This feature makes it easier to understand the content of a view you’ve created, so you can quickly select the right sheet, whether you are navigating through a workbook or selecting sheets to add to a dashboard or story.
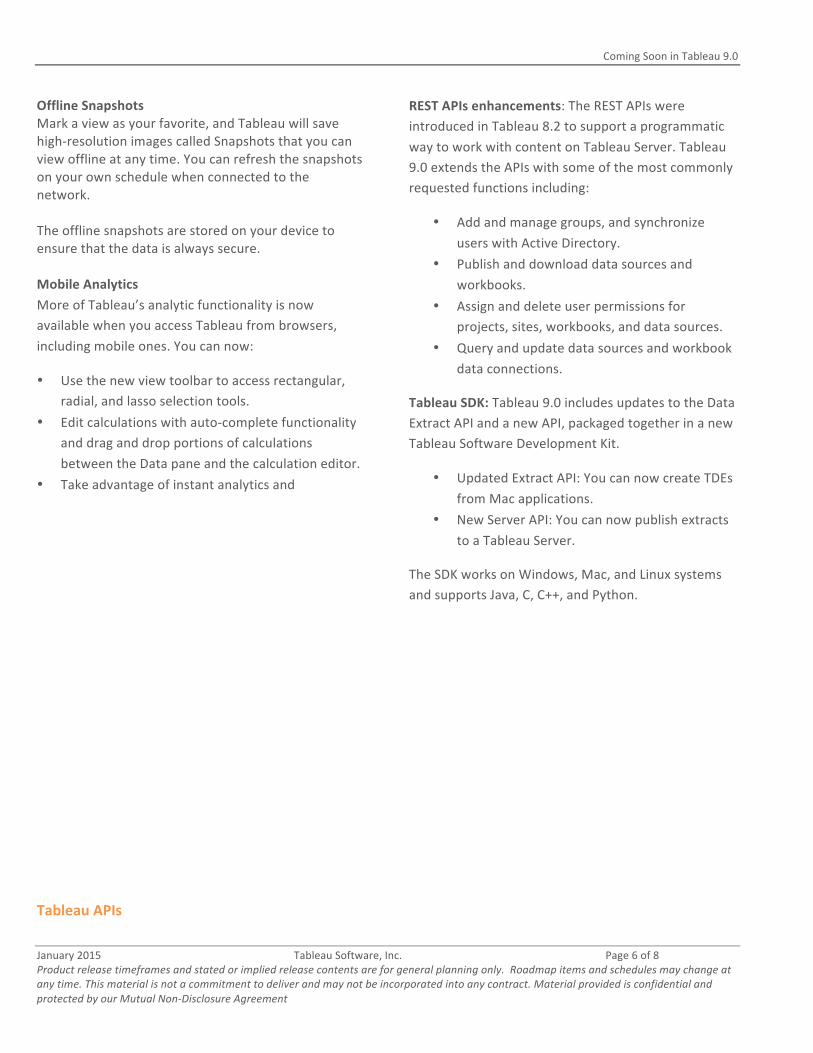
Tableau Mobile The new version of Tableau Mobile will be available shortly after the general release, first for iPad and then for Android. Redesigned app experience The new version of Tableau Mobile makes it easier for you to locate, interact with, and manage your content in the Tableau Mobile app by providing: • Large, high quality thumbnails with corresponding
metadata (for example, owner, date, and project information) for each item.
• New sheet viewer: you can create favorites directly from the screen.
• Support for native gestures so that you can tap to hide the chrome and use native gestures to interact with a view.
• Better performance and a more touch-‐friendly experience.
Coming Soon in Tableau 9.0
January 2015 Tableau Software, Inc. Page 6 of 8 Product release timeframes and stated or implied release contents are for general planning only. Roadmap items and schedules may change at any time. This material is not a commitment to deliver and may not be incorporated into any contract. Material provided is confidential and protected by our Mutual Non-‐Disclosure Agreement
Offline Snapshots Mark a view as your favorite, and Tableau will save high-‐resolution images called Snapshots that you can view offline at any time. You can refresh the snapshots on your own schedule when connected to the network. The offline snapshots are stored on your device to ensure that the data is always secure. Mobile Analytics More of Tableau’s analytic functionality is now available when you access Tableau from browsers, including mobile ones. You can now:
• Use the new view toolbar to access rectangular, radial, and lasso selection tools.
• Edit calculations with auto-‐complete functionality and drag and drop portions of calculations between the Data pane and the calculation editor.
• Take advantage of instant analytics and
Tableau APIs
REST APIs enhancements: The REST APIs were introduced in Tableau 8.2 to support a programmatic way to work with content on Tableau Server. Tableau 9.0 extends the APIs with some of the most commonly requested functions including:
• Add and manage groups, and synchronize users with Active Directory.
• Publish and download data sources and workbooks.
• Assign and delete user permissions for projects, sites, workbooks, and data sources.
• Query and update data sources and workbook data connections.
Tableau SDK: Tableau 9.0 includes updates to the Data Extract API and a new API, packaged together in a new Tableau Software Development Kit.
• Updated Extract API: You can now create TDEs from Mac applications.
• New Server API: You can now publish extracts to a Tableau Server.
The SDK works on Windows, Mac, and Linux systems and supports Java, C, C++, and Python.
Coming Soon in Tableau 9.0
January 2015 Tableau Software, Inc. Page 7 of 8 Product release timeframes and stated or implied release contents are for general planning only. Roadmap items and schedules may change at any time. This material is not a commitment to deliver and may not be incorporated into any contract. Material provided is confidential and protected by our Mutual Non-‐Disclosure Agreement
Tableau Server Tableau Server has been redesigned from the ground up to help you manage, find, and share your content more efficiently. The web client is supported by a backend service written in Java for a faster, more scalable, and more extensible platform. The enterprise search platform Apache Solr now powers all search and browsing functionality for significant speed improvements. Your new Tableau Server experience includes: • Infinite scrolling, faster response times, and faster faceted search to navigate your content.
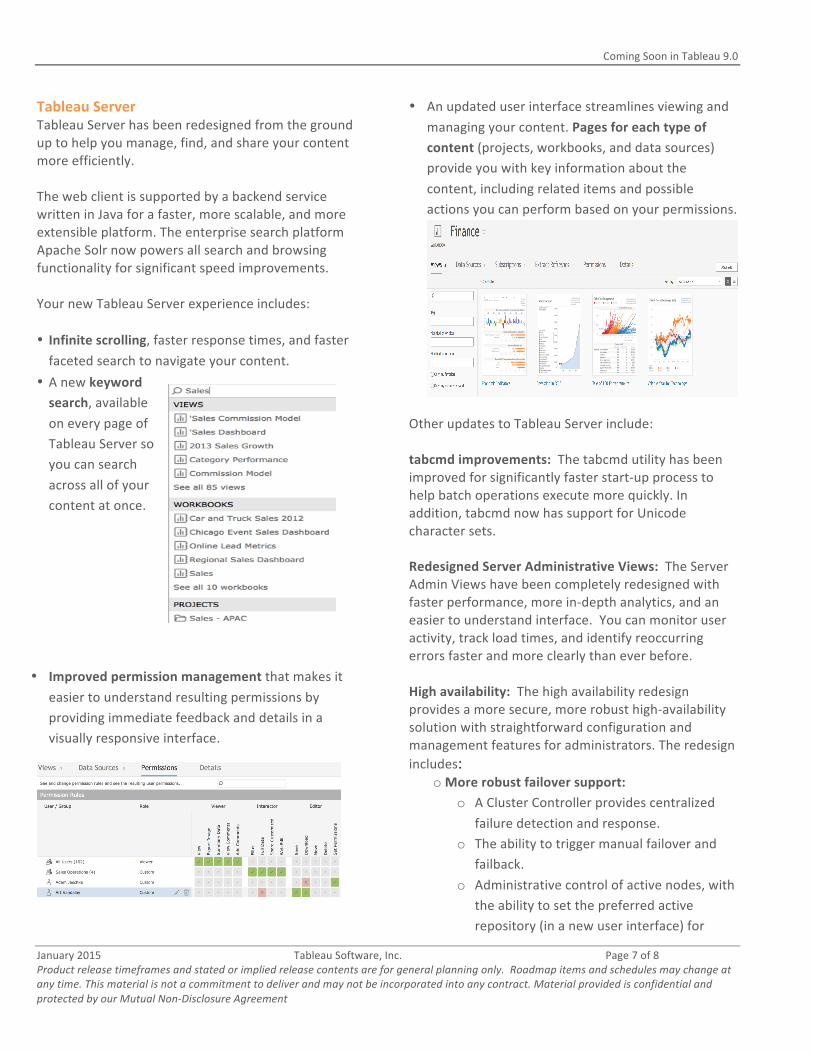
• A new keyword search, available on every page of Tableau Server so you can search across all of your content at once.
• Improved permission management that makes it easier to understand resulting permissions by providing immediate feedback and details in a visually responsive interface.
• An updated user interface streamlines viewing and managing your content. Pages for each type of content (projects, workbooks, and data sources) provide you with key information about the content, including related items and possible actions you can perform based on your permissions.
Other updates to Tableau Server include: tabcmd improvements: The tabcmd utility has been improved for significantly faster start-‐up process to help batch operations execute more quickly. In addition, tabcmd now has support for Unicode character sets. Redesigned Server Administrative Views: The Server Admin Views have been completely redesigned with faster performance, more in-‐depth analytics, and an easier to understand interface. You can monitor user activity, track load times, and identify reoccurring errors faster and more clearly than ever before. High availability: The high availability redesign provides a more secure, more robust high-‐availability solution with straightforward configuration and management features for administrators. The redesign includes:
o More robust failover support: o A Cluster Controller provides centralized
failure detection and response. o The ability to trigger manual failover and
failback. o Administrative control of active nodes, with
the ability to set the preferred active repository (in a new user interface) for
Coming Soon in Tableau 9.0
January 2015 Tableau Software, Inc. Page 8 of 8 Product release timeframes and stated or implied release contents are for general planning only. Roadmap items and schedules may change at any time. This material is not a commitment to deliver and may not be incorporated into any contract. Material provided is confidential and protected by our Mutual Non-‐Disclosure Agreement
better support of asymmetrical hardware configurations.
o Approachable configuration: New workflows and more feedback in the configuration process make it easier for both technical and business users to configure server deployment for high availability and ensure that data and server information are safe in the process.
o Greater scalability: A new data extract storage process, File Store, provides significant speed improvements and reliability of data replication, making Tableau Server even more scalable. Restrictions on number of data engine nodes per cluster no longer exist, and all data engine nodes are active, with data being replicated between them, eliminating any need for failover data engine processes.
Performance Enhancements Performance enhancements make workbooks load faster, improve dashboard performance, and make interactivity more seamless with faster results and response.
Many of the 9.0 performance enhancements are the result of leveraging high performance capabilities of existing technology and advanced hardware.
• Parallel query takes advantage of databases that can perform queries in parallel to run multiple queries at once, rather than one after the other.
• Data engine vectorization speeds up the performance of many extract-‐based workbooks by taking advantage of modern CPU architecture for faster processing and clear performance gains.
• Parallel aggregation effectively uses multiple cores in Tableau extracts and other file-‐based data sources. This parallel work takes advantage of all the processors on your computer to provide results more quickly.
• Temp table support in data server makes querying more efficient with databases that use temp tables, such as SQL Server, resulting in better performance for views that have large filters, sets, and ad-‐hoc groups.
More efficient cache and query behavior also deliver performance improvements, especially for opening and re-‐opening workbooks.
• External query caching: Workbooks with Tableau extracts will re-‐open more quickly because query results are saved so queries are not re-‐run every time you open a workbook.
• Query fusion recognizes related queries in a single dashboard and combines them so there are fewer queries to execute and also orders queries for improved cache hits so that dashboard performance is improved.
• Shadow extracts create a faster text-‐based data source experience. A workbook with a large text or Excel file re-‐opens with improved speed.