Embed Size (px)
Citation preview

Quarterly Bulletin 2 2005
5
Comment
The Irish economy continues to perform well into the early partof this year. After a substantial weakening in the two previousyears when the growth in Gross National Product (GNP) wasonly 1.5 per cent and 2.8 per cent respectively, GNP growthpicked up to an estimated 5.5 per cent last year. Gross DomesticProduct (GDP) growth was slightly lower than this at 4.9 percent. GNP and GDP growth are now projected to grow by 51⁄4
per cent and 51⁄2 per cent, respectively, in 2005 and to continueat a broadly similar pace in 2006.
While economic growth in the medium-term is determinedultimately by increases in employment and improvements inproductivity, demand factors strongly influence short-termfluctuations in growth. In the Irish economy in 2002 and 2003,the two major components of domestic demand, consumptionand investment, increased only modestly. There was also a majoreasing of export demand affecting mainly the export-orientedhigh-technology sectors. This demand weakness occurred inresponse to a less benign external economic environment whichfollowed from a number of events including the ICT shock, asubstantial equity market correction, higher oil prices andincreased geopolitical tensions. Last year, consumer demandpicked up only modestly, although there was significantlystronger housing investment and a better export performance.
As far as the external environment is concerned, the worldeconomy has been in generally good shape in recent times. Lastyear saw the highest growth for the OECD economies for manyyears — about 31⁄2 per cent — although the pace of growthdecelerated in the second half of the year. This year, growth inthe major economies is likely to be somewhat lower. The US andJapan seem likely to experience weaker growth, although stillrelatively satisfactory in the case of the US. Excluding Japan,growth is expected to remain strong in Asia and especially China.The euro-area economy is estimated to have grown by 1.8 percent last year, but with a marked deceleration in the second halfof the year. Because of carryover effects from the latter part oflast year, a slightly lower rate of growth is forecast for this year.While slowing down from last year’s very strong pace, recentIMF estimates suggest world trade volumes are likely to grow byaround 71⁄2 per cent this year, with trade between the advancedeconomies likely to grow by 6 per cent. This provides a benignexternal environment for an economy like Ireland’s with a highdegree of external trade.
Two significant risks still overhang the international economy.After easing for some time, oil prices surged to new heights in

Quarterly Bulletin 2 2005
6
early April, on foot of strong seasonal demand and apparentsupply constraints. This brought oil prices in dollars toapproximately twice their average level in 2003. While mostdeveloped economies are now much less dependent on oil thansome time ago, oil prices still have the capacity to limit growthand increase uncertainty. This could be significant in regions suchas the euro area that have struggled for some time to achieveself-sustaining growth. The near-term prospects for oil prices arequite uncertain. While speculation may be adding to demand,world economic growth is expected to remain strong, includingcontinuing demand associated with the booming Chineseeconomy. This could result in oil prices remaining high. In theshort-run, there are limited substitution possibilities and thedemand for oil is, therefore, relatively unresponsive to pricechanges. The price of oil is, therefore, quite sensitive to supplydisruptions and demand shocks.
The second major external risk is the uncertainty surroundingexchange rates. The US dollar is susceptible to potentially largeswings mainly because of the large fiscal and external deficits.The policy of a significant number of countries of pegging theircurrencies to the dollar places much of the adjustment on theeuro. As a euro-area country with a relatively high proportion ofits trade with the US and the UK, Ireland has a particularexposure to fluctuations in the value of the euro against the USdollar and sterling. The most recent annual trade data show thatthe US accounts for 21 per cent of Irish exports with the UKaccounting for 18 per cent. Thus far, exports have performedrelatively well in this more uncertain environment. This isexplained partly by the fact that much of external trade with theUS is of an intra-firm nature and sterling continues to be relativelystrong, currently being still above its value at the launch of theeuro in 1999. Nonetheless, it remains the case that the possibilityof a rapid appreciation of the euro is one of the most significantrisks facing the Irish economy.
Taken as a whole, growth in Ireland’s export markets is likely tobe slightly slower than last year. This reflects a softer environmentin major markets — the US, the UK and the euro area. The mostpersistent factor remains the sluggish performance of the euro-area economy, particularly in regard to the consumer spendingcomponent of domestic demand. It is encouraging that there aresomewhat more positive indications that the prospects forinward foreign direct investment are improving, and this willenhance the export capacity of the economy.
In spite of the continuing relatively strong growth rate of theIrish economy, inflationary pressures at present seem relativelysubdued with inflation itself being close to what wouldcorrespond to price stability. The increase in the HarmonisedIndex of Consumer Prices (HICP) last year was 2.3 per cent

Quarterly Bulletin 2 2005
7
compared with 2.1 per cent in the euro area. More recentindicators point to some modest further easing of domesticinflation to a rate below that obtaining in the euro area. Therelatively strong euro is exerting downward pressure on goodsprice inflation, although the recent peak in oil prices, if sustained,would moderate this effect. Services inflation this year — forecastto be 4 per cent — will be higher than last year’s 33⁄4 per cent. Itwill be a challenge to hold down services inflation against thebackground of nominal pay increases of 6 per cent last year anda tight labour market registering a low unemployment rate of 41⁄4
per cent. Pay developments last year were heavily influenced byincreases in the public sector and the construction sector, bothof which have a limited direct impact on consumer prices.However, the strong increases in employment, even ifconcentrated in specific sectors, have the capacity to spill overinto higher pay and prices in the wider economy. With a smallereffect from public sector benchmarking increases and a moremuted performance from the construction sector, averagenominal pay is forecast to increase by 43⁄4 per cent this year.Taking account of all of these factors and the state of demand inthe economy, HICP inflation is likely to be about 2 per cent thisyear, marginally less than forecast in the last Bulletin. Beyondthat, however, there is a clear risk of some pick-up in inflationwith the economy operating effectively at full capacity and withvery low unemployment. In this regard, some modestacceleration in inflation is forecast for 2006.
While Ireland’s inflation is now running at a rate close to that ofour main trading partners, this follows a number of years whenour inflation rate was well in excess of that of our tradingpartners. This has resulted in Ireland’s price level now being some16 per cent higher than that of the euro area as a whole. In thepresent low inflation environment, the principal potentialinfluence on the economy’s international competitiveness is theevolution of exchange rates. The US dollar, and to a lesser extentsterling, depreciated significantly from mid-2004, although,through the first quarter of this year, this has been followed bysome strengthening which has served to offset some of thisdepreciation. Nonetheless, the generally weaker US dollar andsterling have contributed to pressure on the economy’sinternational competitiveness. The Bank’s Real Trade WeightedCompetitiveness Index has deteriorated fairly steadily since late2000. As a consequence, the country’s competitiveness is nowmore vulnerable to any further dollar or sterling depreciation.
The stance of fiscal policy is an important factor in ensuring thatoverheating forces in the economy are contained. LastDecember’s Budget had a moderately expansionary tone. TotalGeneral Government spending is planned to increase by 103⁄4
per cent this year, a relatively large increase. However, the publicfinances are in very sound order, as might be expected with the
Quarterly Bulletin 2 2005
8
significant flow of revenue to the Exchequer associated with theresumption of strong economic growth. Nonetheless, it isimportant to ensure that fiscal policy is supportive of non-inflationary growth in the period ahead when the economy isoperating essentially at full capacity.
House price increases are currently easing compared with therecent past. Based on the permanent tsb index, house pricesincreased by 111⁄2 per cent on average last year, having increasedby 141⁄4 per cent in 2003. This index shows that year-on-yearincreases in recent months have been of the order of 8 per centwith recent annualised increases running at 5 to 6 per cent.
Regarding mortgage credit, although it appears to have peaked,it is still increasing very rapidly at about 25 per cent a year; thisis some three times the increase in nominal disposable income.The easing of house price increases and somewhat reducedhousing construction should, with a lag, contribute to a loweringin credit increases to a more sustainable pace. However, untilthere is some evidence of this, mortgage credit growth continuesto be a matter of concern.
Non-mortgage credit growth has also picked up in the recentpast to rates of increase of close to twice that of a year ago, andsimilar to those of mortgage credit. A significant part of thislending is being extended to the broad property sector. This highrate of increase, accompanied by substantial mortgage creditincreases, underlines the need for prudence and caution indecision-making on the part of borrowers and lenders.
The cyclically low level of interest rates has facilitated borrowersin being able to service much higher debt levels. It is inevitable,however, that interest rates will rise to more normal levels atsome point, and it is of vital importance that borrowers havemade provision for servicing debt in such changedcircumstances.
The booming construction sector underlines a number ofsignificant structural changes in the economy that have becomeevident in recent times. After peaking in early 2001,manufacturing employment has contracted until recently, whenit has broadly stabilised. Over this period, Ireland has begun toresemble typical developed economies in that, althoughmanufacturing output has increased strongly, the relativeimportance of manufacturing, particularly in terms ofemployment, in the economy has tended to decline. This isaccounted for by significant productivity increases in themanufacturing sector which, therefore, had less need for higheremployment, together with an increased demand for serviceswhich are generally more labour intensive. Currently, servicesaccount for 66 per cent of total employment compared with

Quarterly Bulletin 2 2005
9
60 per cent a decade ago. Over this period, the manufacturingproportion of total employment has fallen from 20 per cent to16 per cent. With the strong performance of the constructionsector in recent times, this sector now accounts for nearly 12 percent of total employment; this share is about 50 per cent greaterthan in most other developed countries. At some point, the shareof construction in total employment will inevitably be reduced.It will be important to ensure as far as possible that this labourcan be absorbed into other sectors of the economy withoutdisruption. This will call for significant retraining efforts and themaintenance of a good business environment to promote theestablishment of new enterprises.
International and Euro Area Economy
After growing at its fastest rate in almost three decades betweenmid-2003 and mid-2004, global economic growth has slowedsince last summer. While, in part, this represented a return tomore sustainable levels of growth following a period of robustexpansion, it also reflected the adverse impact of higher oilprices. A feature of the last nine months has been that themoderation in growth has not been uniform across countries. Inparticular, in the US and emerging Asia, especially China, growthhas remained relatively strong. In contrast, in the euro area andJapan, the slowdown has been more marked. As a result, therehas been a growing divergence in economic performance acrossregions, with the global expansion becoming more dependenton the growth of the US economy.
Over the last few quarters, driven by strength of domesticdemand, growth in the US has surpassed expectations. Theslowdown in mid-2004 proved relatively brief, with consumptionrebounding, supported, until recently by rising equity and houseprices. Investment spending has also grown strongly in recentquarters supported, up to now, by buoyant corporateprofitability, underpinned, in turn, by strong productivity growth.As a result, the US economy largely withstood the earlier rises inoil prices reasonably well, though, more recently, there areemerging signs that the latest hike in prices may be having someimpact. Growth in the US has continued to be supported byfavourable financial market conditions. A notable feature of USfinancial markets in recent quarters has been the persistently lowlevel of US bond yields, with current levels (as of late April) lowerthan when the Federal Reserve began tightening monetary policyin mid-2004. As a result, monetary conditions in the US haveremained relatively accommodative, with the low level of bondyields moderating the impact on economic activity of higherpolicy interest rates.
In contrast to the US, the euro-area economy lost momentumduring the second-half of 2004. The moderation of growth in the

Quarterly Bulletin 2 2005
10
euro area was largely the result of a marked decline in theexternal contribution, which was only partially compensated forby higher domestic demand. Slower global growth and thelagged impact on competitiveness of the ongoing appreciationof the euro undercut export growth, while rising oil prices alsotook their toll. As a result, economic growth in the euro area inthe second-half of 2004 was a good deal weaker than in the first-half. Despite some modest improvement in the final quarter of2004, the main disappointment continues to be the performanceof consumer spending. This has been held back by subduedemployment and wage growth, while the level of precautionarysaving has remained high, reflecting ongoing concerns in relationto labour markets and the long-term prospects for health-careand pension systems.
In recent months, the signals with regard to the outlook for euro-area growth have been mixed. While data for January was largelyfavourable, data since then has been less supportive. Bothconfidence surveys and activity data have weakened against thebackground of the renewed rise in oil prices. This is notencouraging and does not suggest that growth is likely tostrengthen in the near term.
Recent developments once again highlight the extent to whichhigh and volatile oil prices raise risks to the outlook for growth.At current levels, oil prices are around 60 per cent higher in euroterms and 70 per cent higher in US dollar terms than at thebeginning of 2004. While a colder than expected winter in theUS and Europe played some role in holding prices up in recentmonths, the main source of upward pressure has come from thestrength of oil demand from emerging economies, particularlyChina. The impact on prices has been reinforced by uncertaintiesabout OPEC production intentions, falling non-OPEC supply andlow levels of spare capacity. With the demand-supply balanceexpected to remain tight for some time, a new and somewhatworrying feature of oil markets has been the rise in long-termfutures prices, suggesting that higher prices may persist. Althoughthe global economy has weathered the impact of high oil pricesreasonably well to date, this reflects the fact that, in part, higherprices have been a consequence of strong global growth.However, persistently high oil prices pose downside risks to thegrowth outlook.
Oil prices are not the only threat, however. Reflecting thedivergence in growth performances across the major economies,global current account imbalances have widened, with the UScurrent account deficit rising to a record 5.7 per cent of GDP in2004. At the same time, movements in exchange rates havecome to be linked with the evolution of imbalances, with marketsfocussed, in particular, on the question of how the US deficit willcontinue to be financed. Given the relative fixity of some Asian

Quarterly Bulletin 2 2005
11
currencies vis-a-vis the US dollar, from time to time, this has ledto sharp upward movements in the value of the euro. This hasacted to dampen activity in the euro area and the potential forfurther volatility in the exchange rate remains an additionaldownside risk to euro-area growth.
As regards price developments, inflation and inflationarypressures have remained relatively contained. Most recently,however, there is some evidence that in the more cyclicallyadvanced economies, such as the US, some price pressures arebeginning to emerge. In the euro area, however, reflecting themodest nature of the economic recovery, inflationary pressureshave remained subdued. While higher oil prices and increases inindirect taxes and administered prices have kept inflation around2 per cent, there have been no signs of ‘second round’ effectson wage and price setting behaviour. There has been very littleevidence of pass through from higher input prices to final goods,while the continued softness of labour markets has meant thatwage growth has been moderate. Against this background,inflation expectations have remained benign and, while there aresome upside risks, underlying inflationary pressures in the euroarea remain relatively contained.


Quarterly Bulletin 2 2005
13
The Domestic Economy —
Real and Financial
Developments1
Overview
The prospects for the domestic economy remain positive.Preliminary National Accounts data for 2004 indicate that GNPgrew by 5·5 per cent last year in volume terms with acorresponding increase of 4·9 per cent in GDP. Growth shouldbe broadly similar this year. A GNP volume increase of about 51⁄4
per cent is currently projected. GDP growth is likely to besomewhat higher at about 51⁄2 per cent. On the assumption thatthere are no external shocks to the economy and that exchangerates and interest rates remain unchanged, further growth ofabout 51⁄2 per cent in GNP terms and 53⁄4 per cent in GDP termsis in prospect for next year. In broad terms, therefore, theeconomy has returned rapidly to its potential growth rate,following the slowdown in the early years of this decade, and isexpected to continue to grow at about this rate in the short-term.There are, as always, risks surrounding this projection, whichcould result in a less favourable outcome. These have beendiscussed in the preceding Comment section.
The external environment for the domestic economy remainsfavourable. Growth may ease in some of the country’s maintrading partners but only in those regions that grew very rapidlyin the recent past, such as the United States and some parts ofAsia. Other regions, such as the euro area itself, seem set toexperience a modest acceleration in growth. Overall, however,output growth in Ireland’s trading partners, weighted by theirshare in our export trade, seems likely to decelerate slightly thisyear to about 21⁄4 per cent compared with 23⁄4 per cent in 2004.This figure is projected to rise again slightly to 21⁄2 per cent in2006. This assumes that existing imbalances in the internationaleconomy, the most obvious being the large US current accountdeficit, are eliminated gradually and without major sustainedchanges to exchange rates or in the pattern of growth in themajor economies.
Domestic demand grew quite solidly last year, although this wasdue, in large part, to the strength of housing investment.Consumer spending, in contrast, grew at a relatively modestpace. In fact, given the increase in employment and earnings thatoccurred last year, it seems likely that the growth of spending
1 These forecasts were compiled in early April and do not take account of data publishedsubsequently. They assume that interest rates and exchange rates remain unchanged fromaverage levels at that time. The forecasts were produced independently by the Bank andnot as part of a Eurosystem exercise.

Quarterly Bulletin 2 2005
14
failed to keep up with the increase in disposable income. Itseems to be the case that, in spite of some improvement in thelevel of consumer confidence recorded in surveys, householdsremained relatively cautious. A pick-up in the growth ofconsumer expenditure is expected this year with a continuedstrong labour market performance supporting the growth indisposable incomes and helping to underpin consumersentiment. This somewhat faster pace of consumer spendinggrowth is expected to strengthen further next year.
While consumer spending by households came in slightlybelow expectations last year, investment spending in theeconomy grew more sharply than anticipated. This reflectedanother strong rise in residential construction funded, in largepart, by a significant rise in mortgage credit to households.There was also more rapid growth in investment spending byfirms. In contrast to consumer spending, however, the growthof investment expenditure is expected to decelerate this yearand next year. This reflects the fact that new house completionsare already at a very high level, well above the level of long-run underlying demand, and are unlikely to record furthersignificant growth. Spending on non-residential constructionmay pick up somewhat but growth in overall constructionspending and, as a result, overall investment spending seemsset to decelerate. The pick-up in consumer spending shouldoffset this slowing of investment spending to leave overalldomestic demand growth more or less unchanged in 2005 and2006 compared with last year.
Exports put in a slightly weaker than expected performance lastyear. The sectoral distribution of this performance was also alittle different from initial projections. Although the ICT sectorperformed well in terms of output growth, overall hightechnology exports were subdued, mainly reflectingdevelopments in the chemicals sector. On the other hand,exports from the more traditional sectors fared relatively well, atleast in the early part of the year. Exports of services, especiallycomputer and other business and financial services also put in astronger than expected performance. The outlook for this yearand next year is reasonably positive. External demand growth isexpected to remain strong, albeit slightly less so than was thecase last year. Bearing in mind the positive trend in inwardforeign direct investment and the improvement in the fortunesof the ICT sector, it should be possible to avoid a repeat of themarket share losses incurred last year, although this depends onthe performance of the broad chemicals sector. As a result,overall export volumes are likely to grow somewhat more rapidlythan last year, both this year and next year, in spite of slightlyslower growth in world trade. The contribution of external tradeon a net basis may not rise much, however, as import growth is

Quarterly Bulletin 2 2005
15
Table 1. Expenditure on Gross National Product 2004, 2005e and 2006f
2004 % change in 2005e % change in 2006f
\ million Volume Price \ million Volume Price \ million
Personal Consumption Expenditure 66,439 41⁄4 13⁄4 70,577 53⁄4 13⁄4 76,053Public Net Current Expenditure 21,017 41⁄2 43⁄4 23,017 21⁄4 4 24,512Gross Domestic Fixed Capital Formation 36,509 4 31⁄2 39,351 31⁄4 31⁄2 42,002
of which:
• Building and construction 26,700 4 43⁄4 29,129 21⁄2 4 31,076• Machinery and equipment 9,809 4 1⁄4 10,222 5 13⁄4 10,926
Value of physical changes in stocks 81 200 300Statistical Discrepancy −514 −514 −514
Gross Domestic Expenditure 123,532 41⁄2 23⁄4 132,631 41⁄2 23⁄4 142,353
Exports of goods and services 117,363 53⁄4 −1⁄2 123,648 6 11⁄2 133,053
Final Demand 240,895 5 11⁄4 256,279 51⁄4 2 275,406
Imports of goods and services −94,616 41⁄2 1⁄4 −99,206 43⁄4 2 −106,026
Gross Domestic Product 146,279 51⁄2 13⁄4 157,073 53⁄4 2 169,380
Net factor income from rest of the world −23,727 −25,181 −27,331
Gross National Product 122,552 51⁄4 21⁄4 131,892 51⁄2 21⁄4 142,049
likely to be sustained by stronger consumption growth andincreased high-technology exports.
Labour market developments remain very positive. Employmentgrew by about 3 per cent last year reflecting, in part, the relativelyemployment-intensive nature of output growth, with theresidential construction sector and the services sectorcontributing strongly. The scale of employment growth mighthave given rise to more labour market tensions if it had not beenaccompanied by strong labour force growth. Part of this growthcame from domestic sources, reflecting the natural increase inthe population as well as the tendency for participation rates torise again as labour market conditions improved. Anothersignificant element, however, has been stronger than expectedinward migration. A similar pattern may recur this year and nextyear, with inward migration helping to ease labour shortages inthe economy. Employment growth may ease back slightly,however, reflecting changes in the composition of outputgrowth, in particular, less reliance on growth in the labour-intensive residential construction sector. The increase inemployment is still expected to reach 21⁄4 per cent and theunemployment rate may stabilise at about its current level of 41⁄4
per cent, compared with an average of 41⁄2 per cent for last year.Unemployment is expected to remain at a similar level next yearalthough the rate of growth of both employment and the labourforce are likely to ease back somewhat.
Domestic Demand
Personal Consumer Spending
Consumer spending grew by 3·2 per cent last year according topreliminary National Accounts data. This was a relatively muted

Quarterly Bulletin 2 2005
-2
0
2
4
6
J'05
DNOSAJJMAMFJ'04
DNOSAJJMAMFJ'03
DNOSAJJMAMFJ'02
Core (excluding Motor Trades)
All Businesses
Year-On-Year % – 3 Month Moving Average (SA)
Index of Volume of
Retail Sales
Chart 1
16
outcome, however, given developments in real disposableincome. Strong employment and earnings growth gave rise toquite a significant rise in incomes. Income tax grew more rapidlythan expected, albeit largely due to the impact of one-off factors,such as payments of tax owed on bogus non-resident accounts.While the rise in income tax receipts may have mechanicallylowered disposable income growth last year, these payments donot typically affect short-term consumption patterns. Recordedlevels of consumer confidence strengthened last year, albeitsomewhat unevenly. The general trend was positive but therewere some months when the recorded level of confidenceactually declined, suggesting that consumers remained cautious.Rising house prices, which are often associated with a decline inthe savings rate, do not seem to have boosted consumption inthe recent past. Paradoxically, high and rising house prices maybe contributing to maintaining savings at a high rate in order toaccumulate deposits for house purchases or make repaymentson new and relatively large mortgages. Equity release forconsumer spending purposes seems limited at this point in time.Older households, who may own property that has appreciated,do not seem to be increasing their consumer spendingsignificantly as a result.
The prospects for this year are for somewhat faster consumerspending growth. Disposable incomes are expected to risesignificantly again. Employment growth is expected to remainstrong, albeit slightly weaker than last year, and to beaccompanied by another significant rise in average earnings.Inflation is also set to remain relatively low, boosting the rise inincomes in real terms. Direct tax payments are also projected torise less rapidly than last year, further increasing disposableincome growth. Only another rise in the savings rate couldprevent an acceleration in consumer spending and this seems,on balance, unlikely in current circumstances. It seems morelikely that a continued rise in consumer confidence will lead to agradual strengthening of spending, although, of course, thisassumes away any negative shocks to the economy. On thisbasis, consumer spending growth should pick up to about 41⁄4
per cent this year. The indications are reasonably positive to date.The volume of retail sales rose by 6·8 per cent, year-on-year, inthe first two months of 2005, although excluding car sales, theincrease was a more modest 4·5 per cent. Car sales were upsignificantly, 7·4 per cent in year-on-year terms, in the first threemonths.
The growth in real disposable incomes may ease back slightly in2006 as employment growth decelerates somewhat and inflationmay edge up again. On the other hand, confidence shouldremain at a high level and there may be some support tospending as households begin to have access to maturing SSIAaccounts, although the greater proportion of these accounts willnot mature until 2007. The latter are not expected to have a

Quarterly Bulletin 2 2005
17
dramatic impact on spending with much of the funds beingtransferred to other savings vehicles or used to reduce existingdebt. It is likely, however, that they will have some impact onexpenditure, albeit much of it directed at purchases of importedconsumer durables. Against this background and taking intoaccount the fact that consumption growth has been relativelysubdued in recent years, the volume of consumer spendinggrowth may accelerate further to about 53⁄4 per cent in 2006.
Government Consumption
The volume of government consumption has tended to growrelatively modestly in recent years, certainly by comparison withthe very strong rates of growth experienced up to 2002. On thebasis of the available information, there seems likely to be somepick-up in the volume growth in government consumption thisyear to about 41⁄2 per cent. It is assumed that growth ingovernment consumption will ease back next year to about 21⁄4
per cent, more in line with the experience of recent years. Thisis in the nature of a technical assumption, however, based oncurrently available information. The Budget for 2006 willdetermine the final outcome in this regard.
Investment
Gross domestic fixed capital formation grew rapidly last year, by9·2 per cent according to the Quarterly National Accounts. Thiswas the highest rate of growth since 1999 and three times as fastas in each of the previous two years. The surge in investmentlast year was driven by a marked upturn in both categories ofinvestment expenditure, with building and constructioninvestment up 7·7 per cent and machinery and equipmentinvestment up 11·4 per cent in the year. In particular, the firsthalf of 2004 was characterised by strong investment, due torecord levels of house building and substantial investments intransport equipment. Activity levels slowed somewhat in thesecond half of the year although investment expenditure, inseasonally adjusted terms, was still up by 4·5 per cent, quarter-on-quarter, in the fourth quarter of 2004.
Building and construction investment grew markedly last yeardue to significant growth in the residential house building sector.In the first six months of 2004, this category of investment wasup about 20 per cent, year-on-year. This contributed to a recordnumber of housing completions last year, with some 77,000 newcompletions, up nearly 12 per cent on the previous record in2003. Residential investment growth levelled off, however, in thesecond half of the year, with investment up by 5 per cent. Itseems that house building levels are beginning to hit a plateauand should peak this year. Other categories of building andconstruction grew by about 3 per cent last year, which largelyreflected a weakness in public investment.

Quarterly Bulletin 2 2005
18
Machinery and equipment investment increased strongly in2004, by 11·4 per cent after growth of 1·2 per cent in 2003. Thisrecovery was driven by significant and predominantly one-offinvestments in transport equipment in the first half of the year.The pick-up in equipment investment is reflected in importfigures with capital imports up by 13 per cent last year, afterdeclining sharply in 2003. The underlying picture, however, wassomewhat weaker when transport investments are excluded asevidenced by the subdued performance of the manufacturingsector in 2004.
Looking ahead to this year and next, a much slower rate ofgrowth in construction investment is envisaged. This is based onthe fact that current levels of house building are in excess of theeconomy’s medium-term requirements. In addition, there is verylimited scope for further increases in housing output given thetightness in the labour market at present, with numbersemployed in the sector up 10 per cent last year alone. A furtherincrease in employment of this magnitude is highly unlikely,particularly given very low unemployment and with the sectoralready accounting for 12 per cent of total employment, whichis exceptionally high by international standards. Furthermore,house price data from last year and for the first quarter of 2005show that house price increases have moderated, which isindicative of demand and supply coming more into line. As aresult, the number of house completions is forecast to peak thisyear at about 78,000 units, marginally up on last year’s outcome,before declining in 2006. The non-residential construction sector,however, is expected to grow somewhat more rapidly in 2005and 2006 given the continuing need for infrastructuralinvestment and with an improving outlook for the commercialsector. For 2005 as a whole, construction investment is forecastto grow by just over 4 per cent, followed by growth of 21⁄2 percent in 2006.
In terms of equipment investment, a reasonably positiveperformance is expected this year and next, given that theprospects in Ireland’s main trading partners appear favourable.In particular, a recovery in the modern sectors of the economy(which include the ICT, chemicals and pharmaceuticals sectors)is envisaged in 2005 and 2006 and this should lead to some pick-up in investment. For 2005, machinery and equipmentinvestment is expected to grow by 4 per cent, with growth of 5per cent in 2006. These forecasts, combined with the estimatesfor the construction sector, mean that overall investment isforecast to grow by 4 per cent this year and by 31⁄4 per cent in2006.
Stock Changes
Preliminary National Accounts data confirm that stocks made anegative contribution to growth last year. While this pattern was

Quarterly Bulletin 2 2005
-25
-20
-15
-10
-5
0
5
10
15
20
25
30
Q4Q3Q2Q1'04
Q4Q3Q2Q1'03
Q4Q3Q2Q1'02
Q4Q3Q2Q1'01
Exports
Imports
Value of
External Trade
Chart 2
% Year-On-Year Seasonally Adjusted
19
expected, the scale of the negative contribution was larger thananticipated. This outcome reflected the fact that there was a verysignificant accumulation of stocks in 2003. The prospects for thisyear are for a positive contribution to growth with continuinggrowth in the economy leading to some planned stockaccumulation. This positive contribution may be a bit larger thanpreviously expected given the weak outcome for 2004. A further,but smaller, positive contribution to growth is projected for 2006.
Merchandise Trade and the Balance of Payments
Merchandise Trade
Merchandise exports grew somewhat more slowly than wasinitially expected last year. This was due to a relatively subduedperformance by the broad chemicals sector following very stronggrowth in previous years. There was a recovery in the outputgrowth of the ICT sector, however, and other more traditionalexporting sectors, such as food, performed reasonably well,particularly in the early part of the year. The monthly trade dataand the National Accounts data give a more accurate picture ofdevelopments in the exporting sectors than the monthlyindustrial production data, which suggested a rather weak picturebut is overly influenced by developments in the chemicals sector(see Box A). Merchandise import volumes also grew by less thananticipated partly reflecting the pattern of exports, although theydid pick up somewhat in the latter part of the year. Overall,however, output growth was less import-intensive in itscomposition than might have been expected at the beginning ofthe year, with somewhat more growth coming from theconstruction and services sectors.
The prospects for export growth this year remain favourable.Import demand in the country’s main trading partners isexpected to be fairly robust, albeit somewhat less so than in2004, reflecting a slowdown in the growth rates of some majoreconomies such as the US. Exports will also be assisted by thereasonably positive trend in foreign direct investment as well asa continued recovery in the ICT sector. These factors may besufficiently strong to allow export volume growth to pick upsomewhat from last year’s outturn, although a return to the largemarket share gains of the 1990s does not seem to be in prospect.
Table 2. Merchandise Trade (Adjusted) 2004, 2005e and 2006f
2004 % change in 2005e % change in 2006f
\ million Volume Price \ million Volume Price \ million
Merchandise Exports 79,450 51⁄2 −11⁄2 82,457 53⁄4 11⁄4 88,320
Merchandise Imports −47,585 51⁄4 − 1⁄4 −49,932 51⁄2 21⁄4 −53,830
Trade Balance 31,865 32,525 34,490
(% of GNP) (26) (243⁄4) (241⁄4)

Quarterly Bulletin 2 2005
20
Box A: The Discrepancy Between Industrial Production Output Data and
Quarterly National Accounts Industry Data
Chart 1 graphs the growth rates of output of the industrial sector accordingto two alternative CSO sources; the Industrial Production release and thequarterly National Accounts. Last year the Industrial Production indexindicated that industrial output grew at a rate of 0·7 per cent, while thequarterly National Accounts pointed to a markedly higher growth rate of3·5 per cent. Indeed, over the last few years the two growth rates haveoften differed. Part of the difference between the Industrial Productionseries and the published National Accounts industry figures can beattributed to the inclusion of building and construction output in the latter.This has been netted out of the chart below so that the two series coverthe same spectrum.
0
5
10
15
20
25
30
35
Royalties Imports
0%
2
4
6
8
10
12
14
16
18
Indu
stria
l Out
put
Yea
r-on-
Yea
r G
row
th
Ro
yalti
es Im
port
s Y
ear-o
n-Y
ear
Gro
wth
National AccountsIndustrial Production
20042003200220012000
Chart 1 Industrial Output Measures – Why the Difference?
% %
The methodology used to calculate the National Accounts figures involvesapplying the Industrial Production monthly volume indices to the NationalAccounts base year’s gross value-added, including royalties. In addition, theCSO, when compiling the National Accounts, also examine the consistencyof the statistical returns of individual large enterprises. As a result, the value-added figures extrapolated from the monthly Industrial Production indexmay be occasionally adjusted. These adjustments are also reflected in theabove figures.
Royalty and licence payments, which are classified as imports of servicespaid by foreign firms (mostly in the chemicals and ICT sectors) based inIreland back to their parent companies need to be deducted from theNational Accounts definition, since they are regarded as inputs intoproduction and not value-added. In the Industrial Production series, noaccount is made for increasing use of service inputs over time. As the chartshows (the right axis measures the growth rate of these royalty payments— classified as imports), these royalty payments have been increasing at ahigh rate since 2000, dropping sharply in 2004. This sudden decrease inthe growth rate of royalty payments last year served to increase the growthrate of industrial output under the National Accounts definition, relative tothe Industrial Production measure, where no deduction was made.

Quarterly Bulletin 2 2005
21
An improvement partly depends, however, on a strongerperformance by the chemicals sector compared with 2004. Italso assumes that there is no major change in the euro exchangerate that would cause a significant loss of competitiveness. Onthis basis, an increase of about 51⁄2 per cent might be expected.On the basis of the same assumptions, there is likely to be furthergrowth of about 53⁄4 per cent in merchandise export volumesnext year against a background of broadly similar export marketgrowth and little change in competitiveness. Import volumegrowth is also expected to pick up this year in response tosomewhat higher growth in merchandise exports and personalconsumption. A similar pattern of somewhat stronger importgrowth is expected next year.
Merchandise trade prices were forced down by the appreciationof the euro in the latter part of last year and this pressure is likelyto have persisted into the early part of this year. The higher levelof oil prices was undoubtedly a factor in the terms of trade losssuffered last year with import prices not falling as sharply asexport prices. The prospects for this year depend largely onexchange rate developments. On the basis of the technicalassumption of unchanged exchange rates, the downwardpressure on trade prices should ease as the year progresses, butboth import and export prices will probably still be marginallydown, on average, this year compared with last year. Oil pricesare assumed to evolve in line with the futures market, whichsuggests that there may be a small easing in prices this year andnext year. Nevertheless, a further terms of trade loss is expectedthis year, although it may be somewhat less than thatexperienced last year. Using the same technical assumptions,there should be a return to small increases in trade prices inline with competitors’ prices next year. These developments are,however, sensitive to the technical assumptions used and eventssuch as a significant appreciation of the euro could obviouslychange these prospects significantly. On the assumption thatsuch events do not occur, the merchandise trade balance shouldincrease from \31·9 billion last year to about \32·5 billion thisyear and \34·5 billion in 2006.
Services, Factor Incomes and International Transfers
In contrast to merchandise exports, exports of servicesperformed more strongly than expected last year. The favourableperformance was mainly in the areas of computer, business andfinancial services rather than in the more traditional sectors suchas tourism and transport where growth was more muted. Theshift towards increased services exports is likely to continue inthe future, reflecting the pattern of inward investment in sectorssuch as computer services and financial services. As a result,further significant growth in services exports is expected boththis year and next year. The growth in imports of services, mainlydriven by the multinational sector, was muted last year but can

Quarterly Bulletin 2 2005
22
be expected to pick up, assuming a stronger performance byother sectors.
The balance of factor income flows was less negative thanexpected last year. This mainly reflected developments on thecredit side with inflows of profits accruing to firms headquarteredin Ireland rising significantly. Outflows were adversely affectedby the relatively modest performance of the foreign-owned high-technology sectors. The result was that GNP growth exceededGDP growth last year in a reversal of the usual pattern. It is worthrecalling the point made in previous Bulletins, that thesemeasures can be affected, particularly in Ireland’s case, not onlyby the large number of foreign multinationals operating in thecountry but also by a relatively small number of multinationalsheadquartered in Ireland with significant operations abroad (seeBox A on page 13 of the Spring 2004 Bulletin). It may be unwise,therefore, to attribute too much significance to short-termmovements in these variables caused by factor income flows. Itis expected that the more usual pattern will reassert itself boththis year and next year with some pick-up in factor incomeoutflows, although this depends, to some extent, on a recoveryin output in the broad chemicals sector. Inflows may also notgrow as rapidly as last year but it has to be conceded thatdevelopments will be driven by a small number of firms and are,as a result, unpredictable.
The international transfer balance deteriorated as expected lastyear and a further deterioration is projected both this year andnext year. This reflects an almost inevitable pattern as thecountry’s improved income position relative to others means thatit attracts less transfers and has to contribute more, for example,to the EU budget. Taking the trends in the various componentsof the current account together suggests that the overall deficitwill remain broadly unchanged this year at about \0·5 billion(about 1⁄2 per cent of GNP) with a small decline likely to about\0·2 billion next year (about 1⁄4 per cent of GDP).
Capital and Financial Account
There was a small surplus of \364 million on the Capital Accountin 2004, which is broadly in line with a \370 million surplus in2003. The Financial Account showed a credit balance of \4·5billion in 2004. This credit balance was due to direct investmentand other investment inflows, which were largely offset byportfolio investment outflows of \20·9 billion. The balancingitem, net errors and omissions, for the balance of payments as awhole, was a debit of over \4 billion for 2004.
Inward direct investment of \11 billion in 2004 was almost halfof direct investment in Ireland of \24 billion in 2003. Thisdecrease was principally due to a sizeable reduction inreinvested earnings in Ireland of \6·2 billion in 2004, and a

Quarterly Bulletin 2 2005
23
Table 3. Balance of Payments 2004, 2005f and 2006f
| million
Current Account 2004 2005f 2006f
• Merchandise Trade Balance (adjusted) 31,865 32,525 35,090
• Services −9,118 −8,083 −8,063
• Net factor Income from Rest of the World −23,727 −25,181 −27,331
• Current International Transfers 332 224 74
Balance on Current Account −648 −515 −230
(% of GNP) (−1⁄2) (−1⁄2) (−1⁄4)
Capital and Financial Account 2003 2004
Full Year Quarter 4
Balance on Capital Account 370 364 362
Financial Account
• Direct Investment 20,686 2,135 −5,622
• Portfolio Investment −49,114 −20,856 −12,263
• Other Investment 29,258 22,009 19,136
• Reserve Assetsa 1,770 1,177 −18
Balance on Financial Account 2,596 4,465 1,233
Net errors and omissions −1,070 −4,179 −1,832
aChange in reserves on a transactions basis, i.e. excluding valuation adjustments. A minus figure equals a net increase in reserve.
reduction in equity investment in Ireland of \5 billion. Outwarddirect investment grew by \6 billion in 2004, with other capitalabroad accounting for a large part of this increase.
Net portfolio investment outflows amounted to \20·9 billion in2004, which was considerably lower than net outflows of \49billion in 2003. Debt instruments accounted for over 70 per centof portfolio investment outflows of \130 billion, with bonds andnotes comprising the largest component. Equity liabilitiesaccounted for \65 billion of inward portfolio investment of \109billion in 2004.
Financial transactions, under the ‘other investment’ heading —mainly loans, currency and deposits — resulted in net inflows of\22 billion. All of these net inflows arose from transactionsinvolving non-IFSC entities.
The official external reserves amounted to \2,141 million in thefourth quarter of 2004. This included a valuation write-down of\27 million in December 2004.
Output Trends and the Labour Market
Industry and Services Output
Since the peak in 2000, growth in the output of the overallmanufacturing sector has been on a steady downward trend.

Quarterly Bulletin 2 2005
-10
0
10
20
30
40
50
Q4Q3Q2Q1'04
Q4Q3Q2Q1'03
Q4Q3Q2Q1'02
Q4Q3Q2Q1'01
All Other Manufacturing Sectors
Modern Sector
Manufacturing
Volume of Production
in Manufacturing
Chart 3
Year-On-Year % Change
24
Table 4. Industry and Manufacturing Output, Annual Percentage Change
Manufacturing All Industries
Year Total Modern Sector Other Sectors
1996 81⁄2 8 133⁄4 21⁄21997 191⁄4 171⁄2 291⁄4 41998 211⁄4 20 301⁄2 41⁄21999 15 143⁄4 211⁄4 32000 153⁄4 151⁄4 201⁄4 51⁄22001 10 10 143⁄4 21⁄42002 71⁄2 71⁄2 12 −1⁄22003 41⁄2 5 6 32004 1⁄2 3⁄4 −1⁄2 32005f 3 3 3 32006f 51⁄4 51⁄4 6 3
Average 1996-2006 91⁄4 91⁄4 63⁄4 31⁄4
Now that full year figures for 2004 are available, it is apparentthat the slowdown in manufacturing documented in the lastBulletin continued throughout the year, although the extent ofthe slowdown varies according to data sources (see Box A). Thereturn to potential economic growth in 2004, it would seem, hasnot spread to the entire manufacturing sector.
The CSO industrial production index indicates that the volumeof manufacturing output increased by only 0·4 per cent in 2004,compared with the previous year, its lowest rate of increase inover twenty years. In a reversal of historical trends, the output ofthe ‘modern’ sector (largely the chemicals and ICT firms) actuallycontracted by 0·4 per cent last year, whereas the output of the‘traditional’, mainly Irish-owned firms, increased by a relativelyhealthy 3·1 per cent over the same period.
The poor performance of the ‘modern’ sector was not, however,across the board. The ICT sector (mainly electrical and opticalequipment) experienced significant year-on-year growth of 11·6per cent in 2004, further progressing its recovery since the lowpoint of 2002. The reproduction of recorded media sub-sector,also part of the ICT sector, recorded strong year-on-year growthof 31 per cent in 2004. The performance of the overallmanufacturing sector last year was, however, heavily influencedby weakness in the chemicals sector but, again, performancewithin this sector varied significantly. Output of the overallchemicals sector decreased by 9·3 per cent in 2004, drivenmainly by weakness in the basic chemicals sub-sector (typicallyfirms that manufacture the raw materials for pharmaceuticals),where output last year was down 15·9 per cent on the previousyear. This sector, in particular, has a large share in gross valueadded and, therefore, a significant weighting in the overall series.Developments in this sector can easily influence the overallmanufacturing output figure. The pharmaceuticals, medicalchemicals and botanical products sub-sector, on the other hand,
Quarterly Bulletin 2 2005
25
performed well last year, with output up 29 per cent on theprevious years output.
The ‘traditional’ and mainly Irish-owned sector posted steadyreturns in 2004, where output increased by 3·1 per cent, year-on-year, led mainly by positive developments in the food sector.Irish manufacturers that have re-orientated production to highervalue added products which often involve considerably morescientific research and technological production than waspreviously the case, reported strong growth. The ‘other foods’sub-sector of the industrial production index, which typicallycaptures these goods, increased output by a sizeable 17 per centlast year. Production in the overall food sector increased by 9·1per cent, year-on-year, in 2004. There was weakness, however,in the output of the beverages (down 5 per cent) and tobacco(down 28·9 per cent) sub-sectors.
Turning to more recent trends (provisional industrial productionfigures for February of 2005 were the latest available data at thetime of writing), and bearing in mind that monthly productionfigures are often volatile, the ICT sector continued to recordstrong growth, with output over the three-month periodDecember 2004 to February 2005 increasing by 20·3 per cent,relative to the same period last year. This was largely as a resultof significant output growth in the office machinery andcomputers sub-sector, up 24·8 per cent in the same three-monthperiod, year-on-year, and strong year-on-year growth in the radio,television and communication equipment sub-sector — up 26·9per cent on the same period last year. The reproduction ofrecorded media sub-sector also performed well, registering year-on-year growth of 41·7 per cent over the same period.
The weakness of the overall chemicals sector reported in the lastBulletin seems to have continued into this year, with December2004 to February 2005 output down 14·9 per cent on the sameperiod last year, although, the seasonally adjusted figure mayindicate some more recent moderation in this contraction,registering a slight contraction of 0·9 per cent over the precedingthree-month period. However, as stated previously, performancewithin the sector is varied. While the year-on-year growth rates inthe basic chemicals sub-sector were still extremely poor, there wasa slight increase in the three-month (December 2004 to February2005) seasonally adjusted output figure of 0·3 per cent, pointingto some possible pick-up in output growth, or at least somemoderation in the rate of decline. The pharmaceuticals sectorshowed strong increases in the three-month year-on-year figure (up28·2 per cent) but showed signs of a deceleration in the seasonallyadjusted three-month quarter-on-quarter figure, which recorded acontraction of 7·5 per cent in output over the preceding three-month period. On the indigenous front, the ‘other foods’ sub-sector, showed reasonably solid growth, registering growth on a

Quarterly Bulletin 2 2005
26
seasonally adjusted basis over the same three-month period of 2·3per cent compared with the previous three-month period.
Industry figures in the latest quarterly National Accounts (Q4 of2004) paint a somewhat more positive picture than the industrialproduction figures quoted above but are not, however, directlycomparable (for an explanation of the difference — see Box A).While only aggregate industry data are available, they indicatethat output growth in the industrial sector (net of building andconstruction) increased by approximately 3·1 per cent, year-on-year, in 2004. Within 2004, however, the quarterly year-on-yearprofile revealed some more recent weakness, reporting outputgrowth of 8, 3·7, 3·8 and -2·2 per cent in the first, second, thirdand fourth quarters, respectively.
The most recent survey evidence for the manufacturing sectorfrom the NCB Purchasing Managers Index (PMI) Report onManufacturing provides some less than positive evidence for thesector. In a turnaround since the last Bulletin, the Report showsthat rate of expansion of the sector fell for a third consecutivemonth. The PMI — an indicator designed to provide a singlefigure measure of the economic health of the manufacturingsector — fell consecutively from a December 2004 value of 53·1to 50·7 in March 2005. Although a value above 50 indicatesimproved conditions, the trend appears somewhat negative. TheReport highlighted that output had expanded at weaker rates inMarch with new export orders showing a slight decline. Panelfirms attributed the fall to weaker demand in export markets andstrong competition from foreign rivals.
For the current year, assuming a broadly positive externalenvironment and no further adverse movements in exchangerates and oil prices, the output of the manufacturing sector isforecast to be up on last year to the tune of about 3 per cent. Thecontinued resurgence of the ICT sector, along with the steadyperformance of some indigenous sectors should ensure areasonable outturn. Due to the unusually large weighting of thechemicals sector, however, and its current volatility, the finaloutturn is somewhat uncertain. With prospects for the globalpharmaceuticals and chemicals sectors (often the inputs topharmaceuticals) being somewhat uncertain at the moment, therisks to overall industry output growth would appear to be onthe downside. It is worth bearing in mind, however, that althoughthe chemical sector might contribute heavily to value added, itseffect on the domestic economy in terms of employment andincome is not that large. For next year, again assuming noadverse developments on the global economic stage, outputgrowth in the manufacturing sector is forecast to pick up toabout 5·2 per cent. This improvement, however, depends on theassumption of stronger growth in the volatile chemicals sector.

Quarterly Bulletin 2 2005
27
The latest available indicators for the services sector, on the otherhand, point to a much more positive picture than that for themanufacturing sector. The latest available PMI Report onServices (March) indicated that activity in the Irish service sectorincreased at its fastest rate in nearly three years. Surveyed firmsreported that the increase in activity stemmed from higher levelsof new business. Levels of confidence about future businessactivities also remained high. The quarterly National Accountsindicate that the overall service sector grew by a healthy 3·9 percent in 2004. Activity in the distribution, transport andcommunication sub-sector increased by 3·4 per cent over theprevious year, while the ‘other services’ category expanded at arate of 4·5 per cent. Furthermore, the latest employment data forthe services is very strong (see Labour Market section).
For the construction sector, output growth seems set to moderatethis year, as the supply of housing comes more into line withdemand. Investment in building and construction this year isforecast to increase by about 3·8 per cent with a correspondingdecline in the rate of output growth. The level of housecompletions is set to remain high this year and, looking forward,non-housing construction should accelerate to offset the impact ofa peak in housing output. Nevertheless, over the medium term thesector will probably have to adjust downwards as a proportion ofoverall output and employment in the economy.
Agricultural Output
Preliminary estimates for output and income in the agriculturalsector indicate that 2004 was a relatively favourable year for theagricultural sector. The value of agricultural output increased by3·1 per cent, while agricultural income (operating surplus)increased by 3 per cent. The volume of agricultural output lastyear increased only marginally, by 0·6 per cent, with outputprices up approximately 2·5 per cent. The volume ofintermediate consumption (inputs) decreased by approximately1·6 per cent, as input costs increased by about 2·7 per cent. Netsubsidies for the year were unchanged.
The latest available quarterly National Accounts show that thevolume of production in the broader agricultural sector (inclusiveof forestry and fishing) increased by 2·1 per cent in 2004. Thequarterly profile reveals that production increased strongly in thefirst half of the year, followed by a deceleration in the latter half,with growth of 5·8, 4, -0·7, and -3·4 per cent, year-on-year,respectively, in the four quarters of the year. There was weaknesson a seasonal adjusted basis in the latter half of the year, withoutput falling by 2 per cent and 1·2 per cent in the third andfourth quarters, relative to the previous quarters.
This year is expected to be a broadly similar one for theagricultural sector. There are, however, a number of risks, mainly

Quarterly Bulletin 2 2005
28
Table 5. Summary of Agricultural Output and Income 2004e, 2005f and 2006f
2004e % change in 2005f % change in 2006f
\ million Value Volume Price \ million Value Volume Price \ million
Goods Output at Producer Pricesa 4,968 23⁄4 1⁄2 21⁄4 5,104 1⁄2 −11⁄2 2 5,130
Intermediate Consumption 3,409 −1 −1 2 3,375 −2 −3 1 3,307
Net Subsidies plus Services Outputless Expenses 1,475 0 1,475 0 1,475
Operating Surplus 2,144 23⁄4 2,203 1 2,225
a Including the value of stock changes.
on the downside, inherent in any projection — principally,adverse weather conditions, further strength of the euro againstthe dollar and the next phase of the Medium-Term Review of theCommon Agricultural Policy. In terms of beef slaughterings, itappears unlikely that any major de-stocking associated withdecoupling will take place this year and any fall in output shouldbe relatively minor. Agricultural output is forecast to rise by asimilar amount as 2004, somewhere in the region of 23⁄4 per cent,with agricultural incomes also increasing by about 23⁄4 per cent.For next year, assuming no adverse developments (weather,further exchange rate movements, favourable global economicclimate) agricultural output is forecast to remain broadlystatic, with some decoupling-related decreases in volume ofapproximately 1·5 per cent. Agricultural incomes in 2006 areforecast to increase by approximately 1 per cent.
The Labour Market
Total employment in the economy grew by 3·0 per cent onaverage last year, with numbers at work up by 54,400, based ondata from the Quarterly National Household Survey (QNHS).This marked the fastest rate of growth since 2001. The labourmarket strengthened in the second half of 2004, with numbersat work up by 3·6 per cent annually in the fourth quarter toexceed 1·89 million. Furthermore, most of the new jobs createdwere in full-time positions with part-time employment accountingfor just under one fifth of the change in employment.
Substantial growth was recorded in the construction sector lastyear, with an additional 19,100 persons employed (+9·8 percent). There were also significant gains in certain parts of theservices sector with numbers employed in the ‘‘other servicessector’’ increasing by 12,100 (+12·2 per cent) and an additional11,800 persons employed in financial and business services (+5·1per cent). Numbers at work in the health and education sectorincreased by 9,900 (+3·4 per cent) and by 9,200 in wholesaleand retail trades sector (+3·6 per cent). Employment declined inmanufacturing last year by 3,100 (−1·0 per cent) and by 3,500

Quarterly Bulletin 2 2005
29
Table 6. Employment and Unemployment 2004, 2005e and 2006f
(annual average ’000) 2004 2005e 2006f
Agriculture 117 115 112Industry (including construction) 516 518 516Services 1,232 1,274 1,318
Total Employment 1,865 1,907 1,946Unemployment 87 87 85
Labour Force 1,952 1,994 2,031Unemployment Rate (%) 41⁄2 41⁄4 41⁄4
Note: Figures may not sum to the total because of rounding.
in the hotels and restaurants sector (−3·0 per cent). Agriculturalemployment also fell by 2,600 persons (−2·2 per cent) last year.
The labour force grew by 2·8 per cent last year, which was thefastest rate of increase since 2000. By the end of 2004, therewere approximately 1·98 million persons in the labour force. Thisincrease was driven by increased labour force participation anddemographic factors. In terms of the former, there was a rise inthe labour force participation rate last year to 60·7 per cent from60·2 per cent. In particular, the contribution of higherparticipation from females drove much of the growth in the workforce, with the female participation rate rising to 50·2 per centfrom 49·6 per cent in 2003. In addition, net migration isestimated to have added significantly to the labour force last yearaccounting for approximately one third of the increase, roughly18,000 persons. Given the growth in employment and the labourforce last year, the unemployment rate declined furtheraveraging approximately 4·4 per cent, down from 4·6 per centin 2003.
The labour market entered 2005 with considerable momentum,given seasonally adjusted data which show that numbers at workgrew by 1·2 per cent, quarter-on-quarter, in the fourth quarter of2004, due to very large increases in employment in construction(+3·5 per cent), in the public sector (+3·7 per cent) and in partsof the services sector. The labour force grew in seasonallyadjusted terms by 1·3 per cent, quarter-on-quarter, with theunemployment rate at 4·4 per cent at the end of 2004. Datafrom the Live Register for the first three months of 2005 showthat numbers on the Register, in seasonally adjusted terms, fellby 1·9 per cent on the preceding three-month period. In addition,the standardised unemployment rate averaged 4·2 per cent inthe first quarter of 2005, down from 4·3 per cent in the finalquarter of 2004.
The information above combined with overall growth forecastsfor the year suggest that another strong year is in prospect forthe labour market. It seems likely, however, that growth in theconstruction sector, which accounted for over a third of all jobs

Quarterly Bulletin 2 2005
30
created last year will slow, given investment forecasts andpossible capacity constraints within the economy reflectingeffective full employment conditions. It is envisaged that thenumbers employed in the services sector will continue toincrease and there may well be some very modest recovery inmanufacturing employment. For 2005 as a whole, employmentis expected to grow by approximately 21⁄4 per cent, slightly inexcess of the anticipated growth in the labour force. As a result,the unemployment rate is forecast to decline to 41⁄4 per cent onaverage in 2005.
Looking ahead to 2006, there is likely to be some fall-off inemployment in the labour intensive construction sector, as theresidential house-building sector slows. This is based on thepresumption that house building levels will decline next year, ascurrent levels of house building are in excess of the economy’smedium-term requirements. While some construction workersmay find alternative employment in the non-residentialconstruction sector, there is likely to be some displacement. Theanticipated slowdown in construction should also lead to a moremodest rate of growth in the labour force as net immigrationmoderates. The services sector is expected to grow strongly in2006 spurred on by higher consumer spending. Overall, totalemployment is forecast to grow by about 2 per cent next year.The number of persons in the labour force is expected to exceed2 million next year, growing by just under 2 per cent, with theunemployment rate remaining at 41⁄4 per cent.
The Public Finances
2004 Outturn
According to Ireland’s March 2005 EDP notification2, the outturnfor the General Government3 Balance in 2004 was a GeneralGovernment Surplus (GGS) of 1·3 per cent of GDP. Thisrepresents an upward revision of 0·4 per cent of GDP relativeto the estimate reported in the 2005 Budget announced at thebeginning of December last. This improved outcome reflected astronger than expected economic performance in 2004 as wellas a number of one-off effects on the revenue side.
2 EMU Member States are required to report their Excessive Deficit Procedure (EDP)notification to the European Commission on a bi-annual basis. The reporting deadlinesoccur on 1st March and 1st September each year. In the March 2005 EDP notification, theDepartment of Finance provided details of the actual 2004 deficit and debt levels, alongsideits projections for 2005.
3 ‘‘General Government’’ refers to Central Government (i.e. Exchequer), Local Government,the Social Insurance Fund and the National Pensions Reserve Fund; the Exchequer refersto Central Government alone. It is noteworthy, however, that differences exist between theaccounting practices of the Exchequer and General Government data. Exchequer data isrecorded on a cash basis, which means that the Exchequer balance can be affected by thesometimes arbitrary advancement or deferral of cash payments whilst General Governmentdata generally follows an accruals-based concept, which limits the scope for inter-yearadvancements and deferrals affecting the General Government Balance.

Quarterly Bulletin 2 2005
31
Table 7. Exchequer Returns at End-March 2005
2004 — 2005 — End-March 2005Outturn Budget Outturn
Estimate
% change % ofyear-on- Budget
Outturn \ million % change \ million year estimate\ million
Current Expenditure— Central Fund Servicesa 3,584 4,012 +11·9 638 −19·9 15·9— Net Voted Expenditureb 27,179 29,997 +10·4 7,126 12·0 23·8
Total 30,763 34,009 +10·6 7,765 8·4 22·8
Current Revenue— Tax revenue 35,581 37,505 +5·4 9,024 12·6 24·1— Non-tax revenuec 802 596 −25·7 105 14·1 17·6
Total 36,383 38,101 +4·7 9,129 12·7 24·0
Current Budget Surplus +5,620 +4,092 +1,365
Capital Budget Deficit −5,587 −7,080 −484
Exchequer Surplus +33 −2,988 +880
General Government Balance +1·3 −0·8(% of GDP)(+: surplus/−: deficit)
a Debt servicing, judicial salaries and pensions and EU Budget contribution.b Government current expenditure on areas such as Social Welfare, Health, etc.c Central Bank surplus income, National Lottery surplus, interest and dividends, etc.
2005 Projections
The forecast General Government Balance for 2005 included inthe March 2005 EDP notification is a deficit of 0·7 per cent ofGDP. This compares with a forecast deficit of 0·8 per cent ofGDP assumed in the 2005 Budget. The EDP figures indicate thatGeneral Government Debt is estimated to decline marginallyfrom 29·9 per cent of GDP at the end of 2004 to 29·5 per centof GDP in 2005.
End-March 2005 Exchequer Returns
The Exchequer Returns for end-March 2005 show an Exchequersurplus of \880 million for the first three months of 2005. Thiscompares with an Exchequer surplus of \272 million in the firstquarter of 2004 and a budgeted deficit of \2,988 million for2005 as a whole. This reflects stronger than anticipated taxrevenue combined with below profile total expenditure levels forthis stage of the year. Table 7 contains the main details ofrevenue and expenditure.
Current Revenue
Total current revenue in the first quarter of 2005 amounted to\9,129 million, an increase of 12·7 per cent compared with thesame period in 2004. Non-tax revenue amounted to \105million; this compares with \92 million at the same time last yearand is broadly in line with expectations. Tax revenue, at \9,024million, is 12·6 per cent higher, year-on-year, and \221 million(or 2·5 per cent) higher than the profile of expected tax revenue

Quarterly Bulletin 2 2005
32
to end-March published at end-January. This overshoot reflectsstronger than expected growth in VAT and Stamp Duty receipts.VAT receipts, which were \139 million ahead of the expectedprofile, accounted for the bulk of this overshoot. This reflectedrelatively strong consumer demand and a continuation of highlevels of activity in the construction sector. Stamp Duty receiptsincreased by 28·9 per cent on the same period last year largelyas a result of the continued buoyancy of the housing market. Inspite of the current favourable labour market conditions, incometax receipts were \12 million lower than their expected profile —Budget Day income tax changes may account for this shortfall.
The overall difference between current revenue and currentexpenditure gave a current budget surplus of \1,365 million inthe first quarter of 2005. This compares with a \942 millioncurrent budget surplus for the same period in 2004 and abudgeted surplus of \4,092 million for 2005 as a whole.
Capital Budget
Exchequer borrowing for capital purposes amounted to \484million at end-March 2005 which compared with \670 millionfor the same period last year and a figure of \7,080 million forthe year as a whole. Net voted capital expenditure amounted to\414 million, \137 million below expected profile. According tothe Department of Finance, timing factors account for some ofthis variation. The carryover of unspent allocations4 from 2004facilitated supplementary capital expenditure in the first quarterof 2005 totalling \131 million. Non-voted capital expenditure,which was broadly in line with expectations, included the firstquarter of the annual one per cent of GNP contribution to theNational Pensions Reserve Fund. Capital receipts amounted to\259 million, which was 24 per cent lower, year-on-year.
Exchequer Financing
As the Exchequer surplus of \880 million in the first three monthsof 2005 was more than double that of the same period last year,net Exchequer borrowing was lower in the first three months ofthis year — net exchequer borrowing in the first quarter of 2005was \1·2 billion, compared with \1·8 billion in the same periodlast year. Table 8, which shows the source and application ofExchequer funds, indicates that Exchequer borrowing waspredominantly short-term in nature — net issuance of commercialpaper amounted to \894 million in the first three months of2005, more than double that for the same period last year.Repayment to ministerial funds amounted to \155 million in thefirst quarter of 2005. This compares with borrowing fromministerial funds to the tune of \102 million in the first three
4 Under the five year multi-annual envelope scheme announced in the 2004 Budget, unspentcapital allocations, up to a maximum of 10 per cent, can be carried over to the next year.

Quarterly Bulletin 2 2005
33
Table 8. Source and Application of Funds
\ million January to January toMarch 2004 March 2005
1. Borrowing (−)/repayments (+): −1,799 −1,165Irish Government bonds listed on the Irish Stock Exchange −1,370 −133Other Irish Government public bond issues 66 0EIB loans 1 0Medium-Term Notes 0 201Private Placements 0 0National saving schemes −105 −111Commercial paper −415 −894Miscellaneous debt 126 −382Borrowing from ministerial funds −102 155
2. Increase (+)/decrease (−) in Exchequer deposits and other balances: 2,071 2,045Increase (+)/decrease (−) in Exchequer balance 2,011 1,872Increase (+)/decrease (−) in other bank deposits 0 270Increase (+)/decrease (−) in other balances 60 −97
Exchequer Surplus (1+2): 272 880
months of 2004. Net issues of Irish Government bonds listed inthe Irish Stock Exchange amounted to \133 million in the firstquarter of 2005 compared with \1·4 billion for the same periodin 2004. Net Exchequer borrowing combined with the Exchequersurplus resulted in an increase in Exchequer deposits and otherbalances. This increase amounted to \2 billion in the first quarterof 2005.
Conclusion
The end-March Exchequer Returns indicate relatively favourabletrends in both revenue and expenditure compared to the targetsset in the 2005 Budget. Tax revenue during the first quarter of2005 was \221 million above its expected profile published atend-January while total expenditure levels have been runningbelow profile for this stage of the year. This favourable outturnon the revenue side results from strong economic activity, whichhas had positive implications for cyclically sensitive revenuestreams — in particular, VAT. According to the Department ofFinance, timing issues account for the below profile expenditureoutcome.
If these early positive trends are sustained for the remainder of2005, public finance targets will be comfortably achieved thisyear. One factor, which may affect this favourable position,however, is the cost to the Exchequer of reimbursing recipientsof long-term public care for the elderly. On the other hand, thepublic finances may benefit by more than expected from theone-off boost to tax receipts arising from the RevenueCommissioner‘s investigation into undisclosed tax liabilitiesrelating to funds invested in life assurance products. Thus, whilefirst quarter Exchequer Returns data augur well for publicfinances, it is too early at this stage to make a definitivejudgement on the need for a revision of 2005 projections.

Quarterly Bulletin 2 2005
34
Financial Sector Developments
Overview
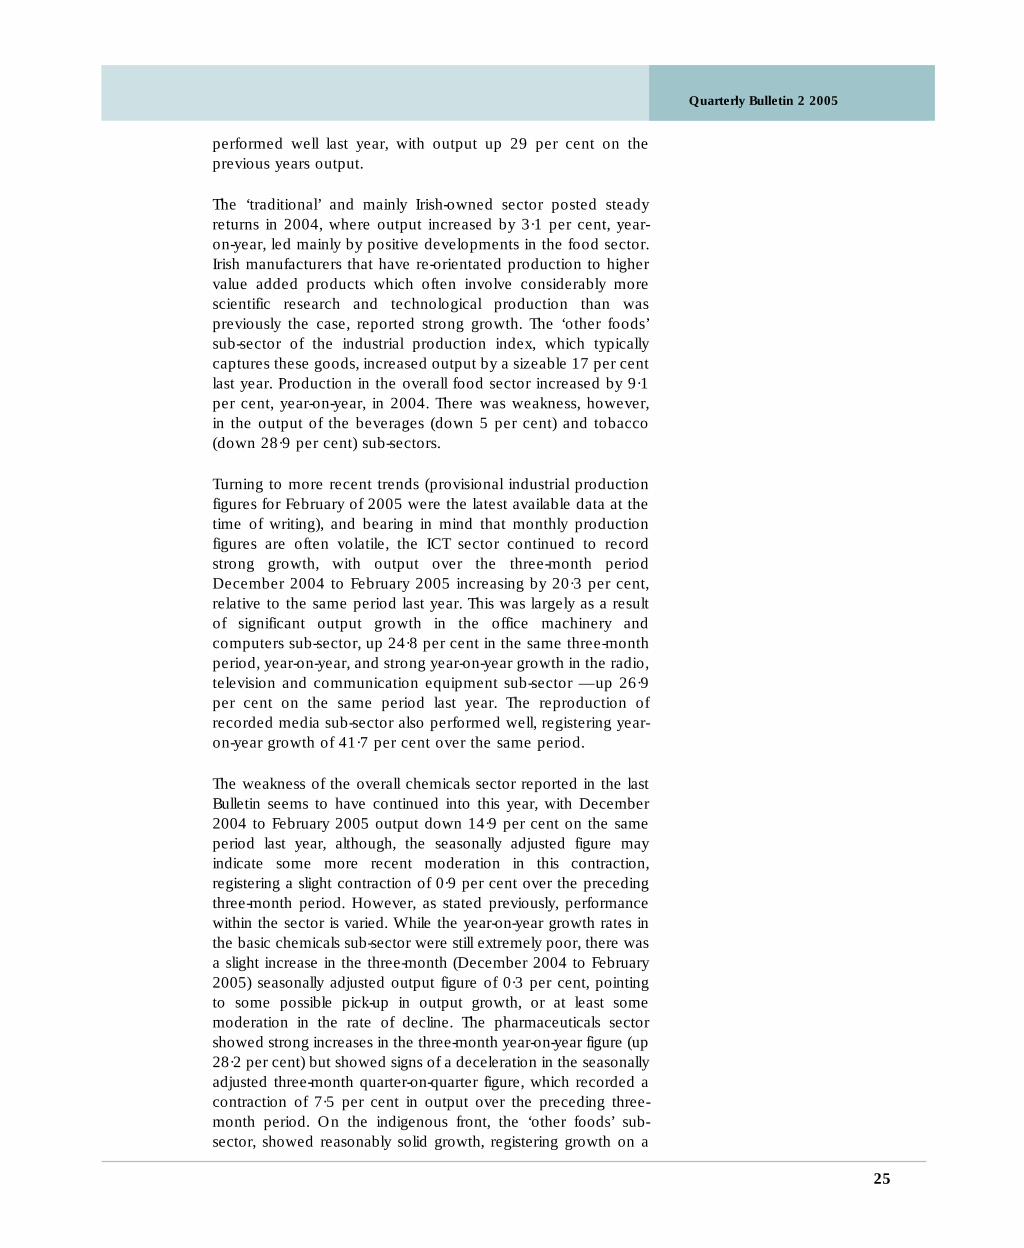
The underlying annual adjusted rate of private-sector creditgrowth5 has been on a steadily upward trend since the middle of2003, although the rate of acceleration appears to have slowedsomewhat in recent months. Credit growth increased from anannual rate of under 18 per cent at the end of 2003 to 26·6 percent at the end of last year. The growth rate rose slightly to 26·9per cent in February 2005, the fastest rate of credit growth forfive years. Property-related lending continues to dominateprivate-sector credit growth and the largest component of thisis residential mortgage lending. However the latter item, whilecontinuing to grow strongly, has shown signs of decelerating.The underlying annual adjusted mortgage growth rate fell steadilyfrom 27·8 per cent in July 2004 to 26 per cent in February ofthis year, the lowest level since the end of 2003. However, otherproperty-related lending strengthened in the final quarter of lastyear. There was also a pick-up in non-property related lendingwhich was spread across a number of sectors with the largestcontributor being non-housing related lending to the personalsector.
The Irish results for the euro area bank lending survey show thatcredit standards for loans to enterprises were slightly tighter inthe fourth quarter of last year and demand for loans and creditlines by enterprises was reported as increasing slightly. Demandfor credit by households for house purchase was also reportedto have increased slightly in the three months to end-December.The expectation was that demand for credit by both enterprisesand households would increase modestly in the first quarter of2005.
With official interest rates unchanged since mid-2003, short-termmarket interest rates were broadly steady throughout 2004 andin the early months of 2005. Government bond yields eased in2004 — reflecting market expectations with respect to growth,inflation and likely interest-rate developments, and astrengthening euro — but they firmed modestly in the earlymonths of 2005 in line with international trends. Euro areafinancial developments are discussed in more detail in thechapter of this bulletin entitled ‘Developments in theInternational and Euro Area Economy’.
Private-Sector Credit
Lending by credit institutions in Ireland to non-Government Irishresidents (i.e., private-sector credit) increased by close to \11·7
5 The adjusted rate excludes lending to non-bank IFSC entities and also adjusts for valuationeffects due to exchange-rate movements. The underlying rate also takes account of theimpact of the transfer of some \2 billion of residential mortgages to an Irish credit institutionfrom its non-resident parent institution in July of 2004.
Quarterly Bulletin 2 2005
15
20
25
30
FebJan'05
DecNovOctSepAugJulJunMayAprMarFebJan'04
Adjusted residentialmortgages (underlying)
Adjusted private-sectorcredit (underlying)
%
Annual Rates of
Credit Growth
Chart 4
35
Table 9: Credit Aggregates: Annual Rates of Change
Residential Underlyingb Private-sector credit% mortgagesa
Unadjusted Adjustedc Underlyingb
2003 25·5 12·4 17·9December
2004 26·5 14·1 18·8JanuaryFebruary 26·5 15·0 19·3March 26·9 17·2 21·8April 27·4 16·3 21·1May 27·5 18·8 23·0June 27·3 20·1 24·8July 31·7 27·8 22·0 27·1 25·4August 31·5 27·6 21·2 26·3 24·7September 31·1 27·4 22·2 26·6 25·0October 31·1 27·3 22·4 26·8 25·2November 30·8 27·1 23·2 27·3 25·8December 30·0 26·5 24·4 28·1 26·6
2005 29·5 26·0 24·8 28·1 26·6JanuaryFebruary 28·9 26·0 25·0 28·3 26·9
a This series is adjusted for securitisations. (See Table A2 in the Statistical Appendix.)b Adjusted for the effect of the transfer of some \2 billion of residential mortgages to an Irish credit institution from its non-resident parent in July
2004.c Adjusted for transactions between credit institutions and non-MFI IFSC companies and valuation effects arising from exchange-rate movements.
billion to a total of \199·4 billion in the three months to end-December 2004. If lending to non-bank IFSC entities is excludedprivate-sector credit grew by 7 per cent in the fourth quarter,compared with an underlying rate of around 5·1 per cent in theprevious quarter and an increase of 5·9 per cent in the finalquarter of 2003. (The underlying rate adjusts for the impact ofthe transfer of some \2 billion of residential mortgages to an Irishcredit institution from its non-resident parent in July of last year.)The underlying annual adjusted rate of growth in private-sectorcredit rose to 26·6 per cent in December, compared with 25per cent in September. Credit growth recorded a further modestincrease in the first two months of 2005, with the underlyingannual adjusted growth rate rising to 26·9 per cent in February,the fastest rate of growth since March 2000.
Residential mortgage lending accounted for \4·5 billion, or 39per cent, of the increase in private-sector credit in the fourthquarter of last year, a considerably lower proportion than in theprevious two quarters. Adjusted for securitisations (by adding theoutstanding amount of securitised mortgages to the total formortgages on the balance sheets of MFIs) the rate of mortgagegrowth was 6 per cent in the fourth quarter. This compares witha rate of 6·9 per cent in the same period the previous year. Theunderlying annual adjusted growth rate was 26·5 per cent at end-December, down from 27·4 per cent in September. Mortgagegrowth weakened further at the start of 2005 and by Februarythe annual adjusted growth rate had fallen to 26 per cent, thelowest rate since December 2003. The pick-up in the rate ofgrowth of non-mortgage credit in the final quarter of last yearwas partly due to growth in other property-related lending, butalso reflected a strengthening in the rate of increase in non-property related lending, as discussed below.

Quarterly Bulletin 2 2005
36
Table 10: Private-Sector Credit less Property-Related Lendinga
Excluding lending to the category% change ‘Financial intermediation’
Quarter on quarter Year on year Year on year
2002 0·4 11·7 7·5MarchJune −0·6 2·6 5·4September 4·2 7·4 5·1December −3·1 0·8 5·8
2003 −1·1 −0·7 8·2MarchJune −0·7 −0·8 7·8September 0·9 −4·0 7·2December 0·3 −0·7 7·1
2004 5·7 6·1 11·3MarchJune 1·7 8·7 18·3September 0·9 8·7 20·0December 4·3 13·1 25·0
a Property-related lending includes house mortgage finance, lending to real estate activities and lending to the construction sector.
While mortgage growth slowed in the final quarter of last year,there was a marked pick-up in the rate of increase in other credit.Non-mortgage credit increased by 6·2 per cent in the fourthquarter, compared with an increase of 2·8 per cent in each ofthe previous two quarters and growth of 2·7 per cent in the finalthree months of 2003. The annual rate of increase in non-mortgage private-sector credit, adjusted for IFSC lending and forvaluation effects due to exchange-rate movements, rose to 24·4per cent in December from 21·1 per cent in September. Itaccelerated further in the opening months of this year, reaching25·3 per cent in February, the fastest rate since October 2000.
Sectoral Breakdown of Credit Growth
The most recent period for which a full sectoral breakdown ofcredit growth is available is the three months to end-December2004. As usual, property-related lending (defined to includelending to the construction sector and real estate activities andproperty-related lending to the household sector) accounted formost of the increase in credit over the quarter (almost 70 percent on this occasion). Of the increase of close to \11·9 billionin non-Government credit in the three months to end-December,some \4·3 billion was due to housing finance to the personalsector, \2·7 billion was lending to real estate activities and \1·2million was lending to the construction sector. Although housing-related lending to the personal sector shows some signs ofweakening, reflecting an apparent moderation in the increase inresidential mortgage demand, the other components of property-related lending grew strongly in the final three months of lastyear. Lending to real estate activities recorded its strongestquarterly increase of the year, increasing by some 12 per cent,compared with just under 8 per cent in the previous quarter;while lending to the construction sector grew by 14·2 per cent,the strongest quarterly increase since the first quarter of 2000.

Quarterly Bulletin 2 2005
37
Table 11: Change in Credit Institutions’ Non-Government Credit by Sector*
End-December 2003/ End-September 2004/End-December 2004 End-December 2004
\ million % % share \ million % % shareof total of totalchange change
Agriculture and forestry 230 7·3 0·6 44 1·3 0·4Fishing 75 22·7 0·2 12 3·0 0·1Mining and quarrying 63 36·0 0·2 9 3·9 0·1Manufacturing 1,118 25·4 2·9 −258 −4·5 −2·2Electricity, gas and water supply 105 20·9 0·3 68 12·6 0·6Construction 3,508 57·7 9·0 1,191 14·2 10·0Wholesale/retail trade and repairs 1,397 21·9 3·6 556 7·7 4·7Hotels and restaurants 1,261 21·9 3·2 149 2·2 1·3Transport, storage and communications 400 21·8 1·0 238 11·9 2·0Financial intermediation −465 −1·3 −1·2 809 2·3 6·8Real estate and business activities 8,802 37·2 22·5 3,511 12·1 29·5
of which:— Real estate activities 6,906 37·8 17·7 2,725 12·1 22·9
Education 29 7·5 0·1 4 1·0 —Health and social work 222 35·8 0·6 140 19·9 1·2Other community, social and personal services 325 21·6 0·8 55 3·1 0·5Personal: 21,999 32·1 56·3 5,367 6·3 45·1— House mortgage finance 18,067 33·0 46·2 4,222 6·2 35·5— Other housing finance 176 37·1 0·5 108 19·9 0·9— Other 3,757 28·1 9·6 1,037 6·5 8·7
Total 39,068 24·4 100·0 11,896 6·4 100·0
* Data are unadjusted for IFSC lending and valuation effects.
Although property-related lending was the principal source ofcredit growth in the three months to end-December, non-property related lending also accelerated markedly: the latterrecorded growth of 5·6 per cent in the quarter, compared with3·1 per cent in the previous three months and 1·5 per cent inthe final quarter of 2003. This partly reflected a pick-up in lendingto the category ‘Financial intermediation’, which has tended tobe weak recently — lending to this category increased by \809million in the fourth quarter of last year, compared with a fall of\775 million in the previous three months and a contraction of\428 million in the final quarter of 2003. However, the maincontributor to the increase in non-property related lending in thethree months to end-December was non-property related lendingto the personal sector. There was also strong growth under theheading ‘Wholesale/retail trade and repairs’ and the ‘Otherbusiness’ component of the category ‘Real estate, renting andbusiness’. However, lending to the manufacturing sector fell by\258 million, despite a trend towards increased lending to thiscategory. This may reflect seasonal factors, as lending tomanufacturing has tended to decline in the final three months ofthe year.
In the year to end-December, almost three-quarters of theincrease in private-sector credit was property-related. The bulk ofthis was accounted for by house mortgage loans to the personalsector, which increased by \18·2 billion or 36·4 per cent.Lending to real estate activities increased by \6·9 billion or 37·8per cent, and lending to the construction sector increased by\3·5 billion or 57·7 per cent, the largest percentage increase by
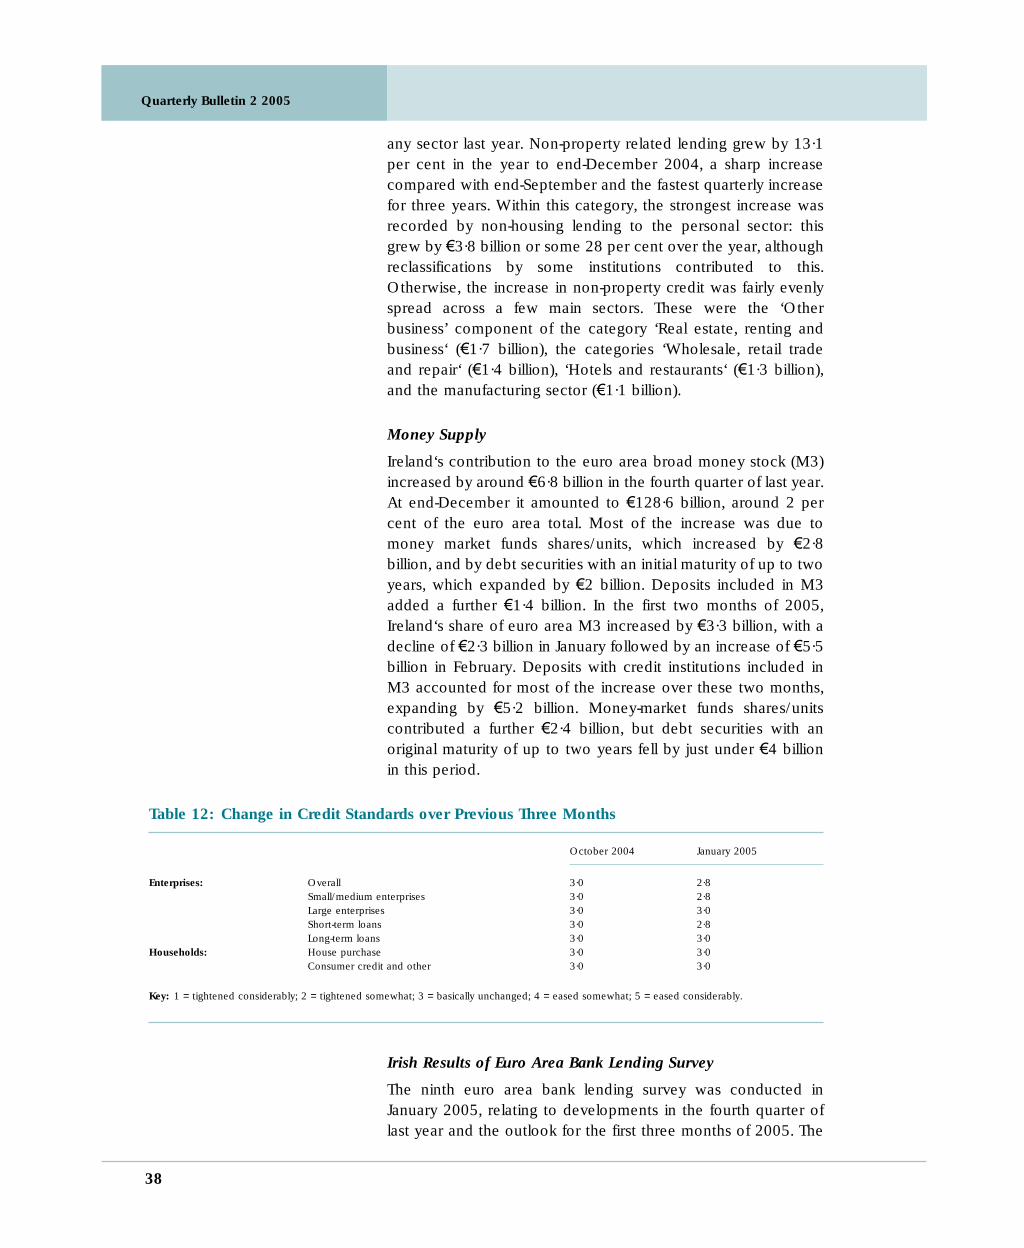
Quarterly Bulletin 2 2005
38
any sector last year. Non-property related lending grew by 13·1per cent in the year to end-December 2004, a sharp increasecompared with end-September and the fastest quarterly increasefor three years. Within this category, the strongest increase wasrecorded by non-housing lending to the personal sector: thisgrew by \3·8 billion or some 28 per cent over the year, althoughreclassifications by some institutions contributed to this.Otherwise, the increase in non-property credit was fairly evenlyspread across a few main sectors. These were the ‘Otherbusiness’ component of the category ‘Real estate, renting andbusiness‘ (\1·7 billion), the categories ‘Wholesale, retail tradeand repair‘ (\1·4 billion), ‘Hotels and restaurants‘ (\1·3 billion),and the manufacturing sector (\1·1 billion).
Money Supply
Ireland‘s contribution to the euro area broad money stock (M3)increased by around \6·8 billion in the fourth quarter of last year.At end-December it amounted to \128·6 billion, around 2 percent of the euro area total. Most of the increase was due tomoney market funds shares/units, which increased by \2·8billion, and by debt securities with an initial maturity of up to twoyears, which expanded by \2 billion. Deposits included in M3added a further \1·4 billion. In the first two months of 2005,Ireland‘s share of euro area M3 increased by \3·3 billion, with adecline of \2·3 billion in January followed by an increase of \5·5billion in February. Deposits with credit institutions included inM3 accounted for most of the increase over these two months,expanding by \5·2 billion. Money-market funds shares/unitscontributed a further \2·4 billion, but debt securities with anoriginal maturity of up to two years fell by just under \4 billionin this period.
Table 12: Change in Credit Standards over Previous Three Months
October 2004 January 2005
Enterprises: Overall 3·0 2·8Small/medium enterprises 3·0 2·8Large enterprises 3·0 3·0Short-term loans 3·0 2·8Long-term loans 3·0 3·0
Households: House purchase 3·0 3·0Consumer credit and other 3·0 3·0
Key: 1 = tightened considerably; 2 = tightened somewhat; 3 = basically unchanged; 4 = eased somewhat; 5 = eased considerably.
Irish Results of Euro Area Bank Lending Survey
The ninth euro area bank lending survey was conducted inJanuary 2005, relating to developments in the fourth quarter oflast year and the outlook for the first three months of 2005. The
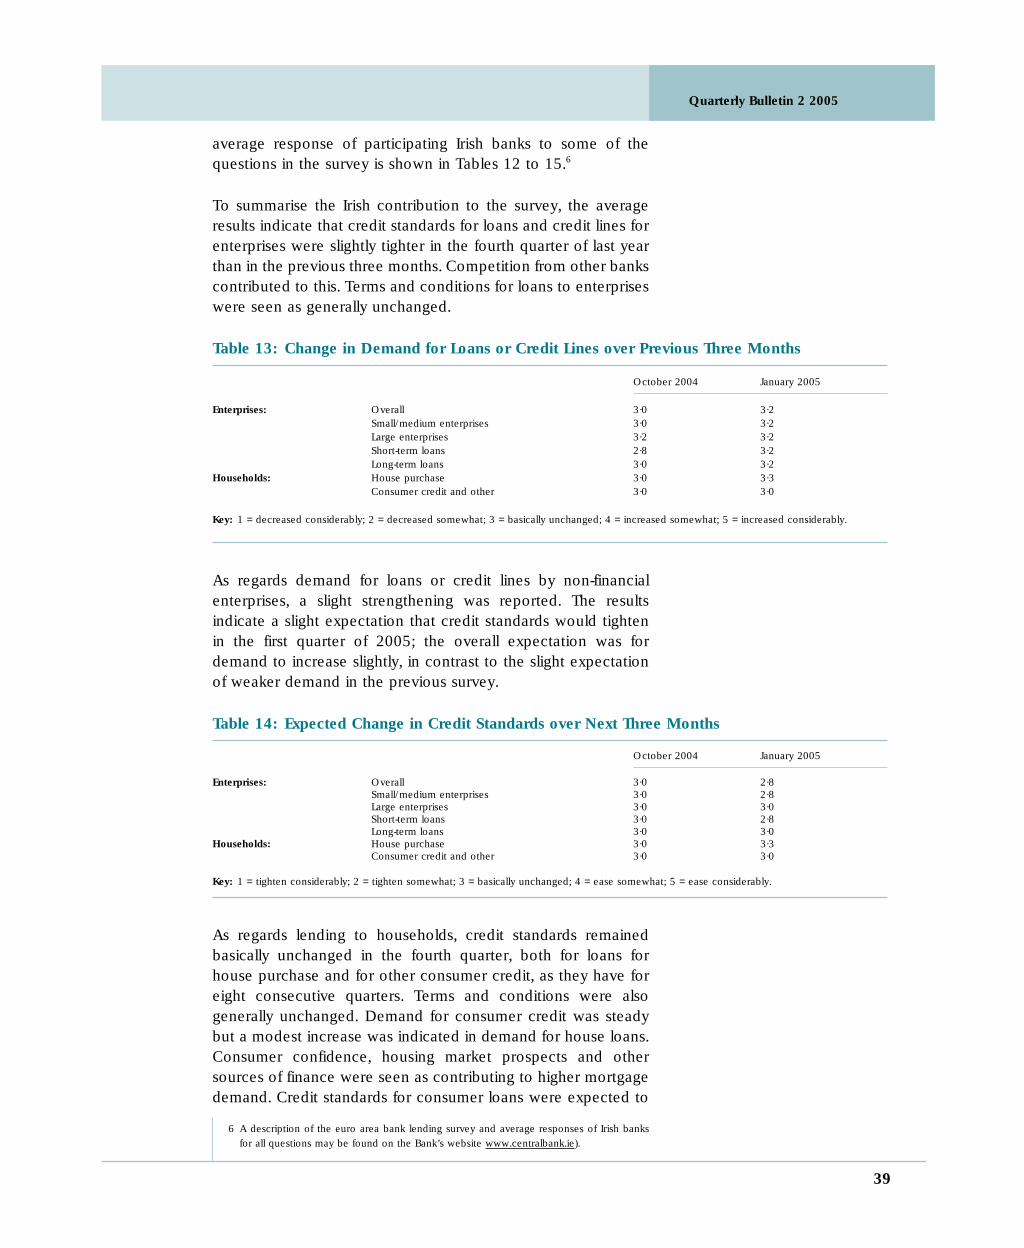
Quarterly Bulletin 2 2005
39
average response of participating Irish banks to some of thequestions in the survey is shown in Tables 12 to 15.6
To summarise the Irish contribution to the survey, the averageresults indicate that credit standards for loans and credit lines forenterprises were slightly tighter in the fourth quarter of last yearthan in the previous three months. Competition from other bankscontributed to this. Terms and conditions for loans to enterpriseswere seen as generally unchanged.
Table 13: Change in Demand for Loans or Credit Lines over Previous Three Months
October 2004 January 2005
Enterprises: Overall 3·0 3·2Small/medium enterprises 3·0 3·2Large enterprises 3·2 3·2Short-term loans 2·8 3·2Long-term loans 3·0 3·2
Households: House purchase 3·0 3·3Consumer credit and other 3·0 3·0
Key: 1 = decreased considerably; 2 = decreased somewhat; 3 = basically unchanged; 4 = increased somewhat; 5 = increased considerably.
As regards demand for loans or credit lines by non-financialenterprises, a slight strengthening was reported. The resultsindicate a slight expectation that credit standards would tightenin the first quarter of 2005; the overall expectation was fordemand to increase slightly, in contrast to the slight expectationof weaker demand in the previous survey.
Table 14: Expected Change in Credit Standards over Next Three Months
October 2004 January 2005
Enterprises: Overall 3·0 2·8Small/medium enterprises 3·0 2·8Large enterprises 3·0 3·0Short-term loans 3·0 2·8Long-term loans 3·0 3·0
Households: House purchase 3·0 3·3Consumer credit and other 3·0 3·0
Key: 1 = tighten considerably; 2 = tighten somewhat; 3 = basically unchanged; 4 = ease somewhat; 5 = ease considerably.
As regards lending to households, credit standards remainedbasically unchanged in the fourth quarter, both for loans forhouse purchase and for other consumer credit, as they have foreight consecutive quarters. Terms and conditions were alsogenerally unchanged. Demand for consumer credit was steadybut a modest increase was indicated in demand for house loans.Consumer confidence, housing market prospects and othersources of finance were seen as contributing to higher mortgagedemand. Credit standards for consumer loans were expected to
6 A description of the euro area bank lending survey and average responses of Irish banksfor all questions may be found on the Bank’s website www.centralbank.ie).

Quarterly Bulletin 2 2005
0
1
2
3
4
Main Refinancing Operations Rate
Households Overnight Deposit Rate
Clearing Banks' Prime Rate
Standard Variable Mortgage Rate
MarFebJan'05
DecNovOctSepAugJulJunMayAprMarFebJan'04
%
Selected Interest
Rates
Chart 5
40
Table 15: Expected Change in Demand over Next Three Months
October 2004 January 2005
Enterprises: Overall 2·8 3·2Small/medium enterprises 3·0 3·2Large enterprises 2·8 3·2Short-term loans 3·0 3·0Long-term loans 2·8 3·2
Households: House purchase 3·0 3·3Consumer credit and other 3·0 3·3
Key: 1 = decrease considerably; 2 = decrease somewhat; 3 = basically unchanged; 4 = increase somewhat; 5 = increase considerably.
remain basically unchanged in the first quarter of this year, butsome easing in standards for house purchase loans wasexpected. Demand for credit by households, for house purchaseand otherwise, was expected to be a little stronger.
Financial Markets
Interest Rates
Short-term money-market interest rates remained generallysteady at just above the ECB’s main refinancing operations(MRO) rate in the final quarter of last year and the openingmonths of 2005. In line with euro area trends, Irish Governmentbond yields generally eased in the final quarter of last year andat the start of 2005, before firming modestly in the spring. Thistrend reflected factors such as the outlook for short-term interestrates given the performance of the euro area economy and thestrength of the euro. The Irish ten-year yield eased from 4·31 atend-2003 to 3·67 per cent at the end of last year. It fell furtherto just below 3·4 per cent by mid-February, but by the end ofthe third quarter it had firmed again to 3·60 per cent. Irish ten-year yields remained at around the lowest levels in the euro areaand slightly below the euro area average. At end-March, the euroarea average was 3·69 per cent and only in Finland were yieldsas low as in Ireland.
Table 16: Irish Government Bond Yields and Differentials
End-month 5-year Differentials against: 10-year Differentials against:bond bond
% yield Germany UK US yield Germany UK US
2003 3·65 0·15 −0·93 0·42 4·31 0·01 −0·46 0·04December
2004 3·14 0·03 −1·52 0·30 3·98 0·04 −0·81 0·10MarchJune 3·61 0·04 −1·45 −0·21 4·35 0·04 −0·75 −0·26September 3·25 −0·07 −1·52 −0·16 3·98 −0·01 −0·85 −0·16December 2·95 −0·08 −1·55 −0·67 3·67 −0·01 −0·87 −0·56
2005 2·84 −0·08 −1·71 −0·88 3·48 −0·06 −1·13 −0·67JanuaryFebruary 2·98 −0·07 −1·77 −0·94 3·65 −0·04 −1·09 −0·63March 2·90 −0·08 −1·78 −1·31 3·60 −0·03 −1·11 −0·92
Note: (−) denotes Irish yields are lower than foreign yields.

Quarterly Bulletin 2 2005
3.0
3.5
4.0
4.5
GRFIPTATNLITIEFRESBEDM
Chart 6
Ten-Year Bond Yields
end-March 2005
Percentage Points
41
Representative deposit and lending rates for Ireland are shownin Tables 17 and 18. Deposit rates were little changed in thesecond half of last year, although rates for both households andnon-financial corporations tended to firm slightly over the yearas a whole. Rates were generally steady at the start of 2005 (seeTable 17). As regards lending rates, there was an increase in theaverage overdraft rate for households last year but other ratesfor house loans or loans for consumption purposes generallyeased. The overdraft rate rose further at the start of 2005 andthere was also an increase in the average rate on loans forconsumption purposes. For non-financial corporations, ratesfluctuated within a fairly narrow range last year, both for loansup to and above \1 million, and there was little change at thestart of 2005 (see Table 18). Rates for loans over \1 million wereconsistently lower than those for amounts under \1 million,which reflects the fact that the latter tend to be to large corporateentities and the former to smaller enterprises. For further detailson retail deposit and lending rates in Ireland, see Tables B2·1 andB2·2 in the Statistical Appendix and the Explanatory Notes.
Table 17: Deposit Interest Ratesa
Households Non-financial corporations
Overnightb With agreed Redeemable at Overnightb With agreed
maturity noticeb maturity
2003 0·50 1·69 1·33 0·32 1·87December
2004 0·39 1·67 1·42 0·35 1·84March
May 0·43 1·68 1·39 0·39 1·83
June 0·44 1·69 1·40 0·38 1·87
July 0·41 1·72 1·37 0·37 1·85
August 0·47 1·70 1·43 0·37 1·85
September 0·48 1·72 1·44 0·38 1·86
October 0·49 1·73 1·45 0·39 1·89
November 0·49 1·74 1·46 0·39 1·91
December 0·48 1·75 1·46 0·39 1·90
2005 0·50 1·76 1·47 0·41 1·93January
February 0·49 1·77 1·48 0·40 1·95
a Rates are for new business. Rates are overwhelmingly for business with Irish residents but include a small amount with residents of other monetary
union member countries.
b For these categories, new business is defined as outstanding amounts.
Exchange Rates and Equities
Having risen strongly in the second half of last year, the euro fellback somewhat in the opening months of 2005. The euro roseby around 8 per cent against the US dollar last year but fell backby 4·6 per cent in the first three months of this year. The euroalso fell by 3 per cent against sterling and by 1 per cent againstthe Japanese yen in the first quarter of this year. Reflecting themovements of the euro, the trade-weighted competitiveness

Quarterly Bulletin 2 2005
42
indicator (TWCI) for Ireland improved by 1·7 per cent in the firstquarter of this year, substantially reversing the deterioration of1·8 per cent recorded in 2004 as a whole (see Table B4 in theStatistical Appendix). However, the TWCI’s end-March level of103·61 was still 3·8 per cent above the low point for 2004 of99·79 recorded in the spring of last year. A rise in the TWCIrepresents a deterioration in the competitiveness conditions forIrish enterprises.
Following a strong performance in 2004 the Irish stock exchangecontinued to record gains at the start of this year. However, theISEQ index fell sharply at end-February, reflecting a severe fall inthe share price for one company, and it remained weak for theremainder of the quarter. In the first quarter the ISEQ index fellby 3·5 per cent, having risen by 10 per cent in the previous threemonths. Other stock markets experienced mixed fortunes in thefirst quarter: the Dow Jones fell by 2·4 per cent but the mainBritish, German and Japanese indexes recorded growth ofbetween 1·6 and 2·7 per cent, while the main French indexadvanced by 7 per cent.
Table 18: Retail Lending Rates for Irelanda
Households Non-financial corporations
Floating rate and fixed up Floating rate and fixed up
to one year to one year
Consumption House Other loans up Other loans overBank Bank
purposes purchases to \1 million \1 millionoverdraftsb overdraftsb
2003 12·93 5·04 3·47 6·58 4·35 4·33December
2004 12·90 5·60 3·41 6·83 4·42 3·97March
May 13·16 5·39 3·34 6·87 4·42 4·01
June 13·06 5·18 3·34 6·61 4·32 4·10
July 13·06 5·13 3·35 6·70 4·37 4·30
August 13·21 5·26 3·36 6·61 4·40 4·26
September 13·29 4·93 3·36 6·74 4·36 4·23
October 13·33 4·94 3·34 6·45 4·30 4·26
November 13·17 4·88 3·35 6·53 4·40 4·23
December 13·09 4·73 3·39 5·69 4·38 4·09
2005 13·41 5·11 3·34 6·54 4·33 4·13January
February 13·43 5·13 3·33 6·35 4·31 4·21
a Rates are for new business. Rates are overwhelmingly for business with Irish residents but include a small amount with residents of other monetary
union member countries.
b For these categories, new business is defined as outstanding amounts.
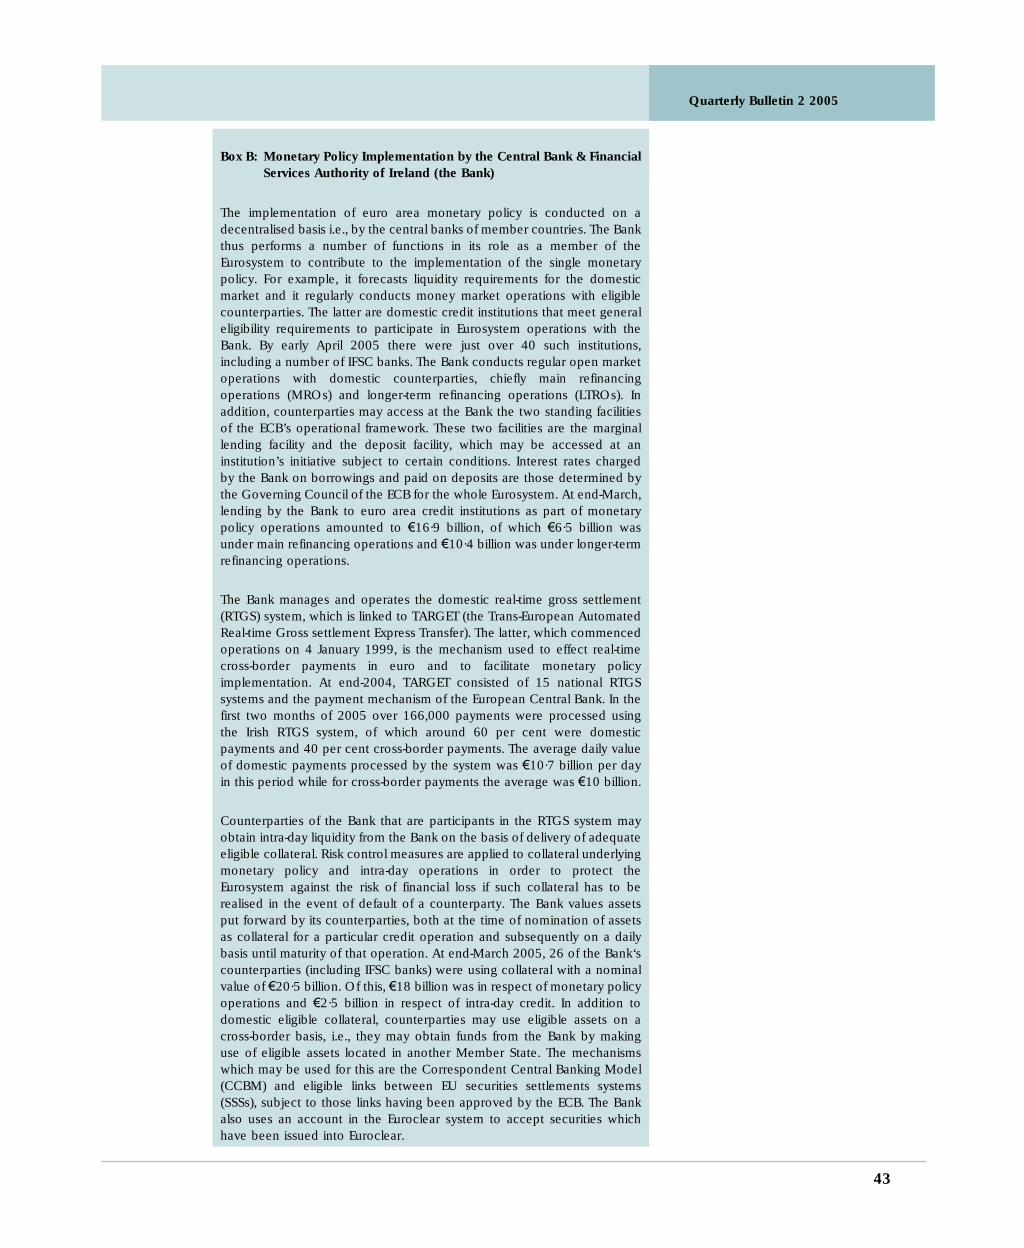
Quarterly Bulletin 2 2005
43
Box B: Monetary Policy Implementation by the Central Bank & Financial
Services Authority of Ireland (the Bank)
The implementation of euro area monetary policy is conducted on adecentralised basis i.e., by the central banks of member countries. The Bankthus performs a number of functions in its role as a member of theEurosystem to contribute to the implementation of the single monetarypolicy. For example, it forecasts liquidity requirements for the domesticmarket and it regularly conducts money market operations with eligiblecounterparties. The latter are domestic credit institutions that meet generaleligibility requirements to participate in Eurosystem operations with theBank. By early April 2005 there were just over 40 such institutions,including a number of IFSC banks. The Bank conducts regular open marketoperations with domestic counterparties, chiefly main refinancingoperations (MROs) and longer-term refinancing operations (LTROs). Inaddition, counterparties may access at the Bank the two standing facilitiesof the ECB’s operational framework. These two facilities are the marginallending facility and the deposit facility, which may be accessed at aninstitution’s initiative subject to certain conditions. Interest rates chargedby the Bank on borrowings and paid on deposits are those determined bythe Governing Council of the ECB for the whole Eurosystem. At end-March,lending by the Bank to euro area credit institutions as part of monetarypolicy operations amounted to \16·9 billion, of which \6·5 billion wasunder main refinancing operations and \10·4 billion was under longer-termrefinancing operations.
The Bank manages and operates the domestic real-time gross settlement(RTGS) system, which is linked to TARGET (the Trans-European AutomatedReal-time Gross settlement Express Transfer). The latter, which commencedoperations on 4 January 1999, is the mechanism used to effect real-timecross-border payments in euro and to facilitate monetary policyimplementation. At end-2004, TARGET consisted of 15 national RTGSsystems and the payment mechanism of the European Central Bank. In thefirst two months of 2005 over 166,000 payments were processed usingthe Irish RTGS system, of which around 60 per cent were domesticpayments and 40 per cent cross-border payments. The average daily valueof domestic payments processed by the system was \10·7 billion per dayin this period while for cross-border payments the average was \10 billion.
Counterparties of the Bank that are participants in the RTGS system mayobtain intra-day liquidity from the Bank on the basis of delivery of adequateeligible collateral. Risk control measures are applied to collateral underlyingmonetary policy and intra-day operations in order to protect theEurosystem against the risk of financial loss if such collateral has to berealised in the event of default of a counterparty. The Bank values assetsput forward by its counterparties, both at the time of nomination of assetsas collateral for a particular credit operation and subsequently on a dailybasis until maturity of that operation. At end-March 2005, 26 of the Bank‘scounterparties (including IFSC banks) were using collateral with a nominalvalue of \20·5 billion. Of this, \18 billion was in respect of monetary policyoperations and \2·5 billion in respect of intra-day credit. In addition todomestic eligible collateral, counterparties may use eligible assets on across-border basis, i.e., they may obtain funds from the Bank by makinguse of eligible assets located in another Member State. The mechanismswhich may be used for this are the Correspondent Central Banking Model(CCBM) and eligible links between EU securities settlements systems(SSSs), subject to those links having been approved by the ECB. The Bankalso uses an account in the Euroclear system to accept securities whichhave been issued into Euroclear.

Quarterly Bulletin 2 2005
44
Monetary policy is executed in the context of the Eurosystem’s minimumreserve requirement system. All credit institutions operating in Ireland,whether under Irish law or on a branch basis, are required to keep anamount equivalent to 2 per cent of specified liabilities on account with theBank. Compliance is determined on the basis of average daily reserveholdings over a ‘maintenance period’. The system contributes to stabilisinginterest rates by providing institutions with some scope to adjust thebalance in their minimum reserve account, subject to meeting the 2 percent requirement on average over the maintenance period, therebysmoothing the effect of day-to-day fluctuations in liquidity. In themaintenance period from 8 February to 8 March 2005, institutions heldbalances in their minimum reserve accounts with the Bank that were, onaverage, \15 million more than required. Minimum reserve accountbalances are remunerated at a rate based on the MRO rate, althoughbalances in excess of requirement are not remunerated. The Bank isresponsible for monitoring compliance of credit institutions in Ireland withthe minimum reserve system and it imposes sanctions for breaches ofobligations, which are based on the extent of the shortfall, in accordancewith the Council Regulation concerning the application of minimumreserves.

Quarterly Bulletin 2 2005
45
Domestic Prices, Costs and Competitiveness
Overview
Inflationary pressures in the economy have subsided somewhatover the past two years, with consumer price inflation nowbroadly in line with the average for the euro area. At an averagerate of 2.3 per cent in 2004, Irish HICP inflation was only 0.2percentage points higher than the euro-area average and closeto the ECB reference rate of 2 per cent. In addition to a declinein underlying domestic inflationary pressures, the fall in thedifferential vis-a-vis the euro area also partly reflected base effectsdue to the absence of changes in indirect taxes in Budget 2005and possible effects from the greater exposure of the Irisheconomy to fluctuations in the euro exchange rate.
The average increase in the Consumer Price Index (CPI), whichis a broader measure of changes in consumer prices than theHarmonized Index of Consumer Prices (HICP), was 2.2 per centlast year. The slightly lower rate of CPI inflation was due to theimpact of interest rate reductions during the first half of 2003,which continued to impact on the annual rate of CPI inflationduring the first half of last year. These interest rate cuts were notreflected in the HICP because mortgage interest payments areexcluded from this measure.
A broader measure of inflationary pressures in the economy isthe Gross Domestic Expenditure (GDE) deflator. The GDEdeflator takes into account changes in the prices of allcomponents of domestic expenditure (i.e. consumption goods,investment goods and purchases by public authorities). The latestNational Accounts data indicate that the increase in the GDEdeflator fell back slightly last year, compared with the outturn in2003, averaging around 4 per cent.
Table 1: Inflation Measures — Annual Averages, Per Cent
Measure HICP CPI Services* Gross Domestic
Expenditurea
2004 21⁄4 21⁄4 33⁄4 42005f 2 2 31⁄2 23⁄42006f 2 21⁄4 33⁄4 23⁄4
*refers to the HICP services component.aThe GDE deflator used in this table excludes the value of stocks and the statistical discrepancy.As a result, the measure differs from the one used in Table 1 of the ‘‘Real and FinancialDevelopments’’ chapter.
The available data for the first quarter of 2005 do not point toany re-emergence of domestic inflationary pressures. Indeed, a

Quarterly Bulletin 2 2005
46
further reduction in the headline HICP figure and the HICPexcluding energy sub-component was observed in the firstquarter, supported by a further decline in services sectorinflation. While some modest re-acceleration of services inflation,in line with the projected strengthening of consumer demandand the continued tightness of the labour market, is possible thisyear, overall consumer price inflation is expected to average justbelow 2 per cent in terms of the HICP and just above 2 per centbased on the CPI. Average HICP inflation in 2006 is alsoprojected to remain close to 2 per cent, although this partlyreflects the technical assumption that oil prices decline in linewith current market expectations at the time of writing. A modestrise in the HICP excluding energy of around half a percentagepoint is projected for 2006, in line with the projected pick-up indomestic consumption. The GDE deflator is expected to declinefurther over the projection horizon, as a result of an expectedsoftening of cost pressures in the construction sector and subjectto more modest wage growth in the government sector.
However, while relative consumer price inflation has broadlystabilised, consumer prices in Ireland are now high relative toour main trading partners as a result of higher inflation between2000 and 2003. In terms of price competitiveness, this has beenexacerbated over the past three years by the rise in the value ofthe euro on foreign exchange markets, particularly against thedollar — although this was from a low base following thedepreciation of the exchange rate over the period 1999-2001.Many sectors have also experienced adverse costcompetitiveness developments in recent years, namely thosewhich have not been able to generate sufficient productivitygrowth to cover rising wage costs. Some moderation in the rateof increase in pay is expected in 2005, largely as a result of lowerincreases in public sector pay, although pay costs in the tradedsectors are expected to continue to rise at a faster rate than inmany of our trading partners.
In the residential property market, there now appears to be clearevidence of a slowdown in the rate of increase in house prices,particularly towards the end of last year and during the firstquarter of 2005. This is consistent with a soft landing in thehousing market as supply and demand come more into balance.Conditions have been quite varied in the commercial propertymarket in recent years, with the strong expansion of the retailsector contrasting with much weaker demand for industrial andoffice premises. Some improvement in the industrial sector wasevident during 2004, with positive growth in rental and capitalvalues. In the office market, estimates of vacancy rates remainquite high and, although market participants point to definitesigns of strength in some sectors, including business services, andregions, such as central Dublin, other parts of the office sectorstill appear quite subdued.

Quarterly Bulletin 2 2005
47
Consumer Prices
The annual rate of consumer price inflation fell quite significantlylast year. The average increase in the HICP was 2.3 per cent,down from 4.7 per cent in 2002 and 4.0 per cent in 2003. Lastyear’s increase reflected a quite low outturn during the first halfof the year and some pick-up during the second half. HICPinflation averaged 2.1 per cent during each of the first twoquarters of 2004, rising to 2.5 per cent and 2.6 per cent,respectively, during the third and fourth quarters. Higher inflationduring the second half of last year was mainly due to risingenergy prices rather than any strengthening of underlyinginflationary pressures. Indeed, excluding energy, HICP inflationwas quite stable during 2004, averaging 2.1 per cent during thefirst quarter and 1.8 per cent during each of the remaining threequarters.
The annual rate of HICP inflation fell back again at the beginningof this year, dropping from 2.8 per cent in November 2004 to2.1 per cent in January 2005 and further to 2.0 per cent inFebruary and 1.9 per cent in March. As a result of these monthlydata, the average increase in the overall HICP during the firstquarter of this year was 2.0 per cent, down from 2.6 per cent inthe preceding quarter. The HICP excluding energy also declinedat the beginning of 2005, falling from 1.8 per cent in November2004 to 1.2 per cent in March 2005. This was due toconsiderably weaker services sector inflation during the firstquarter of 2005 as well as some decline in the annual rate ofincrease in food prices. Lower inflation in January also partlyreflected base effects due to the absence of changes in indirecttaxes in Budget 2005.
An alternative measure of consumer price inflation is theConsumer Price Index (CPI), which provides a slightly broadermeasure as it includes items such as mortgage interest paymentsand some parts of home and health insurance that are excludedfrom the HICP. During the first half of 2004, CPI inflation wasbelow HICP inflation because of the impact of interest rate cutsduring the first half of 2003 on mortgage interest repayments.CPI inflation rose above HICP inflation during the second half oflast year, however, as the impact of these interest rate reductionsfell out of the annual comparisons. For 2004 as a whole, theaverage rate of increase in the CPI was 2.2 per cent, marginallybelow the increase in the HICP. However, the CPI in March 2005was 2.1 per cent, above the HICP figure of 1.9 per cent. Underthe technical assumption of unchanged interest rates, CPIinflation is likely to remain slightly above HICP inflation during2005 and 2006 as a result of higher mortgage interestrepayments arising from higher house prices.

Quarterly Bulletin 2 2005
48
0
1
2
3
4
5
6
MFJ'05
DNOSAJJMAMFJ'04
DNOSAJJMAMFJ'03
DNOSAJJMAMFJ'02
Chart 1
Consumer
Prices
Euro-12: MonetaryUnion Index of ConsumerPrices (MUICP)
Ireland: EU HarmonisedIndex of ConsumerPrices (HICP)
Ireland: ConsumerPrice Index %
Cha
nge,
Yea
r-on-
Yea
rInflationary pressures are expected to remain quite subduedthroughout 2005, with a modest drop in average HICP inflationto just below 2 per cent expected. The projected increase in theCPI is just above 2 per cent. This represents a slight downwardrevision since the last Bulletin, which reflects weaker thanexpected services sector inflation during the first quarter of thisyear. While some increase in services inflation is still expected,arising from the continued strength of the domestic labourmarket and the projected recovery in consumer spending, theextent of the pick-up will be modest. The absence of any changesto indirect taxes in Budget 2005 will contribute to the relativelylow inflation environment this year while the average exchangerate during 2005 is assumed to be above the average for 2004,which will further weaken inflationary pressures.
A modest increase in underlying inflationary pressures isexpected in 2006, mainly as a result of the expectedstrengthening of consumer demand over the next two years andthe tightening of the labour market. However, this will be offsetby the impact of oil prices, which are assumed to fall graduallythroughout the projection horizon, in line with current marketexpectations. Therefore, while the HICP excluding energy sub-component is expected to increase to around 2 per cent nextyear, from around 11⁄2 per cent in 2005, the headline HICP figureis projected to remain broadly stable at around 2 per cent in2006. Average CPI inflation is expected to be around 21⁄4 percent next year.
There are some downside risks associated with these projectionsfor 2005 and 2006. A further increase in the value of the

Quarterly Bulletin 2 2005
49
exchange rate would lead to further downward pressure onproducer prices and imported goods. As noted elsewhere in thisBulletin, the high US current account deficit has the potential tocause a further appreciation of the euro against the dollar. Theprojections assume unchanged interest rates over the forecasthorizon. Interest rates in the euro area are currently at historicallylow levels and, if they were to increase at some stage over theforecast horizon, it would put some direct downward pressureon the Irish inflation rate. The risks emanating from the domesticeconomy are somewhat mixed. The projection for services sectorinflation has been revised downwards since the last Bulletin dueto the weaker than expected outturn during the first quarter.Nevertheless, some modest pick-up in domestically generatedinflation is expected, in line with the tight labour market andthe expected pick-up in consumer demand. If the recent trend iscontinued and services inflation continues to fall then this wouldmean a lower HICP inflation rate in 2005 and 2006. However,there remains a possibility that strong employment and earningsgrowth in services during 2004 will result in a higher thanexpected acceleration in services inflation this year. Finally, thereis some upside risk associated with the oil price projections,given the volatility of international oil markets, particularly overthe past two years.
The decline in the HICP last year brought Irish consumer priceinflation more in line with the euro-area average. With the annualrate of HICP in the euro area averaging 2.1 per cent in 2004, theaverage differential was only 0.2 percentage points. Indeed, Irishinflation actually dipped below the euro-area average during thesecond quarter of last year before rising again during the secondhalf of the year. Euro-area annual inflation rose from 1.9 per centin January 2005 to 2.1 per cent in February 2005. As a result,Irish HICP inflation was below the euro-area average in February,for the first time since May 2004. In addition to a decline inunderlying domestic inflationary pressures, the fall in thedifferential vis-a-vis the euro area also partly reflected base effectsdue to the absence of changes in indirect taxes in Budget 2005and possible effects from the greater exposure of the Irisheconomy to fluctuations in the euro exchange rate. Other thingsbeing equal, fluctuations in the euro exchange rate would beexpected to have a greater impact on Ireland than on the euroarea as a whole, due to the greater openness of the Irisheconomy and our larger share of trade with non-euro areacountries. Over the past year, however, the appreciation of theeffective exchange rate has been largely a result of anappreciation of the euro against the dollar, which would not haveas large an impact on domestic inflation as the weighting of thedollar in the economy’s trade weighted competitiveness indexmight imply since much of Ireland’s trade with the US is intra-firm trade in exporting sectors, which would not directly affectconsumer price inflation. Overall, therefore, it is difficult to be

Quarterly Bulletin 2 2005
50
definitive about the extent of the contribution of exchange ratedevelopments to the narrowing of the inflation differentialbetween Ireland and the euro area. The most recent ECBprojection is for euro-area HICP inflation to average between 1.6and 2.2 per cent in 2005, falling to between 1.0 and 2.2 per centin 2006. Given the projections for Ireland outlined above, thiswould imply that Irish inflation is likely to be close to the averagefor the euro area in 2005 and perhaps slightly above the averagenext year.
Services Prices
Despite strong employment and earnings growth in many partsof the services sector last year, a significant decline in servicessector inflation was observed. The services component of theHICP increased by 33⁄4 per cent last year, compared with anincrease of around 6 per cent in the previous year. This reflecteda decline in the rate of increase in prices of core services,administered services and alcohol-related services last year. Theincrease in core services, for example, was 3.6 per cent in 2004,down from 4.9 per cent in 2003 and 7.6 per cent in 2002. Afurther moderation in services sector inflation was seen duringthe first quarter of 2005, with an average rate of around 31⁄2 percent. This was somewhat surprising given the high wage growthin many parts of the services sector last year and perhaps reflectsthe impact of higher than expected inward migration flows onthe services labour market which might not yet be fully capturedin the earnings data.
2
3
4
5
6
7
8
9
10
MJ'05
NSJMMJ'04
NSJMMJ'03
NSJMMJ'02
HICP Core MarketServices
HICP Services (Overall)
Chart 2
Services
Sector
Inflation
Note: Core Market Services equals HICP Services excluding telecommunications, alcohol and administered services.
% C
hang
e, Y
ear-o
n-Y
ear
As a result of the relatively weak outturn for services inflationduring the first quarter of 2005, some downward revision to the
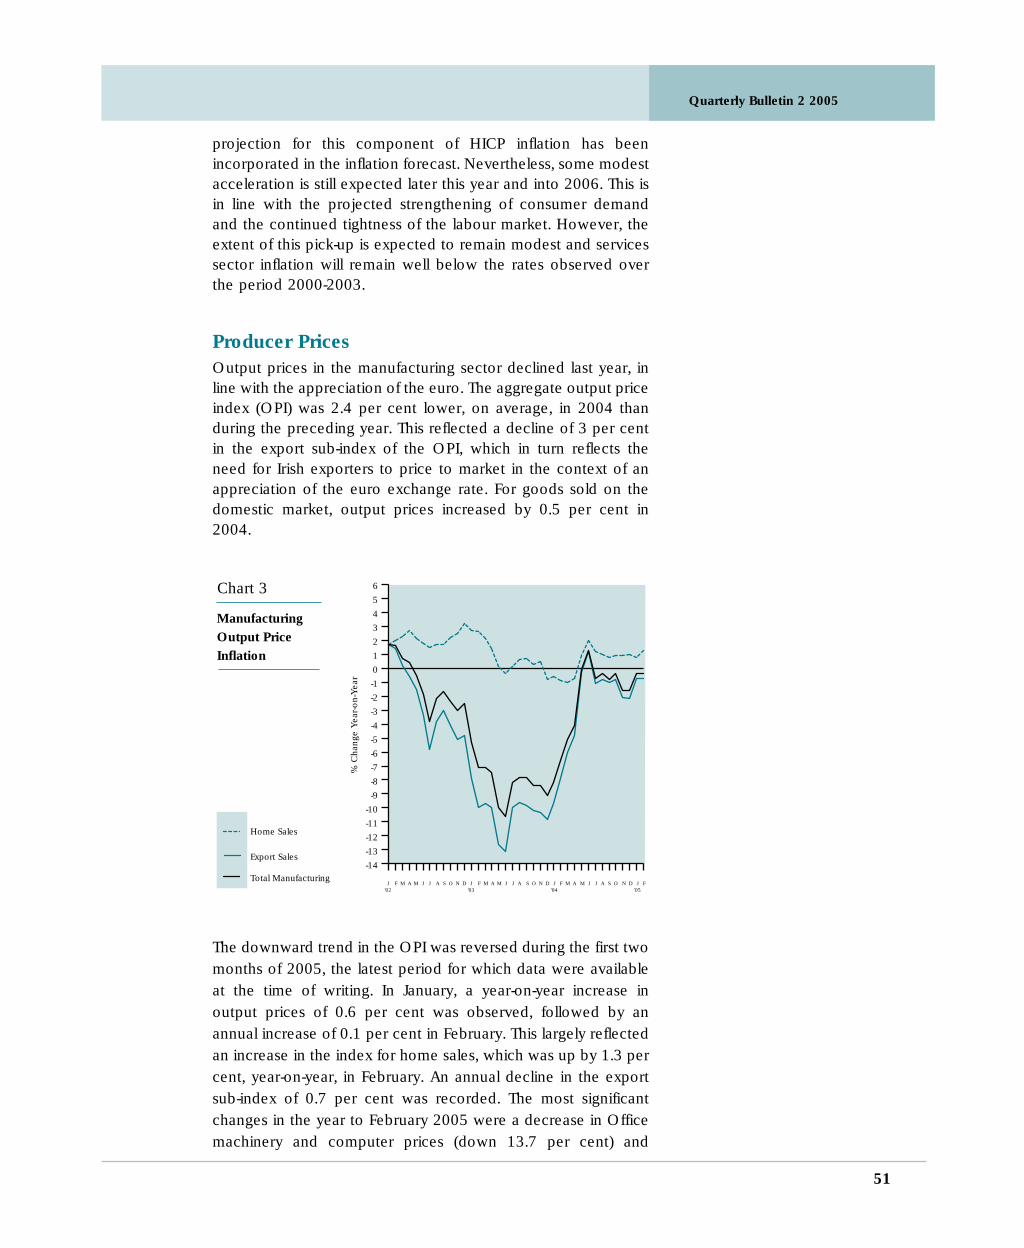
Quarterly Bulletin 2 2005
51
projection for this component of HICP inflation has beenincorporated in the inflation forecast. Nevertheless, some modestacceleration is still expected later this year and into 2006. This isin line with the projected strengthening of consumer demandand the continued tightness of the labour market. However, theextent of this pick-up is expected to remain modest and servicessector inflation will remain well below the rates observed overthe period 2000-2003.
Producer Prices
Output prices in the manufacturing sector declined last year, inline with the appreciation of the euro. The aggregate output priceindex (OPI) was 2.4 per cent lower, on average, in 2004 thanduring the preceding year. This reflected a decline of 3 per centin the export sub-index of the OPI, which in turn reflects theneed for Irish exporters to price to market in the context of anappreciation of the euro exchange rate. For goods sold on thedomestic market, output prices increased by 0.5 per cent in2004.
-14
-13
-12
-11
-10
-9
-8
-7
-6
-5
-4
-3
-2
-1
0
1
2
3
4
5
6
FJ'05
DNOSAJJMAMFJ'04
DNOSAJJMAMFJ'03
DNOSAJJMAMFJ'02
Export Sales
Home Sales
Total Manufacturing
Chart 3
Manufacturing
Output Price
Inflation
% C
hang
e Y
ear-
on-
Yea
r
The downward trend in the OPI was reversed during the first twomonths of 2005, the latest period for which data were availableat the time of writing. In January, a year-on-year increase inoutput prices of 0.6 per cent was observed, followed by anannual increase of 0.1 per cent in February. This largely reflectedan increase in the index for home sales, which was up by 1.3 percent, year-on-year, in February. An annual decline in the exportsub-index of 0.7 per cent was recorded. The most significantchanges in the year to February 2005 were a decrease in Officemachinery and computer prices (down 13.7 per cent) and

Quarterly Bulletin 2 2005
52
increases in the prices of Pharmaceuticals and other chemicalproducts (up 10.5 per cent) and Other food products (up 10.8per cent).
In the agricultural sector, output prices increased by around 2.2per cent during last year. This reflected an increase of 4.6 percent in prices for livestock and livestock products and a declineof 10 per cent in prices of crop products. Agricultural input pricesalso increased during 2004, up 4.0 per cent on average duringthe year. The recent trend, up till January 2005, has been quitevolatile, with output prices falling by 1.2 per cent, on aseasonally-adjusted basis, between November 2004 andDecember 2004 and rising by 3 per cent between December2004 and January 2005. The annual increase in output prices inJanuary 2005 was 2.8 per cent, with a corresponding increase ininput prices of 2.7 per cent.
Competitiveness
Exchange Rate Developments
The Nominal Trade Weighted Competitiveness Index (NTWCI) isa measure of the international price competitiveness of the Irisheconomy and reflects exchange rate developments of the eurovis-a-vis the currencies of Ireland’s main trading partners on atrade-weighted basis. In view of the quite volatile nature of theeuro exchange rate, particularly vis-a-vis the dollar, quarterlyaverages of the NTWCI are adopted as useful indicators of broaddevelopments in competitiveness. In the first quarter of this year,the NTWCI showed a negligible change over the average for thefinal quarter of last year. The US is an important trading partnerfor Ireland and euro dollar exchange rate movements aresignificant in terms of Irish price competitiveness. Although thedaily euro dollar exchange rate has been volatile, fluctuatingbetween a high of about 1.36 and a low of 1.23 in the past sixmonths, quarterly averages have been quite stable.
Turning to longer-term developments, this year’s first quarteraverage of the NTWCI was about 1.7 per cent higher than in thecorresponding period of last year, indicating a slight deteriorationin price competitiveness. This can mainly be attributed to astrengthening of the euro against the dollar, with the averageeuro dollar exchange rate for the first quarter of this year almost5 per cent higher than the average for the same period last year.In contrast, the exchange rate of the euro against sterling hasbeen relatively stable over the corresponding period and this hasbeen a mitigating factor in the upward movement of thecompetitiveness index.
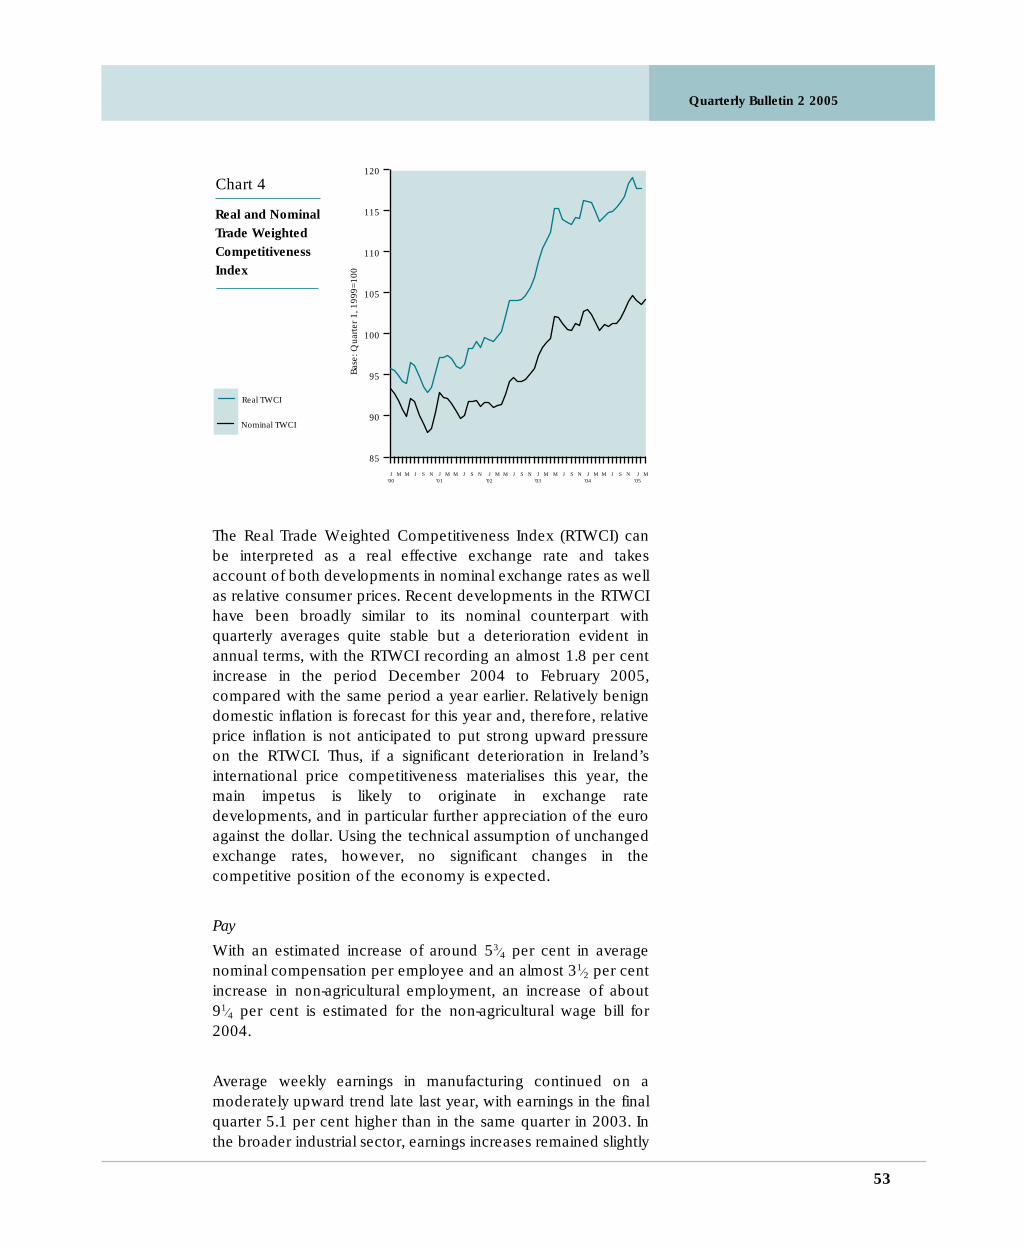
Quarterly Bulletin 2 2005
53
85
90
95
100
105
110
115
120
MJ'05
NSJMMJ'04
NSJMMJ'03
NSJMMJ'02
NSJMMJ'01
NSJMMJ'00
Chart 4
Real and Nominal
Trade Weighted
Competitiveness
Index
Nominal TWCI
Real TWCI
Bas
e: Q
uart
er 1
, 199
9=10
0
The Real Trade Weighted Competitiveness Index (RTWCI) canbe interpreted as a real effective exchange rate and takesaccount of both developments in nominal exchange rates as wellas relative consumer prices. Recent developments in the RTWCIhave been broadly similar to its nominal counterpart withquarterly averages quite stable but a deterioration evident inannual terms, with the RTWCI recording an almost 1.8 per centincrease in the period December 2004 to February 2005,compared with the same period a year earlier. Relatively benigndomestic inflation is forecast for this year and, therefore, relativeprice inflation is not anticipated to put strong upward pressureon the RTWCI. Thus, if a significant deterioration in Ireland’sinternational price competitiveness materialises this year, themain impetus is likely to originate in exchange ratedevelopments, and in particular further appreciation of the euroagainst the dollar. Using the technical assumption of unchangedexchange rates, however, no significant changes in thecompetitive position of the economy is expected.
Pay
With an estimated increase of around 53⁄4 per cent in averagenominal compensation per employee and an almost 31⁄2 per centincrease in non-agricultural employment, an increase of about91⁄4 per cent is estimated for the non-agricultural wage bill for2004.
Average weekly earnings in manufacturing continued on amoderately upward trend late last year, with earnings in the finalquarter 5.1 per cent higher than in the same quarter in 2003. Inthe broader industrial sector, earnings increases remained slightly

Quarterly Bulletin 2 2005
54
lower at 4.8 per cent for the corresponding period. For the wholeof last year, average earnings for the manufacturing and industrysectors were 4.5 per cent and 4.8 per cent higher, respectively,compared with 2003. Average wages for the construction sectorwere 4 per cent higher in 2004 compared with the previousyear.
0
1
2
3
4
5
6
7
8
9
10
11
200620052004200320022001200019991998199719961995
Major Trading Partners
Ireland
Chart 5
Hourly Earnings
in Manufacturing
(in Local
Currency)
% C
hang
e Y
ear-o
n-Y
ear
f f
Wage increases appear to be broadly stronger in the servicessector than in the manufacturing sector. However, wage inflationacross the services sectors has been quite variable. The increasein average weekly earnings in the distribution and businessservices sectors moderated slightly, down marginally to 5.5 percent in the year to September 2004. Increases in the businessservices sector have been noticeably stronger, at about 6.3 percent on average over the first three quarters of 2004, while inthe distribution sector a more moderate increase of under 4 percent was recorded for the same period. Wage increases remainquite strong in other services sectors such as banking andfinance, where the annual increase for 2004 was 5.7 per cent.Earnings in the public sector were highest for the first threequarters of 2004 at an average increase of 8.3 per centcompared with the same period the previous year, asbenchmarking increases were paid.
Although the precise timing may vary across firms or industries,the provisions of the national wage agreement, Sustaining
Progress, allow for an increase of 1.5 per cent of basic pay forthe first half of 2005 and a 2.5 per cent increase of basic pay forthe second half of 2005. Public sector pay increases are due tobe paid six months later than the private sector schedule, withthe final benchmarking payment due in mid-2005. However,

Quarterly Bulletin 2 2005
55
wage developments in the private sector will depend also on therelative supply and demand for labour across different sectorsand the tightening of the labour market in certain sectors in 2005may lead to higher wage increases.
Strong growth in employment in the services sector is anticipatedfor 2005 and this is likely to be reflected in continued upwardpressure on wages in the business services sector in particular.In contrast, a slowdown in output and employment growth inthe construction sector is anticipated and this is likely to lead tomore moderate wage increases in the sector. With wageincreases in the public sector and construction sector likely tobe more subdued this year, and a relatively benign outlook forconsumer price inflation, the economy-wide average increase inwages is expected to be more moderate compared with lastyear. Accordingly, with an increase of over 41⁄2 per cent inaverage nominal compensation per employee expected,combined with a 21⁄2 per cent increase in non-agriculturalemployment, an increase of about 71⁄4 per cent is forecast for thenon-agricultural wage bill for 2005.
Consumer price inflation is forecast to remain relatively benigninto 2006, and increases in both wages and employment nextyear are expected to be broadly comparable to this year. Thus,an increase of over 41⁄2 per cent in average nominalcompensation per employee is forecast, combined with a 21⁄4
per cent increase in non-agricultural employment, such that anincrease of over 7 per cent is forecast for the non-agriculturalwage bill for 2006.
Unit Wage Costs and Productivity
Reasonably strong increases in economy-wide labourproductivity were experienced last year, with increases in GNPper hour at 2.9 per cent and GNP per worker at 2.4 per cent.While such relatively high aggregate productivity growth wouldfeed in quite positively to economy-wide cost competitivenessindicators, these measures of productivity are subject to the usualcaveat that GNP (and GDP) data can be significantly influencedby strong trends in international flows of factor incomes and IFSCtransactions. In particular, the growth rate of GNP was boostedlast year by increased profits earned abroad by Irish firms, whichwould not reflect domestic productivity developments.
Preliminary CSO data available for the final quarter of last yearindicate a significant rise in unit wage costs for manufacturing,up by approximately 8 per cent, year-on-year. However, giventhe quite high volatility of quarterly output data in manufacturing,indicators based on annual data tend to be more reliableindicators of trends in cost competitiveness. With annualearnings increases of about 4.8 per cent matched by a similar

Quarterly Bulletin 2 2005
56
increase in output per hour, the index of unit wage costs formanufacturing for 2004 as a whole remained much the samecompared with 2003, which would suggest that the costcompetitiveness position for Irish manufacturing has stabilisedsomewhat.
50
60
70
80
90
100
110
2004200320022001200019991998199719961995
Total Manufacturingexcluding Chemicals
Total Manufacturing
Chart 6
Unit Wage
Costs in
Manufacturing
(excluding
Chemicals)
Base
: 1995=100
As pointed out in previous Bulletins, marked differences inproductivity are evident across sectors within manufacturing, inparticular between the foreign-dominated chemicals sector andthe more labour-intensive indigenous sectors. Given thesubstantial and highly volatile output volumes in the chemicalssector, trends in productivity in this sector, which has relativelylow employment, have tended to have an undue influence ontrends in productivity in the aggregate industrial sector. In lightof this, alternative measures of overall industrial costcompetitiveness have attempted in some way to limit theinfluence of the chemicals sector. For example, the chemicalssector may be excluded from the analysis altogether, and in thiscase a more favourable impression of competitivenessdevelopments in recent years is apparent. In fact, the index forunit wage costs for the manufacturing sector excluding chemicalsfell by almost 7 per cent and 2 per cent in 2003 and 2004,respectively, as can be observed in Chart 6. These figures suggesta reversal of the trend of deteriorating cost competitivenessexperienced since 2000, and this turnaround can largely beattributed to the recent strong productivity performance of theICT sector. A more detailed analysis of recent trends in industrialoutput is contained in the Domestic Economy — Real andFinancial Developments chapter.

Quarterly Bulletin 2 2005
57
50
60
70
80
90
100
110
120
130
200620052004200320022001200019991998199719961995
Relative Hourly Earnings
Relative Unit Wage Costs
Chart 7
Irish Hourly
Earnings
& Unit Wage
Costs in
Manufacturing
Relative To Main
Trading Partners
(in Common
Currency)
Base
: 1995=100
f f
The Central Bank’s short-term measure of industrialcompetitiveness is the index of unit wage costs in manufacturingrelative to our main trading partners expressed in commoncurrency. The index increased by around 4 per cent in 2004,indicating a deterioration in international cost competitiveness,and this trend is forecast to continue into 2005, with an increasein relative unit wage costs of over 3 per cent. The recentincreases in relative costs suggest a return to the exportcompetitiveness levels experienced at the beginning of thisdecade. Given that exchange rate movements are beyonddomestic control, wage developments remain an importantdiscretionary factor in cost competitiveness, with excessive wagegrowth creating difficulties for those parts of the traded sectorsthat have relatively limited scope for productivity growth.
Asset Prices
In the property market, there was definite evidence of a slowingof house price increases towards the end of 2004, which appearsto have continued into 2005. This would appear to reflect abetter balance between supply and demand in the housingmarket as a result of several years of very strong housing outputgrowth. Conditions in the commercial property market remainvaried across different segments of the market. Demand for retailpremises continued to grow strongly last year, underpinned bystrong demand from international retailers, with another strongyear in prospect in 2005. In the industrial and office sectors,which slowed following the global economic slowdown of 2001,conditions appear to have recovered somewhat during 2004although segments of the office market remain quite stagnant.Irish equity prices, meanwhile, continued to rise at a rapid pace

Quarterly Bulletin 2 2005
58
until February 2005 before falling back somewhat at end-February due largely to the drop in the value of Elan shares.
The rate of increase in house prices varied across differentsegments of the market during 2004. Nevertheless, there issignificant evidence of a moderation in the rate of house priceinflation, particularly towards the end of last year and during thefirst two months of 2005. This would appear to largely reflect thesubstantial increase in housing output in recent years, which hasbrought supply and demand more in line with each other.Housing completions amounted to almost 77,000 units last year,up around 12 per cent on the number of completions theprevious year — putting this into some perspective, the averagenumber of housing completions during the first half of the 1990swas only around 23,000 units per annum. Stronger housingoutput growth in recent years has served to eliminate some ofthe excess demand in the market. While a much lower rate ofincrease in housing completions is expected in 2005, housingoutput will remain relatively high. This is expected to contributeto a further moderation in the rate of house price inflation duringthis year.
Official house price data, released by the Department ofEnvironment and Local Government (DoELG), are available upto the third quarter of 2004. They provide some evidence of amoderation in the rate of increase in new house prices. Theannual increase in the third quarter was 10.6 per cent, downfrom 11.3 per cent and 10.7 per cent in the first and secondquarters, respectively. This reflected a quite low quarter-on-quarter increase of 1.2 per cent between the second and thirdquarters of last year, which compares with an increase of 3.5 percent between the first and second quarters. DoELG data showquite volatile second-hand house prices during 2004. The annualincrease in the third quarter was 10.7 per cent, down from 12.7per cent in the preceding quarter. On a quarterly basis, second-hand house prices fell by 2.8 per cent between the second andthird quarters; however, this followed a 10 per cent increasebetween the first and second quarters of last year. The averageyear-on-year increase in second-hand house prices during the firstthree quarters of last year was 11.7 per cent.
The permanent tsb (ptsb) index of house prices, which adjustshouse price data to take into account differences in the type ofhouses sold, has monthly data available until February 2005.These more timely figures show further evidence of a decline inthe rate of house price inflation over the past year. The year-on-year increases in new and second-hand house prices in Februarywere 10.4 per cent and 8.5 per cent, respectively. Thecorresponding increases in February 2004 were 13.6 per centand 12.8 per cent, respectively. More recent trends observablein the ptsb index provide clearer evidence of a moderation in

Quarterly Bulletin 2 2005
59
the rate of increase of house prices. In the three-month periodbetween December 2004 and February 2005, both new andsecond-hand house prices were up 1.3 per cent compared withthe previous three-month period. This corresponds to anannualised rate of increase of around 51⁄2 per cent, which ifsustained would imply a considerably lower rate of house priceinflation in 2005 than in recent years.
Despite continued rises in house prices, private rents have beendeclining since early 2002. During 2004, for example, the HICPindex of private rents was around 4.3 per cent lower on averagethan during the preceding year. On an annual basis, the rate ofdecline in private rents began to slow towards the end of lastyear while in February 2005 a monthly increase in rents wasrecorded in the CSO index for the first time in three years. Whileit would be unwise to draw definitive conclusions on the basisof one month’s data, there does seem to be some evidence nowthat the decline in rents might have at least moderated.
-10
-5
0
5
10
15
20
25
30
35
Q4Q3Q2Q12004
Q4Q3Q2Q12003
Q4Q3Q2Q12002
Q4Q3Q2Q12001
Q4Q3Q2Q12000
Q4Q3Q2Q11999
Chart 8
Fixed Asset
Values
*Jones Lang LaSalle Index of Capital Values
% C
hang
e Y
ear-o
n-Y
ear
Commercial*
Agricultural Land
New Houses
Some improvement was evident in the commercial propertymarket during 2004, although conditions varied significantlyacross different segments of the market. In the office sector,estimates of the vacancy rate remained high while rentscontinued to decline. According to the Jones Lang LaSalle (JLL)index, in the year to the fourth quarter of 2004, rental values inthe office sector declined by 1.8 per cent with a correspondingdecline in capital values of 1.1 per cent. However, many marketparticipants reported an improvement in conditions during thesecond half of last year, including a recovery in take-up levelsand some modest decline in vacancy rates. In the important

Quarterly Bulletin 2 2005
60
Dublin market, demand was highest in Central Dublin areas andweaker in suburban areas and, as a result, vacancy rates remainmuch higher in suburban areas. At a sectoral level, office demandconditions last year were strongest in the business servicessector.
More concrete signs of improvement were evident last year inthe industrial sector. The JLL index pointed to an annual increasein rental values of 0.7 per cent in the fourth quarter of last year,while capital values were up by 3.9 per cent during the sameperiod. It was the retail sector again, however, that was thestrongest part of the overall commercial property market lastyear, boosted by strong demand from UK and other internationalretailers. On a year-on-year basis, rents in the retail sector wereup 9.3 per cent in the final quarter of 2004 with a correspondingincrease in capital values of 12.4 per cent. Moreover, the outlookremains very positive in this sector, with demand for retailaccommodation likely to be underpinned by an expected pick-up in personal consumption growth during 2005. In Dublin, thestrongest parts of the market appear to be in Grafton Street andsome out of town developments, including the recent openingof the Dundrum Town Centre, while a number of large retaildevelopments are also due to open this year outside Dublin.
Preliminary estimates published by the CSO show thatagricultural land prices increased by 2.7 per cent, year-on-year,in the third quarter of 2004. However, there was a decline of8.6 per cent between the second and third quarters of the year,although the CSO warn that these data are subject to revisionand also that agricultural land sales account for a very smallproportion of the total area farmed nationally. Moreover, thequality of agricultural land together with its location and otherfactors can result in wide variations in the selling price.
Turning to financial assets, Irish stock prices increased stronglylast year with the average value of the ISEQ over 25 per centhigher than in 2003. A further strong increase in equity priceswas observed during the first two months of 2005 before pricesdropped quite sharply at end-February with the decline in thevalue of Elan shares. Share prices in the ISEQ were 7.8 per centlower, on average, in March than in February although, followingthe strong earlier performance, the value of the ISEQ in Marchwas 19 per cent above its value a year earlier. Other internationalstock markets experienced steadier price increases in the year toMarch 2005, with an annual increase of 3.4 per cent in the NewYork Dow Jones Index. The corresponding increases in theLondon FTSE and the Frankfurt DAX were somewhat stronger at11.5 per cent and 11.1 per cent, respectively.

Quarterly Bulletin 2 2005
61
35
55
75
95
115
135
155
F'05
DOAJAF'04
DOAJAF'03
DOAJAF'01
DOAJAF'01
DOAJAF'00
D'99
Frankfurt DAX
ISEQ
FTSE-100
Dow JonesIndustrial
Chart 9
Irish and
International
Share Price
Indices
Base
: Sep
1999=100
Irish bond yields continued to move broadly in line with the euroarea as a whole over the past year with ten-year differentials withrespect to Germany averaging -0.1 per cent in the twelve monthsto end-March 2005. A more detailed analysis of the bond marketis contained in the euro area chapter.
Summary
HICP inflation is expected to average close to 2 per cent in 2005and 2006, a slightly lower rate of increase than last year andunder half the average rate over the period 2002-2003. Thedecline in the headline rate of inflation reflects a combination ofthe impact of the stronger exchange rate and weakerdomestically-generated inflationary pressures. The absence ofchanges to indirect taxes in the most recent Budget has alsocontributed to weaker consumer price inflation this year.
Broader indicators of price and cost pressures in the economyhave also been showing signs of moderating. The rate of houseprice inflation, for example, appears to have slowed during thefinal quarter of 2004 and this trend continued during the firstquarter of 2005. Weaker cost pressures in the constructionsector are also expected to be reflected in a decline in theinvestment and Gross Domestic Expenditure deflators this year.Conditions in the commercial property market, meanwhile, arequite varied across different segments of the market, with rentalvalues continuing to increase strongly in the retail sector incontrast to declining rents in the office sector, at least up to thefinal quarter of 2004.

Quarterly Bulletin 2 2005
62
Wage increases remained quite high during 2004, although thispartly reflected Benchmarking payments to public sectorworkers. Some moderation in industrial earnings has beenobserved over the past two years — though the rate of increasein pay remains quite high in comparison with many of our tradingpartners. In the services sector, employment growth wasparticularly strong during 2004, especially in financial andbusiness services and wholesale and retail trades. While this hasnot as yet been reflected in rising services sector inflation, thereis perhaps some risk from this source to the benign inflationscenario currently projected.

Quarterly Bulletin 2 2005
63
An Timpeallacht Gheilleagrach
Leanann geilleagar na hEireann air ag feidhmnu go maith go luathi mbliana. Tar eis lagu substaintiuil san da bhliain roimhe sin nuairnach raibh ach fas de 1.5 faoin gcead and 2.8 faoin gcead sanOlltairgeacht Naisiunta (OTN), d’fheabhsaigh an fas san OTN gurshroich se leibheal measta de 5.5 faoin gcead anuraidh. Bhı anfas san Olltairgeacht Intıre beagainın nıos ısle na seo ag 4.9 faoingcead. Meastar go leathnoidh an ghnıomhaıocht eacnamaıochag luas gar do seo san da bhliain ata le teacht. Tathar ag tuaranois go mbeidh fas de 51⁄4 agus de 51⁄2, faoi seach, san OTNagus san OTI i 2005.
Ce gurb iad meaduithe sa bhfostaıocht agus feabhsuithe satairgiulacht ar deireadh thiar thall a chineann an fas eacnamaıochsa mhean-tearma, bıonn tionchar laidir ag tosca eilimh arluaineachtaı gearr-thearmacha sa bhfas. Nıor thainig ach meadubeag i 2002 agus 2003 ar phrıomh-chomhphairteanna an eilimhintıre, se sin tomhaltas agus infheistıocht. Mhaolaigh an t-eileamhar onnmhairı go mor freisin, rud a chuaigh i gcion go hairithe arna hearnalacha ardteicneolaıochta ata dırithe ar onnmhairı.Tharla an laigeacht seo san eileamh toisc an timpeallachtgheilleagrach sheachtrach a bheith nıos neamhfhabhraı, rud alean o tharluintı eagsula lena n-airıtear turraing nateicneolaıochta, an eolais agus na cumarsaide, ceartusubstaintiuil i margadh na gcothromas, praghsanna ola a bheithnıos airde agus meadu i dteannais gheopholaitiula. Nıor thainigach feabhas beag ar eileamh tomhaltoirı anuraidh, ce go raibhinfheistıocht tithıochta cuid mhaith nıos laidre agus go raibhonnmhairı ag feidhmiu nıos fearr.
Chomh fada is a bhaineann leis an dtimpeallacht sheachtrach, tadea-chuma ar gheilleagar an domhain le tamall anuas. Anuraidhbhı an fas is airde le blianta anuas i ngeilleagair an ECFE —timpeall 31⁄2 faoin gcead — ce gur mhoilligh luas an fhais sa daraleath den bhliain. I mbliana, is cosuil go mbeidh fas beagainınnıos ısle sna prıomhgheilleagair. Dealraıonn se go mbeidh fasnıos laige i SAM agus sa tSeapain ce go mbeidh se sasuil go leori gconaı i gcas SAM. Taobh amuigh den tSeapain, meastar goleanfaidh an fas de bheith laidir san Ais agus go hairithe sa tSın.Meastar gur fhas geilleagar limistear an euro 1.8 faoin gceadanuraidh, ach go raibh dıluasghearu mor ann sa dara leath denbhliain. Tathar ag tuar go mbeidh an rata fais beagainın nıos ıslei mbliana mar gheall ar thionchar leanunach imeachtaı deireadhna bliana seo caite. Ce go mbeidh moilliu ann i gcomparaid leluas trean na bliana ata thart, tugann na meastachain is deanaıon CAI le tuiscint gur cosuil go mbeidh fas de thimpeall 71⁄2 faoingcead i meid na tradala domhanda i mbliana agus go dtiocfaidhfas de 6 faoin gcead ar an tradail idir na geilleagair ardcheime.
Quarterly Bulletin 2 2005
64
Cuireann se seo timpeallacht sheachtrach fhabhrach ar fail dogheilleagar mar ata againn in Eirinn ag a bhfuil leibheal ard dethradail seachtrach.
Ta dha riosca shuntasacha ag bagairt fos ar an ngeilleagaridirnaisiunta. Tar eis doibh maolu le tamall anuas, d’ardaighpraghsanna ola nıos mo na riamh go luath i Marta, mar gheall areileamh laidir seasurach agus ar shrianta dealraitheacha maidir lesolathar. D’ardaigh se seo praghsanna ola i ndollair chuig dhaoiread a meanleibheal i 2003. Ce go bhfuil furmhor nangeilleagar forbartha ag brath i bhfad nıos lu anois ar ola na mara bhı tamall o shin, ta praghsanna ola fos i gcumas srian a churle fas agus neamhchinnteacht a mheadu. D’fheadfadh se seo abheith tabhachtach i reigiuin cosuil le limistear an euro ata agcoimhlint le tamall anuas chun fas fein-chothabhalach a bhaintamach. Ta na hionchais do phraghsanna ola neamhchinnte goleor sa gharthearma. Tathar ag suil go bhfanfaidh faseacnamaıoch domhanda laidir agus go marfaidh an t-eileamh abhaineann leis an mborradh i ngeilleagar na Sıne, rudaı ad’fheadfadh praghsanna ola a choinneail ard ar feadh tamaill.Deireann trachtairı airithe go mb’fheidir freisin go bhfuilamhantraıocht ag cur leis an eileamh. Os rud e go bhfuil nadeiseanna ionadaıochta teoranta sa ghearr-threimhse, ta an t-eileamh ar ola cuıosach neamhfhreagruil d’athruithe snapraghsanna. Tugann se seo le tuiscint go bhfeadfadh praghas anola a bheith cuıosach leochaileach d’aon chur isteach ar ansolathar no d’aon turraingı san eileamh.
Is ı an neamhchinnteacht maidir le rataı malairte an daraprıomhriosca seachtrach. Ta dollar SAM tugtha do luascthaı ad’fheadfadh a bheith mor, go hairithe mar gheall ar na heasnaimhmhora fhioscacha agus sheactracha. Ta se mar pholasaı ag roinntmhaith tıortha a n-airgeadraı a phionnail don dollar, rud achuireann iachall ar an euro cuid mhaith den gcoigeartu adheanamh. Mar thır i limistear an euro a dheanann sciar cuıosachard da tradail le SAM agus leis an Rıocht Aontaithe, ta Eire an-oscailte do luaineachtaı i luach an euro i gcoinne dollar SAMagus sterling. Taispeanann na sonraı tradala bliantula is deanaı godteann 21 faoin gcead d’onnmhairı na hEireann chuig SAM agus18 faoin gcead chuig an Rıocht Aontaithe. Go dtı seo, bhı nahonnmhairı ag feidhmiu cuıosach maith sa timpeallacht nıosneamhchinnte seo. Seard is cuis ar bhealach leis seo na gurtradail idir-chomhlachtaı ı cuid mhaith den tradail sheachtrach leSAM agus go bhfuil sterling fos cuıosach laidir, agus go bfuil se igconaı os cionn an luach a bhı aige nuair a seoladh an euro i1999. Mar sin fein, is fıor i gconaı a ra gur ceann de na rioscaı ismo ata ag bagairt ar gheilleagar na hEireann na go bhfeadfadhluach an euro meadu go tapaidh.
Arna thogail san iomlan, is cosuil go mbeidh an fas i margaıonnmhairıochta na hEireann beagainın nıos moille na mar a bhı

Quarterly Bulletin 2 2005
65
anuraidh. Leirıonn se seo timpeallacht nıos boige snaprıomhmhargaı — SAM, an Rıocht Aontaithe agus limistear aneuro. Se an tosca is leanunaı na feidhmiu lagmheasartha angheilleagair i limistear an euro, go hairithe maidir le caiteachastomhaltoirı mar chuid den eileamh intıre. Is dıol uchtaigh ed’Eirinn go bhfuil comharthaı nıos dearfa ann go bhfuil nahionchais d’infheistıocht dhıreach on gcoigcrıoch ag feabhsumaidir le honnmhairı ar thaobh an tsolathair.
D’ainneoin rata fais gheilleagar na hEireann ata fos cuıosachlaidir, dealraıonn se go bhfuil brunna boilscitheacha reasuntalagbhrıoch agus an boilsciu fein gar do leibheal a bheadh agteacht le cobhsaıocht praghsanna. B’ionann an meadu in InneacsArmonaithe Praghsanna Tomhaltoirı (HICP) anuraidh agus 2.3faoin gcead i gcomparaid le 2.1 faoin gcead i limistear an euro.Tugann tascairı nıos deanaı le tuiscint go bhfuil an boilsciu intıreag maolu beagainın nıos mo go dtı rata ata faoi bhun an rata ilimistear an euro. Ta leibheal reasunta laidir an euro ag bru anuasar bhoilsciu phraghsanna earraı, ce go maolodh an buaicphointei bpraghsanna ola a sroicheadh le deanaı, ma ta se marthanach,an eifeacht seo. Tathar ag tuar go mbeidh boilsciu na seirbhısı 4faoin gcead i mbliana, leibheal a bheidh nıos airde na an 33⁄4 asroicheadh anuraidh. Beidh dushlan romhainn boilsciu naseirbhısı a choinneail sıos i gcomhtheacs ina raibh arduithe de 6faoin gcead anuraidh sa pha ainmniuil agus nuair ata margadhfostaıochta teann ann ina bhfuil rata dıfhostaıochta ıseal de 41⁄4
faoin gcead. Bhı tionchar mor anuraidh ar fhorbairtı pa agmeaduithe san earnail phoiblı agus in earnail na togala. Bıonntionchar dıreach teoranta acu araon ar phraghsanna tomhaltoirı.Fiu ma ta siad comhchruinnithe in earnalacha faoi leith afach, isfeidir leis na meaduithe mora san fhostaıocht sceitheadh amachmar pha agus mar phraghsanna nıos airde sa gheilleagar goginearalta. Toisc go mbeidh eifeacht laghdaithe ag meaduitheslata tomhais na hearnala poiblı agus le feidhmiu nıos moille inearnail na togala, tathar ag tuar go mbeidh meadu de 43⁄4 faoingcead sa mheanpha ainmniuil i mbliana. Ag cur na toscaı seo goleir maraon le staid an eilimh sa gheilleagar san aireamh, is cosuilgo mbeidh boilsciu HICP timpeall 2 faoin gcead i mbliana,beagainın nıos lu na mar a tuaradh sa bhFaiseis Raithiuldeireannach. Thairis sin afach, ta contuirt shoileir ann go mbeidhneartu eigean sa bhoilsciu nuair ata an geilleagar ag feidhmiu goheifeachtach ag a lan-acmhainneacht agus nuair ata andıfhostaıocht an-ıseal. I dtaca leis seo, tathar ag tuar go mbeidhluasghearu cuıosach beag sa bhoilsciu i 2006.
Ce go bhfuil boilsciu na hEireann anois ag rata ata gar do rataıar bprıomhphairtneirı tradala, leanann se seo treimhse ina raibhar rata boilscithe i bhfad os cionn rata ar bpairtneirı tradala. Dabharr sin ta praghasleibheal na hEireann anois 16 faoin gceadnıos airde na an leibheal i limistear an euro, mar shampla. Idtimpeallacht an lae inniu, ina bhfuil an boilsciu ıseal, is ag

Quarterly Bulletin 2 2005
66
forbairtı i rataı malairte a bhıonn an tionchar poiteinseal is mo ariomaıochas idirnaisiunta an gheilleagair. Laghdaigh luach dollarSAM agus, ar bhealach nıos teoranta, luach sterling, go suntasacho lar 2004, ce gur leanadh e seo le laidriu eigean sa chead raitheden bhliain seo a rinne cuiteamh ar chuid den laghdu luacha seo.Mar sin fein, chuir dollar SAM agus sterling, a bhı nıos laige igcoitinne, leis an mbru ar iomaıochas idirnaisiunta angheilleagair. Ta Fıor-Inneacs Iomaıochais an Bhainc ata Ualaitheo thaobh na Tradala, ag dul i leig beagnach gan stad o dheanachsa bhliain 2000. Mar thoradh ar sin, ta iomaıochas na tıre nıosleochailı anois do aon dımheas eile sa dollar agus i sterling.
Ta seasamh an bheartais fhioscaigh tabhachtach chun a chinntiugo gcuirtear srian le forsaı rospreagtha sa gheilleagar. Bhıclaonadh reasunta forleathnaitheach i gCainaisneis na Nollag seocaite. Ta se beartaithe go meadoidh Caiteachas Iomlan an RialtaisGhinearalta timpeall 103⁄4 faoin gcead i mbliana, suim cuıosachard. Ta riocht an-slaintiuil ar an airgeadas poiblı, mar a bheifea agsuil leis, agus sreabhadh suntasach ioncaim ag teacht isteach saStatchiste mar thoradh ar athfhas laidir eacnamaıoch. Mar sinfein, caithfear a chinntiu go dtacaıonn an beartas fioscach le fasneamhbhoilscitheach san am ata le teacht nuair a bheidh angeilleagar ag feidhmiu go bunusach ag lan-acmhainneacht.
Ta meaduithe i bpraghsanna tithıochta ag maolu faoi lathair igcomparaid leis an treimhse is deanaı. Ar bhonn inneacs
permanent tsb, mheadaigh praghsanna tithıochta 111⁄2 faoingcead ar an mean an bhliain seo caite, tar eis doibh meadu 141⁄4
i 2003. Taispeanann an t-inneacs seo go raibh meaduithebliantula de thimpeall 8 faoin gcead ann le mıonna anuas agusgo bhfuil pointe sroichte ag na meaduithe bliantulaithe is deanaıata idir 5 agus 6 faoin gcead.
Maidir le creidmheas morgaiste, ce gur dealraitheach go bhfuilan buaicphointe sroichte aige, ta se fos ag meadu go han tapaidhag timpeall 25 faoin gcead in aghaidh na bliana; ta se seo trıhuaire nıos mo na an meadu san ioncam inchaite ainmniuil. Bachoir go gcabhrodh an maolu ar mheaduithe i bpraghsannatithıochta agus an laghdu beag ar thogail tithe, tareis aga moille,chun meaduithe creidmheasa a ısliu chuig luas nıos inbhuanaithe.Sin raite, go dtı go mbeidh fianaise againn go bhfuil a leitheidag tarlu, beidh cuis imnı i gconaı ann faoin bhfas i gcreidmheasmorgaiste.
Threisigh an fas sa chreidmeas neamhmhorgaiste freisin le deanaıgur shroich se rataı meadaithe a bhı gar do dha oiread na rataı abhı ann bliain o shin, agus ata ar aon dul leis na rataı dochreidmheas morgaiste. Ta cuid mhaith den iasachtu seo ag duld’earnail na maoine i gcoitinne. Leirıonn an rata ard meadaitheseo, maraon leis na meaduithe suntasacha sa chreidmheasmorgaiste, ce chomh riachtanach is ata se d’iasachtaithe agus
Quarterly Bulletin 2 2005
67
d’iasachtoirı a bheith stuama agus curamach agus iad ag glacadhcinntı.
Ta rataı uis ag ıosphointe an timthrialla, rud a chuir ar chumasiasachtaithe freastal a dheanamh ar leibheil i bhfad nıos airdefeich. Nıl aon dul as mar sin ach go n-ardoidh rataı uis go dtı nagnathleibheil luath no mall, agus ta se thar a bheith tabhachtachgo mbeadh socruithe deanta ag iasachtaithe chun freastal arfhiach faoin a leitheid de chuinsı athraithe.
Tarraingıonn an borradh in earnail na togala aird ar roinntathruithe struchturtha suntasacha sa gheilleagar ata tagtha chunsolais le deanaı. Tar eis di buaicphointe a bhaint amach go luathi 2001, mhaolaigh fostaıocht sa deantusaıocht go dtı le deanaınuair a chobhsaigh sı trıd is trıd. I rith an ama seo, d’eirigh Eirenıos cosula le geilleagair fhorbartha thipicula sa mheid go raibhmeath ag teacht ar thabhacht choibhneasta na deantusaıochta sagheilleagar, go hairithe o thaobh na fostaıochta de, bıodh gobhfuil meadu mor tagtha ar thairgeacht deantusaıochta.Meaduithe suntasacha tairgiulachta in earnail na deantusaıochtaa raibh nıos lu fostaithe de dhıth uirthi da bharr, maraon leheileamh meadaithe ar sheirbhısı ata nıos deine ar shaothar goginearalta, ba chuis leis seo. Faoi lathair, is ins na seirbhısı ata 66faoin gcead den fhostaıocht iomlan, i gcomparaid le 60 faoingcead deich mbliana o shin. I rith an ama seo, thit sciar nadeantusaıochta den fhostaıocht iomlan o 20 faoin gcead go 16faoin gcead. Mar gheall ar an fheidhmiu laidir in earnail na togalale deanaı, ta beagnach 12 faoin gcead den fhostaıocht iomlan arfail san earnail seo; ta an sciar seo timpeall 50 faoin gcead nıosmo na mar ata i bhfurmhor na dtıortha forbartha eile. Nıl aon dulas ach go laghdofar sciar na togala san fhostaıocht iomlan, luathno mall. Caithfear a chinntiu, a mheid is feidir, go mbeifear inann an lucht oibre seo a ionsu in earalacha eile an gheilleagairgan stro. B’fheidir go mbeidh ga le claracha suntasacha athoiliunaagus go gcaithfear timpeallacht mhaith gno a chothu chun bunufiontar nua a chur chun cinn.
Tar eis do fas ag an rata is tapula da raibh aige i mbeagnachtriocha bliain a shroichint idir lar 2003 agus lar 2004, ta an faseacnamaıoch domhanda moillithe on samhradh seo caite. Ce gurleirigh se seo, ar bhealach, go rabhthas ag filleadh ar leibheil fhaisnıos inbhuanaithe tar eis treimhse ina raibh forleathnu laidir ann,thaispean se freisin an tionchar diultach a bhıonn ag praghsannaardaithe ola. Gne amhain a tugadh faoi deara sna naoi mıosadeireannacha na nach ar mhodh comhionann a mhaolaigh an faso thır go tır. Go sonrach, lean an fas de bheith cuıosach laidir iSAM agus i dtıortha na hAise ata ag teacht chun cinn, go hairithesa tSın. A mhalairt a tharla i limistear an euro agus sa tSeapain,ina raibh an moilliu nıos suntasaı. Da bharr sin ta dibheirseachtmheadaitheach feicthe againn sa bhfeidhmiu eacnamaıoch feadhna reigiun agus ta an forleathnu domhanda ag brath nıos mo arfhas gheilleagar na Stat Aontaithe.
Quarterly Bulletin 2 2005
68
Cuireann forbairtı a tharla le deanaı an bheim arıs ar a mheid achuireann praghsanna arda luaineacha ola na hionchais fhais igcontuirt. Ag na leibheil ata anois ann, ta praghsanna ola timpeall60 faoin gcead nıos airde i dtearmaı an euro agus 70 faoin gceadnıos airde i dtearmaı dollar SAM na mar a bhı i dtus 2004. Cegur eirigh leis an ngeilleagar domhanda teacht cuıosach slan oiarmhairt phraghsanna arda an ola go dtı seo, leirıonn se seo arbhealach gur mar thoradh ar fhas laidir domhanda a d’ardaigh napraghsanna. Mar sin fein, nuair a fhanann praghsanna ola ardbıonn an chontuirt ann go rachadh siad chun dochar do nahionchais fhais.
Maidir le forbairtı i bpraghsanna, d’fhan an boilsciu agus brunnaboilscitheacha cuıosach srianta. Le fıorghairid, afach, ta fianaiseann go bhfuil brunna airithe ar phraghsanna ag teacht chun cinnsna geilleagair is mo ata chun tosaigh sa timthriall, mar shampla,i SAM. I limistear an euro afach, ta na brunna boilscitheacha fosin ısle brı, rud a leirıonn ce chomh teoranta is ata athshlanu angheilleagair.

Quarterly Bulletin 2 2005
-4
-3
-2
-1
0
1
2
3
4
5
6
DecSepJunMar'04
DecSepJunMar'03
DecSepJunMar'02
DecSepJun'01
Source: EcoWin
GDP Growth
Chart 1
% Year-on-Year
USA
Japan
UK
Euro area
69
Developments in the International
and Euro Area Economy
Overview
The pace of global economic expansion slowed since the middleof last year, due in large part to the impact of higher oil pricesand the waning of fiscal and, in some cases, monetary policystimulus. However, there has been a notable divergence acrossregions. The slowdown has been modest in those countrieswhere growth had been strong, like the US and China, whereasdomestic demand has remained subdued in those economieswhere recovery is still at an early stage, such as the euro areaand Japan. This has served to further exacerbate economicimbalances. The strength of growth has also had an impact onthe oil market. In particular, higher than expected demand fromemerging market economies has been an important factor ingenerating high and volatile oil prices. Nevertheless, the outlookfor the global economy remains positive, amid still generallyfavourable financing conditions and high levels of corporateprofitability. However, downside risks from economicimbalances and oil price developments have increased. This hasserved to dampen business confidence and discourage thechannelling of corporate resources into labour markets andcapital spending, in particular in the euro area economy.
Table 1
Changes in Key Economic Variables in Selected Economies
Real GDP Inflationa
Growth
% %
2004 2005 2006f 2004 2005 2006f
US 4·4 3·6 3·6 2·7 2·7 2·4Japan 2·6 0·8 1·9 0·0 −0·2 0·0UK 3·1 2·6 2·6 1·3 1·7 2·0
Euro Area 2·0 1·6 2·3 2·2 1·9 1·7
a Figures for the UK and Euro Area are based on Eurostat’s harmonised index of consumer prices.f Forecast.
Source: IMF World Economic Outlook, April 2005
Headline inflation rates have generally increased since aroundthe middle of last year, largely due to the impact of high oilprices. Underlying inflationary pressures, however, have beenmuted, amid still significant slack in labour markets, which isgenerally dampening wage growth. However, there are somesigns that higher input costs are passing through to producerprices of consumer goods, which may put pressure on retail

Quarterly Bulletin 2 2005
-1.0
-0.7
-0.4
-0.1
0.2
0.5
0.8
1.1
1.4
Q3Q1'04
Q3Q1'03
Q3Q1'02
Q3Q1'01
Q3Q1'00
Q3Q1'99
External Trade
Domestic Demand
Eurostat, Eurozone, Expenditure Approach,Gross Domestic Product, Total market prices
%
Contributions to real GDP
Growth, 1999-2004
Chart 2
Source: EcoWin
-0.5
0.0
0.5
1.0
1.5
2.0
2.5
3.0
3.5
4.0
4.5
5.0
DecSepJunMar'04
DecSepJunMar'03
DecSepJunMar'02
DecSepJunMar'01
DecSepJun'00
ItalyFrance
Euro areaGermany
Source: EcoWin
Euro Area GDP Growth
Chart 3
% Year-on-Year
70
prices in coming months. This is most apparent in economieswhere consumer spending is relatively strong. Also, in many ofthese economies, asset price inflation, in the form of higherhouse prices, has also given rise to some concerns. In the contextof concerns about the potential for some pick-up in inflation,monetary policy has been tightening in some countries, thoughnot in the euro area, where, reflecting subdued domesticdemand, inflationary pressures remain contained.
Section 1: Euro Area
The pace of euro area economic expansion remains subdued.The latest indications do not suggest that this will changesignificantly in the near term but conditions remain supportive ofongoing moderate economic growth. With regard to inflation, asizeable gap has emerged between headline and core inflationrates, illustrating that underlying inflationary pressures aresignificantly lower than the headline inflation rate might suggest.The latest indications are that these pressures remain largelyrestrained.
Economic Growth
National accounts data for the fourth quarter have confirmedthat the euro area recovery lost considerable momentum overthe course of 2004. Following robust growth of 0.7 per cent inthe first quarter, real activity slowed steadily throughout the restof the year, culminating in an expansion of just 0.2 per cent inthe three months to December (see table two). Weaker outputgrowth primarily reflected a decline in external stimulus; thegrowth rate was broadly balanced in the first half of 2004, butagainst the backdrop of a stronger euro, domestic demandprovided the principal support to growth in the second half ofthe year (export growth averaged 0.6 per cent in the second halfof the year, down from 2.2 per cent in the previous six months).However, the source of domestic demand growth variedbetween July and December. In the third quarter a substantialincrease in business inventories was the primary driving forcebehind the increase in output growth. In the final quarter, on theother hand, the composition of domestic activity was far morepositive — providing some upside to an otherwise disappointingheadline figure — as increases in investment and, moreimportantly, private consumption expenditure drove theexpansion. The increase in household spending was somewhatsurprising, given it corresponded with a small increase in thenumber of unemployed, ongoing subdued earnings growth, and,reflecting these factors, no substantial improvement in consumerconfidence. However, households appeared to be more willingto tap into their savings stock as the year came to a close. Withregard to investment, despite the elevated level of energy pricesand the strength of the euro, capital spending recorded its thirdsuccessive quarterly rise. The environment remained conducive

Quarterly Bulletin 2 2005
-21
-16
-11
-6
-1
4
9
Jan'05
SepMayJan'04
SepMayJan'03
SepMayJan'02
SepMayJan'01
-24
-22
-20
-18
-16
-14
-12
-10
-8
-6
-4
-2
0
2
4
Industrial Confidence
Consumer Confidence (Right Axis)
Source: EcoWin
Euro Area Confidence
Indicators
Chart 4
71
for business investment, reflecting favourable financingconditions — most notably the low level of interest rates — andthe improved nature of corporate balance sheets.
Focusing on the largest individual euro area economies, activitywas particularly weak in Germany and Italy in the final monthsof the year. Output contracted in both economies, by 0.2 percent in the former and 0.4 per cent in the latter, reflecting a sharpdecline in inventories and export growth respectively. On theother hand, French activity rebounded from a flat third quarter,expanding by 0.9 per cent, while Spanish growth maintained itsrecent strength, increasing 0.8 per cent. Accordingly, there wasa re-emergence of intra-regional growth differentials, which hadpreviously been evident in the second half of 2003.
Table 2
Contribution of expenditure components to variation in euro
area GDP
2004
Q1 Q2 Q3 Q4
Real GDP 0·7 0·5 0·3 0·2
Private Consumption 0·4 0·0 0·1 0·3Government Consumption 0·0 0·1 0·1 0·0Gross Fixed Capital Formation 0·0 0·1 0·1 0·1Inventories −0·1 0·1 0·6 −0·2Total Domestic Contribution 0·3 0·3 0·8 0·3
Exports 0·5 1·2 0·4 0·1Imports −0·1 −1·0 −1·0 −0·3Total External Contribution 0·4 0·2 −0·6 −0·1
Source: Eurostat
Note: Figures may not add due to rounding.
Turning to the first months of 2005, the picture is somewhatmixed. Strong data in January suggests that economic growthpicked-up in the first quarter, led once again by domestic activity.However, against the backdrop of a sharp weakening of dataover the course of the quarter, it is less certain if a higher rate ofgrowth can be sustained as the year progresses. Despite furtherlabour market weakness and another acceleration of oil prices,consumer spending maintained its strength in January, and to alesser extent, February. Since then a range of survey indicatorspoint to a deterioration in both confidence and activity, as wellas an increase in consumers likelihood to save moving forward;developments that are more in line with the current labourmarket and earnings environment. Similarly, following a recoveryin production at the turn of the year, indicators of businesssentiment have fallen substantially since the middle of the firstquarter, apparently reflecting a sharp moderation in orders anda deterioration of pricing power. Of particular concern is thefact that this decline in business confidence has been closelysynchronised throughout the region’s largest economies. Though

Quarterly Bulletin 2 2005
-2
-1
0
1
2
3
4
DecAugApr'04
DecAugApr'03
DecAugApr'02
DecAugApr'01
DecAug'00
US CPIJapan CPI
UK HICP
Euro area HICP
Source: EcoWin
%
Inflation in the Major
Economies
Chart 5
0
1
2
3
4
Jan'05
SepMayJan'04
SepMayJan'03
SepMayJan'02
SepMayJan'01
SepMayJan'00
Core inflation
Headline inflation
%
Euro Area Inflation
Indicators
Chart 6
Source: EcoWin
72
to a large degree based on survey rather than actual data, thedecline in consumer and business confidence (includingconfidence in the retail and services sectors) appears to adddownside risk to the outlook as we move forward. It also remainsto be seen if a recovery in external demand will compensate forweaker domestic activity; surveys suggest that export orders fellsignificantly over the course of the quarter, as the earlierappreciation of the euro, and some slowdown at the global level,took their toll.
Inflation — Recent Developments
The annual rate of headline inflation (HICP) was 2.1 per cent inMarch, unchanged from February and down from 2.4 per centin December. Oil prices and fiscal policy, mainly in the form ofincreases in tobacco taxes and government controlled prices inhealth, remain the primary contributors to upward inflationarypressure. If energy, tobacco and health prices (comprising 14 percent of the HICP index) were excluded, the inflation rate wouldhave been just 1.3 per cent. The official core rate, which excludesenergy and unprocessed food, was also significantly lower, at 1.6per cent in March. The retail prices of non-energy industrialgoods rose by just 0.3 per cent in the year to March, reflectingpast euro appreciation, weak consumer demand and a relatedhigh degree of price consciousness among consumers. Servicesprices rose by 2.5 per cent in the year to March, which is closelyin line with wage developments in this more labour-intensive andsheltered sector.
Producer prices continue to grow strongly, rising by 4.2 per centin the year to February. This is being driven in large part byenergy and intermediate goods prices, rising by 9.7 and 5.2 percent respectively, reflecting higher input costs. Nevertheless, thepass through to consumer and capital goods prices has beenquite mild, with inflation ranging between 1.3 and 1.7 per centfor these categories. However, this range was 0.8 and 1.2 percent in September, illustrating that the pace of pass through hasaccelerated in recent months. In the labour market, the stillsubdued recovery in domestic demand has yet to reduceunemployment significantly, limiting the scope for wageincreases. As a result, unit labour costs have declinedsignificantly, as wage growth remains moderate and productivityincreases in line with the upturn in production, largely exportdriven; they increased by just 0.1 per cent in the year to the thirdquarter. Negotiated wages rose by 2.2 per cent in the year tothe fourth quarter, an increase from 2.0 per cent in the previousquarter, but well within the range required for ongoing lowgrowth in unit labour costs.

Quarterly Bulletin 2 2005
70
75
80
85
90
95
100
105
110
Jan'05
SepMayJan'04
SepMayJan'03
SepMayJan'02
SepMayJan'01
SepMayJan'00
100
120
140
160
180
200
220
240
260
280
300
320
Oil Commodity Price Index (Right Axis)
IMF Non-oil Commodity Price Index
Source: EcoWin
Oil and Non-Oil
Commodity Price Indices
Chart 7
73
Overall, there is some risk that producer prices of consumergoods could creep up further and/or lead to increases in retailgoods prices. However, it would appear that the overridinginfluence is one of favourable wage developments allowing firmsto absorb the impact of higher oil prices within profit margins tomaintain competitiveness. The indications from the latest wagebargaining rounds are that wages will remain supportive so that,on balance, the potential for second round effects fromhigher oil prices on wage and price setting behaviour lookslimited.
Oil and Other Commodity Prices
Oil prices, as measured by London Brent crude, have increasedstrongly since the start of this year, rising to \38 in mid-April from\30 at the start of the year, close to highs seen in mid-October.A colder than expected winter in the US and Europe playedsome role in stimulating upward price pressures. However, themain driver appears to be further signs that demand fromemerging economies will continue to expand strongly,particularly from China where the slowdown in growth has beenmilder than expected. This could put further pressures on alreadylow levels of spare capacity and increase the potential impact ofsupply disruptions, giving rise to increased speculation infinancial markets that emerging market demand underpins astructural shift towards much higher prices. On the positive side,oil stocks have been recovering strongly in recent months fromrelatively low levels, which is increasing the buffer againstpotential supply disruptions. With supply currently exceedingdemand, albeit by a relatively small margin, the main sentimentsbehind oil price strength are based on highly uncertainassessments of the future. Nevertheless, while volatility is likelyto remain high, a significant reduction in oil prices, beyond theunwinding of short-term financial market positions, is notexpected by oil market participants.
Non-oil commodity prices have increased significantly in euroterms since the start of this year, unwinding some of thedownward trend seen in the second half of last year. Thesemovements reflect, to some extent, developments in the USdollar exchange rate, in which most commodity prices aredenominated. However, further signs that emerging marketdemand will continue to be buoyant has played an increasingrole in driving prices since the start of the year. In particular,concerns late last year regarding the possible impact of efforts byChinese authorities to curtail domestic investment have abatedsomewhat, a factor particularly evident in metals prices.

Quarterly Bulletin 2 2005
74
Box: Why is the oil market tight?
Oil prices have become centre stage again in recent months, with theEuropean headline London Brent crude measure rising by 61 per cent ineuro terms (to \38) and 69 per cent in US dollar terms (to $50) fromJanuary 2004 to March 2005, as shown in Chart A. This has had a directimpact on headline inflation, contributing 0.5 percentage points to theoverall rate of 2.1 per cent in March 2005. This box focuses on what hasunderpinned oil price strength and looks at some of the implications ofthese developments.
15
25
35
45
55
In US dollarsIn euro
200520042003200220012000
Chart A — Oil Prices
The oil market is tighter than it has been for many years, with stronglyincreasing demand squeezing spare capacity and exacerbating the threatfrom supply disruptions.
On the demand side, the global economic recovery has seen a strongincrease in oil consumption, particularly from emerging economies.According to OPEC estimates, world oil demand rose by 2.6 million barrelsper day (mbd) in 2004 to 82.1 mbd, a rise of 3.3 per cent, the highestannual increase in demand in almost 20 years. Among the developingeconomies, China stands out, accounting for around 37 per cent of thetotal increase. Oil analysts appear to have consistently underestimateddemand from emerging economies since the global economy began torecover, leading to persistent upward revisions of future demand.Furthermore, there is growing perception in financial markets that long-term growth in emerging economies underpins a structural shift in oilprices.
On the supply side, it is estimated that world oil supply amounted to 82.7mbd last year, exceeding demand by 0.6 mbd. OPEC also claims to havethe capacity to bring further supplies to the market in the short-run ifnecessary. On the face of it, this begs the question as to why oil priceskeep rising. However, looking deeper at the market, the general responsefrom oil producers to the surge in oil prices has been disappointing, whichsuggests that supply constraints are prominent. Some of these constraintshave been transitory, such as the impact of hurricanes on North Americanproduction and political instability on Venezuelan production. However,there appear to be more fundamental problems. During the period of lowoil prices from 1985 to 1999, oil companies concentrated on cost savings,which led to little expansion in actual refining capacity. As it takes sometime for new investment in oil capacity to come on stream (many years inthe case of ‘‘greenfield’’ investment), global refinery capacity growth hasnot kept pace with oil output in recent years. There are other problems.In non-OPEC oil producing regions, many oil fields are quite mature andproducing at declining rates. Within OPEC, much of the spare capacity,
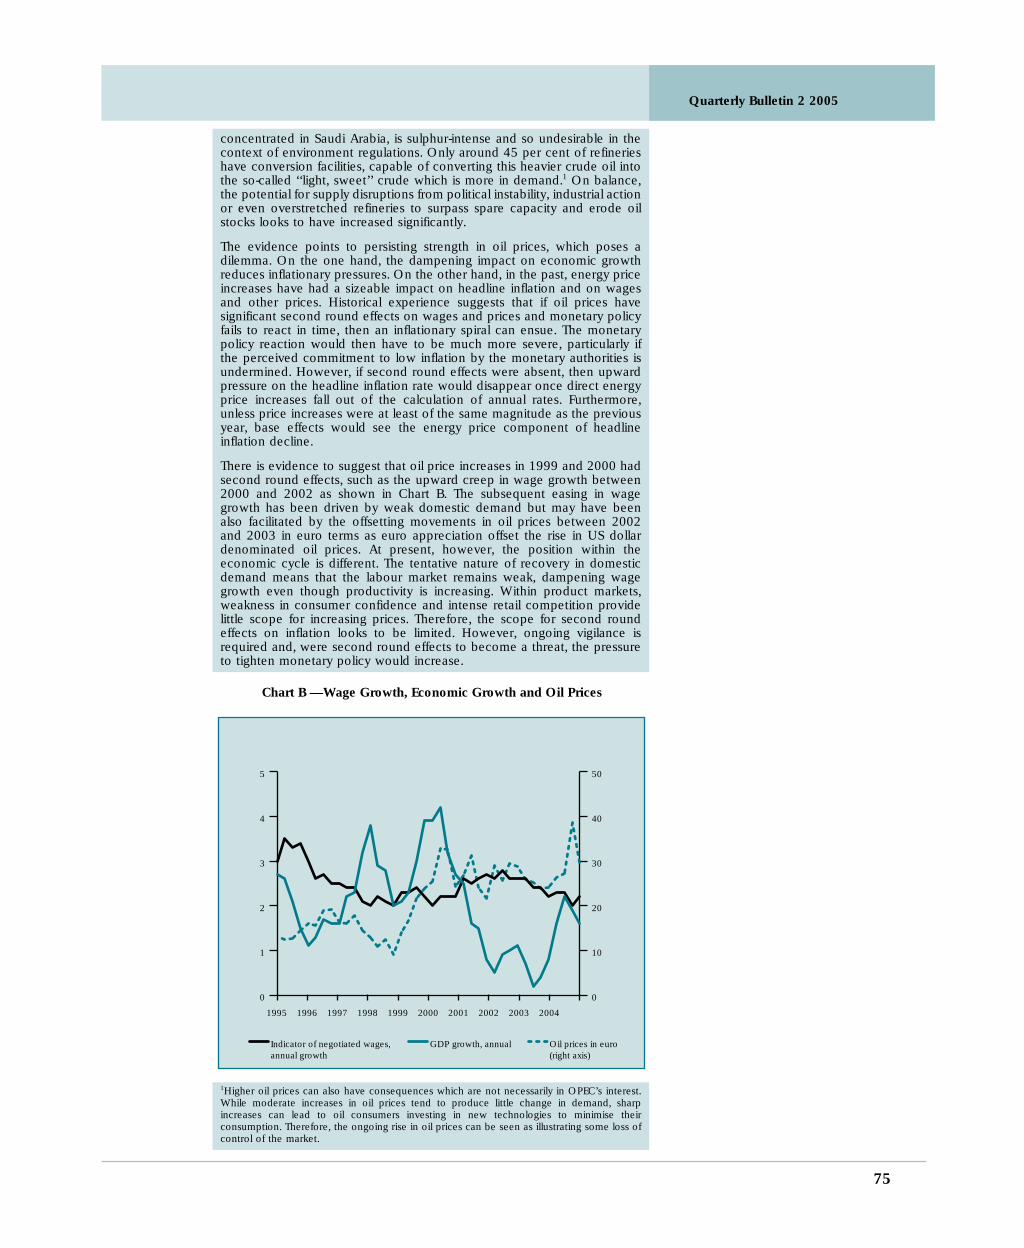
Quarterly Bulletin 2 2005
75
concentrated in Saudi Arabia, is sulphur-intense and so undesirable in thecontext of environment regulations. Only around 45 per cent of refinerieshave conversion facilities, capable of converting this heavier crude oil intothe so-called ‘‘light, sweet’’ crude which is more in demand.1 On balance,the potential for supply disruptions from political instability, industrial actionor even overstretched refineries to surpass spare capacity and erode oilstocks looks to have increased significantly.
The evidence points to persisting strength in oil prices, which poses adilemma. On the one hand, the dampening impact on economic growthreduces inflationary pressures. On the other hand, in the past, energy priceincreases have had a sizeable impact on headline inflation and on wagesand other prices. Historical experience suggests that if oil prices havesignificant second round effects on wages and prices and monetary policyfails to react in time, then an inflationary spiral can ensue. The monetarypolicy reaction would then have to be much more severe, particularly ifthe perceived commitment to low inflation by the monetary authorities isundermined. However, if second round effects were absent, then upwardpressure on the headline inflation rate would disappear once direct energyprice increases fall out of the calculation of annual rates. Furthermore,unless price increases were at least of the same magnitude as the previousyear, base effects would see the energy price component of headlineinflation decline.
There is evidence to suggest that oil price increases in 1999 and 2000 hadsecond round effects, such as the upward creep in wage growth between2000 and 2002 as shown in Chart B. The subsequent easing in wagegrowth has been driven by weak domestic demand but may have beenalso facilitated by the offsetting movements in oil prices between 2002and 2003 in euro terms as euro appreciation offset the rise in US dollardenominated oil prices. At present, however, the position within theeconomic cycle is different. The tentative nature of recovery in domesticdemand means that the labour market remains weak, dampening wagegrowth even though productivity is increasing. Within product markets,weakness in consumer confidence and intense retail competition providelittle scope for increasing prices. Therefore, the scope for second roundeffects on inflation looks to be limited. However, ongoing vigilance isrequired and, were second round effects to become a threat, the pressureto tighten monetary policy would increase.
0
1
2
3
4
5
0
10
20
30
40
50
Oil prices in euro(right axis)
Indicator of negotiated wages,annual growth
GDP growth, annual
2004200320022001200019991998199719961995
Chart B — Wage Growth, Economic Growth and Oil Prices
1Higher oil prices can also have consequences which are not necessarily in OPEC’s interest.While moderate increases in oil prices tend to produce little change in demand, sharpincreases can lead to oil consumers investing in new technologies to minimise theirconsumption. Therefore, the ongoing rise in oil prices can be seen as illustrating some loss ofcontrol of the market.

Quarterly Bulletin 2 2005
0
2
4
6
8
10
12
Jan'05
SepMayJan'04
SepMayJan'03
SepMayJan'02
SepMayJan'01
Sep'00
Private Sector CreditM3
Source: EcoWin
Euro Area Monetary
Aggregates
Chart 8
Year-on-year growth%
76
Money Supply
Monetary growth has been on an upward trend since the middleof last year, with the money supply expanding by 6.4 per cent inFebruary from 5.9 per cent in November and a trough of 4.8 percent last May. The three-month moving average growth rate, thepreferred measure, has risen to 6.5 per cent in February from 5.9per cent in November. The low level of interest rates, whichreduces the opportunity costs of holding liquid assets, appearsto have been the dominant force in recent months. Theunwinding of portfolio holdings of liquid assets, built up duringthe period of heightened economic and financial marketuncertainty from 2001 to mid-2003, had outweighed this effectup to the middle of last year but has since tapered off somewhat.Credit growth has also picked up, rising by 6.6 per cent in theyear to February, from 6.0 per cent in November. This reflectsan increase in the annual growth rate of credit to the privatesector, to 7.3 per cent (from 6.7 per cent) and credit to generalgovernment, to 3.9 per cent (from 3.3 per cent). The main driverof credit growth is lending for house purchase, which rose by10.1 per cent in the year to February.
Growth in the money supply remains higher than that needed tosustain economic recovery and, moreover, the persistence ofstrong monetary growth has created excess liquidity. However,apart from house price increases in some countries, there is littlesign that this is generating broader inflationary pressures, in anenvironment of persisting weakness in domestic demand.Looking ahead, the likely gradual nature of any recovery indomestic demand should limit the potential for inflationarypressures into the future. Nevertheless, close vigilance isrequired.
Inflation — Outlook
Headline inflation may remain volatile in coming months, andcould remain close to 2 per cent, due to the impact of oil prices.However, underlying inflationary pressures look set to remainlargely subdued as domestic demand has yet to gain enoughmomentum to impact significantly on the labour market, restoreconsumer confidence or drive production to close to capacityrates. This should facilitate continued moderation in the core rateof inflation, particularly as wages look set to continue to supportfavourable unit labour cost developments. This underpinsexpectations that headline inflation will decline from currentlevels, unless second round effects become apparent or theeconomy recovers faster than expected. All other things beingequal, the headline rate of inflation in year-on-year terms will startto move towards the core rate of inflation when monthly energyand unprocessed food price increases fail to exceed those oftwelve months earlier. The timing of such convergence, however,remains highly uncertain though current oil futures prices implysome moderation in the headline rate of inflation later this year.

Quarterly Bulletin 2 2005
Deposit rate
Marginal lending facility
Main refinancing rate/Minimum bid rate
%
ECB Interest Rates
Chart 9
Source: EcoWin
Jan'05
SepMayJan'04
SepMayJan'03
SepMayJan'02
0
1
2
3
4
5
6
-1
0
1
2
3
4
5
6
Jan'05
AprOctJulAprJan'04
OctJulAprJan'03
OctJulAprJan'02
OctJulAprJan'01
United States, BBA LIBOR 3 month, USDJapan, BBA LIBOR 3 month, JPY
United Kingdom, LIBOR 3 month Bid Rate, GBP
Euro Zone, EURIBOR (360 Day) 3 month, EUR
Source: EcoWin
Three Month Interest Rates
Chart 10
%
77
Monetary Policy
The level of official interest rates have remained unchanged athistorical lows since June 2003, with the minimum bid rate onthe main refinancing operations at 2.0 per cent, the rate on themarginal lending facility at 3.0 per cent and the rate on thedeposit facility at 1.0 per cent. The economic analysis shows that,with moderate growth and uncertainty still prevailing, underlyinginflationary pressures remain largely subdued, and there is noevidence of second round effects from earlier sharp increases inenergy prices, indirect taxes or administered prices. Themonetary analysis points to the existence of excess liquidity inthe economy, but suggests that the likely gradual nature ofrecovery in domestic demand would limit the potential for thisto generate inflationary pressures. Cross-checking the economicand monetary analysis leads to the assessment that the outlookfor price stability in the medium term remains favourable thoughongoing vigilance is required.
New EU Member States
Each of the ten countries that joined the EU on 1 May 2004 hasindicated a desire to join the euro area, at various target datesranging up to 2010. One of the criteria for EMU is membershipof the Exchange Rate Mechanism for the two years prior toassessment without major pressures. Estonia, Lithuania andSlovenia joined the Exchange Rate Mechanism on 28 June and,since then, each of their currencies has traded around theircentral rate with little fluctuation.
The new member states continued to enjoy strong economicgrowth in the second half of last year and early this year, exceptfor Malta where tourism revenue has slowed. Strong growth inproductivity continues to underpin external competitiveness sothat exports are gaining market shares abroad. Within domesticdemand, it supports investment through attractive rates of returnon capital and consumer spending by facilitating strong wageincreases. Furthermore, the related appreciation of somecurrencies is dampening inflationary pressures. Nevertheless,there are inflationary risks from strong domestic demand and thepass through effects from wage increases in export sectors whereproductivity tends to be strongest. In particular, there are signsin some countries that wage inflation in non-export sectors hasincreased sharply and well in excess of productivity growth. Thismay be partly related to second round effects from higherindirect taxes and increases in energy, food and someadministered prices last year. Credit growth is also very strong inmost countries, which is giving rise to concerns that residentialproperty price inflation in particular may be excessive. Withmonetary policy in most countries largely tied to stabilizing theexchange rate, it is important that fiscal policy plays a morecounter-cyclical role. Only Estonia had a fiscal surplus last year.
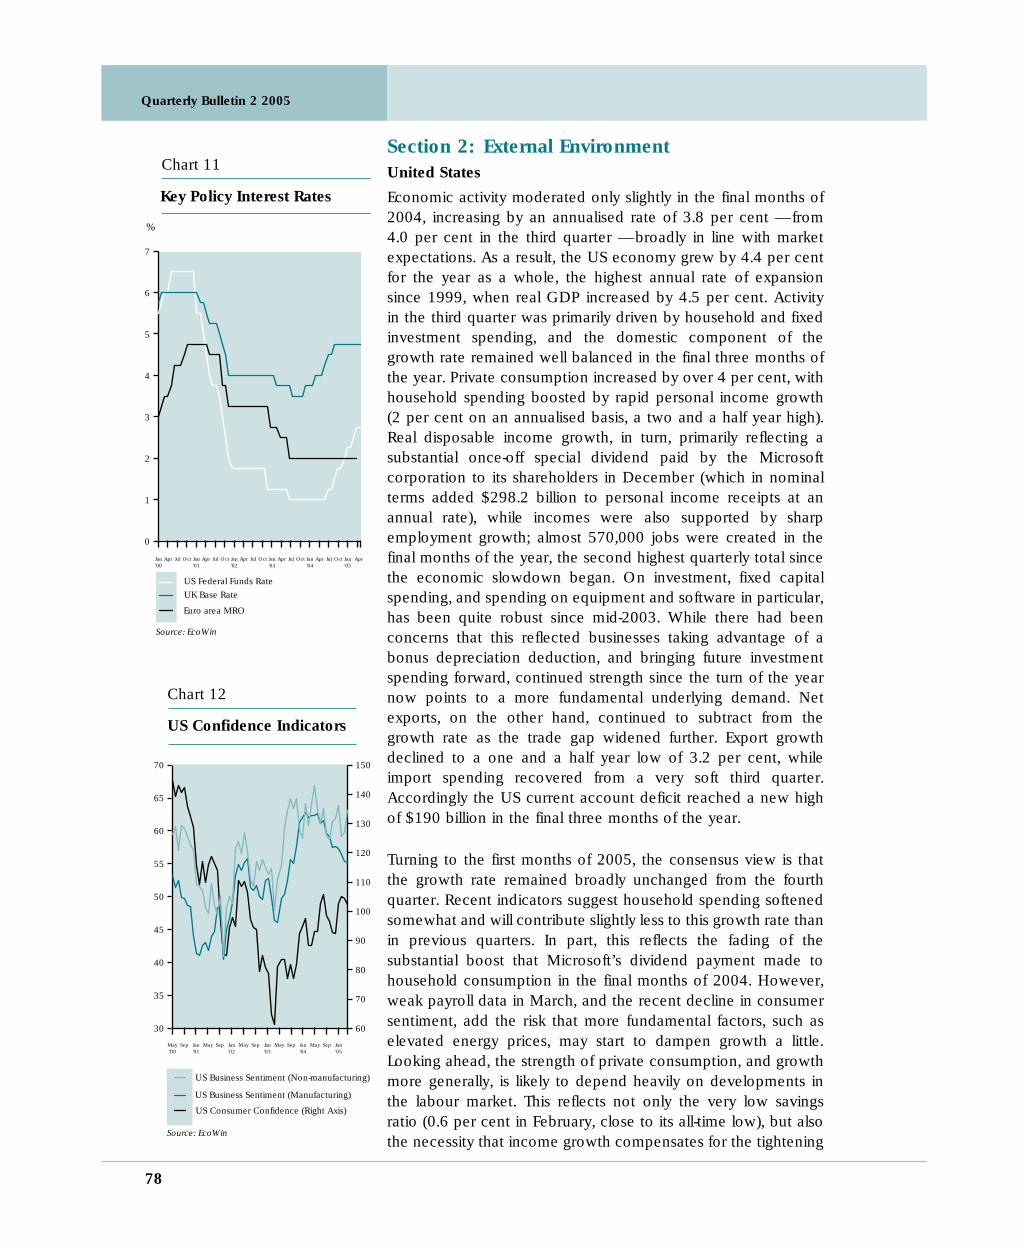
Quarterly Bulletin 2 2005
0
1
2
3
4
5
6
7
AprJan'05
OctJulAprJan'04
OctJulAprJan'03
OctJulAprJan'02
OctJulAprJan'01
OctJulAprJan'00
US Federal Funds Rate
UK Base Rate
Euro area MRO
Key Policy Interest Rates
Chart 11
%
Source: EcoWin
60
70
80
90
100
110
120
130
140
150
30
35
40
45
50
55
60
65
70
Jan'05
SepMayJan'04
SepMayJan'03
SepMayJan'02
SepMayJan'01
SepMay"00
US Business Sentiment (Non-manufacturing)
US Business Sentiment (Manufacturing)
US Consumer Confidence (Right Axis)
Source: EcoWin
US Confidence Indicators
Chart 12
78
Section 2: External Environment
United States
Economic activity moderated only slightly in the final months of2004, increasing by an annualised rate of 3.8 per cent — from4.0 per cent in the third quarter — broadly in line with marketexpectations. As a result, the US economy grew by 4.4 per centfor the year as a whole, the highest annual rate of expansionsince 1999, when real GDP increased by 4.5 per cent. Activityin the third quarter was primarily driven by household and fixedinvestment spending, and the domestic component of thegrowth rate remained well balanced in the final three months ofthe year. Private consumption increased by over 4 per cent, withhousehold spending boosted by rapid personal income growth(2 per cent on an annualised basis, a two and a half year high).Real disposable income growth, in turn, primarily reflecting asubstantial once-off special dividend paid by the Microsoftcorporation to its shareholders in December (which in nominalterms added $298.2 billion to personal income receipts at anannual rate), while incomes were also supported by sharpemployment growth; almost 570,000 jobs were created in thefinal months of the year, the second highest quarterly total sincethe economic slowdown began. On investment, fixed capitalspending, and spending on equipment and software in particular,has been quite robust since mid-2003. While there had beenconcerns that this reflected businesses taking advantage of abonus depreciation deduction, and bringing future investmentspending forward, continued strength since the turn of the yearnow points to a more fundamental underlying demand. Netexports, on the other hand, continued to subtract from thegrowth rate as the trade gap widened further. Export growthdeclined to a one and a half year low of 3.2 per cent, whileimport spending recovered from a very soft third quarter.Accordingly the US current account deficit reached a new highof $190 billion in the final three months of the year.
Turning to the first months of 2005, the consensus view is thatthe growth rate remained broadly unchanged from the fourthquarter. Recent indicators suggest household spending softenedsomewhat and will contribute slightly less to this growth rate thanin previous quarters. In part, this reflects the fading of thesubstantial boost that Microsoft’s dividend payment made tohousehold consumption in the final months of 2004. However,weak payroll data in March, and the recent decline in consumersentiment, add the risk that more fundamental factors, such aselevated energy prices, may start to dampen growth a little.Looking ahead, the strength of private consumption, and growthmore generally, is likely to depend heavily on developments inthe labour market. This reflects not only the very low savingsratio (0.6 per cent in February, close to its all-time low), but alsothe necessity that income growth compensates for the tightening

Quarterly Bulletin 2 2005
79
of policy stimulus. While increasing capacity utilisation, strongcorporate profits and the anticipated moderation in productivitygrowth should support a more sustained recovery in the labourmarket in the coming months, the current volatility ofemployment growth also points to an element of downside riskto the growth outlook as we move ahead.
In relation to monetary policy, the Federal Reserve increasedinterest rates by 25 basis points at both their February and Marchmeetings — as expected — bringing the rate to 2.75 per cent, athree-year high. While continuing to stress that ‘policyaccommodation can be removed at a pace that is likely to bemeasured’ in a statement following the March meeting, theFederal Open Market Committee (FOMC) noted that ‘pressureson inflation have picked-up in recent months and pricing poweris more evident’. The statement also added that ‘with appropriatemonetary policy action, the upside and downside risks to pricestability should be kept roughly equal’. These comments wereperceived as reflecting growing concerns that price pressures inthe US economy are accelerating, although evidence of this hasso far been mixed. The core CPI has been following a broadlyupward trend since early last year, and rose to 2.4 per cent inFebruary; the core GDP deflator, on the other hand, thought tobe the FOMC’s preferred gauge of inflation, has been quitestable since last Spring, and remained unchanged at 1.6 per centin February.
Table 3
Contribution of expenditure components to variation in US
GDP
2004
Q1 Q2 Q3 Q4
Real GDP 4·5 3·3 4·0 3·8
Private Consumption 2·9 1·1 3·6 2·9Government Consumption 0·5 0·4 0·1 0.2Gross Fixed Capital Formation 0·7 2·1 1·4 1·7Inventories 1·2 0·8 −1·0 0·5Total Domestic Contribution 5·3 4·4 4·1 5·3
Exports 0·7 0·7 0·6 0·3Imports −1·5 −1·8 −0·7 −1·7Total External Contribution −0·8 −1·1 −0·1 −1·4
Source: US Bureau of Economic Analysis.Note: Figures may not add due to rounding.
United Kingdom
In the UK, output growth strengthened in the final quarter of2004 to 0.7 per cent, from 0.6 per cent in the previous threemonths, implying an annual growth rate of 2.9 per cent. Overthe second half of 2004, private consumption has shown signsof moderating (in the fourth quarter, reflecting a further coolingin the housing market), while there is some evidence emerging

Quarterly Bulletin 2 2005
80
of improvements in investment and exports. (Export growthrecovered to a quarterly rate of 1.6% in the final quarter.)
Turning to the first quarter of 2005, consumption data has beenmixed. In the three months to February, retail sales declined 0.6per cent, increasing concerns that private consumption remainedvery weak in the first quarter. Furthermore, survey evidencesuggests that no real recovery took place recently, whileconsumer confidence remains at low levels. Confidence should,however, find some support from the robust labour market.Nevertheless, concerns over tighter monetary policy appear tobe having some impact on household spending, particularlygiven the attention that a weaker housing market has beenreceiving. In recent months, both house prices and activityindices have shown continued signs of a steady decline. Withrespect to output, following an improvement in the industrialsector in the final quarter of 2004, the index of production rose0.6 per cent in the three months to January — the first increasesince July of last year. However, recent business surveys arebeginning to display the negative impact of the recent increasein oil prices, and, furthermore, industrial production rose aweaker 0.4 per cent in the three months to February (−0.4%m/m), while manufacturing output increased 0.4 per cent (−0.5%m/m).
Turning to general price developments, CPI inflation, having risen0.1 per cent in December to 1.6 per cent, remained unchangedin January and February, with upward pressures persisting fromtransport goods and seasonal goods. CPI inflation continues toremain well below its target range of 2 per cent.
Japan
In Japan, economic activity continues to experience someweakness. Having contracted for two consecutive quarters, realGDP expanded 0.1 per cent in the final three months of 2004,compared with the initial estimate of a 0.1 per cent contraction.This was an important revision, given that the previous estimateindicated three quarters of negative growth, giving rise toconcerns about Japan falling back into recession.
The outlook for the Japanese economy in the near future remainsuncertain. While robust growth in the US should boost theeconomy and increase exports, and furthermore, expectedimprovements in domestic labour markets should begin to fuel apick-up in domestic demand, recent economic data suggests thatthe recovery remains weak. The quarterly Tankan survey fell toits lowest level in a year in the first quarter, the largest drop inconfidence since September 2001. In addition, recent reportsshowed falling factory production (largely due to the ongoinginventory adjustment in IT-related sectors) and weakeninghousehold spending, while decelerating exports, which started at

Quarterly Bulletin 2 2005
-30
-25
-20
-15
-10
-5
0
5
10
15
20
MarJan'05
NovSepJulMayMarJan'04
NovSepJulMayMarJan'03
NovSepJulMayMarJan'02
Yen
Pound Sterling
US Dollar
Source: EcoWin
Chart 13
Exchange Rate
Changes for the Euro
Note:
This chart showspercentage changesin Euro exchangerates by reference to 31 December 1998.
81
the end of last year, continues. Furthermore, deflationarypressures persist, with both headline and core CPI coming underrenewed downward pressure in February. Annual CPI inflationdeclined by 0.3 per cent, from −0.1 per cent in the previousmonth, while the core rate decreased further, by −0.4 per cent,following a 0.3 per cent decline in January.
Non-Japan East Asia
In Non-Japan East Asia, a modest deceleration in economicactivity continues in a number of economies, however, for theregion as a whole, growth is continuing to expand at a robustpace. While there has been a moderate loss of exportmomentum, largely the result of industrial activity slowdown,private consumption is still relatively robust, and, furthermore,inflationary pressures have remained muted. In China, economicactivity reaccelerated at the end of 2004, with real GDP growthreaching 9.5 per cent in the fourth quarter, from 9.1 per cent inthe previous three months. Furthermore, growth has been robustsince the beginning of 2005, supported by strong tradedevelopments, while, on a year-on-year basis, industrialproduction and retail sales continued to expand. Meanwhile, inSouth Korea, overall economic activity remains relatively robust,despite some deceleration of exports recently. However, on theupside, there are tentative signs of an improvement in domesticdemand.
Section 3: Financial Environment
Exchange Rates
During the early part of 2005, the US dollar appreciated againstthe euro, with widening interest rate differentials between them,weighting on the latter. However, between mid-February andmid-March, the US dollar began to weaken and the USD/EURreturned back to levels seen at the end of 2004 ($1.34). Thisowed largely to the re-emergence of concerns over ongoingstructural imbalances in the US economy, coupled with concernsabout possible official reserve diversification (predominantly byAsian and Middle Eastern central banks). More recently, itappears that the focus of the foreign exchange market has shiftedto relative interest rate expectations and growth differentials, andas a result, the US dollar has appreciated. Against thisbackground, the euro eased to around $1.28 by mid-April.
Bond Markets
Bond markets exhibited relatively large swings over the firstquarter of 2005. At the beginning of the year, longer-termgovernment bond yields continued to decline in the majoreconomies. However, between mid-February and late March,both real and nominal bond yields rebounded in the majoreconomies, with a more pronounced increase in US bond yieldscompared to euro area bond yields. US yields rose particularly

Quarterly Bulletin 2 2005
3.3
3.8
4.3
4.8
5.3
5.8
6.3
6.8
Jan'05
SepMayJan'04
SepMayJan'03
SepMayJan'02
SepMayJan'01
SepMayJan'00
US
UK
Euro area
Source: EcoWin
%
Bond Yield: 10-year
Chart 14
82
sharply in response to the March FOMC statement, which wasperceived as signaling the possibility of a more substantialmonetary tightening in the US. However, yields easedsubsequently as markets revised this view. Consequently, by mid-April, ten-year bond yields in the United States were around 10basis points higher than the end of December last year.
Equity Markets
Since the end of January, global equity markets have experiencedmixed developments. In the early part of the review period,positive earnings reports, increased merger and acquisitionactivity, together with lower oil prices and reduced politicaltensions resulted in an improvement in US equities, which wasalso reflected in the European markets — where equities reachedthree year highs. However, heightened fears of faster interest ratehikes in the US, together with higher global bond yields, weakerearnings reports and elevated oil prices, led to US equities fallingin March. Despite these factors having a downward impact onglobal markets, the Nikkei and European equities broadlyimproved over the period.
Changes in interest rate expectations in financial markets havehad a significant impact on US bond yield developments, whilea further important factor appears to have been the commentsof Federal Reserve Chairman Greenspan, on the difficulties ofexplaining the behaviour of world bond markets. Reflectingrecent developments, the yield differential between US and euroarea ten-year bonds widened over the period. This decouplingmay reflect more favourable developments in the growth outlookfor the US economy compared with the euro area, andfurthermore, different expectations as to the outlook formonetary policy.
Quarterly Bulletin 2 2005
83
Some Perspectives on Ireland’s and
Europe’s Economic Performance
Address by John Hurley, Governor, to CorkChamber of Commerce Business Breakfast on28 January 2005
Introduction
It gives me great pleasure to speak to you today. I should first ofall like to wish you every success in your year as the EuropeanCapital of Culture. The formal launch of this on 8 January was amost impressive spectacle.
Like many other areas of the country and, indeed, like thecountry as a whole, Cork has witnessed a great economictransformation over the past decade or two. The Cork area isnow widely known for its thriving chemicals and pharmaceuticalssector and other high technology businesses. Of course, thecounty of Cork continues to be a major producer of agriculturalproducts and this broad sector has adjusted well to changingcircumstances. The great modernisation of infrastructure in theCork region is also a clear indicator of very impressive progress.
Irish Economic Growth
The Irish economy’s performance over the past decade or sohas been very satisfactory. The annual average growth in GrossNational Product, the best measure of our living standards, hasbeen about 61⁄2 per cent a year. This excellent performance hasbrought our living standards up to those of other developedcountries. On a Gross Domestic Product basis, our livingstandards would be among the highest in the world. However,this is not a true measure of our living standards, since asignificant part of our GDP is repatriated overseas. This reflectsthe relatively large presence of multi-national companies in theIrish economy compared with elsewhere. When based on GNP,our living standards are slightly above the European average andrank sixth, for example, among the twelve euro area countries.
Economic growth results from increased employment andproductivity growth. During the past decade or so, we boostedour employment rate substantially. As a proportion of theworking age population, the employment rate increased byabout a third from around 50 per cent to the present rate of 66per cent. This has been a major achievement. Ireland’s principaleconomic problem in the past has been our inability to provideemployment for a sufficiently large fraction of the population. Asa result, we suffered from large-scale involuntary emigration. It ishard to believe that, as recently as the early 1990s, ourunemployment rate was in the 15 to 16 per cent range.

Quarterly Bulletin 2 2005
84
Our excellent employment performance has enabled us toreduce unemployment to its current low rate of 41⁄2 per cent.This provided greatly enhanced employment opportunities forthose who had not been in the work force before. It facilitatedthe employment of a continuing movement of labour out of theagricultural sector. It also supplied off-farm income opportunitiesfor farmers. Immigrants, both returned Irish and others, werereadily absorbed. Over the past decade or so, employment hasincreased by about 50 per cent — around 4 per cent a year.Increased part-time working and a shorter working week reducedthis annual increase in labour producing goods and services to 3per cent. With regard to the second element in economic growth— productivity — our improvement, while somewhat lessspectacular, is, nonetheless, quite satisfactory. The averageannual increase in productivity, calculated on a GNP basis, wasabout 31⁄2 per cent. This was a good performance compared withmost industrial countries; for example, the corresponding figurefor the euro area was only about 11⁄4 per cent a year.
It is clear, looking ahead, that it would be unrealistic to expect acontinuation of the growth rates of the past decade, particularlythe more than 8 per cent GNP growth rate in the Celtic Tigerperiod between 1994 and 2000. The reason for this is that wehave largely absorbed into employment those who in the pastwere either unable to find employment or were discouragedfrom seeking employment by apparently poor job prospects.
However, there is still some scope for raising our employmentrate. For example, there is still a significant gap between Ireland’semployment rate and that of Scandinavian countries and the US;the employment rate in the US is about 71 per cent comparedwith 66 per cent for Ireland. Apart from raising the employmentrate to such a level, the potential growth in employment dependson the natural increase in the labour force and the level ofimmigration. This would permit employment growth of the orderof 2 to 21⁄2 per cent in the coming years.
Both economic analysis and international experience show thatproductivity growth is determined by increased capital perworker and technical progress. The advance of technology wasseen in the past as developing generally in response to influencesthat were outside the scope of economic policies. More recentinsights into economic growth processes show that the advanceof technical progress can be aided by sound, purposive policies.It is now widely accepted that an environment that is favourableto investment and innovation promotes growth. Both economictheory and experience make it clear that such an environmentrequires two elements — a stable macroeconomic setting and awell-functioning market economy.

Quarterly Bulletin 2 2005
85
In the macroeconomic sphere, it is clear that a framework ofprice stability and sound public finances provides the best basisfor growth. As a central banker, I would place major emphasison the importance of price stability. Our inflation rate is currentlyrunning at about 21⁄4 per cent a year. After a long period ofrelatively low inflation, we may have forgotten its importance foreconomic progress. High inflation results in high nominal interestrates, and, from an economic growth and developmentperspective, it is detrimental to long-term investment. It alsoerodes the real value of fixed incomes. These are just a fewexamples of the distortions and inefficiencies caused by inflation.It is now well established and, I think, very widely accepted, thatprice stability is a necessary condition for good economicperformance. That is why the European Central Bank and,indeed, central banks generally attach so much importance toensuring price stability. Fiscal policy is also a major element ofmacroeconomic policy. We know from our own experience thatsound fiscal policy minimises the risk of overheating and inflation.It also limits the pressure that could otherwise be placed on themonetary authorities to maintain a stable macroeconomicenvironment. Sound fiscal policy also enables the tax burden tobe kept to a reasonable level. An important aspect is that it leavesGovernment in a better position to finance the investment ininfrastructure that is necessary for economic growth. All thingsconsidered, Ireland has done generally well in themacroeconomic area — both in terms of inflation and fiscal policy— over the past decade or so, and this has undoubtedlycontributed greatly to our good economic performance.
Complementary to macroeconomic stability, well-functioningmarkets are also a pre-requisite for good economic performance.This boils down in practice to the need to ensure that product,labour and financial markets are characterised by competitionand that they are adaptable and flexible. A very important aspectof this is to ensure that the forces of competition can operateeffectively. Where this is not the case, firms produce less thanwith the presence of competition and prices will be higher. Theabsence of competition in sectors of the economy also tends toinduce complacency in incumbents. This leads to a lack ofdynamism and slowness to embrace innovation, whichrepresents a drag on economic performance and, in particular,on productivity growth.
The European Dimension
Before I address these issues in some more detail, I think it isuseful to put them in a European context. What is most relevanthere is the Lisbon Agenda. This has been focussed on improvingeconomic performance in Europe over the past few years. It hasbeen motivated by Europe’s generally poor record, apart from afew countries including Ireland, in regard to both employment

Quarterly Bulletin 2 2005
86
and productivity growth. Moreover, in recent years, the growthperformance of the European economy has been disappointing,with the economic upturn in Europe much weaker than in theUS and Asia.
The longer term trend is also worrying — the European economyhas grown less quickly than the US over the last decade, duringwhich time Europe has moved from having a higher rate ofproductivity growth than the US, to a lower one. The problem,however, is not simply the comparison with the US —productivity growth in Europe has deteriorated with respect toits own past. The net result has been a slowdown in the rate ofgrowth of output per head, the main determinant of livingstandards. Relative to the US, in terms of the improvement inliving standards, Europe is now losing ground.
These developments have raised questions as to whetherEurope’s economic structures are less favourable for economicgrowth. In particular, it would appear that structural rigiditieshave meant that the European economy has been slow to adaptto the increasing pressures of globalisation and rapidtechnological change. International competition is intensifyingand Europe faces a dual challenge from the US and Asia. ForEurope to prosper, it needs to have an appropriate economicbase, recognising that in the decades ahead competition inglobal markets is going to be intense.
It was for these reasons that, in Lisbon in March 2000, the then15 EU leaders agreed that the EU should commit to raising therate of economic growth and employment. In the Lisbon strategyEuropean leaders committed the EU to become by 2010 ‘themost dynamic and competitive knowledge-based economy inthe world capable of sustainable economic growth with moreand better jobs’. However, so far, progress in achieving theLisbon objectives has been poor. There are various reasons forthis. In terms of the economic environment, the last four yearshave not been helpful to the chances of achieving the Lisbongoals. Many countries have found themselves in a dilemma —because of structural weakness and weak demand. As nationaleconomic performance has been poor, it has been more difficultto implement the Lisbon agenda.
However, the problems in delivering on Lisbon objectives havenot been solely or even largely due to outside circumstances.There is the problem that the strategy itself has become toobroad. In order to improve the chances of achieving the Lisbonobjectives, the coherence and consistency of structural reformpolicies need to be improved, as does the process of delivery.Success of the reform agenda is essential if Europe is to generatemore growth and more employment in an environment ofincreasing global competition, population ageing andenlargement.
Quarterly Bulletin 2 2005
87
In keeping with the principle of subsidiarity in the EU, it is theresponsibility of each country to take the structural reformmeasures to improve its economic performance. However, it isclear at the half-way stage of the ten year period for the LisbonAgenda that, across Europe in general, progress has been verypoor. With the new EU Commission, steps are being taken torelaunch the Agenda, and this is now underway. It seems likelythat this will involve a more focused approach with a clearerstatement of where responsibilities lie for making progress.
Ireland and the Lisbon Agenda
While, as I have indicated, progress with the Lisbon Agenda hasbeen very poor across Europe as a whole, particularly in thelarger continental countries, Ireland’s record has been relativelygood. It may be useful to consider in broad terms some of themajor structural reform issues in the Lisbon Agenda, and tobriefly assess how Ireland has performed.
Promoting the Knowledge Economy
The objective in relation to the knowledge economy is to adoptpolicies that promote research and development and theapplication of information technology and innovation generallywith a view to improving productivity and growth. While there isa role for direct participation by Government agencies inresearch and development activities, it can arguably bestfacilitate private R&D activities by creating the appropriateframework conditions for such activities. In particular, thestrengthening of academic-industry links and ensuring adequateintellectual property rights are important. Most Governments,including our own, are conscious of the need to distinguishbetween inputs and outputs in this regard. A careful evaluationof the effectiveness of schemes is necessary. Foreign investmentinflows can be an important and efficient channel fordisseminating new technologies, and Ireland has benefitedsignificantly from this. It is also necessary to ensure that anadequate skilled workforce is available both to conduct researchwork and to apply the new technologies. In particular, anadequate supply of scientists and engineers is of fundamentalimportance. On most counts, Ireland has done well in this broadarea. The data show, however, that private R&D activities areconducted on a fairly modest scale here, and would need to bestepped up.
Ensuring More Competition
In recent years, more competition has been evident in theeconomy. Being a very open economy has meant that Ireland isvery much affected by international competitive forces. The EUinternal market and the wide range of measures taken toimplement it are a strong influence. At home, the powers of theCompetition Authority have been strengthened and it has been

Quarterly Bulletin 2 2005
88
quite active and effective in pursuing its agenda. Nonetheless,there is scope for considerable progress.
There are a number of areas, common to Ireland and a largenumber of other European countries, where such progress couldbe made. The National Competitiveness Council has drawnattention to our very high utilities’ prices in its reports. Becauseof their structure and characteristics, utilities’ sectors are highlyconcentrated, and their operations must be subject to specialcompetition and regulatory arrangements. We also have a longway to go in introducing more competition to the services areagenerally. In its assessment of Ireland’s progress with the EU’sBroad Economic Policy Guidelines, the EU Commission hasdrawn attention to the need to foster competition in professionalservices, retail distribution and insurance. There still aresignificant barriers to entry in many professional services inparticular, and, as a consequence, prices here are very high byinternational standards.
Fostering Entrepreneurship
A dynamic economy requires an environment that is supportiveof entrepreneurship. There are a number of aspects to this. Atone level, the administrative burden of establishing and runninga business should be kept to a minimum; ‘red tape’ should beeliminated where possible. Where necessary, public sectorefficiency should be improved. Educational policies should besupportive of entrepreneurship, and there may be a need toimprove access to finance. Ireland would seem to score well inthis area. Although there is, no doubt, always room forimprovement, the OECD has confirmed that the regulatoryburden on business in Ireland is low. There is also the fact thatour business taxes are low by international standards. Theexpansion of the economy, new business start-ups andemployment growth are indicative of our positive performancein this area.
Promoting Employment and Greater Social Cohesion
The EU ECOFIN Council last year emphasised the importance ofa number of labour market reforms. These highlighted the needfor greater flexibility of labour markets, to adapt employmentprotection where necessary to improve employability, and toadapt tax and benefit systems to improve work incentives. It wasrecognised that employment was the best way to ensure socialinclusion. Wage flexibility and adequate infrastructure were seenas desirable for coping with regional differences, and the socialpartners were urged to balance the interests of both insiders —the employed — and outsiders — the unemployed.
In general, Ireland performs well against these recommendations.This is evident from our very good labour market record in theface of general economic weakness in the past few years.

Quarterly Bulletin 2 2005
89
Ensuring Long-term Sustainability of the Public Finances
The fifth and final area that I would mention in regard to theLisbon Agenda is the issue of pensions and the related risks thatthis may pose for the public finances in the years ahead. Ifappropriate measures for dealing with this are not taken in goodtime, there could be very substantial additional claims on thepublic finances as well as the risk of pensions being inadequatefor a significant proportion of pensioners. All European countriesare going to experience a substantial ageing of the populationover the next twenty to thirty years. There will be more elderlypeople and fewer people of working age. There is a three-pronged approach for dealing with this: increasing employmentrates and improving productivity performance, reducing publicdebt before the problem becomes less manageable and, thirdly,reforming pension systems. Governments are currently grapplingwith these big issues. In our own case, we are relatively wellplaced for coping with these issues. Firstly, the ageing of ourpopulation is relatively limited compared with countries like Italyand Spain. Secondly, some provision for public pensions is beingmade through building up the National Pension Reserve Fund bysetting aside each year 1 per cent of Gross National Product.
In addition, our economic growth potential is good relative tomany other countries, and this increases the capacity for dealingwith the issue. Nonetheless, there is no scope for complacencyfor a number of reasons. First, about 40 per cent of theworkforce, comprising nearly half of private sector workers, is atpresent not covered by an employment-related pension or anindividual pension. Those not so covered will be reliant on thestate pension, which provides a basic level of retirement income.A recent estimate of the Minister for Social, Community andFamily Affairs indicated that only about one quarter of privatesector workers have near-adequate pensions. Consequently, thewhole issue must and is being kept under review to ensure thatwe are in a strong position to deal with the ageing of thepopulation.
Conclusion
The Irish economy has performed very well over the past decadeor so. Our living standards have caught up with those of otheradvanced countries. This convergence was telescoped into thepast decade, whereas other developed countries raised theirliving standards over a much more prolonged period since theSecond World War. One result of this more concentratedconvergence process has been pressure on the country’sinfrastructure. This is currently being addressed in a verysubstantive way, although it is not something that can be doneovernight.

Quarterly Bulletin 2 2005
90
Of course, our economic progress has not been without its upsand downs. We were affected quite significantly by the downturnin the Information Technology sector in 2001, for example, andby the variations in oil prices and exchange rates. At the sametime, we have experienced a rate of business closures and layoffsthat is an inevitable, if sometimes painful, feature of modern,open economies in the light of changing consumer tastes andtechnological change. In the face of this, the important objectiveis that other opportunities are created and that the workforce issufficiently flexible and skilled to be quickly re-employed. Wehave been quite successful at this.
Looking ahead, we must continue to tailor our policies topromote growth and employment. We must ensure a stablemacroeconomic environment and continue with our successfulsupply-side policies and structural reform. This will leave us wellplaced to deal with the inevitable unforeseen shocks that willarise. It is also important that we are realistic in our expectations,whether in regard to incomes or what we expect to be deliveredby way of public services. At present, while our inflation rate islow, our price levels are high relative to those of most Europeancountries, so that it is especially important that we do notexacerbate this. If we remain conscious of this and continue withthe generally sound policies that have delivered such goodresults over the past decade, there is no reason why we shouldnot be optimistic about our future economic prospects.
However, I have to add a few important caveats regarding futureprospects. First, on the domestic front, developments in houseprices and the rapid increase in mortgage credit pose someconcerns. I continue to believe, however, that a soft landing inthis market is the most likely scenario, although there is no roomfor complacency. Secondly, as a very open economy, we arevulnerable to adverse developments in the global economy. Thebiggest risk is a disorderly unwinding of global imbalances,especially the twin deficits in the US. If this were to occur, wecould experience a rapid decline in the US dollar and a sharpeuro appreciation, which would impinge on our competitiveness.The other main external risks are developments in energymarkets and the uncertain geopolitical situation.
To conclude, I feel that our main challenge is to maintaininternational competitiveness so that we can continue to ensuresustainable economic growth over the medium- to long-term.

Quarterly Bulletin 2 2005
91
The Monetary and Financial Environment in
the Euro Area
Speech by John Hurley, Governor, to ACI Irelandon 11 April 2005
Introduction
First, let me say how pleased I am to have the opportunity tospeak to you tonight. The ACI plays an important role in bringingtogether participants in financial markets and in activelypromoting the education and professional development of itsmembers.
I would like to begin tonight by talking about euro area monetarypolicy and the factors which are shaping the currentenvironment. I will then talk briefly about monetary policyimplementation. Finally, I will devote some time to the importanttopic of financial integration in Europe.
Economic Background
Beginning with monetary policy, a key feature of both the euroarea and global economies in recent years has been theunusually high degree of economic and financial uncertaintywhich has accompanied economic recovery. As a result,particularly in the euro area, growth has ebbed and flowed andthe recovery has not evolved in the smooth and sustainedfashion that would be normal for this stage of the economiccycle.
While the recovery of economic activity in the euro area whichstarted in 2003, continued in 2004, it was a year of two quitedifferent halves. Relatively strong growth in the first-half of 2004was followed by a slowdown in activity in the second-half. Thisreflected both the impact of higher oil prices and exchange ratedevelopments. Thus, while growth of 1.8 per cent was recordedin 2004, the highest rate since 2000, the euro area economy lostsome momentum during the second-half of the year.
While a somewhat similar pattern was also observed in the widerinternational economy, the global growth performance has beena good deal more impressive than that of the euro area over thepast 18 months. Last year the global economy grew by 5 percent, its fastest rate of growth in almost three decades; this wastwo and one-half times the rate of growth of the euro area.Driven by the strength of economic activity in the US and Asia,the global economy grew rapidly in the four quarters to mid-2004. The strength of global growth during this period wassupported by favourable financial conditions and stimulative

Quarterly Bulletin 2 2005
92
macroeconomic policies in many countries. In the US, growthacquired considerable momentum from the sizeable fiscal andmonetary policy stimulus which had been put in place earlier. Inaddition, supportive wealth effects from equity and housingmarkets also helped propel growth. The improvement in theglobal economic environment during this time was not solelyconfined to the US. Growth accelerated sharply in China andEast Asia, where it was supported by the strong rebound in globaltrade flows and a revival in domestic demand.
Since the middle of 2004, global growth momentum has slowedsomewhat, though this has not been uniform. For most countries,with the exception of the US, growth moderated in the second-half of 2004, as the dampening impact of the rise in oil priceswas felt. By and large, however, the slowdown has been modestand, so far, the global economy has weathered the earlier risesin oil prices reasonably well.
The pick-up in growth in the euro area between mid-2003 andmid-2004, while much less vigorous than in the other majorregions, benefited significantly from the strength of globalgrowth. Over this period, the recovery was largely driven byexport growth, with the contribution of final domestic demandbeing relatively modest. However, there were significantdifferences across countries. Domestic demand grew strongly inFrance and Spain, while remaining weak in Germany and Italy.In the aggregate, euro area domestic demand growth failed togenerate much momentum. This reflected slow wage andemployment growth and also continuing uncertainty regardingthe implementation of structural reforms, which dampenedconfidence and held back consumption. The moderation ofgrowth in the second-half of 2004 was largely the result of amarked decline in the external contribution, which was onlypartially compensated for by higher domestic demand. Slowerglobal growth and the lagged impact on competitiveness of theongoing appreciation of the euro undercut export growth, whilerising oil prices also took their toll. As a result, growth in thesecond-half of 2004 was a good deal weaker than in the first-half.
Inflation Developments
Mainly reflecting the modest nature of the economic recovery,inflationary pressures have remained subdued in the euro area.HICP inflation averaged 2.1 per cent in 2004, unchanged from2003. While higher oil prices and further increases in indirecttaxes and administered prices exerted upward pressure oninflation, this was offset by ongoing exchange rate appreciationand sluggish domestic demand.

Quarterly Bulletin 2 2005
93
Despite the large rise in energy prices there have been no signsof ‘second round effects’. There has been very little evidence ofpass through from higher input prices to final goods, while thecontinued softness of labour markets has meant that wagegrowth has been moderate. Against this background, inflationand inflationary pressures have been relatively subdued andinflation expectations have remained benign. In this environment,the Governing Council has kept interest rates unchanged at theexceptionally low levels prevailing since June 2003. Thus, euroarea interest rates remain at levels equivalent to post-World WarII lows.
Current Euro Area Monetary Policy Environment
The current monetary policy environment is complex, cloudedwith a number of domestic and international uncertainties. Theeuro area recovery has clearly lagged that of most of the othermajor economies, and the future strengthening of growth stillremains a gradually emerging prospect rather than a currentreality. While inflation and inflation expectations remain wellgrounded and we don’t see any immediate threats, there aresome upside risks to the maintenance of price stability in themedium-term. The uncertainties surrounding the outlook relate inparticular to the future evolution of euro area domestic demand,particularly consumer spending, the risks stemming from higheroil prices, the potential for volatility in foreign exchange marketsand the potential impact of high levels of liquidity. Framingmonetary policy in such an environment is challenging.
With regard to the economic outlook, the central scenarioremains for moderate growth to gradually unfold, though thepace and timing of any pick-up is subject to much uncertainty.The normal sequence of recovery tends to run, first, from a pick-up in export growth, then to a recovery in investment and, finally,on to a strengthening of consumer spending. The recovery inexport growth was largely seen in the period between mid-2003and mid-2004. More recently, we have seen some smallimprovement in investment spending, though it remains sub-parwhen compared to earlier cycles. This would appear to reflectthe fact that strong profit growth has been used more torestructure balance sheets than to boost investment. The maindisappointment, however, has been the performance ofconsumer spending. There is no doubt that there has been muchto hold consumption back. Employment and wage growth havebeen modest. Persistently high and volatile oil prices have had adampening influence. In addition, the level of saving hasremained high, reflecting ongoing concerns, not only in relationto labour markets, but also about longer-term prospects forhealth-care and pension systems.
Nevertheless, there are a number of positive factors. Real short-term and long-term interest rates are very low, making financing

Quarterly Bulletin 2 2005
94
conditions favourable. The recovery in corporate profits shouldeventually stimulate both higher investment growth and arecovery in employment, which should underpin domesticdemand. In addition, the continued strength of the globaleconomy should help offset some of the drag resulting from thestrengthening of the euro.
More recently, the signals with regard to the outlook for growthhave been mixed. While data for January were generallyfavourable, data since then have been less supportive.Confidence surveys and activity data have generally weakenedagain, against the background of the renewed sharp rise in oilprices. This is not encouraging and does not suggest that growthis likely to strengthen in the near term. However, moreinformation from both surveys and hard data is required beforefirm conclusions can be drawn.
This most recent episode is the latest instance in which high andvolatile oil prices have raised risks. Not only do high and risingoil prices threaten to slow growth, they also raise the risk ofhigher inflation, and it is essential to ensure that second-roundeffects on wage and price-setting behaviour are avoided. Theimpact of higher oil prices on growth and inflation will dependon the scale of oil price increases, its persistence, the economy’sdependence on oil and second round effects on inflation. Thereis much uncertainty about the scale of the impact on growth andinflation and estimates vary widely. On balance, the evidencetends to suggest that the effects of oil price shocks have becomemilder over time. Indeed, with regard to the inflationary impactof rising oil prices, it is notable that euro area inflation has beenbroadly stable in recent years. For example, despite a more thantwo and one-half fold increase in oil prices from around $20 perbarrel in early 2002, the headline rate of inflation has remainedin a fairly narrow range — 1.6 to 2.5 per cent — over the sameperiod, while the core rate of inflation has remained close to 2per cent for most of the time, until recently when it has fallen.With regard to economic activity, while the impact of oil priceshas become more muted over time, it nevertheless remainssignificant. All major economic downturns over the past threedecades have been associated with oil price shocks, though notall oil price shocks have led to downturns. Furthermore, a newand somewhat worrying feature of current oil markets relates tothe rise in long-term futures prices, suggesting that higher oilprices may be here for some time.
Oil prices are not the only external factor complicating theoutlook. There are also the risks posed by widening globalcurrent account imbalances, which show no signs of abating. Atthe same time, movements in exchange rates have come to belinked with the evolution of imbalances. Given the relative fixityof some Asian currencies vis-a-vis the US dollar, from time to

Quarterly Bulletin 2 2005
95
time, this has led to sharp upward movements in the value of theeuro. The strengthening of the exchange rate has acted to slowactivity and the potential for further volatility in foreign exchangemarkets remains an important downside risk to growth. Theposition of the Governing Council on the issue of the exchangerate is very clear — sharp upward moves are unwelcome andundesirable for economic growth.
There are also risks from within. In particular, reflecting thestimulative effect of low interest rates on the monetaryaggregates, we have seen persistently strong growth in moneyand credit. This points to potential risks to price stability in themedium to long-term. We are mindful of these risks but we arealso mindful that, as yet, there is no evidence that strong growthin liquidity is affecting the general level of spending.
At some point in time, it will be necessary to begin to removethe accommodative stance of monetary policy. For the moment,however, the view of the Governing Council is that interest ratesare at a level which is consistent with the maintenance of pricestability. While there are risks to the outlook for both growth andinflation, the central scenario is still for ongoing moderate growthwith underlying inflationary pressures remaining contained. Intaking interest rate decisions it is always a question of weighingup opposing factors and reaching a decision consistent with themedium-term goal of price stability. I can assure you that theGoverning Council remains vigilant and will continue to watchdevelopments closely in coming months.
Monetary Policy Implementation
Turning now to implementation, the Central Bank has played andcontinues to play a full part in the Eurosystem’s monetary policyimplementation process. At the operational level, Central Bankstaff carry out the Eurosystem’s regular money marketmanagement operations with Dublin based banks. Reflecting theimportance of Dublin as an international financial centre, thebanking system in Ireland has a disproportionately high share ofEurosystem operations; for example, the normal level ofoutstanding lending by the Bank is in excess of \18 billion.
At a strategic level, the Bank has had a full input into theevolution of the monetary policy framework, both when theEurosystem operational framework was being designed andwhen it was amended, most recently in March 2004. Therevisions of last year came into effect following a publicconsultation, in which Irish institutions were among the mostprominent in the number and comprehensiveness of theirresponses. The new arrangements involved a change in thetiming of the reserve maintenance period and shortening thematurity of the Main Refinancing Operations from two weeks to

Quarterly Bulletin 2 2005
96
one week. The intention of these two revisions was to eliminatethe effects of expectations of interest rate changes on biddingbehaviour. The ECB also enhanced its communications withmarket participants and increased transparency by publishing abenchmark allotment for each Main Refinancing Operation. Thebenchmark allotment is the amount that allows for neutralliquidity conditions and the market can now compare the actualallotment with this benchmark amount.
The implementation of the recent changes went smoothly andcounterparties quickly adapted their bidding behaviour to theincreased allotment amounts in the weekly operations. Afavourable outcome has been an overall stabilisation of thespread between the overnight rate and the minimum bid rateduring the reserve maintenance period. Another, almostinevitable, consequence of the changes has been the increasedincidence of liquidity imbalances at the end of the reservemaintenance period, which has been reflected in increasedvolatility in the overnight rate on the last day of the period. TheECB has responded with more frequent fine-tuning operationsand it recently consulted with market participants, via its MoneyMarket Contact Group, on other possible approaches that mighthelp to reduce volatility.
The Eurosystem institutional set-up, involving centraliseddecision-making on monetary policy issues and decentralisedimplementation of policy presents special challenges in the areaof communication. Such arrangements demand that theEurosystem keeps in touch with local market participants andopinion. I would like to outline a few examples of how this isachieved. Local market views are collected by the Bank andprovided to the ECB on a daily basis. Together with the views ofthe rest of the euro-area market, these play a part in the ECB’smanagement of the euro-area money market. We in the Bankalso conduct annual money market surveys and periodic bondmarket studies, which feed into wider euro-area market studiesand these in turn are published by the ECB. Anothercommunication forum is the Dublin Markets Contact Group. Thisgroup of banks, representative of the local market, meets underthe auspices of the Bank’s Financial Market Department. We usethis forum to provide feedback from similar groups establishedat Eurosystem level while local issues that arise in the Dublinmarket are fed back to the ECB. At a more informal level,communication is facilitated by frequent contact between Bankstaff and market participants and I would encourage you tocontact the Central Bank with your views on any notable marketdevelopments.
The variety and type of assets acceptable as eligible collateral inEurosystem credit operations is also currently under review bythe Eurosystem. Following a public consultation process the

Quarterly Bulletin 2 2005
97
Governing Council decided, in May of last year, to replace thecurrent two-tier collateral system with a single list of collateral.This move, which will take place on a gradual basis, aims toreduce the diversity of the assets currently eligible as Tier-Two,thereby enhancing the transparency of the overall collateralframework. The first step towards establishing the Single Listcomes into force at the end of May and involves the inclusion ofeuro-denominated assets from issuers in major markets outsidethe European Economic Area (for example, euro bonds of USissuers) and the phasing out over time of some Tier-Twocollateral, for example equities. As a second step, the GoverningCouncil has approved, in principle, the inclusion in the Single Listof bank loans from all euro-area countries and mortgage-backedpromissory notes which were specially developed for Irishmarket conditions. I am particularly pleased at the retention ofmortgage-backed promissory notes as this represents a positiveresult of a great deal of work undertaken by the Bank’srepresentatives at Eurosystem level.
In terms of market functioning, we particularly welcome the ACIinitiative that is aimed at integrating the short-term securitiesmarkets across the euro area. Supported by the ECB, this shouldsoon see the issuance of short-term securities under theimprimatur of the ACI STEP committee. Along with a smallnumber of other euro-area national central banks, the Bank willcontribute to the process of granting the STEP label, in our casefor assets originating in Ireland and in some other jurisdictions.
EU Financial Integration
Turning now to EU Financial integration. The EU policyframework for achieving greater financial integration is throughregulation, supervision and financial infrastructure. In relation toregulation and supervision, while the single market wasestablished in 1992, it was only in 1999, with the drafting of theFinancial Services Action Plan (FSAP), that a concerted effort wasmade to break down the barriers to the provision of pan-European financial services. The Plan has led to the adoption ofalmost 42 Community measures which cover banking, securities,asset management, insurance and pensions, clearing andsettlement and many other cross-cutting issues. The impact ofthe FSAP on financial markets will, however, take time tomanifest itself fully, and the focus now is on consistentenforcement and implementation across the Union.
There are several reasons why the Bank, and the ESCB, want tosee more integrated EU financial markets. These include betterand more efficient allocation of risk and capital, the smoothoperation of the monetary policy transmission mechanism andof payment systems, and greater overall financial stability.

Quarterly Bulletin 2 2005
98
The financial system plays a fundamental role in the transmissionof monetary policy, and integrated European financial marketsfacilitate the implementation of the euro area’s monetary policy.This is particularly relevant in the wholesale money and bondmarkets in which the ECB and the Bank, through the ESCB, areinvolved. Financial market integration should also contribute togreater financial stability, since a larger and more diversifiedfinancial system is better able to absorb economic shocks.
A robust framework for securities clearing and settlement — theplumbing of the financial system — is also needed. Thisinfrastructure lies at the core of all financial markets and isindispensable for their proper functioning. There are a numberof private and public-sector initiatives under way to promote theintegration, efficiency, and security of the European securitiesinfrastructure. One such important initiative is the developmentof the ‘‘Standards for Securities Clearing and Settlement in the
European Union’’.These standards have been drawn up jointlyby the ESCB and the Committee of European SecuritiesRegulators (CESR).
In the context of financial integration, the TARGET system thatcommenced operations on the first day of Monetary Union wasa major initiative and it has proved to be very successful. It wascreated by interconnecting the then-15 national real-time grosssettlement (RTGS) systems and the ECB payment mechanism.
TARGET was created to provide a safe, efficient and reliablemechanism for the settlement of cross-border large valuepayments in euro and to serve the needs of Eurosystemmonetary policy. The system settles payments in real time withimmediate finality in central bank money, thus eliminatingsettlement risk between participants. It is uniquely wide in itscoverage, with almost 1,100 direct participants and more than48,000 banks — including branches and subsidiaries — accessiblethrough the system. Last year, an average of more than 267,000payments with a value of \1.7 trillion were transferred throughTARGET per business day. This makes TARGET — alongside theFedwire system in the United States — one of the two largestwholesale payment systems in the world.
In December 2004, the Governing Council of the ECB approvedthe building of a TARGET2 Single Shared Platform to replace thecurrent decentralised structure. This new system will achieve ahigher level of efficiency and improved security, through aharmonised structure based on a single technical platform. It willalso provide a harmonised service level ensuring a level playingfield for banks across Europe. This will be supported by a singleprice structure for domestic and cross-border payments.TARGET2 will offer new functionalities that will enable banks toachieve better integration of their euro liquidity management.

Quarterly Bulletin 2 2005
99
The existing business relationship and contacts between nationalcentral banks and their banking communities will continue onthe same basis as at present. Work on the building of the newsystem is currently underway and it is scheduled to commenceoperations in January 2007.
Concluding Remarks
In conclusion, a well-integrated financial system is essential to thesmooth and effective implementation of monetary policy. Whilethe technical and operational challenges to implementing asingle monetary policy across twelve countries have beenconsiderable, these have been successfully met. The Eurosystemapproach has been to ensure that the financial infrastructure,and, in particular, the payment, clearing and settlement systemshave operated in an efficient and integrated fashion. Thedynamic and changing nature of markets means that thesesystems are continuing to be enhanced, with functionalities beingimproved to meet evolving needs.
As regards monetary policy, the current environment is complex,with a number of uncertainties, in particular, high oil prices, stillpersisting. There are risks to the outlook for both growth andinflation; however, the central scenario is still for ongoingmoderate growth with underlying inflationary pressuresremaining contained. The Governing Council remains vigilantand we will continue to watch developments closely in comingmonths.