Embed Size (px)
Citation preview
Commercial Association of REALTORS® Wisconsin
Tom McGeePresident & CEOICSC
In-Store Brick &
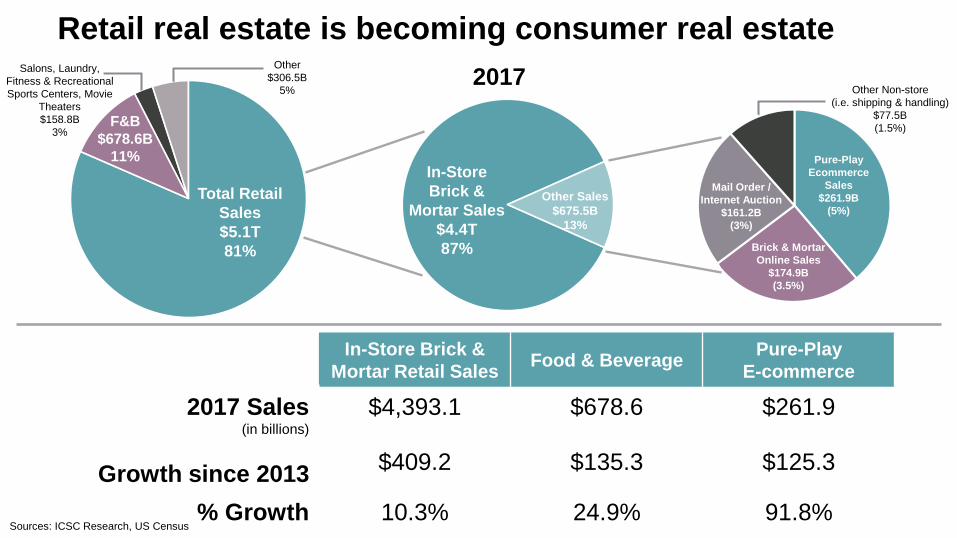
Mortar Sales$4.4T87%
Other Sales$675.5B
13%
Brick & MortarOnline Sales
$174.9B(3.5%)
Pure-Play Ecommerce
Sales$261.9B
(5%)
Mail Order / Internet Auction
$161.2B(3%)
Other Non-store (i.e. shipping & handling)
$77.5B(1.5%)
Retail real estate is becoming consumer real estate
In-Store Brick & Mortar Retail Sales Food & Beverage Pure-Play
E-commerce
2017 Sales(in billions)
$4,393.1 $678.6 $261.9
Growth since 2013 $409.2 $135.3 $125.3
% Growth 10.3% 24.9% 91.8%
Salons, Laundry, Fitness & Recreational Sports Centers, Movie
Theaters$158.8B
3%
Total Retail Sales$5.1T81%
F&B$678.6B
11%
Other$306.5B
5%2017
Sources: ICSC Research, US Census
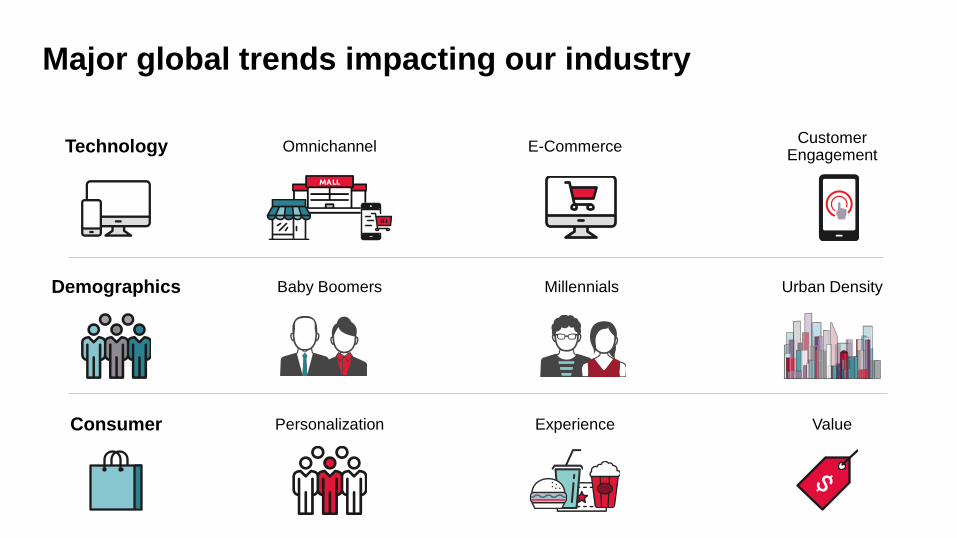
Technology Omnichannel E-Commerce Customer Engagement
Major global trends impacting our industry
Consumer Personalization
Demographics
Experience Value
Baby Boomers Millennials Urban Density
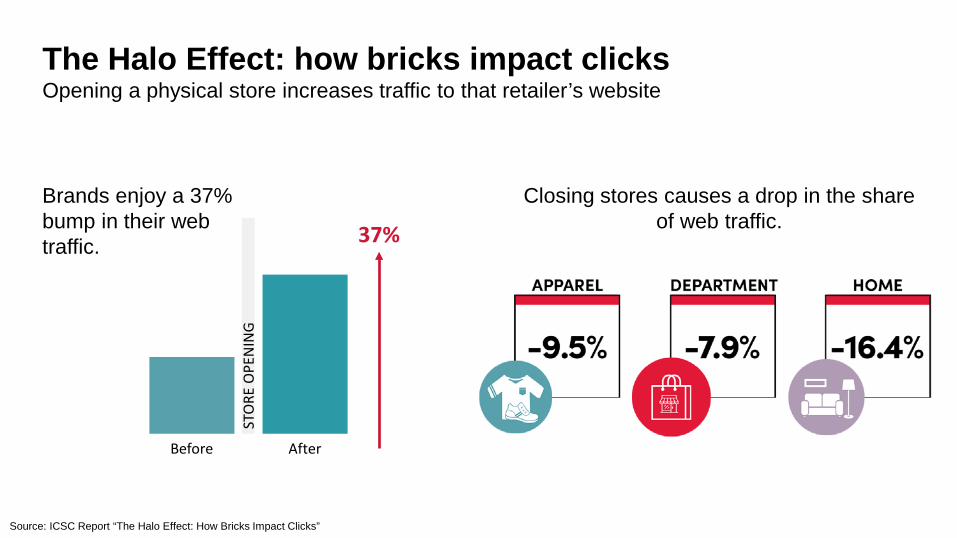
The Halo Effect: how bricks impact clicksOpening a physical store increases traffic to that retailer’s website
Source: ICSC Report “The Halo Effect: How Bricks Impact Clicks”
STO
RE O
PEN
ING
Before After
37%
Brands enjoy a 37% bump in their web traffic.
Closing stores causes a drop in the share of web traffic.
69%
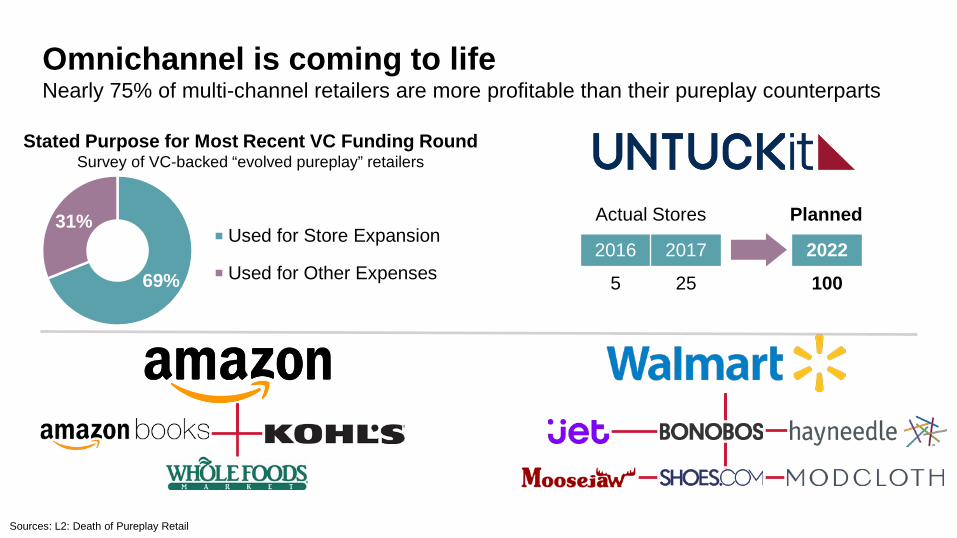
31%Used for Store Expansion
Used for Other Expenses
Omnichannel is coming to lifeNearly 75% of multi-channel retailers are more profitable than their pureplay counterparts
Stated Purpose for Most Recent VC Funding RoundSurvey of VC-backed “evolved pureplay” retailers
Actual Stores
2016 2017 20225 25 100
Planned
Sources: L2: Death of Pureplay Retail
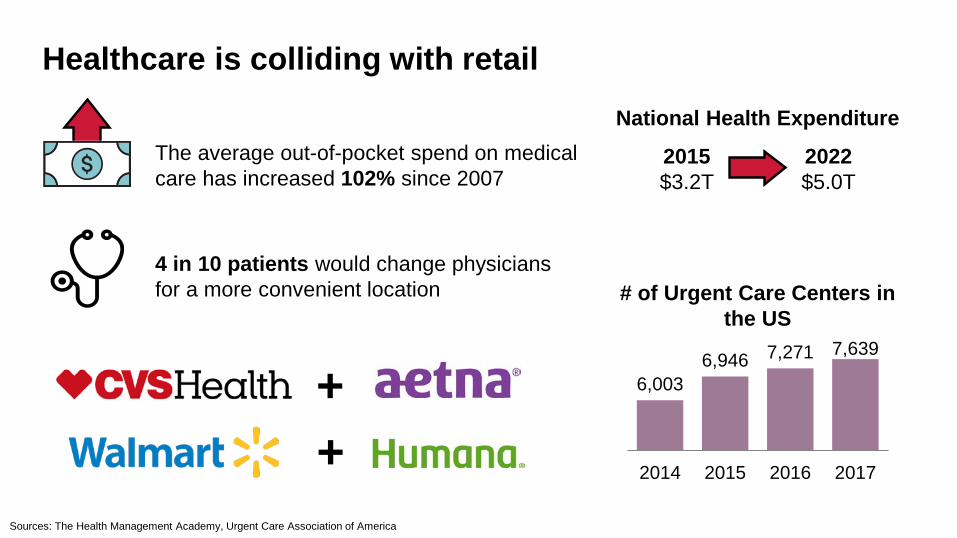
Healthcare is colliding with retail
Sources: The Health Management Academy, Urgent Care Association of America
# of Urgent Care Centers in the US
6,0036,946 7,271 7,639
2014 2015 2016 2017
4 in 10 patients would change physicians for a more convenient location
2015 2022$3.2T $5.0T
National Health ExpenditureThe average out-of-pocket spend on medical care has increased 102% since 2007
++
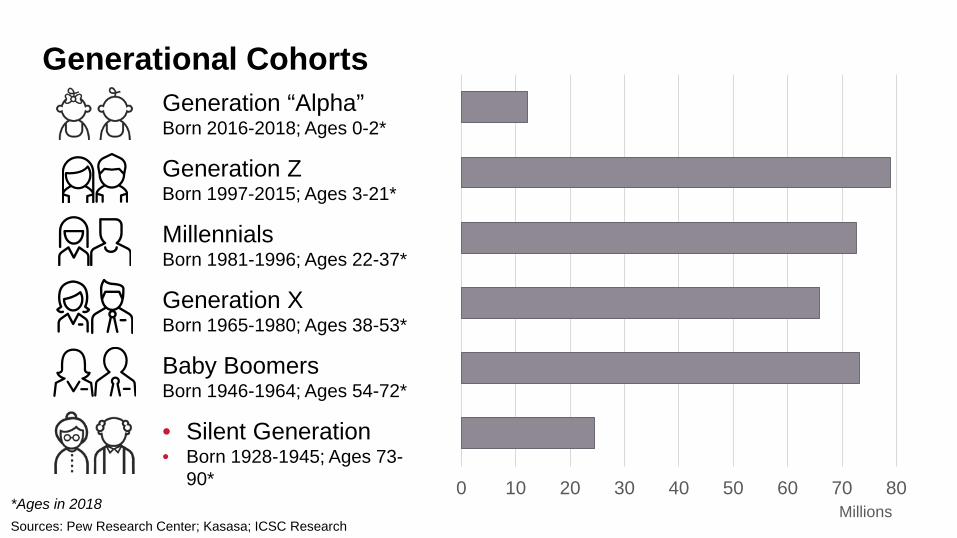
Generational Cohorts
• Silent Generation• Born 1928-1945; Ages 73-
90*
Sources: Pew Research Center; Kasasa; ICSC Research*Ages in 2018
Generation XBorn 1965-1980; Ages 38-53*
Baby Boomers Born 1946-1964; Ages 54-72*
Generation Z Born 1997-2015; Ages 3-21*
MillennialsBorn 1981-1996; Ages 22-37*
Generation “Alpha” Born 2016-2018; Ages 0-2*
0 10 20 30 40 50 60 70 80Millions
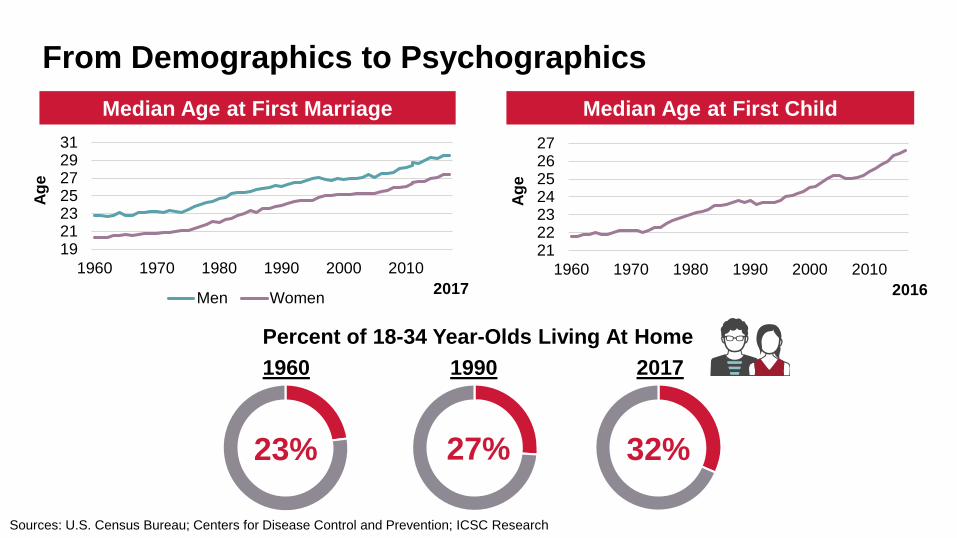
From Demographics to Psychographics
19212325272931
1960 1970 1980 1990 2000 2010
Age
Men Women 2017
Sources: U.S. Census Bureau; Centers for Disease Control and Prevention; ICSC Research
21222324252627
1960 1970 1980 1990 2000 2010
Age
2016
23%
Median Age at First Marriage
32%
1960 2017
27%
1990Percent of 18-34 Year-Olds Living At Home
Median Age at First Child
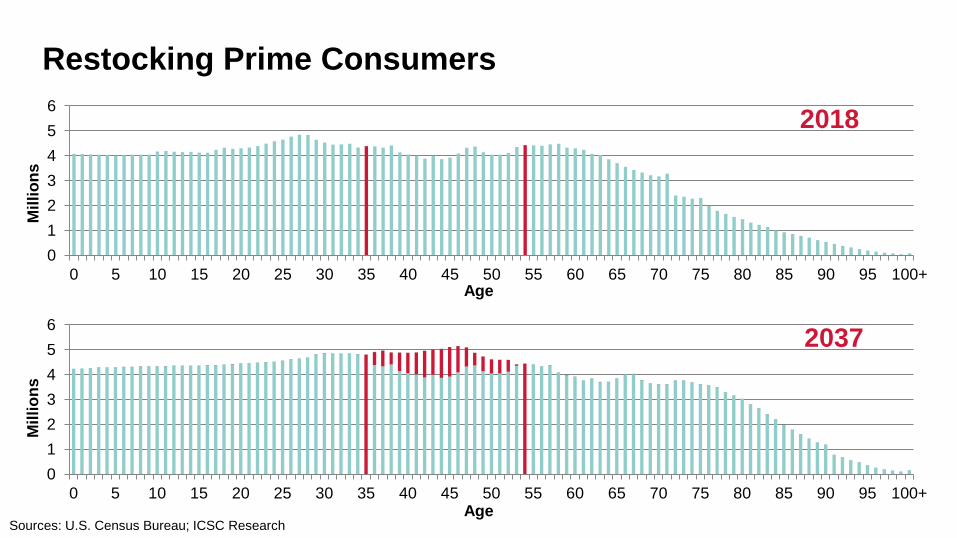
Restocking Prime Consumers
0123456
0 5 10 15 20 25 30 35 40 45 50 55 60 65 70 75 80 85 90 95 100+
Mill
ions
2018
0123456
0 5 10 15 20 25 30 35 40 45 50 55 60 65 70 75 80 85 90 95 100+
Mill
ions
2037
Sources: U.S. Census Bureau; ICSC Research
Age
Age
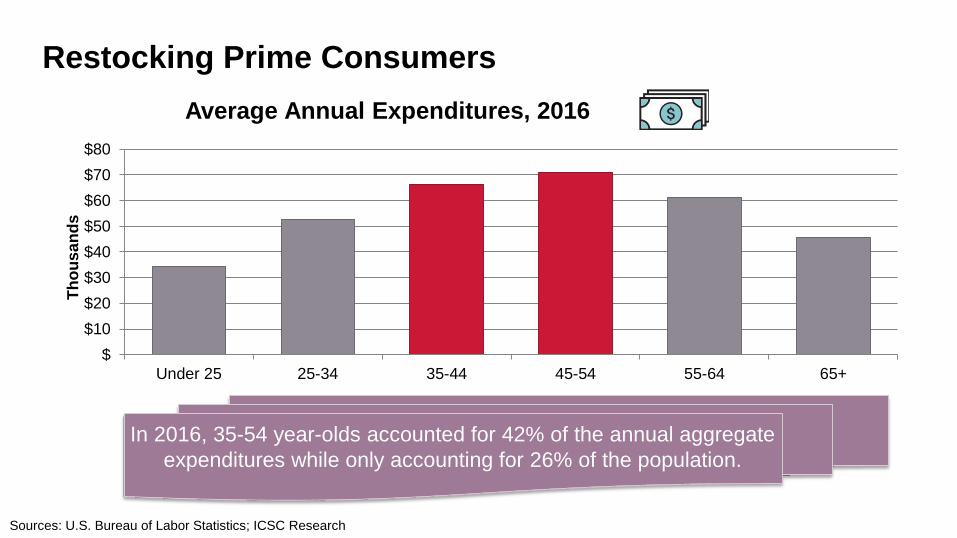
Restocking Prime Consumers
$$10$20$30$40$50$60$70$80
Under 25 25-34 35-44 45-54 55-64 65+
Thou
sand
s
Average Annual Expenditures, 2016
Sources: U.S. Bureau of Labor Statistics; ICSC Research
In 2016, 35-54 year-olds accounted for 42% of the annual aggregate expenditures while only accounting for 26% of the population.
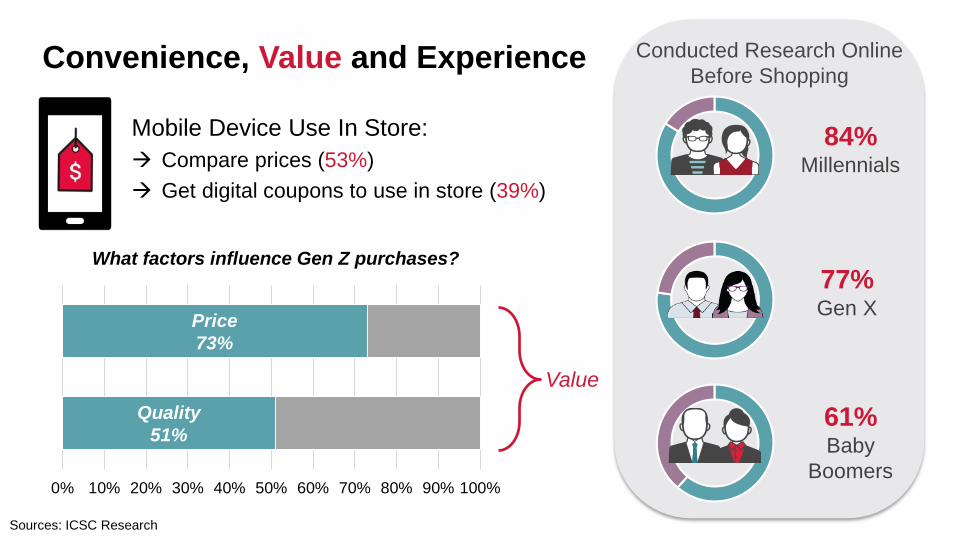
Convenience, Value and Experience
Sources: ICSC Research
Conducted Research Online Before Shopping
84%Millennials
77%Gen X
61%Baby
Boomers0% 10% 20% 30% 40% 50% 60% 70% 80% 90% 100%
What factors influence Gen Z purchases?
Quality51%
Price73%
Value
Mobile Device Use In Store: Compare prices (53%) Get digital coupons to use in store (39%)
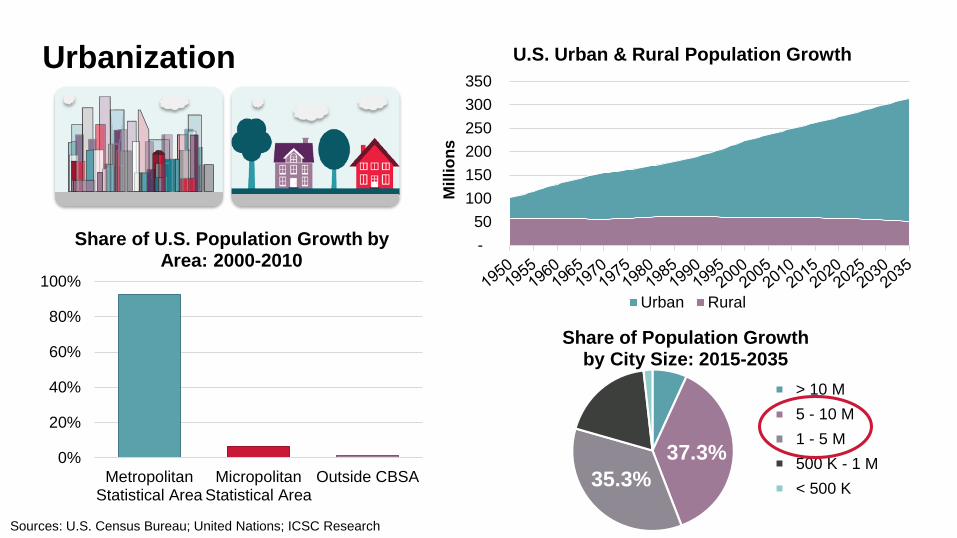
37.3%35.3%
Share of Population Growth by City Size: 2015-2035
> 10 M 5 - 10 M 1 - 5 M 500 K - 1 M < 500 K
Urbanization
- 50
100 150 200 250 300 350
Mill
ions
U.S. Urban & Rural Population Growth
Urban Rural
0%
20%
40%
60%
80%
100%
MetropolitanStatistical Area
MicropolitanStatistical Area
Outside CBSA
Share of U.S. Population Growth by Area: 2000-2010
Sources: U.S. Census Bureau; United Nations; ICSC Research
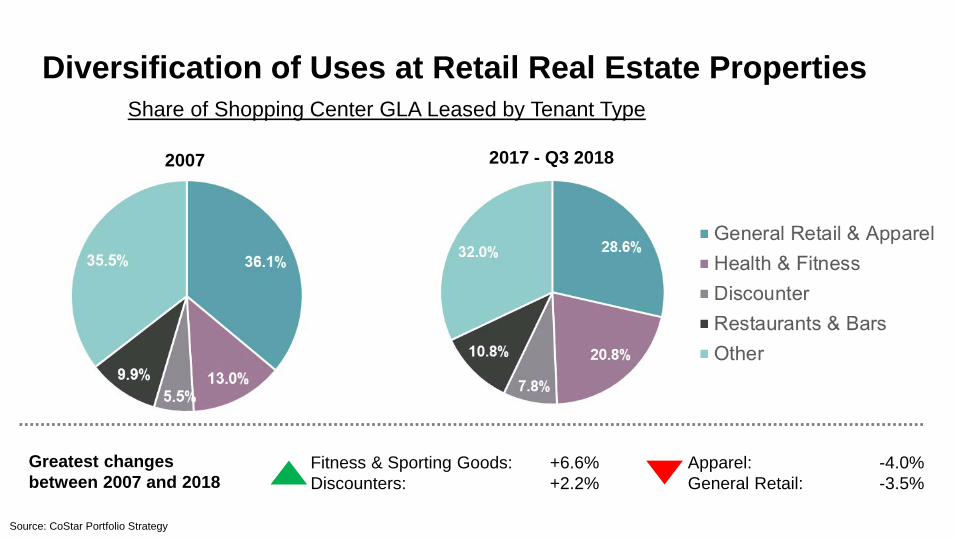
2007 2017 - Q3 2018
Share of Shopping Center GLA Leased by Tenant Type
Diversification of Uses at Retail Real Estate Properties
Source: CoStar Portfolio Strategy
Greatest changes between 2007 and 2018
Fitness & Sporting Goods: +6.6%Discounters: +2.2%
Apparel: -4.0% General Retail: -3.5%
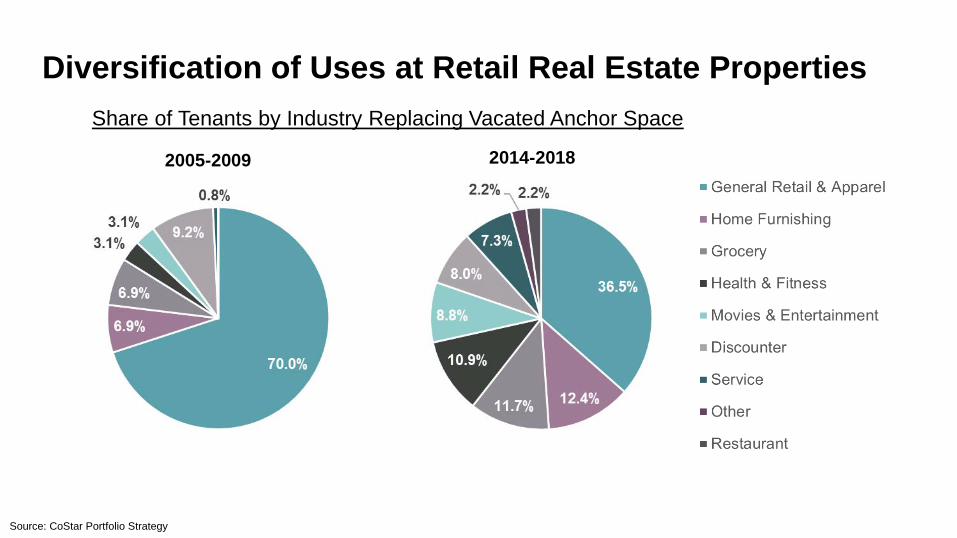
Share of Tenants by Industry Replacing Vacated Anchor Space
Diversification of Uses at Retail Real Estate Properties
2005-2009 2014-2018
Source: CoStar Portfolio Strategy
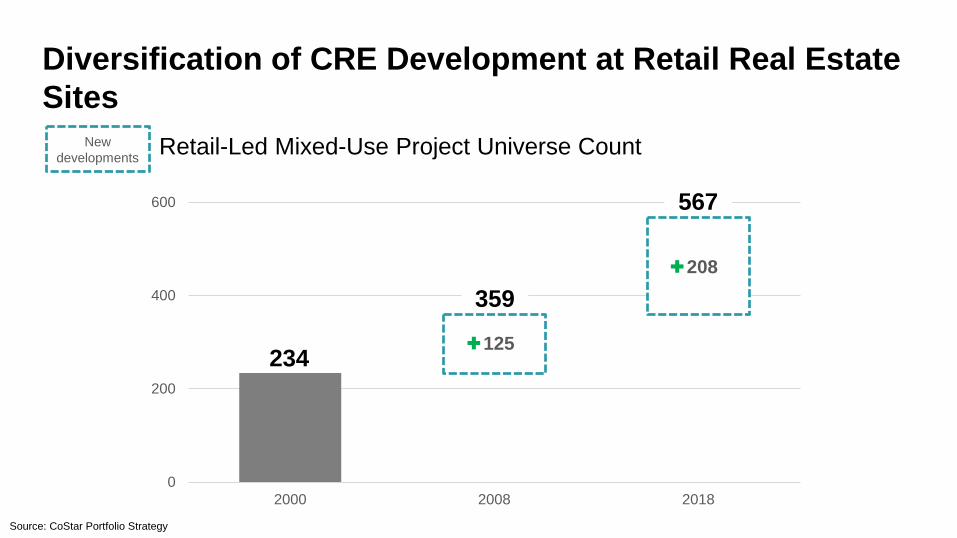
Diversification of CRE Development at Retail Real Estate Sites
0
200
400
600
2000 2008 2018
125
208
234
359
567
New developments
Source: CoStar Portfolio Strategy
Retail-Led Mixed-Use Project Universe Count
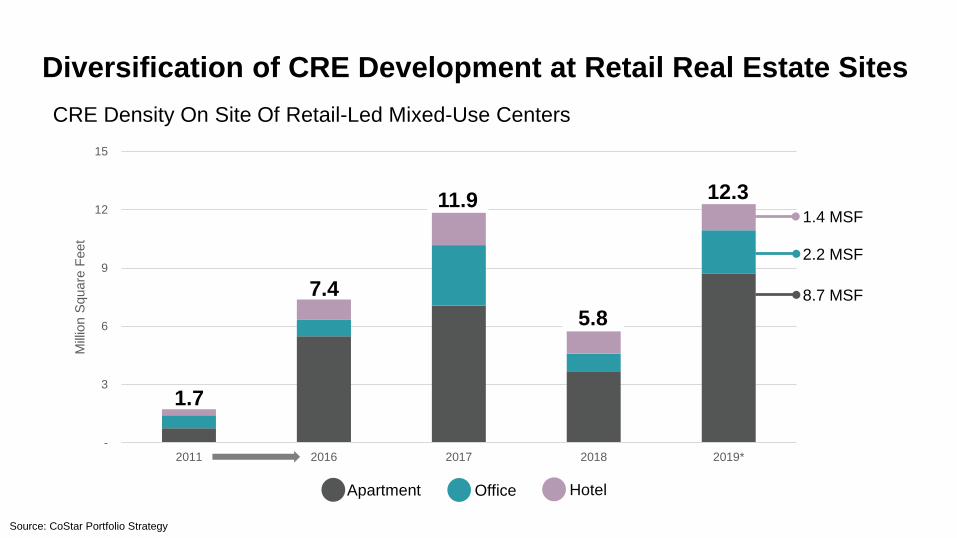
Diversification of CRE Development at Retail Real Estate Sites
Source: CoStar Portfolio Strategy
-
3
6
9
12
15
2011 2016 2017 2018 2019*
Milli
on S
quar
e Fe
et
CRE Density On Site Of Retail-Led Mixed-Use Centers
1.4 MSF
2.2 MSF
8.7 MSF
1.7
12.3
7.4
11.9
5.8
Apartment Office Hotel
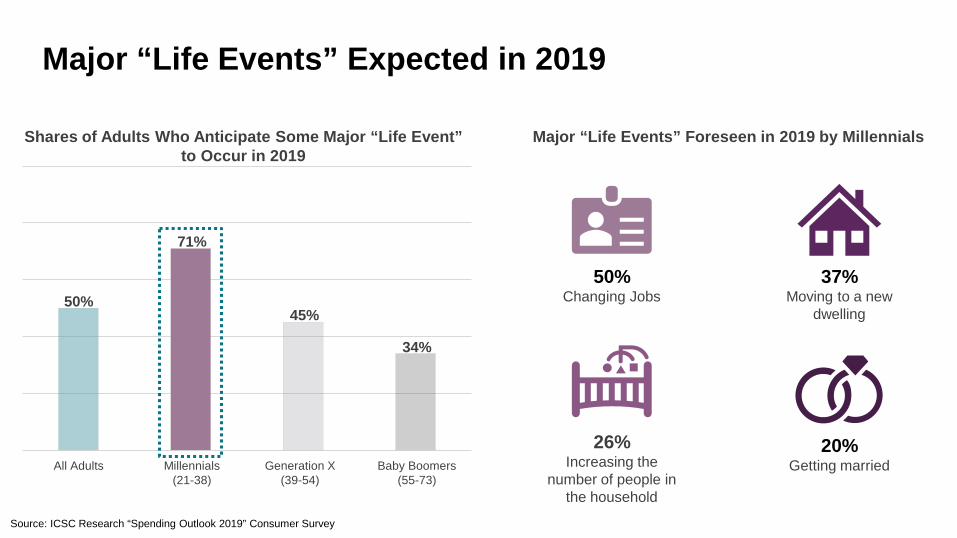
Major “Life Events” Expected in 2019
Shares of Adults Who Anticipate Some Major “Life Event” to Occur in 2019
Source: ICSC Research “Spending Outlook 2019” Consumer Survey
50%
71%
45%
34%
All Adults Millennials(21-38)
Generation X(39-54)
Baby Boomers(55-73)
Major “Life Events” Foreseen in 2019 by Millennials
50%Changing Jobs
37%Moving to a new
dwelling
26%Increasing the
number of people in the household
20%Getting married
An increase grea 10%
An
An incre
me
rom 1% to 5%
decrease from 6% to 10%
10%
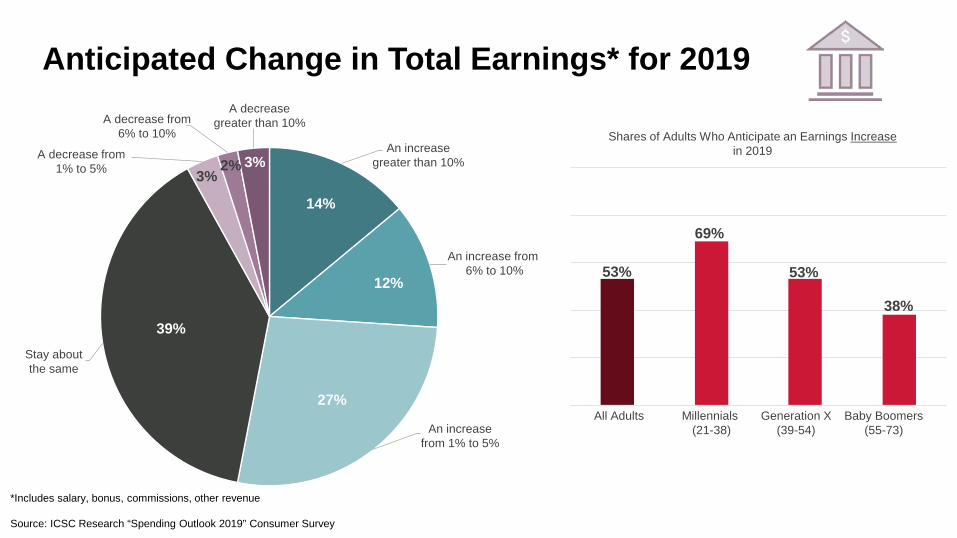
Anticipated Change in Total Earnings* for 2019A decrease
greater than 10%
An increase greater than 10%
An increase from6% to 10%
An increase from 1% to 5%
39%
A decrease from 1% to 5%
A decrease from 6% to 10%
14%
12%
27%
3%2% 3%
All Adults Millennials(21-38)
Generation X(39-54)
Baby Boomers (55-73)
53%
69%
53%
38%
Shares of Adults Who Anticipate an Earnings Increasein 2019
*Includes salary, bonus, commissions, other revenue
Source: ICSC Research “Spending Outlook 2019” Consumer Survey
Stay about the same
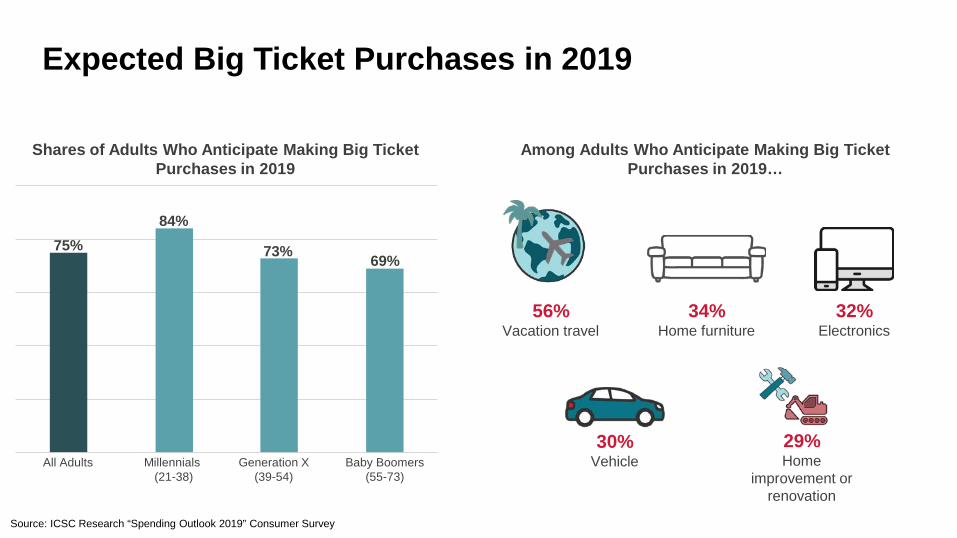
Expected Big Ticket Purchases in 2019
34%Home furniture
32%Electronics
30%Vehicle
29%Home
improvement or renovation
All Adults Millennials(21-38)
Generation X(39-54)
Baby Boomers (55-73)
75%84%
73% 69%
Shares of Adults Who Anticipate Making Big Ticket Purchases in 2019
Source: ICSC Research “Spending Outlook 2019” Consumer Survey
Among Adults Who Anticipate Making Big Ticket Purchases in 2019…
56%Vacation travel