Embed Size (px)
Citation preview
www.woodmac.com
Delivering commercial insight
Commercial Drivers of the International Oil Terminal Industry
Ben HoltVice President, Downstream ConsultingWood Mackenzie, London
Tank Storage Istanbul Conference
November 2011
www.woodmac.com
© Wood Mackenzie 2
Delivering commercial insight
1 Crude Oil Outlook
Atlantic Basin Refining and Products
Agenda
2
Oil Infrastructure Developments 3
www.woodmac.com
© Wood Mackenzie 3
Delivering commercial insight
Canada
US
Mexico
North Sea
Brazil
India
Ghana
Kazakhstan
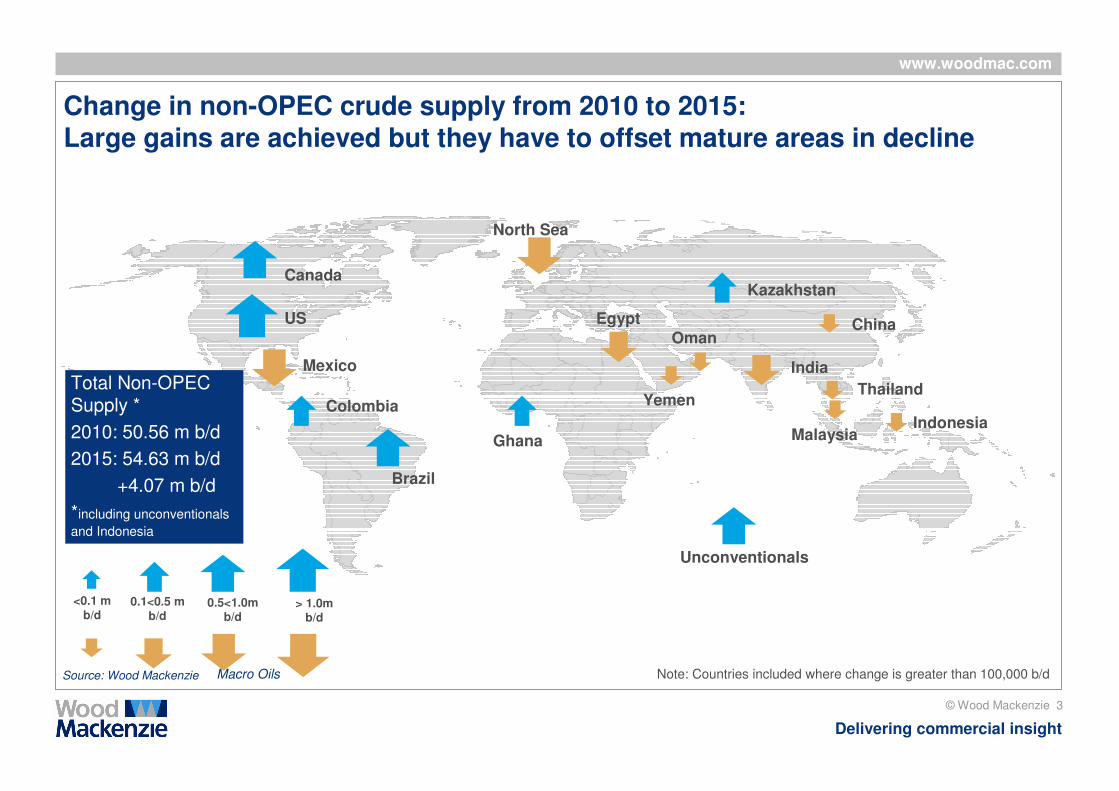
Total Non-OPEC Supply *
2010: 50.56 m b/d
2015: 54.63 m b/d
+4.07 m b/d
*including unconventionals
and Indonesia
Note: Countries included where change is greater than 100,000 b/d
0.1<0.5 m b/d
0.5<1.0m b/d
> 1.0m b/d
Unconventionals
Change in non-OPEC crude supply from 2010 to 2015: Large gains are achieved but they have to offset mature areas in decline
Source: Wood Mackenzie
Colombia
<0.1 m b/d
China
Yemen
Oman
Thailand
MalaysiaIndonesia
Egypt
Macro Oils
www.woodmac.com
© Wood Mackenzie 4
Delivering commercial insight
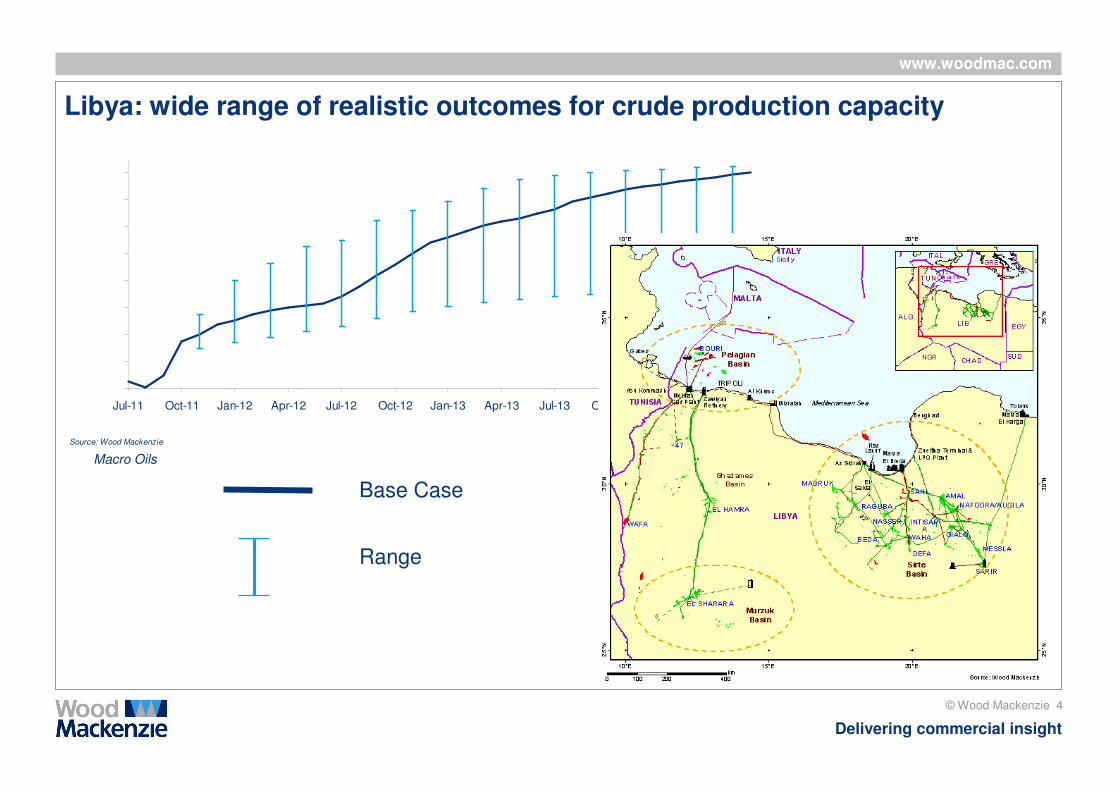
Libya: wide range of realistic outcomes for crude production capacity
Source: Wood Mackenzie
0
200
400
600
800
1,000
1,200
1,400
1,600
Jul-11 Oct-11 Jan-12 Apr-12 Jul-12 Oct-12 Jan-13 Apr-13 Jul-13 Oct-13 Jan-14 Apr-14
00
0 'b
/d
Base case
Base Case
Range
Macro Oils
www.woodmac.com
© Wood Mackenzie 5
Delivering commercial insight
-10
-5
0
5
10
15
20
25
30
Ja
n-0
8
Ap
r-0
8
Ju
l-0
8
Oc
t-0
8
Ja
n-0
9
Ap
r-0
9
Ju
l-0
9
Oc
t-0
9
Ja
n-1
0
Ap
r-1
0
Ju
l-1
0
Oc
t-1
0
Ja
n-1
1
Ap
r-1
1
Ju
l-1
1
$/bbl
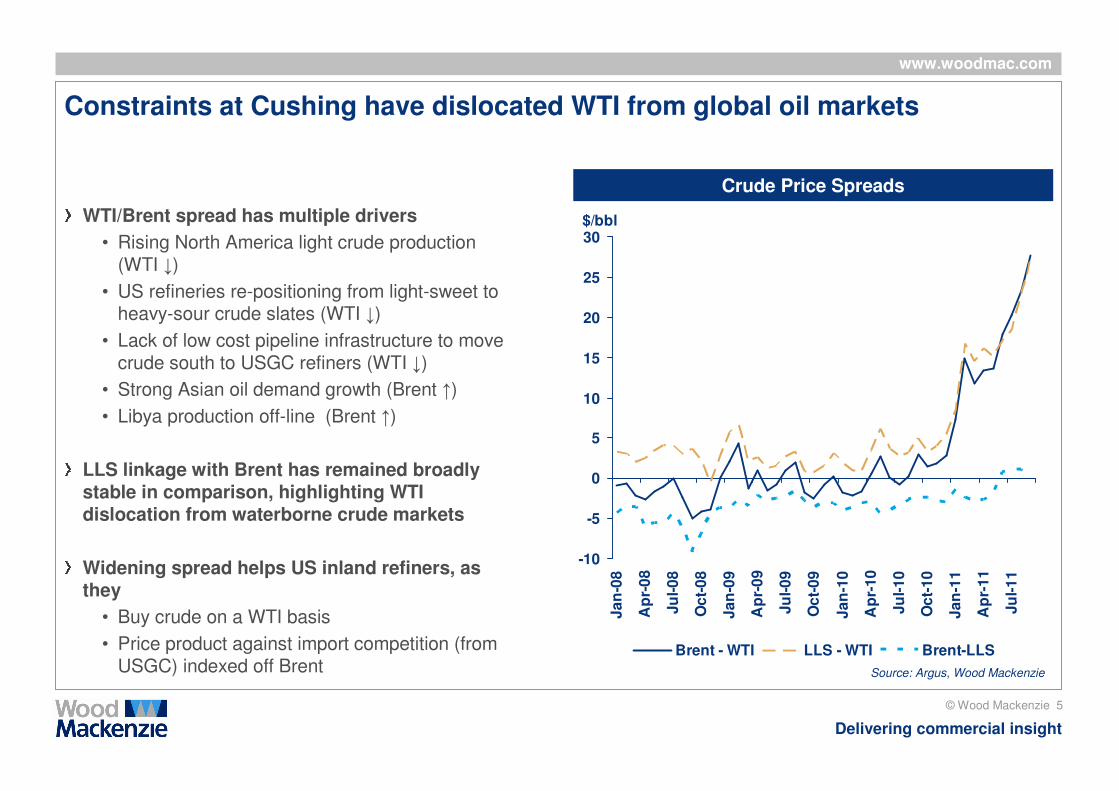
Brent - WTI LLS - WTI Brent-LLS
Constraints at Cushing have dislocated WTI from global oil markets
WTI/Brent spread has multiple drivers
• Rising North America light crude production (WTI ↓)
• US refineries re-positioning from light-sweet to heavy-sour crude slates (WTI ↓)
• Lack of low cost pipeline infrastructure to move crude south to USGC refiners (WTI ↓)
• Strong Asian oil demand growth (Brent ↑)
• Libya production off-line (Brent ↑)
LLS linkage with Brent has remained broadly stable in comparison, highlighting WTI dislocation from waterborne crude markets
Widening spread helps US inland refiners, as they
• Buy crude on a WTI basis
• Price product against import competition (from USGC) indexed off Brent
Crude Price Spreads
Source: Argus, Wood Mackenzie
www.woodmac.com
© Wood Mackenzie 6
Delivering commercial insight
CANADA
MEXICO
Permian Gulf Coast
West
Rockies
Mid-Continent
North-East
Bakken
Niobrara
Eagle Ford
Haynesvil le
Monterey
U.S.A.
Bone Spring
Austin Chalk
Marcellus Southwest
Wolfberry
ClevelandCoast
Avalon
Three Forks/Sanish
CardiumViking
Barnett Combo
Green River
Almond
Barnett
Granite Wash
Anadarko Woodford
Mesaverde Piceance
0 500 1,000250km
Source: Wood Mackenz ie
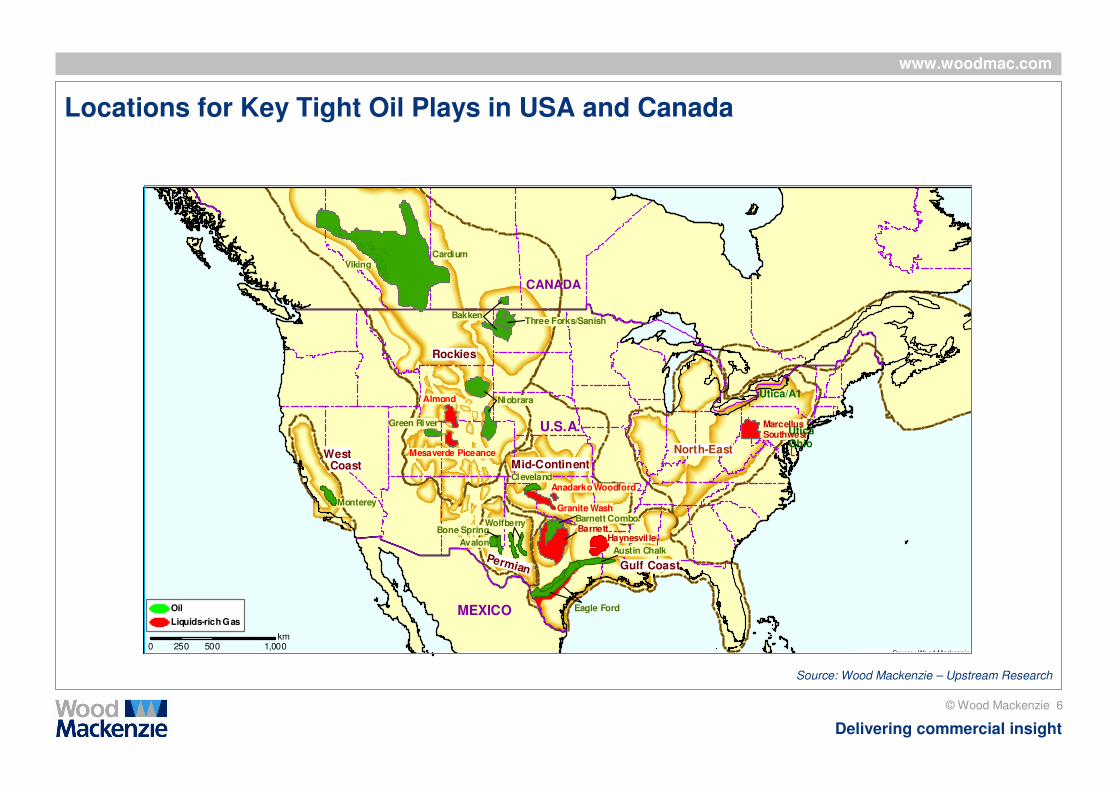
Oil
Liquids-rich Gas
Utica Ohio
Locations for Key Tight Oil Plays in USA and Canada
Source: Wood Mackenzie – Upstream Research
Utica/A1
www.woodmac.com
© Wood Mackenzie 7
Delivering commercial insight
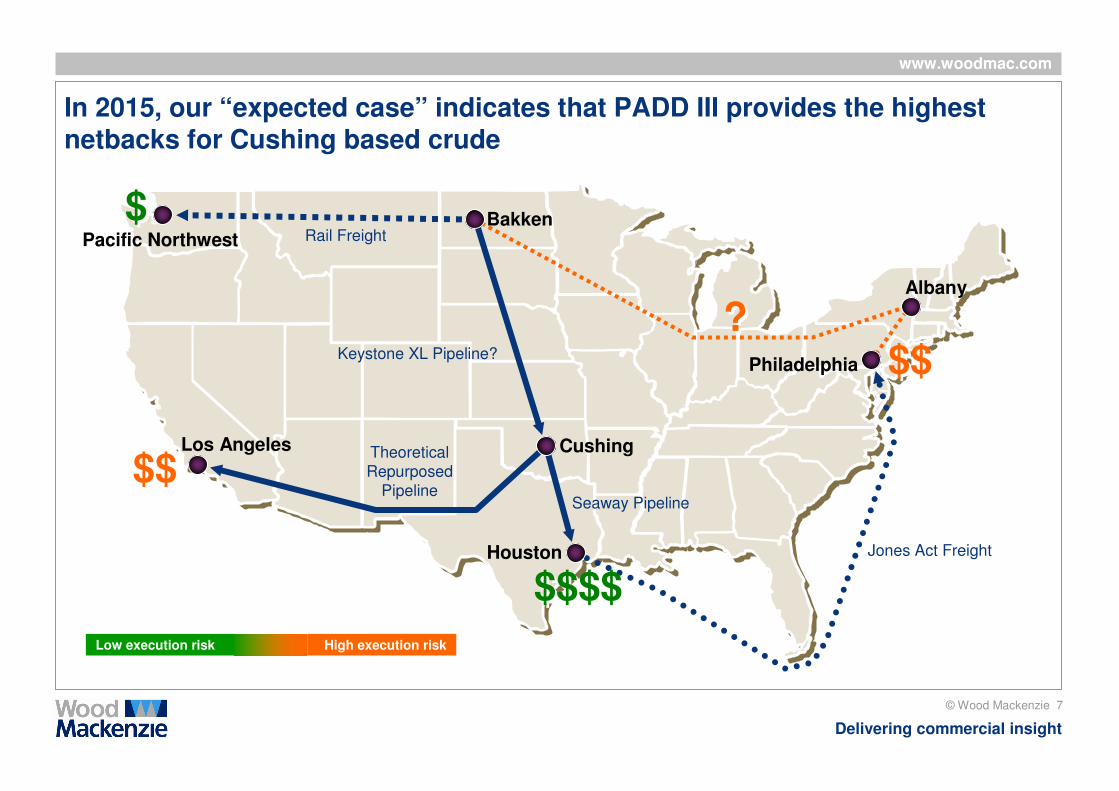
In 2015, our “expected case” indicates that PADD III provides the highest netbacks for Cushing based crude
Cushing
BakkenPacific Northwest
Los Angeles
Philadelphia
Houston Jones Act Freight
Seaway Pipeline
Keystone XL Pipeline?
Theoretical Repurposed
Pipeline
Rail Freight
$$$$
$$
$$$$
$$$$$$$$
Low execution risk High execution risk
Albany
??
www.woodmac.com
© Wood Mackenzie 8
Delivering commercial insight
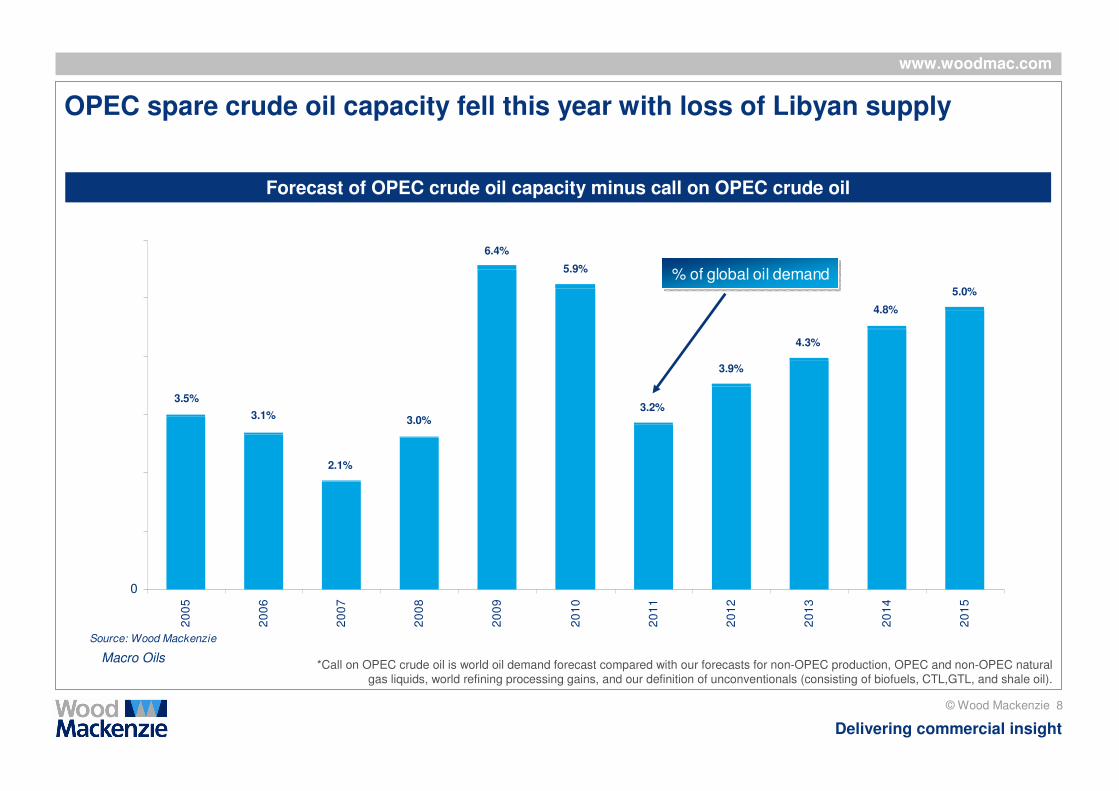
*Call on OPEC crude oil is world oil demand forecast compared with our forecasts for non-OPEC production, OPEC and non-OPEC natural gas liquids, world refining processing gains, and our definition of unconventionals (consisting of biofuels, CTL,GTL, and shale oil).
Forecast of OPEC crude oil capacity minus call on OPEC crude oil
OPEC spare crude oil capacity fell this year with loss of Libyan supply
5.0%
4.8%
4.3%
3.9%
3.2%
5.9%
6.4%
3.0%
2.1%
3.1%
3.5%
0
1
2
3
4
5
6
20
05
20
06
20
07
20
08
20
09
20
10
20
11
20
12
20
13
20
14
20
15
Mil
lio
n b
/d
Source: Wood Mackenzie
% of global oil demand
Macro Oils
www.woodmac.com
© Wood Mackenzie 9
Delivering commercial insight
1 Crude Oil Outlook
Atlantic Basin Refining and Products
Agenda
2
Oil Infrastructure Developments 3
www.woodmac.com
© Wood Mackenzie 10
Delivering commercial insight
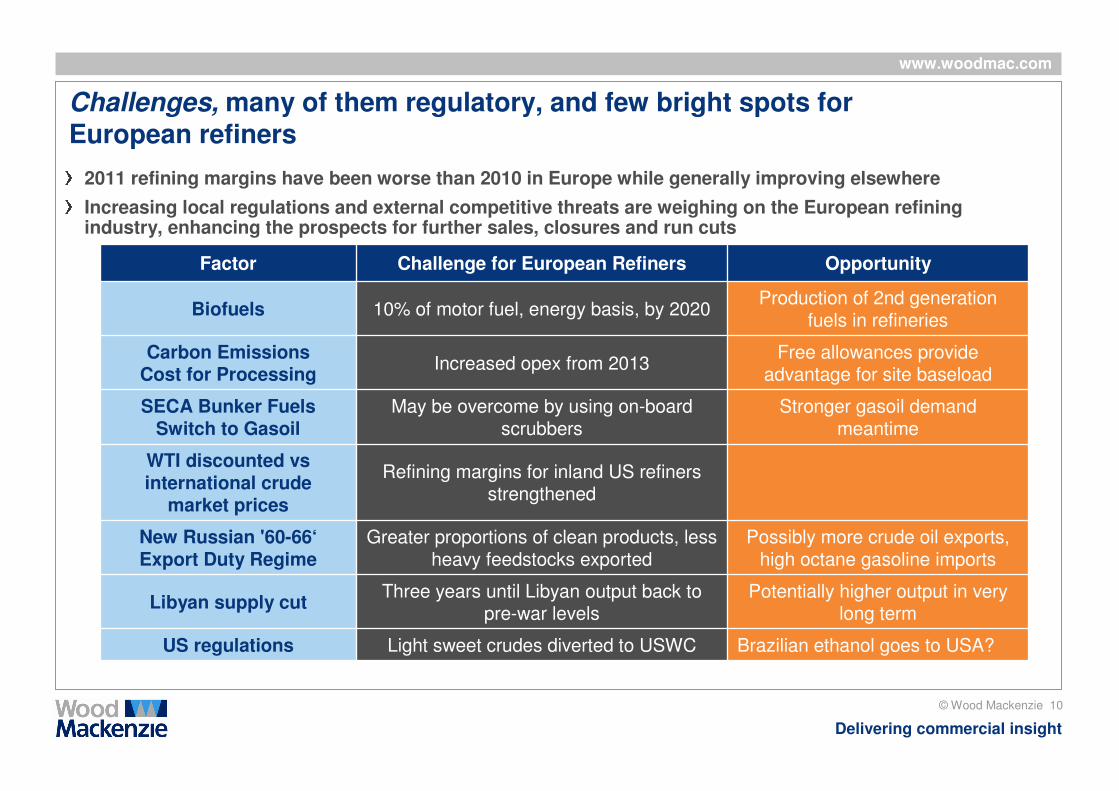
Challenges, many of them regulatory, and few bright spots for European refiners
2011 refining margins have been worse than 2010 in Europe while generally improving elsewhere
Increasing local regulations and external competitive threats are weighing on the European refining industry, enhancing the prospects for further sales, closures and run cuts
Brazilian ethanol goes to USA?Light sweet crudes diverted to USWCUS regulations
Potentially higher output in very long term
Three years until Libyan output back to pre-war levels
Libyan supply cut
Possibly more crude oil exports, high octane gasoline imports
Greater proportions of clean products, less heavy feedstocks exported
New Russian '60-66‘Export Duty Regime
Refining margins for inland US refiners strengthened
WTI discounted vsinternational crude
market prices
Stronger gasoil demand meantime
May be overcome by using on-board scrubbers
SECA Bunker Fuels Switch to Gasoil
Free allowances provide advantage for site baseload
Increased opex from 2013Carbon Emissions
Cost for Processing
Production of 2nd generation fuels in refineries
10% of motor fuel, energy basis, by 2020Biofuels
OpportunityChallenge for European Refiners Factor
www.woodmac.com
© Wood Mackenzie 11
Delivering commercial insight
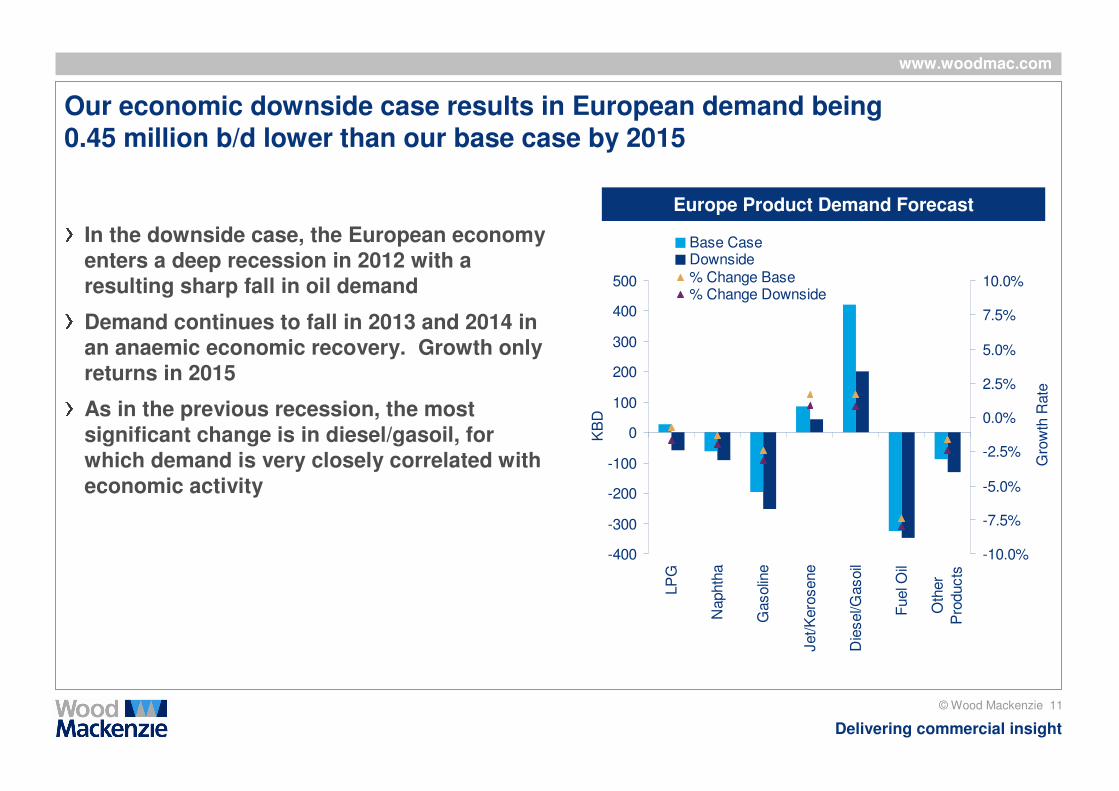
Our economic downside case results in European demand being 0.45 million b/d lower than our base case by 2015
In the downside case, the European economy enters a deep recession in 2012 with a resulting sharp fall in oil demand
Demand continues to fall in 2013 and 2014 in an anaemic economic recovery. Growth only returns in 2015
As in the previous recession, the most significant change is in diesel/gasoil, for which demand is very closely correlated with economic activity
Europe Product Demand Forecast
-400
-300
-200
-100
0
100
200
300
400
500
LP
G
Naphth
a
Gasolin
e
Jet/K
ero
sene
Die
sel/G
asoil
Fuel O
il
Oth
er
Pro
ducts
KB
D .
-10.0%
-7.5%
-5.0%
-2.5%
0.0%
2.5%
5.0%
7.5%
10.0%
Gro
wth
Rate
.
Base CaseDownside% Change Base% Change Downside
www.woodmac.com
© Wood Mackenzie 12
Delivering commercial insight
1 Crude Oil Outlook
Atlantic Basin Refining and Products
Agenda
2
Oil Infrastructure Developments 3
www.woodmac.com
© Wood Mackenzie 13
Delivering commercial insight
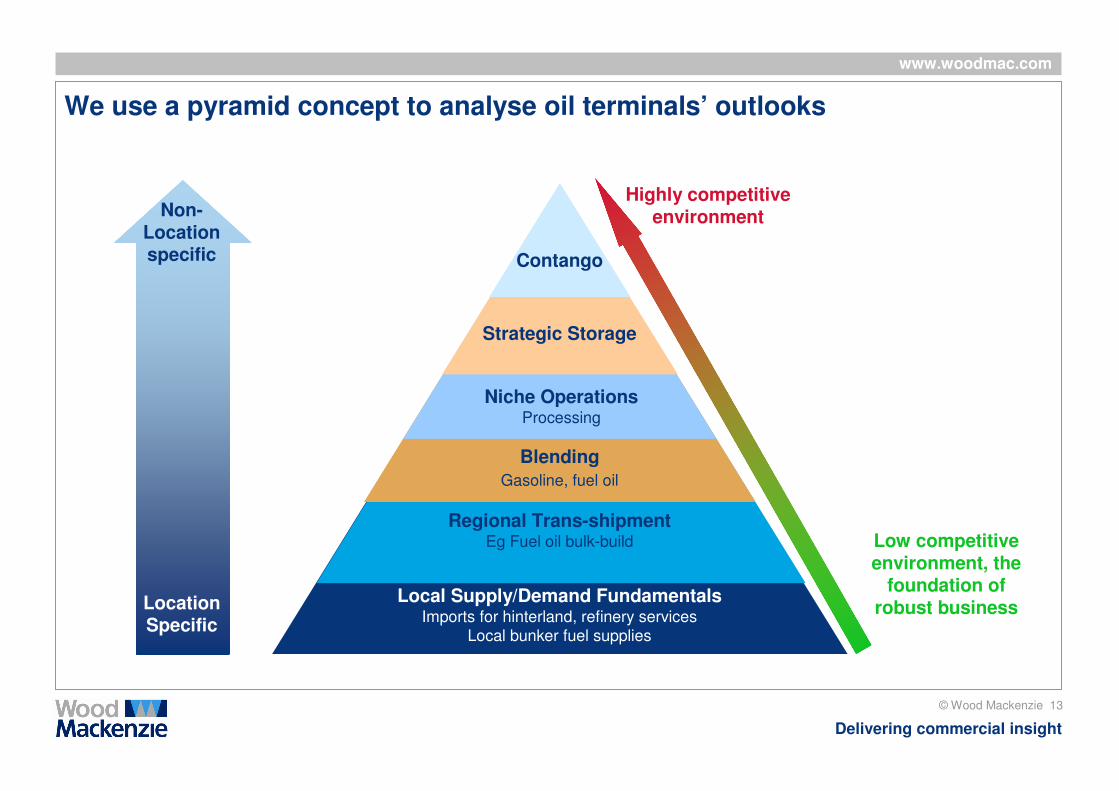
We use a pyramid concept to analyse oil terminals’ outlooks
Location Specific
Non-Location specific
Local Supply/Demand FundamentalsImports for hinterland, refinery services
Local bunker fuel supplies
Regional Trans-shipmentEg Fuel oil bulk-build
Blending Gasoline, fuel oil
Niche OperationsProcessing
Strategic Storage
Contango
Low competitive environment, the
foundation of robust business
Highly competitive environment
www.woodmac.com
© Wood Mackenzie 14
Delivering commercial insight
© Wood Mackenzie 14
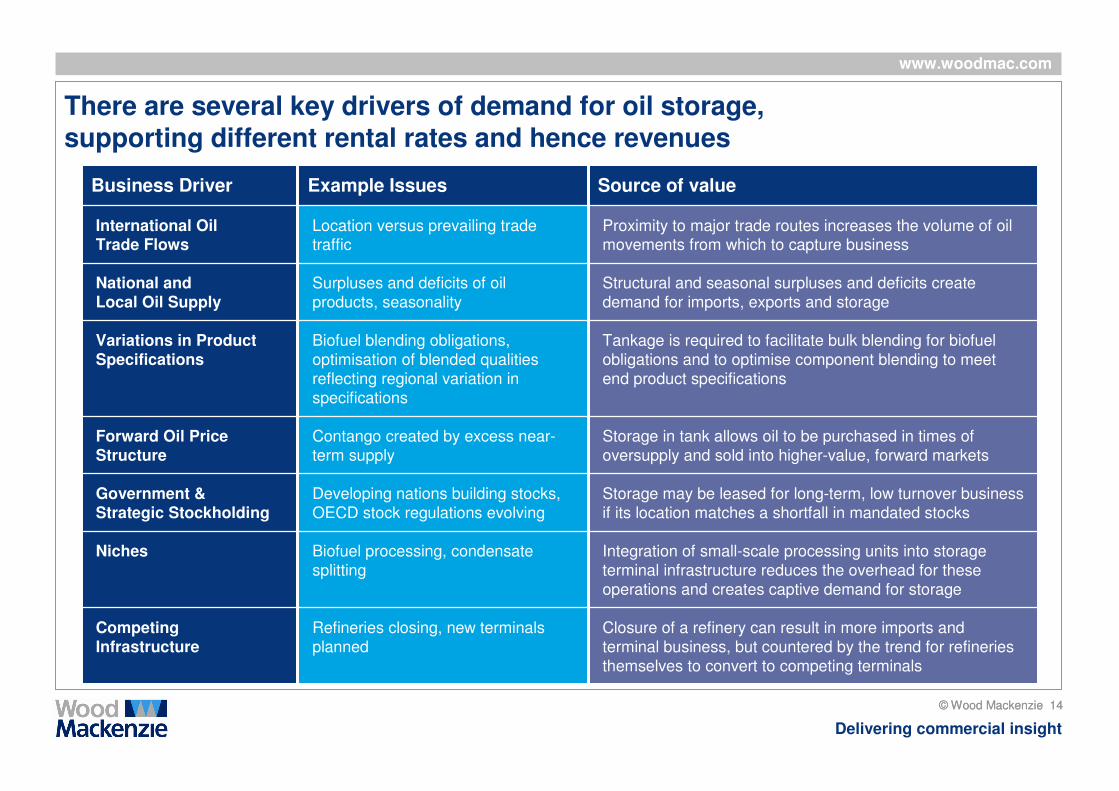
Business Driver Example Issues Source of value
International Oil Trade Flows
Location versus prevailing trade traffic
Proximity to major trade routes increases the volume of oil movements from which to capture business
National and Local Oil Supply
Surpluses and deficits of oil
products, seasonality
Structural and seasonal surpluses and deficits create
demand for imports, exports and storage
Variations in Product Specifications
Biofuel blending obligations,
optimisation of blended qualities
reflecting regional variation in
specifications
Tankage is required to facilitate bulk blending for biofuel
obligations and to optimise component blending to meet
end product specifications
Forward Oil Price Structure
Contango created by excess near-
term supply
Storage in tank allows oil to be purchased in times of
oversupply and sold into higher-value, forward markets
Government & Strategic Stockholding
Developing nations building stocks,
OECD stock regulations evolving
Storage may be leased for long-term, low turnover business
if its location matches a shortfall in mandated stocks
Niches Biofuel processing, condensate
splitting
Integration of small-scale processing units into storage
terminal infrastructure reduces the overhead for these
operations and creates captive demand for storage
Competing Infrastructure
Refineries closing, new terminals
planned
Closure of a refinery can result in more imports and
terminal business, but countered by the trend for refineries
themselves to convert to competing terminals
There are several key drivers of demand for oil storage, supporting different rental rates and hence revenues
www.woodmac.com
© Wood Mackenzie 15
Delivering commercial insight
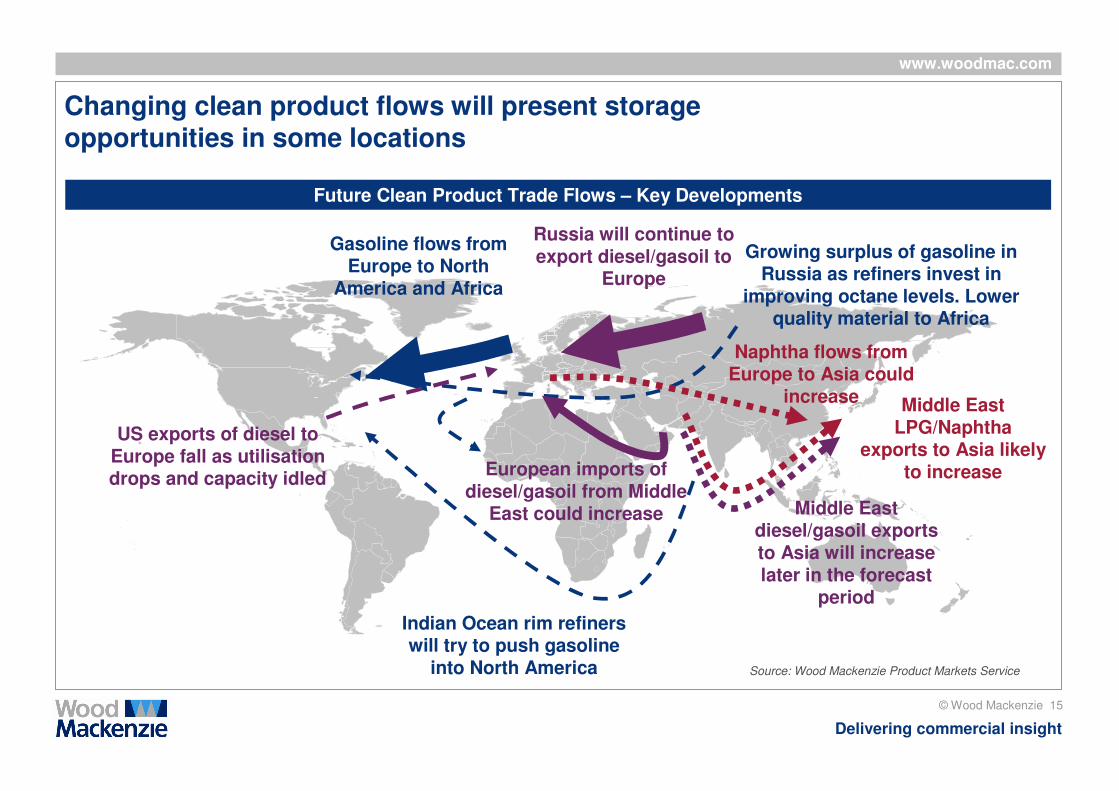
Changing clean product flows will present storage opportunities in some locations
Gasoline flows from Europe to North
America and Africa
Indian Ocean rim refiners will try to push gasoline
into North America
Growing surplus of gasoline in Russia as refiners invest in
improving octane levels. Lower quality material to Africa
European imports of diesel/gasoil from Middle
East could increase
Russia will continue to export diesel/gasoil to
Europe
Middle East diesel/gasoil exports to Asia will increase later in the forecast
period
US exports of diesel to Europe fall as utilisation drops and capacity idled
Middle East LPG/Naphtha
exports to Asia likely to increase
Naphtha flows from Europe to Asia could
increase
Future Clean Product Trade Flows – Key Developments
Source: Wood Mackenzie Product Markets Service
www.woodmac.com
© Wood Mackenzie 16
Delivering commercial insight
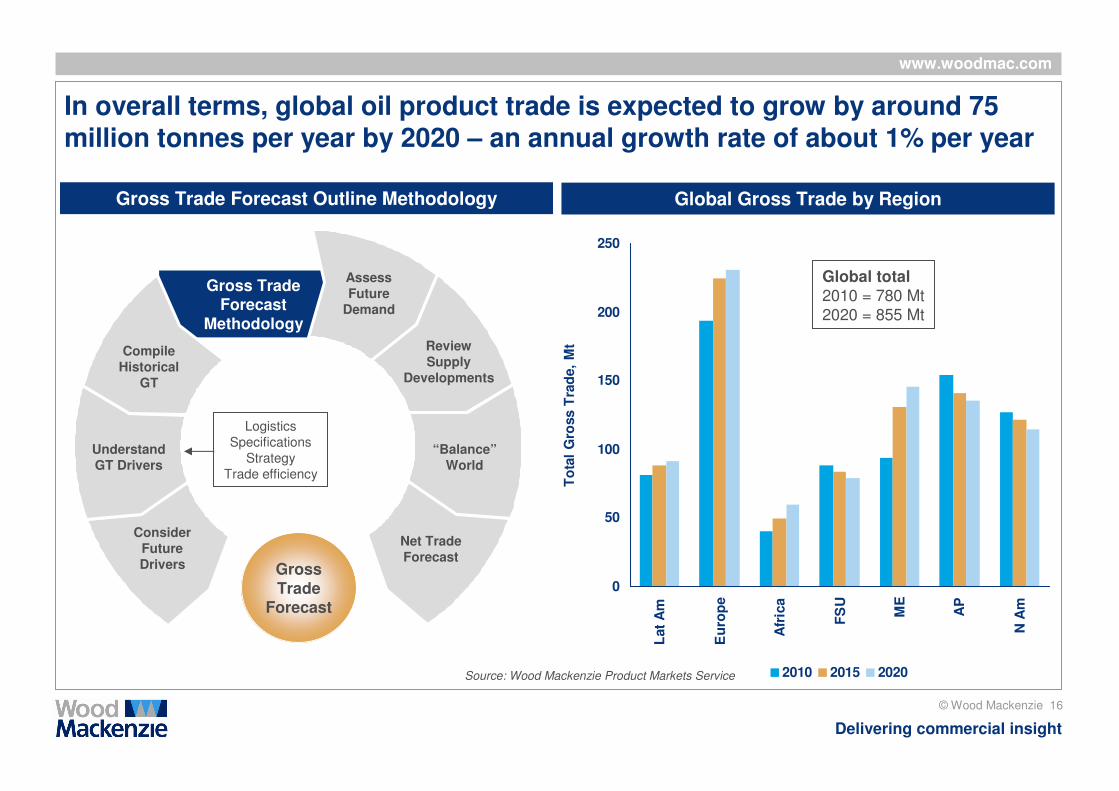
In overall terms, global oil product trade is expected to grow by around 75 million tonnes per year by 2020 – an annual growth rate of about 1% per year
0
50
100
150
200
250
Lat
Am
Eu
rop
e
Afr
ica
FS
U
ME
AP
N A
m
To
tal
Gro
ss T
rad
e,
Mt
2010 2015 2020
Global Gross Trade by Region
Global total2010 = 780 Mt
2020 = 855 Mt
Gross TradeForecast
Methodology
AssessFuture
Demand
ReviewSupply
Developments
“Balance”World
Net TradeForecast
CompileHistorical
GT
UnderstandGT Drivers
ConsiderFutureDrivers Gross
TradeForecast
Logistics
Specifications
Strategy
Trade efficiency
Gross Trade Forecast Outline Methodology
Source: Wood Mackenzie Product Markets Service
www.woodmac.com
© Wood Mackenzie 17
Delivering commercial insight
© Wood Mackenzie 17
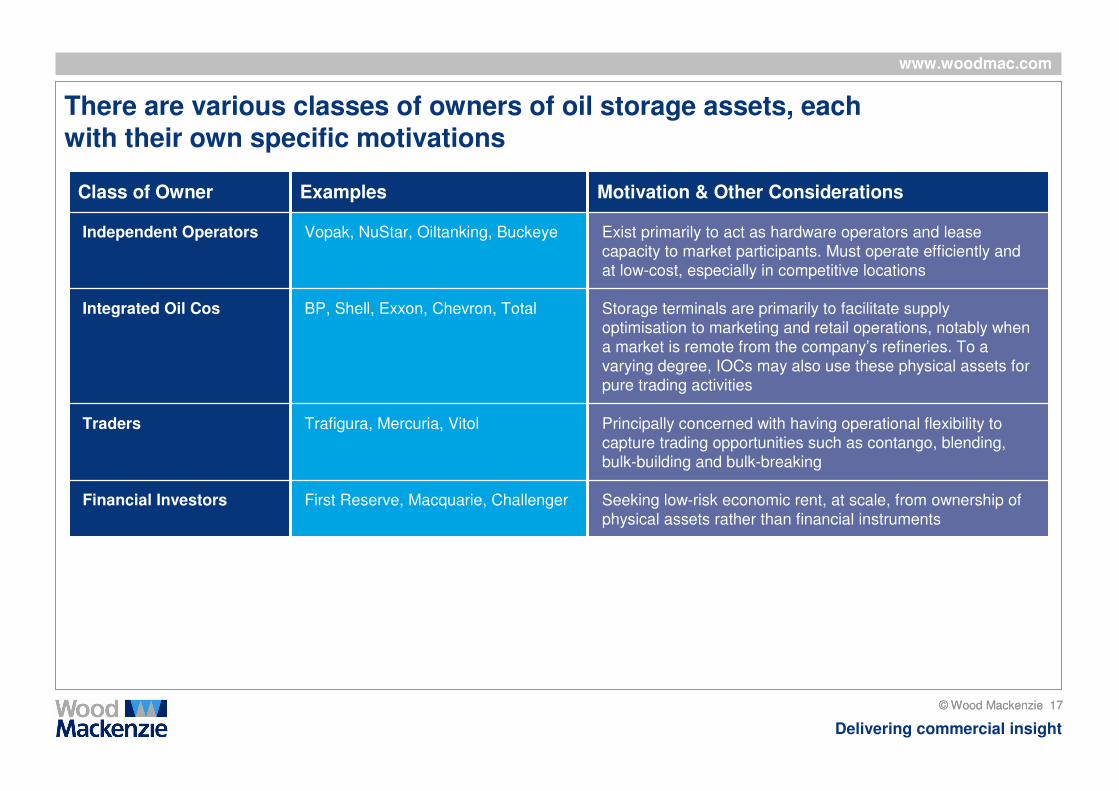
There are various classes of owners of oil storage assets, each with their own specific motivations
Class of Owner Examples Motivation & Other Considerations
Independent Operators Vopak, NuStar, Oiltanking, Buckeye Exist primarily to act as hardware operators and lease
capacity to market participants. Must operate efficiently and
at low-cost, especially in competitive locations
Integrated Oil Cos BP, Shell, Exxon, Chevron, Total Storage terminals are primarily to facilitate supply
optimisation to marketing and retail operations, notably when
a market is remote from the company’s refineries. To a
varying degree, IOCs may also use these physical assets for
pure trading activities
Traders Trafigura, Mercuria, Vitol Principally concerned with having operational flexibility to
capture trading opportunities such as contango, blending,
bulk-building and bulk-breaking
Financial Investors First Reserve, Macquarie, Challenger Seeking low-risk economic rent, at scale, from ownership of
physical assets rather than financial instruments
www.woodmac.com
© Wood Mackenzie 18
Delivering commercial insight
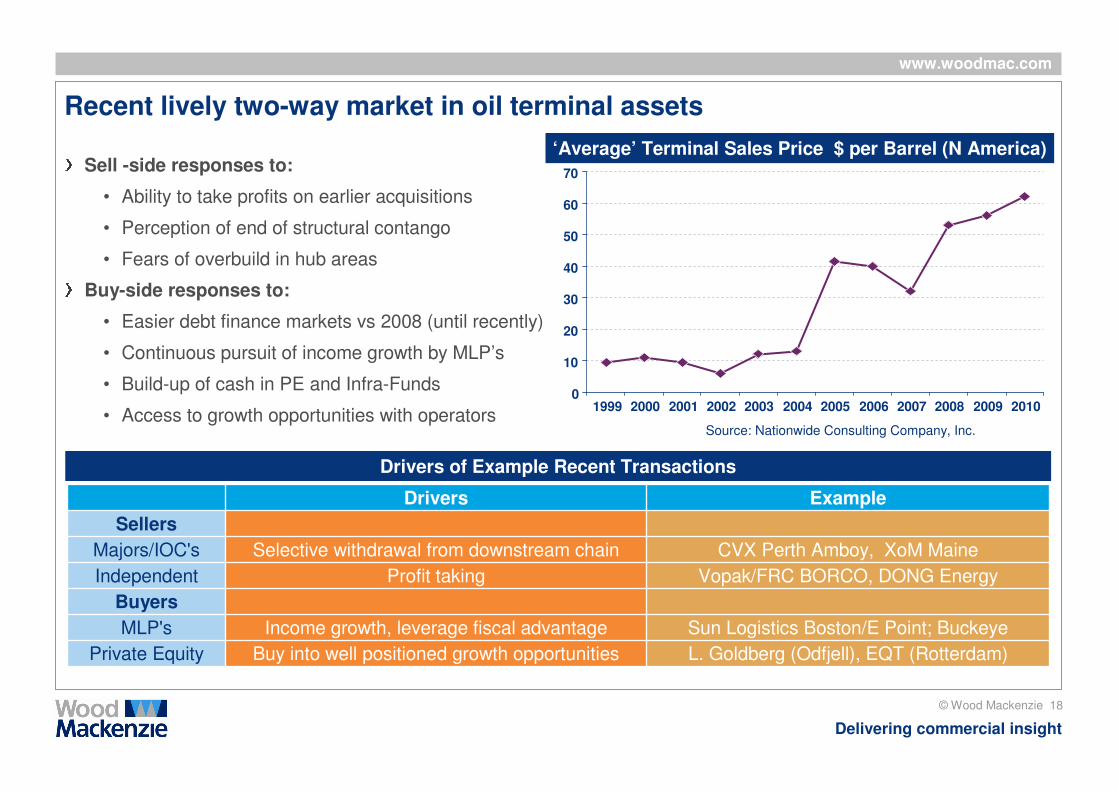
Recent lively two-way market in oil terminal assets
Sell -side responses to:
• Ability to take profits on earlier acquisitions
• Perception of end of structural contango
• Fears of overbuild in hub areas
Buy-side responses to:
• Easier debt finance markets vs 2008 (until recently)
• Continuous pursuit of income growth by MLP’s
• Build-up of cash in PE and Infra-Funds
• Access to growth opportunities with operatorsSource: Nationwide Consulting Company, Inc.
‘Average’ Terminal Sales Price $ per Barrel (N America)
Drivers of Example Recent Transactions
0
10
20
30
40
50
60
70
1999 2000 2001 2002 2003 2004 2005 2006 2007 2008 2009 2010
L. Goldberg (Odfjell), EQT (Rotterdam)Buy into well positioned growth opportunitiesPrivate Equity
Sun Logistics Boston/E Point; BuckeyeIncome growth, leverage fiscal advantageMLP's
Buyers
Vopak/FRC BORCO, DONG EnergyProfit takingIndependent
CVX Perth Amboy, XoM MaineSelective withdrawal from downstream chainMajors/IOC's
Sellers
ExampleDrivers
www.woodmac.com
© Wood Mackenzie 19
Delivering commercial insight
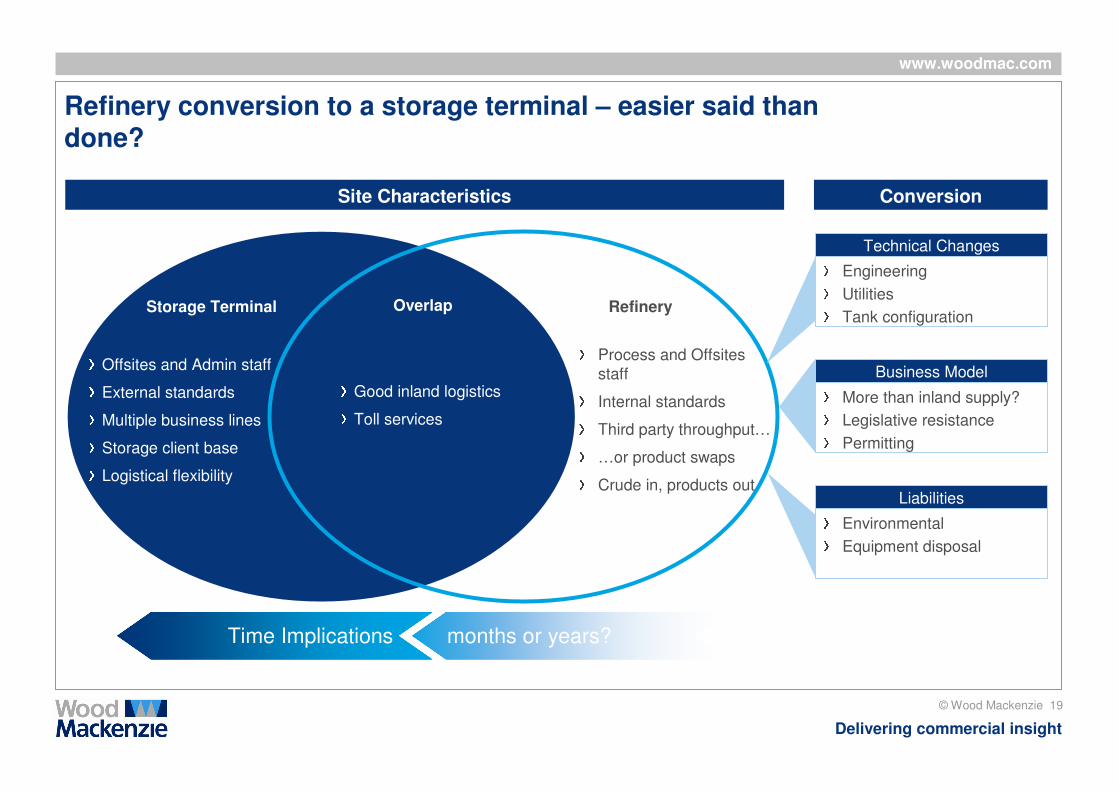
Storage Terminal Refinery
Conversion Considerations
Good inland logistics
Toll services
Offsites and Admin staff
External standards
Multiple business lines
Storage client base
Logistical flexibility
Process and Offsites
staff
Internal standards
Third party throughput…
…or product swaps
Crude in, products out
Technical Changes
Engineering
Utilities
Tank configuration
Business Model
More than inland supply?
Legislative resistance
Permitting
Liabilities
Environmental
Equipment disposal
Refinery conversion to a storage terminal – easier said than done?
Overlap
Site Characteristics
Time Implications months or years?
www.woodmac.com
© Wood Mackenzie 20
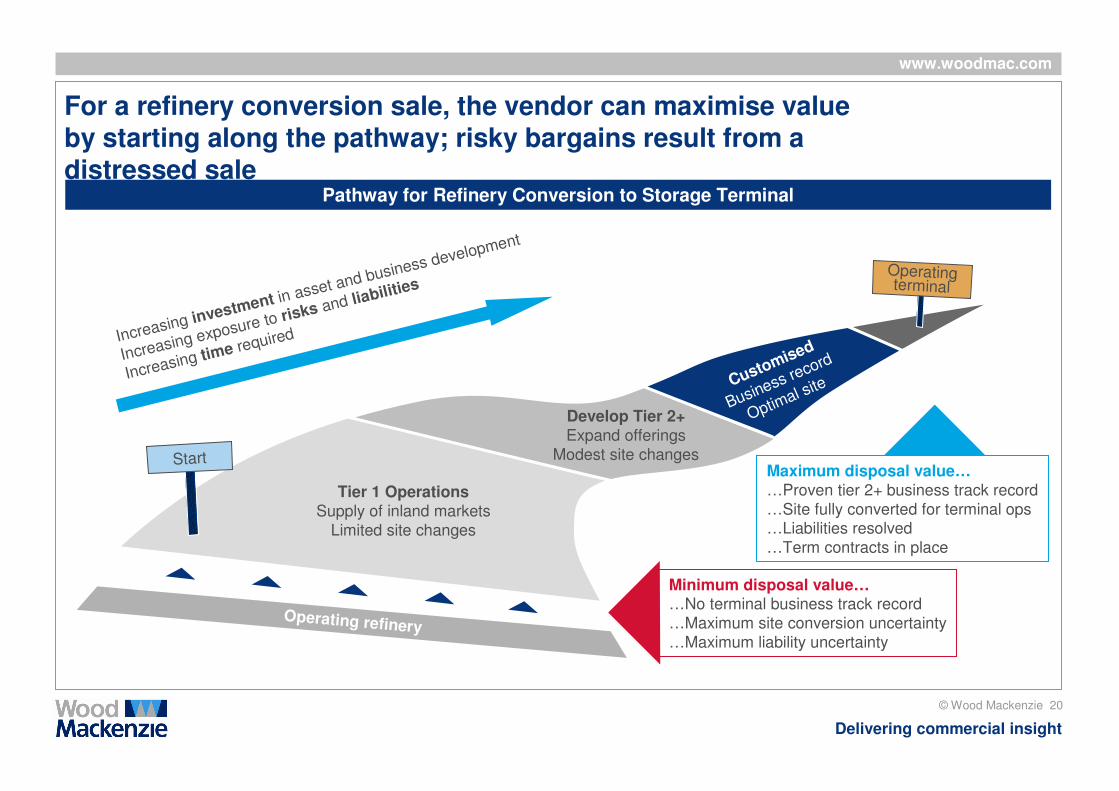
Delivering commercial insight
Operating refinery
Start
Operating terminal
Tier 1 OperationsSupply of inland markets
Limited site changes
Develop Tier 2+Expand offerings
Modest site changes
Customised
Business record
Optimal site
For a refinery conversion sale, the vendor can maximise value by starting along the pathway; risky bargains result from a distressed sale
Minimum disposal value……No terminal business track record
…Maximum site conversion uncertainty
…Maximum liability uncertainty
Maximum disposal value……Proven tier 2+ business track record
…Site fully converted for terminal ops…Liabilities resolved
…Term contracts in place
Increasing investment in asset and business development
Increasing exposure to risks and liabilities
Increasing time required
Pathway for Refinery Conversion to Storage Terminal
www.woodmac.com
© Wood Mackenzie 21
Delivering commercial insight
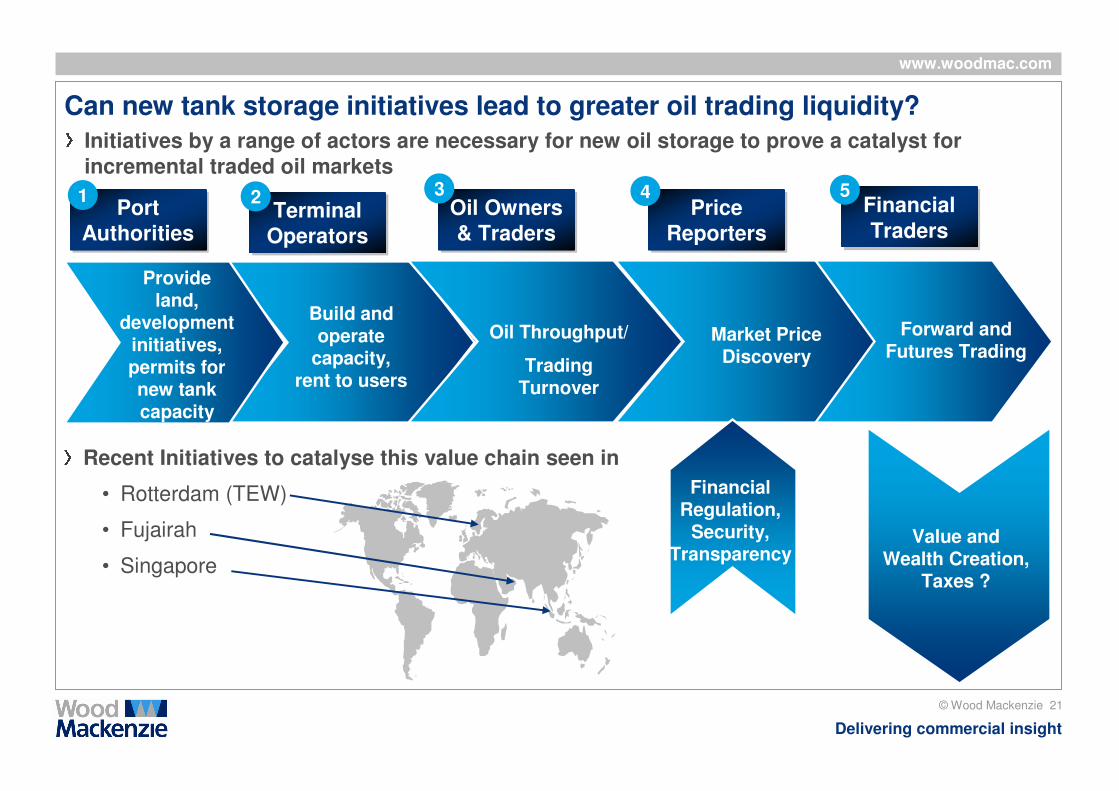
Can new tank storage initiatives lead to greater oil trading liquidity?
Initiatives by a range of actors are necessary for new oil storage to prove a catalyst for incremental traded oil markets
Oil Throughput/
Trading Turnover
Market Price Discovery
Forward and Futures Trading
Port Authorities
Port Authorities
Build and operate
capacity, rent to users
Provide land,
development initiatives, permits for new tank capacity
Terminal Operators
Terminal Operators
Oil Owners & Traders
Oil Owners & Traders
Price Reporters
Price Reporters
Financial Traders
Financial Traders
1 2 3 4 5
Recent Initiatives to catalyse this value chain seen in
• Rotterdam (TEW)
• Fujairah
• Singapore
Financial Regulation,
Security, Transparency
Value and Wealth Creation,
Taxes ?
www.woodmac.com
© Wood Mackenzie 22
Delivering commercial insight
Ben Holt
VP Downstream Consulting, EMEA
+44 20 3060 0467
Ben Holt
VP Downstream Consulting, EMEA
+44 20 3060 0467
Contacts
Onur Capan
Research Analyst
+44 20 3060 0448
Onur Capan
Research Analyst
+44 20 3060 0448
www.woodmac.com
© Wood Mackenzie 23
Delivering commercial insight
Wood Mackenzie Disclaimer
This presentation has been prepared by Wood Mackenzie Limited for delivery at the Tank Storage Istanbul 2011 Conference. It has not been prepared for the benefit of any particular attendee and may not be relied upon by any attendee or other third party. If, notwithstanding the foregoing, this presentation is relied upon by any person, Wood Mackenzie Limited does not accept, and disclaims, all liability for loss and damage suffered as a result.
The information contained in these slides may be retained by attendees. However, these slides and the contents of this presentation may not be disclosed to any other person or published by any means without Wood Mackenzie Limited's prior written permission.
www.woodmac.com
© Wood Mackenzie 24
Delivering commercial insight
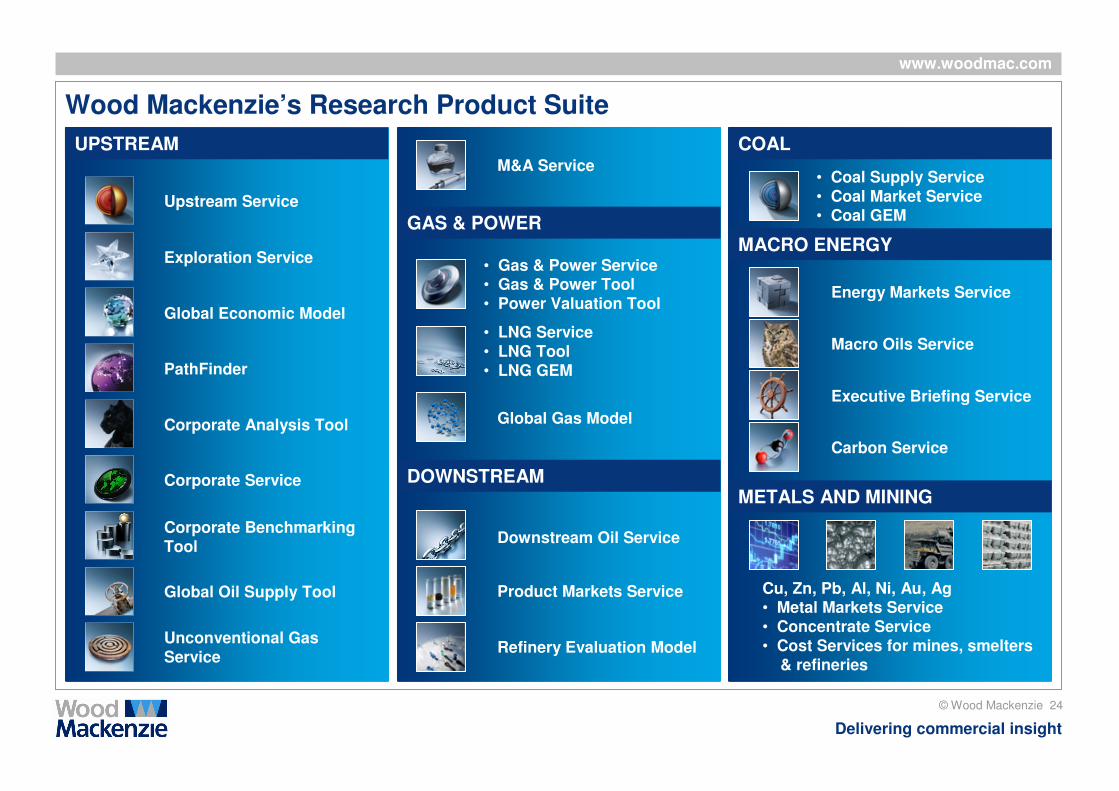
Wood Mackenzie’s Research Product Suite
• LNG Service• LNG Tool• LNG GEM
GAS & POWER
DOWNSTREAM
Upstream Service
UPSTREAM
Global Economic Model
PathFinder
Unconventional Gas Service
Corporate Analysis Tool
Energy Markets Service
Downstream Oil Service
Macro Oils Service
MACRO ENERGY
Global Oil Supply Tool Product Markets Service
• Gas & Power Service• Gas & Power Tool• Power Valuation Tool
Global Gas Model
Refinery Evaluation Model
Exploration Service
COAL
• Coal Supply Service• Coal Market Service• Coal GEM
Corporate Service METALS AND MINING
Corporate BenchmarkingTool
Cu, Zn, Pb, Al, Ni, Au, Ag• Metal Markets Service• Concentrate Service• Cost Services for mines, smelters
& refineries
M&A Service
Executive Briefing Service
Carbon Service
www.woodmac.com
© Wood Mackenzie 25
Delivering commercial insight
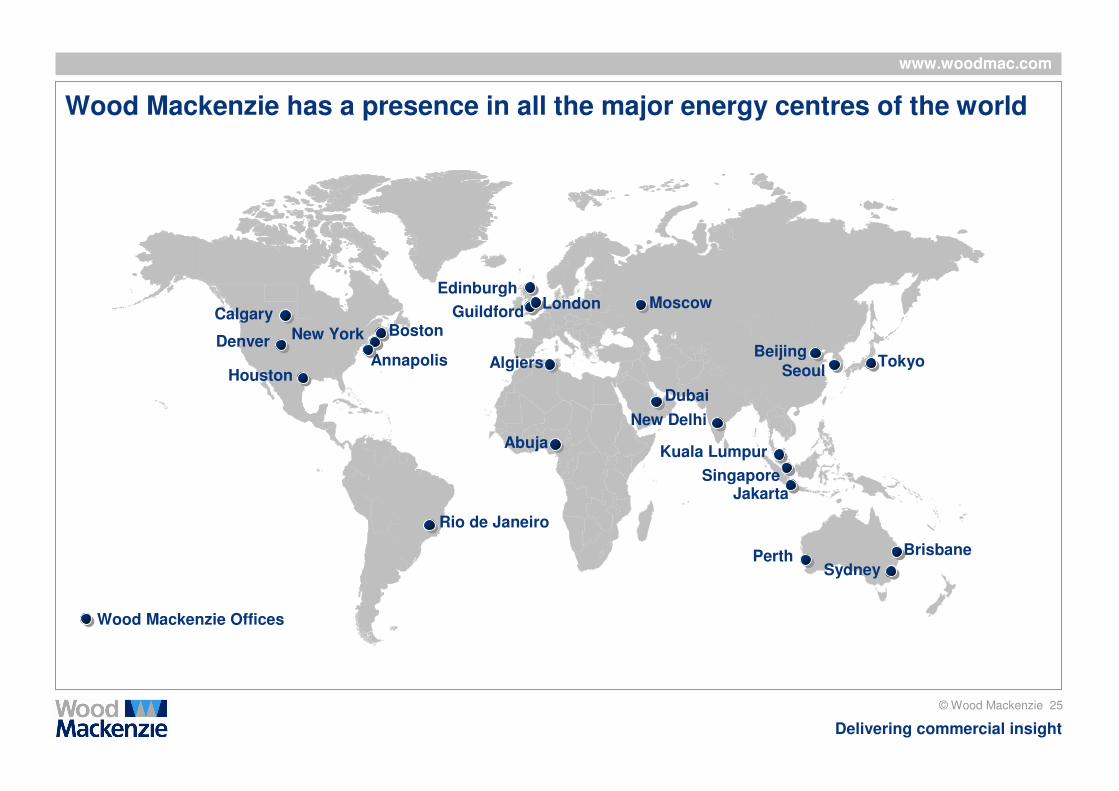
Wood Mackenzie has a presence in all the major energy centres of the world
FIJI
New Delhi
Calgary
Houston
Boston
EdinburghMoscow
Beijing
Singapore
Sydney
Kuala Lumpur
Tokyo
New York
Dubai
Rio de Janeiro
Wood Mackenzie Offices
Perth Brisbane
AnnapolisDenver
Guildford
Seoul
London
Jakarta
Algiers
Abuja

www.woodmac.com
© Wood Mackenzie 26
Delivering commercial insight
Wood Mackenzie
Kintore House
74-77 Queen Street
Edinburgh EH2 4NS
Global Contact Details
Europe +44 (0)131 243 4400
Americas +1 713 470 1600
Asia Pacific +65 6518 0800
Email [email protected]
Global Offices
Australia - Canada - China - Japan - Malaysia - Russia - Singapore - South Africa - United Arab Emirates - United Kingdom - United States
Wood Mackenzie has been providing its unique range of research products and consulting services to the Energy industry for over 30 years. Wood Mackenzie provides forward-looking commercial insight that enables clients to make better
business decisions. For more information visit: www.woodmac.com


![Commercial Drivers Final [Compatibility Mode]](https://img.pdfslide.net/doc/110x75/58f2ed611a28ab0b428b4629/commercial-drivers-final-compatibility-mode.jpg)