Embed Size (px)
Citation preview

1
COMMISSIONING OF AIR-CONDITIONING SYSTEM
Bernard Georges, Haiqing Hu and Jean Lebrun University of Liège, Laboratory of Thermodynamics
Campus du Sart Tilman, Bât. B49 - Park. P33, B-4000 Liège (Belgium) 1. ABSTRACT This study presents the method, procedure and partial results of commissioning of air conditioning system. The work was carried out with Justus Lispsius building of the Ministry Council of the European Union in Brussels. The objective of the commissioning is to check the hydraulic characteristics of air distribution system and the thermal performance of air handling units, use the simulation method to predict the cooling demand, improve the performance of air-conditioning system, eventually minimise the energy consumption. The study contains: on-site investigation, equipment modelling and simulation and performance analysis. During on-site investigation, detailed measurements combined with interviews with operators and manufacturers were made. The measurements includes pressure, air velocity, air temperature and humidity, water temperature. The information provided by BEMS (Building & Energy Management System) were compared with measuring results to ensure the temperature and humidity sensor can give correct results. Model of air distribution system were developed and calibrated with on-site measuring results. By simulating the air distribution system, the analysis was made on how to obtain better performance. Model of heating coil and cooling coil were developed. The characteristics of heating and cooling coils were identified on the basis of manufacturer’s data. A commissioning test on air - conditioning system was made in order to check the precision of cooling demand estimation in the whole building by using simulation method. The simulation result was compared with measuring results of energy meter. It shows that simulation can be used as an effective tool in practice to analyse and predict the global performance of whole system. Control regulation of temperature control is discussed on the basis of the typical operating situation of air handling unit in winter time.

2. INTRODUCTION Justus Lispsius building is composed of two main buildings: the conference building (about 25,000mP
2P) and the general secretariat building (about 29,000m²).
In the conference building (CO building), the set point of dry bulb temperature and the relative humidity are fixed at 24 °C and 60 % respectively in summer time. About 300 air handling units are used to supply the different rooms. Almost all these groups are constant air volume systems (CAV) with possibility of air recirculation. These groups are sized in such a way that 60 mP
3PhP
-1P of fresh air can be provided to
each occupant. Room supply temperature can go down until 17°C according to sensible loads. Moreover, most of the rooms have a hygienic probe to control the fresh air ratio. The total air flow rate for all the groups is 515 000 mP
3PhP
-1P and the nominal cooling
capacity is 3.88MW (TBoutB=30°C, φBoutB=50%). All the delegation rooms and some other rooms are equipped with fan-coils. The total cooling power of this fan coils in nominal conditions is 540 kW. In the general secretariat building (SG building), there is no fresh air ratio control. The offices are supplied by a constant air volume system at the rate of 42 mP
3P/h per
occupant in nominal occupancy. The fresh air is only cooled down to 24°C in summer conditions. Seven big air handling units are available. Each of them supplies all the floors of one building sector. The nominal cooling power is 415 kW and the nominal air flow rate is 165 000 mP
3P/h.
Sensible cooling is provided to some of the South and west oriented offices by fan coils. Their total cooling power is 900 kW. Some rooms (printers, computers) are also equipped with decentralised cooling units. Their total cooling power is 442 kW. A typical air handling unit in conference building is shown in Figure 1. A typical air handling unit in general secretariat building is shown in Figure 2.
t,φ t,φ
t,φAQ
t
t
Figure 1 A typical AHU in conference building
2

t t,φ
φ
Figure 2 A typical AHU in general secretariat building All the air conditioning system is monitored by BEMS (building and energy management system). The BEMS provides the following information: • CCThe operating status of fan, pump, valve, damper • Room temperature and humidity ratio • Air quality given by hygienic probe • supply, exhaust air temperature of AHU and extraction air temperature • Set point value of controlled temperature and humidity The commissioning of air conditioning system include the following items: • Temperature and humidity sensor examination and fault detection • Air flow rate measurement • Capacity investigation and leakage checking of heating, cooling and humidifying
equipment • Water flow rate estimation • Control regulation of temperature and humidity in the occupancy zone • Special commissioning test of whole system This paper will present the method and procedure of each aspect. The models of air distribution system and heating, cooling equipment are developed. Although our commissioning work is still being carried out, some results and practical proposals are discussed. 3. TEMPERATURE AND HUMIDITY For the majority of the air handling units, the following five temperatures and three humidity are measured by the BEMS: • supply air temperature and humidity of AHU: tBsuB, φBsuB • air temperature after the cooling coil: tBafterB • exhaust air temperature and humidity of AHU: tBexB, φBexB • room temperature: tBroomB • air temperature and humidity in the extraction duct: tBextrB, φBextrB For all the air handling units, water side information (water supply and exhaust temperature of preheating, cooling and postheating coil) is not monitored by BEMS.
3

To check the air temperature and humidity sensor is the first step in our commissioning work because of the following two reasons: 1. Some temperature and humidity measurements take part in the equipment control.
For example: tBexB and φBextr B(in SG building), tBroomB, φBextrB, tBafterB (in CO building). If these sensors can not give right values, a comfortable indoor environment will not be achieved even if the equipment, control regulation is designed and functioning in a perfect way. Moreover, the incorrect measuring results may bring about important energy wasting.
For example, it was found that for several air handling units, the air temperature sensors located behind the cooling coil tBafterB were not correct, which gave too high temperature. Since in summer time, tBafterB is used as dewpoint temperature in humidity control, the water valve opening of cooling coil is a function of tBafterB and the corresponding set point value. The wasted cooling power in steady state due to the incorrect temperature measurement can be expressed as following: ( )∆Q M h hc a= −&
'2 2 (see figure 3) At the same time, the room temperature is controlled by post - heating coil. The wasted heating power in steady state can be expressed as following: (see figure 3) (∆Q M c t th a pa= −&
'2 2 )The air handling process is illustrated in Figure 3.
0.000
0.005
0.010
0.015
0.020
0.025
0.030
0.035
0.040
0 5 10 15 20 25 30 35
Temperature (°C)
Hum
idity
rat
io (k
g/kg
)
1
2
2' 33'
Figure 3 Air handling process
Where, 1 - 2: cooling and dehumidifying process (cooling coil) with correct tBafterB sensor 2 - 3: heating process (post-heating coil) with correct tBafterB sensor 1 - 2’: cooling and dehumidifying process (cooling coil) with incorrect tBafterB sensor 2’ - 3’: heating process (post-heating coil) with incorrect tBafterB sensor It also can be seen from Figure 3 that the humidity ratio at exhaust of cooling coil will be controlled at wB2’B instead of wB2B (set point value). 2. Since water side information ( water temperature and flow rate) is not available,
some temperature and humidity measurements are necessary to be used to estimate the water flow rate. For example, tBsuB and φBsuB, tBexB and φBex Bof all the air handling units.
4
5
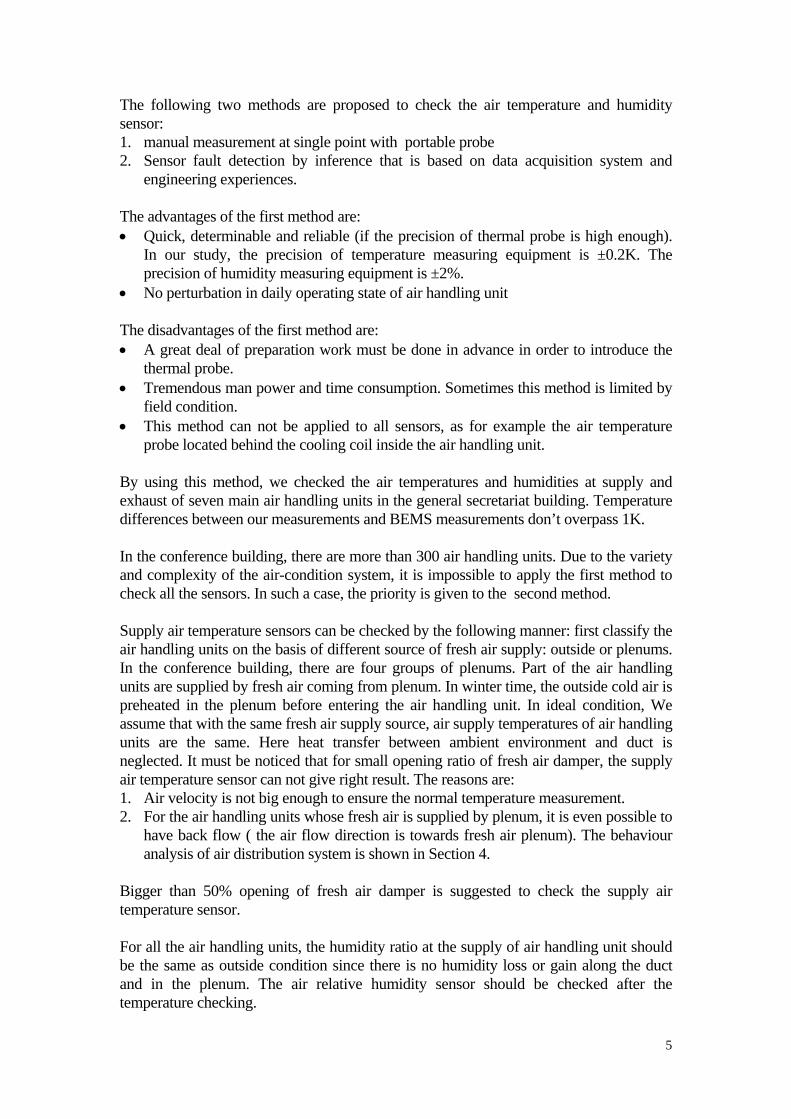
The following two methods are proposed to check the air temperature and humidity sensor: 1. manual measurement at single point with portable probe 2. Sensor fault detection by inference that is based on data acquisition system and
engineering experiences. The advantages of the first method are: • Quick, determinable and reliable (if the precision of thermal probe is high enough).
In our study, the precision of temperature measuring equipment is ±0.2K. The precision of humidity measuring equipment is ±2%.
• No perturbation in daily operating state of air handling unit The disadvantages of the first method are: • A great deal of preparation work must be done in advance in order to introduce the
thermal probe. • Tremendous man power and time consumption. Sometimes this method is limited by
field condition. • This method can not be applied to all sensors, as for example the air temperature
probe located behind the cooling coil inside the air handling unit. By using this method, we checked the air temperatures and humidities at supply and exhaust of seven main air handling units in the general secretariat building. Temperature differences between our measurements and BEMS measurements don’t overpass 1K. In the conference building, there are more than 300 air handling units. Due to the variety and complexity of the air-condition system, it is impossible to apply the first method to check all the sensors. In such a case, the priority is given to the second method. Supply air temperature sensors can be checked by the following manner: first classify the air handling units on the basis of different source of fresh air supply: outside or plenums. In the conference building, there are four groups of plenums. Part of the air handling units are supplied by fresh air coming from plenum. In winter time, the outside cold air is preheated in the plenum before entering the air handling unit. In ideal condition, We assume that with the same fresh air supply source, air supply temperatures of air handling units are the same. Here heat transfer between ambient environment and duct is neglected. It must be noticed that for small opening ratio of fresh air damper, the supply air temperature sensor can not give right result. The reasons are: 1. Air velocity is not big enough to ensure the normal temperature measurement. 2. For the air handling units whose fresh air is supplied by plenum, it is even possible to
have back flow ( the air flow direction is towards fresh air plenum). The behaviour analysis of air distribution system is shown in Section 4.
Bigger than 50% opening of fresh air damper is suggested to check the supply air temperature sensor. For all the air handling units, the humidity ratio at the supply of air handling unit should be the same as outside condition since there is no humidity loss or gain along the duct and in the plenum. The air relative humidity sensor should be checked after the temperature checking.

To check other measuring points, steady state condition is considered to be sure that there is no influence of equipment’s regulating on the measurements. If temperature sensors have no faults, the following five criterias must be satisfied: 1. fully fresh air circuit, no preheating, no cooling: tBsuB = tBafterB 2. full re-circulation circuit, no preheating, no cooling: tBafterB - tBextrB = dTBfan,exB 3. no post-heating: tBexB - tBafterB = dTBfan,suB 4. no load in occupancy zone: tBex B= tBroomB 5. neglect heat transfer between extraction duct and ambient: tBroomB = tBextrB
Where dTBfan,suB and dTBfan,exB are the heating up effect of supply and exhaust fans respectively.
dTW
V cfanmotor
a a pa= & ρ
With WBmotor B- power consumption of motor (catalogue data) (kW) - air volume flow rate (catalogue data) (m³/s) &Va
More attention must be paid on the temperature sensor behind the cooling coil because the air temperature distribution and the radiation of cooling coil and post-heating coil may have big influence on the air temperature measurement. The humidity sensor checking must be done after the temperature sensor are checked to be correct. If humidity sensors have no faults, the following five criteria must be satisfied: 1. fully fresh air circuit, no dehumidifying and humidifying: wBsuB = wBexB 2. no load in occupancy zone: wBexB= wBextrB 3. full re-circulation circuit, no dehumidifying and humidifying: wBafterB = wBexB
When the measuring results of data acquisition system don’t obey these laws, the possible fault can be detected. The advantages of the second method are as follows: • No supplementary facility required • applicable for all the sensors The disadvantage of the second method is that in some cases the possible faults are indicated but not determined. One example is shown in Figure 4.
6

21.4°C38% 23.8°C
32%
22.5°C37%AQ
23.4°C
t
100%
0%
0%0% 66%
15.8°C
Figure 4. An example of measuring results of data acquisition system
The air handling unit is working in steady state with fully fresh air supply. Supply air temperature is detected to be good. It can be seen that air temperature after the cooling coil is 5.6K lower than air supply temperature of AHU although the preheating and cooling coil are not functioning. There are two possible faults: • air temperature sensor behind the cooling coil • water valve leakage of cooling coil. The leakage of water flow rate can be estimated
by the following equation:
( )
( )∆ &&
MM c t t
c t twa pa su after
w wex wsu
=−
−
When the nominal air flow rate and nominal water supply and exhaust temperature are applied in the equation, the leaking water flow rate is around 24% of nominal water flow rate. The cooling power loss due to the water valve leakage is about 21KW. In such a case, further checking was done to locate the real problem. 4. AIR FLOW PATERN AND AIR VOLUME FLOW RATE After the sensors checking, air flow checking were done in order to ensure the air quality (fresh air flow rate) and quantity in the occupancy zone can meet design criterion. Air flow checking includes two items: air flow rate and air flow direction. For all the major air handling units, air flow rate were examined by measuring the air velocity at the exhaust duct of air handling unit. The testing conditions are: fully fresh air; different fan speed. The measuring results were compared with nominal value. The errors are within 10%. For the air handling units which are connected with plenums, the behaviour of air distribution system and characteristics of air dampers were studied. The schematic diagram of a group of plenums is shown in Figure 5. In design condition, the pressure inside the fresh air plenum is controlled at -120Pa. The pressure inside the extraction air plenum is controlled at 120Pa.
7

To air handling units
Outside fresh air
From air handling units
To outside
Plenum B Plenum AP= -120Pa P=120Pa
Water loopdf dp
Figure 5. Schematic diagram of plenums
Detailed measurements were made on one air handling unit including pressure, velocity, temperature and humidity. The positions of the measuring points are shown in Figure 6. All these points were chosen as far as possible from elbows in order to ensure precise and consistent definition. • Static pressure measurement All pressures are defined by difference from the atmospheric pressure, chosen as the reference. The precision of the differential pressure measuring equipment is estimated as 10%. • Velocity measurement Three holes were drilled at the same cross section of each duct. The anemometer was continuously displaced through the holes in order to get the average air velocity in about 40 seconds. The precision of velocity measuring equipment is estimated as 10%. • Temperature and humidity measurement "Comfort" probes were used to measure the temperature and humidity inside the duct. The precision of temperature measuring equipment is ± °0 2. C . The precision of relative measuring equipment is ± 2%HR .
Figure 6 The positions of measuring points
8

Pressure, temperature, humidity and velocity were measured in the following situations: • With the air handling unit stopped • With the air handling unit turned on and openings of the fresh air damper varying
from 0 to 100%, with a step of 10%. All the measurements were done after 10 minutes a change was done in order to reach the steady state conditions. The measuring results are shown in Figure 7-9. The following conventions are used: - In point 5, the velocity is positive if the direction of flow rate is towards plenum A. - In point 3, the velocity is positive if the direction of flow rate is towards air handling unit.
-600
-500
-400
-300
-200
-100
0
100
200
300
0* 0 10 20 30 40 50 60 70 80 90 100
Open ratio of fresh air damper (%)
Pres
sure
dro
p (P
a)
P1 P2 P3 P4 P5
Figure 7 Static pressure measurement
-2
0
2
4
6
8
10
0* 0 10 20 30 40 50 60 70 80 90 100
Open ratio of fresh air damper (%)
Vel
ocity
(m/s
)
v2 v3 v4 v5
Figure 8 Velocity measurement
9

5
7
9
11
13
15
17
19
21
23
25
0* 0 10 20 30 40 50 60 70 80 90 100Open ratio of fresh air damper (%)
Tem
pera
ture
(°C
)
T2 T3 T4 T5
Figure 9 Temperature measurement
For fresh air, from pressure (Figure 7) and temperature (Figure 9) measurement we can identify the air flow direction: when the fresh air damper opening ratio is lower than 40%, the direction of flow rate is from AHU towards plenum B (PB1B>PB3B,tB3B tB5B). When opening ratio of fresh air damper overpasses 50%, the direction of flow rate was from plenum B to AHU ( tB3B=tBBB,PB1B<PB3B). In the first case, the supply air temperature sensor can not give the real air temperature. Also it must be noticed that the fresh air flow rate is not proportional to the opening ratio of fresh air damper VBfreshB: . The law of identified on the basis of measuring results will be used to determine the mixing air temperature and humidity in equipment simulation (Section 7).
≈
&Vfresh
&V KVfresh fresh≠&V KVfresh fresh=
5. WATER FLOW RATE AND TEMPERATURE The information available on water side is only the manufacturer’s data in nominal condition. Due to the difficulty of direct water flow rate measurement, the real water flow rate is deduced from air side measuring results and heat balance. A series of measurements were made on 7 major cooling coils in the general secretariat building. The systematic diagram of these 7 AHU is shown in Figure 2. The tests were made with the following conditions: • The air handling units were working in remote control mode • Air bypass dampers were completely closed • Water valves of cooling coils were fully open • Supply and exhaust fans were working at the first speed ( nominal speed) • The heating coil and humidifier were not used The following variables were measured: • Air temperature and relative humidity at the supply of AHU: tBsuB, φBsuB • Air temperature and relative humidity at the exhaust of AHU (after the fan): tBexB,
φBexB • Water supply and exhaust temperature of cooling coil: tBwsuB, tBwexB
10

The air side temperature and humidity were measured by introducing a probe inside the duct. The water temperature were measured by introducing a contact probe inside the glove finger available. The air flow rate had already been checked.
The supply temperature of AHU is taken as the supply temperature of cooling coil. The exhaust temperature of cooling coil is deduced from the exhaust temperature of air handling unit and the temperature rise due to the heating up through the fan. The heating up effect of the supply fan was measured in advance. The humidity ratio at the supply and exhaust of cooling coil are computed as: wBsuB = f ( tBsuB, φBsuB) wBexB = f ( tBexB, φBexB) In some tests, the cooling coil are working in wet regime. But the latent load is very small, it is almost impossible to measure the condensed water. The working regime of cooling coil will be determined in the following manner: • The error of water content calculation due to the precision of temperature and
humidity measuring equipment are estimated. The possible maximum and minimum value are calculated as:
wBmaxB = f ( t + 0.2°C, φ+2%HR ) wBminB = f ( t - 0.2°C, φ - 2%HR )
• If min (C1,C2) ≥ 0.5, the cooling coil is working in dry regime. Otherwise the cooling coil is working in wet regime.
Where: C
w ww w
Cw ww w
ex su
ex ex
ex su
su su
1
2
=−−
=−−
,max ,min
,max ,min
,max ,min
,max ,min
• If the cooling coil is determined to work in dry regime, the mean value of wBsu Band wBexB will be used in further calculation.
The real water flow rate is deduced from heat balance on air side and water side. For simplicity reason, the heat loss due to the condensed water ( ( )= −& 'M w w c ta su ex w ex ) are neglected in wet regime. The calculation results show that for all the seven air handling units, when the water valve of cooling coil is completely open, the real water flow rate is much higher than the nominal value:
1.4Mw,nom < Mw < 2Mw,nom It means that in real operating mode, these cooling coils may have better performance due to the high water flow rate supply. Since not enough information was available to study the hydraulic characteristics of cold water network, further checking of water flow rate distribution were not performed. The measuring results of water supply temperature of these seven cooling coils ( by introducing contact probe in pocket temperature available) are compared with exhaust temperature of heat exchangers in cooling plant ( data acquisition system). The differences are within 1K. In the following study, we will suppose
11

the water supply temperature of cooling coils are equal to the water exhaust temperature of heat exchangers. The method of water flow rate and temperature checking on cooling coils will be transposed to heating coils and humidifiers. This part of work is being done for the moment. 6. MODELLING AND SIMULATION 6-1. Modelling of air distribution system On the basis of on-site measuring results (see Section 4), a simplified model of air distribution system was built (see Figure 10) in order to study the effect of plenum pressure on the behaviour of air distribution system. The characteristic of each component in the model are identified on the basis of measurements.
Group
Va
Va1
Va2
d1
d2
d31
2
P1
P2
PA
PB
Figure 10 Schematic diagram of system model
‘Group’ is a simplified model of air handling unit, air distribution system and exhaust fan. We don’t consider the characteristic of each component separately, instead we treat it as a ‘black box’, described by an equation like: & ( )V f Pa = ∆
The conditions of identification for the ‘ group ’ are: - constant air flow rate ( average between VB4B and VB2B in Figure 6) - constant temperature - ∆P=PB5B-PB1B (see Figure 7) The identification results is given in Figure 11.
12

y = -0.0003x + 1.3695R2 = 0.7722
1.22
1.24
1.26
1.28
1.30
1.32
1.34
1.36
1.38
1.40
0 50 100 150 200 250 300 350 400 450
Pressure drop of group(P5-P1) (Pa)
Air
vol
ume
flow
rat
e of
gro
up (m
3/h)
Figure 11 The identification of Va ~ ∆P for ‘group’
The three dampers d1, d2, d3 represent fresh air damper, exhaust air damper, return air damper. Dampers d1 and d2 are fictitious dampers: they represent the equivalent of the real dampers plus the duct length. Four pressures are considered in identification of three dampers: - Pressure inside plenum A (PBAB) - Pressure inside plenum B (PBBB) - Pressure of mixing air at point 1 (PB1 Bin Figure 6) - Pressure at point 2 (PB2B in Figure 6) The air flow rate passing through a damper is given by:
&maxV f A
Pa A
a= α
ρ2∆
with α - flow coefficient ABmax B- the maximum flow area of damper [mP
2P]
fBAB - area factor (=0...1) fBAB=0 for damper fully closed fBAB=1 for damper fully opened ρ − density of air [kgmP
-3P]
∆P - pressure drop across the damper [Pa] Each damper is characterised by a certain maximum flow area, a flow coefficient and an evolution of the area factor with the opening degree. Consider the structure characteristics of butterfly damper (Figure 12), we can calculate the area factor fBAB.
13

Figure 12 Schematic illustration of area factor calculation For a given damper, the area factor fBAB = (1-cosα). The calculation result of fBAB for exhaust damper are shown in Figure 13.
y = 1.140E-04x2 - 1.685E-03x + 8.268E-02R2 = 9.774E-01
0.00
0.20
0.40
0.60
0.80
1.00
1.20
0.00 10.00 20.00 30.00 40.00 50.00 60.00 70.00 80.00 90.00 100.00
Open ratio of exhaust air damper (%)
fA
measuring result
(1-cos(alfa))
Figure 13 The identification of area factor for the exhaust air damper
It can be seen the characteristics of exhaust air damper is very similar to the ideal butter fly damper. 6-2. Simulation results of air distribution system The following five cases were considered in simulating of air distribution system - PBAB = 0Pa, PBBB = 0Pa - PBAB = 30Pa, PBBB = -30Pa - PBAB = 60Pa, PBBB = -60Pa - PBAB = 120Pa, PBBB = -120Pa - PBAB = 180Pa, PBBB = -180Pa The simulation results of fresh air ratio via fresh air damper opening ratio are shown in Figure 14.
14

-0.20
0.00
0.20
0.40
0.60
0.80
1.00
0 10 20 30 40 50 60 70 80 90 100
Opening ratio of fresh air damper (%)
fres
h ai
r ra
tioPA=0Pa,PB=0PaPA=30Pa,PB=-30PaPA=60Pa, PB=-60PaPA=120Pa, PB=-120PaPA=180Pa, PB=-180Pa
Figure 14 The evolution of fresh air ratio
As can be noticed from Figure 14, the back flow will be encountered even if the pressures inside the two plenums will be kept at the set point values ( -120Pa and 120Pa). The back flow can have negative influence on the quality of air inside the fresh air plenum. when the hygienic probe asks for a certain amount of fresh air, the back flow can’t exist. During a steady state regime, the controllers will open progressively the fresh air damper until the necessary quantity of fresh air is reached. Contrary, the back flow will be encountered in a steady state regime when a manual set point below 42% of fresh air is imposed or the system is working with complete re-circulation. The last situation the leakage is possible due to the leakage of the fresh air damper. If several AHU run with complete re-circulation, the plenum B can be polluted to an unacceptable level. To prevent the back flow several solutions can be considered , among which: • restraint the output range of the controller driven by the hygienic probe from 0 ~
100% to 40 ~ 100%. • change the pressures inside the plenums to 30Pa and -30Pa. For this value, the
leakage will be prevented no matter of the opening degree of the fresh air damper. The first solution will not prevent the backward flow when the system is asked to run with complete re-circulation. Another disadvantage is that the output range of the controller is restrained which renders the control more difficult. 6-3. Modelling of heating coil and cooling coil The classic cross flow heat exchanger model will be applied to the heating coil modelling. There is one parameter to be identified: global heat transfer coefficient AU. Based on the nominal condition given in catalogue, the global heat transfer coefficient AU can be identified. The model of heating coil still need to be validated in the future work. The cooling coil is treated as a classical counter flow heat exchanger. The mathematics description of cooling coil model is well documented in TRANSYS
15

TYPE21. A cooling coil is characterised by three parameters: resistance on air side, resistance on water side and resistance of mental. The following data are given in catalogue: • water and air flow rate • water supply and exhaust temperature • air supply and exhaust dry bulb temperature • air supply and exhaust water contents These information allow us to identify the thermal resistance of cooling coil. If the nominal conditions given in catalogue correspond to a dry regime, only the total thermal resistance R can be identified. In wet regime, the total thermal resistance R and the thermal resistance on air side RBaB can be identified. Air side and water side resistance are identified through the following functions:
( )( )
R c M
R c M
a a
w w
=
=
−
−
1
2
0 5
0 8
&
&
.
.
The metal resistance is usually neglected. In order to validate the cooling coil model, a great deal of on-site measurements were done both in dry and in wet regime on seven major cooling coils in general secretariat building. The test procedure is as shown in Section 5. In dry regime, the errors of simulation results of cooling capacity are within 10%. In wet regime, sometimes bigger errors are encountered. The explanations are: 1. The parameters identified on single point may not reflect the real performance of
cooling coil under a relatively large scale of operating condition. 2. Since water flow rate is deduced from air and water side heat balance, the
precision and error of measurements have important influence on the water flow rate estimation, eventually on cooling capacity estimation.
3. During the tests, the latent load is very low. the condensed water is too small to be weighted. The indirect working regime determination may be imprecise.
Further model validation work still need to be done which will focus on wet working regime combined with condensed water weighting.
6-4. Commissioning test of air handling units On the basis of all the information available ( manufacturer’s data and commissioning results of sensors and single components) and model developed, a global commissioning test on 27 air handling units was done during ice storage system discharging stage. The goal is by using simulation method to predict the cooling power consumption in the whole building. During the test period, the following information given by energy counter were read manually: • cooling power consumption in two buildings, which will be used as reference
to compare with our simulation results • cold water supply temperatures in two buildings • cold water exhaust temperature in two buildings
16

• cold water flow rate in two buildings At the beginning of the test, the cooling power consumption of general secretariat building and conference building given by the energy counter are as followings: in general secretariat building: QBcool B= 0.119MW in conference building: QBcool B= 0.31MW These parts of cooling power are due to the use of fan coils and decentralised units. During the test period, 0.119MW and 0.31MW of cooling power were supposed to remain constant. The air handling units were charged progressively before the discharging stage. The fresh air damper was controlled automatically by air quality in the room. The water valves of preheating coil were completely opened in order to increase the load on cooling coil. The water valves of cooling coils were completely opened except for three cooling coils. During discharging test, the load in the occupancy zone was very stable. Around one hour steady state was encountered in the whole building which is determined by cooling power consumption and cold water temperature (energy counter). The average cooling power consumption in steady state are calculated: in general secretariat building: QBcool B= 0.557MW in conference building: QBcool B= 1.297 MW The cooling power consumption of cooling coils are deduced from the total cooling power consumption and the one due to the fan coils and decentralised units. The simulation process of air handling unit is shown in Figure 15.
Preheatingcoil
Cooingcoil
Postheatingcoil
Exhaustfan
Supplyfan
Ma, tsu, φsu
textr
tex, φex
twsu Mwtwsu Mw twsu Mw
Figure 15 The simulation process of air handling unit
The input variables are determined by the following manners: • Air flow rate For simplicity reason, the air flow rate of CAV system was supposed to be nominal value which may introduce within 10% error on real air flow rate. The air flow rate of VAV system was supposed to be proportional to the indicator of inlet guide vane since the information available don’t allow us to identify the characteristics of the fan.
17

• Water flow rate Since the hot water network is not yet studied, we suppose that when water valve of preheating coil and post-heating coil was fully opened, the water flow rate was equal to the nominal value. For cooling coil, the same supposal is made. By doing so, we underestimate the cooling power consumption in the general secretariat building since the water flow rate investigation shows a higher value than nominal one (see Section 5). When the water valve was not fully opened, the water flow rate is considered to be proportional to the opening of valve since the information available don’t allow us to identify the characteristics of water valves. • Air supply temperature and humidity When fresh air damper was fully open, the supply temperature of air handling unit was supposed to be the supply temperature of preheating coil. When the fresh air damper was partially open, the air supply temperature was determined by the fresh air temperature, extraction temperature, heating up of the exhaust fan and the opening of the fresh air damper:
(t tV
VV
Vt dTsu pre su
fresh freshextr fan ex, ,
&
&
&
&=⎛⎝⎜
⎞⎠⎟ + −
⎛⎝⎜
⎞⎠⎟ +1 )
Where the law of fresh air flow rate ∼ fresh air damper opening obtained on one AHU is transposed to the others. When fresh air damper was fully opened, the supply air humidity ratio of cooling coil was equal to that of AHU. When the fresh air damper was partially open, the supply air humidity ratio of cooling coil was determined by:
w wV
VV
Vwsu pre su
fresh freshextr,
&
&
&
&=⎛⎝⎜
⎞⎠⎟ + −
⎛⎝⎜
⎞⎠⎟1
• Water supply temperature The cold water supply temperature of each air handling unit was supposed to equal to the water temperature measured in the main water pipe (given by counter). The error introduced by this assumption is 1K. The hot water supply temperatures of preheating coil and post heating coil are supposed to be constant all along the discharging test and equal to the water temperature measured in main water pipe. The simulation results of cooling capacity of air handling units are shown in Table 1. Table 1 Simulation results
(MW) Measuring results
(MW) Error (%)
total QBcoolB of cooling coils in SG building 0.340 0.438 -22.4 total QBcoolB of cooling coils in CO building 1.017 0.987 3.0 total QBcoolB of cooling coils 1.357 1.425 -4.8 total QBcoolB in SG building 0.459 0.557 -17.6 total QBcoolB in CO building 1.327 1.297 2.3 total QBcoolB 1.786 1.854 3.7
18
It can be seen that in SG building, the error of cooling power consumption estimation is quite high. It can be explained by the underestimation of cold water flow rate

(nominal water flow rate assumption in simulation). The water exhaust temperature checking also shown that the real water flow rate was higher than the nominal one., during steady state, the average exhaust water temperature in SG building was 10.4°C. The average exhaust water temperature of cooling coils in SG building is 11.4°C. 7. CONTROL REGULATION INVESTIGATION As we mentioned in the previous chapters that good sensors and equipments are two basic factors in acquiring normal performance of air-conditioning system. On the basis of these two factors, good control regulation can largely improve the performance and minimise the energy consumption. One example is shown here after. Figure 16 presents the measuring results of data acquisition system in a typical day in winter time of one air handling unit.
23.4°C28% 16°C
48%
21.9°C33%AQ
23.0°C
t
15%
85%
0%31% 0%
19.9°C
Figure 16. An example of measuring results in winter time The air handling unit is working in steady state. The outside temperature is 2.8°C. The fresh air damper is controlled by air quality in the room. The traditional control of fresh air damper in winter time is imposing a minimum opening ratio(in our case, which is 15%) when the air quality criteria is satisfied. The objective of such a control regulation is to reduce the energy consumption by diminishing the cold air supply. From Figure 16, we can see that with 15% fresh air damper opening, the fresh air is no more supplied to the air handling unit (the supply temperature of AHU reaches ambient temperature). The air handling unit is working with full re-circulation. The cooling coil has to function to diminish the heat load imposed by extraction air plus exhaust fan’s heating up. We purpose that the fresh air damper is used to control room temperature and air quality at the same time instead of only control air quality. The control algorithm of fresh air damper are as follows: VBfresh1B = f(air quality) VBfresh2B = PI (tBroom, BtBsetB) 1. If VBfresh2B >= VBfresh1B, VBfreshB = VBfresh2B 2. If VBfresh2B>= VBfresh1B, VBfreshB = VBfresh1B In case 1, heating and cooling coils can be avoidable;
19

In case 2, heating and cooling coils may be used auxiliarily in order to satisfy the room temperature. As shown in Figure 16, without using cooling and heating equipment, the required exhaust temperature of AHU can be obtained by the following function:
( )t tV
Vt dT
VV
dTex sufresh
extr fan exfresh
fan su=⎛⎝⎜
⎞⎠⎟ + + −
⎛⎝⎜
⎞⎠⎟ +
&
&
&
&, ,1 B
8. CONCLUSIONS In air- conditioning system commissioning stage, the first hand information is manufacturer’s data. The manufacturer’s data shows the design performance of air- conditioning system. Careful on-site investigation was made in order to: 1. ensure all the sensors give reliable results which can be used in the further analysis and simulation. 2. understand the real operating performance of system. Based on all the information acquired, the models of different components were developed which should be calibrated or validated. The models can be used to predict the performance of equipments in any working condition. The further analysis was made to check if the real performance can meet the design criteria. Some problems were found and some practical proposals are given.
20

21
9. NOMENCLUTURES AU - global heat transfer coefficient c - specific heat h - enthalpy NTU - number of heat transfer units t - temperature t’ - wet bulb temperature P - pressure Q - heat flow rate R - thermal resistance v - velocity w - water content Greek: Index: α- flow coefficient a - air δ,∆ - difference A - area ε − effectiveness c - contact φ - relative humidity ex - exhaust ρ - density extr - extraction ϖ - ratio of the capacity flow rates m - metal
w - water f - fictitious 10. ACKNOLEDGEMENTS This work is supported by the general secretariat of European Union and the Wallonie Region. 11. REFERENCES [1] ASHRAE 1989-2 Fundamentals volume, Atlanta, USA [2] ADHRAE 1992-21 Equipment volume, Atlanta, USA [3] CEE-CLIM 1992, Traitement d’air et ventilateurs sous caissons, Brussels, Belgium [3] H.Hu 1996, Analysis of air-conditioning system, Thesis submitted to the requirement for the degree of Master of Applied Science, University of Liège, Belgium [4] J. Lebrun 1995, HVAC system modelling, simulation and commissioning, AN30-950516-01,WD-19, University of Liège, Belgium [5] TRANSYS 14.1, University of Wisconsin - Madison, Belgium


![[XLS]Commissioning Sheets - Air Conditioning · Web viewformula found within installation manual supplied with condenser Total length 7/8" liquid pipe (meters) Electrical Details](https://img.pdfslide.net/doc/110x75/5ad4e1537f8b9a571e8ccb6c/xlscommissioning-sheets-air-viewformula-found-within-installation-manual-supplied.jpg)