Embed Size (px)
Citation preview
Commodity Derivatives Desk, London
April 2007
Strictly Private and Confidential
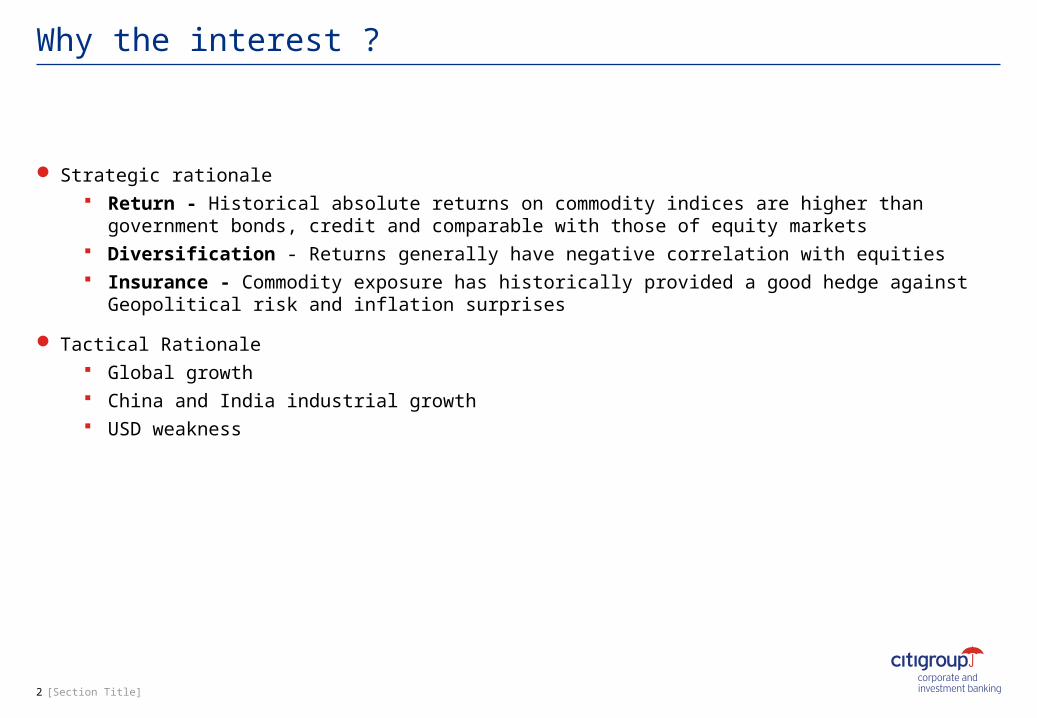
Why the interest ?
Strategic rationale Return - Historical absolute returns on commodity indices are higher than government bonds,
credit and comparable with those of equity markets Diversification - Returns generally have negative correlation with equities Insurance - Commodity exposure has historically provided a good hedge against Geopolitical
risk and inflation surprises
Tactical Rationale Global growth China and India industrial growth USD weakness
2 [Section Title]
Strategic Rationale
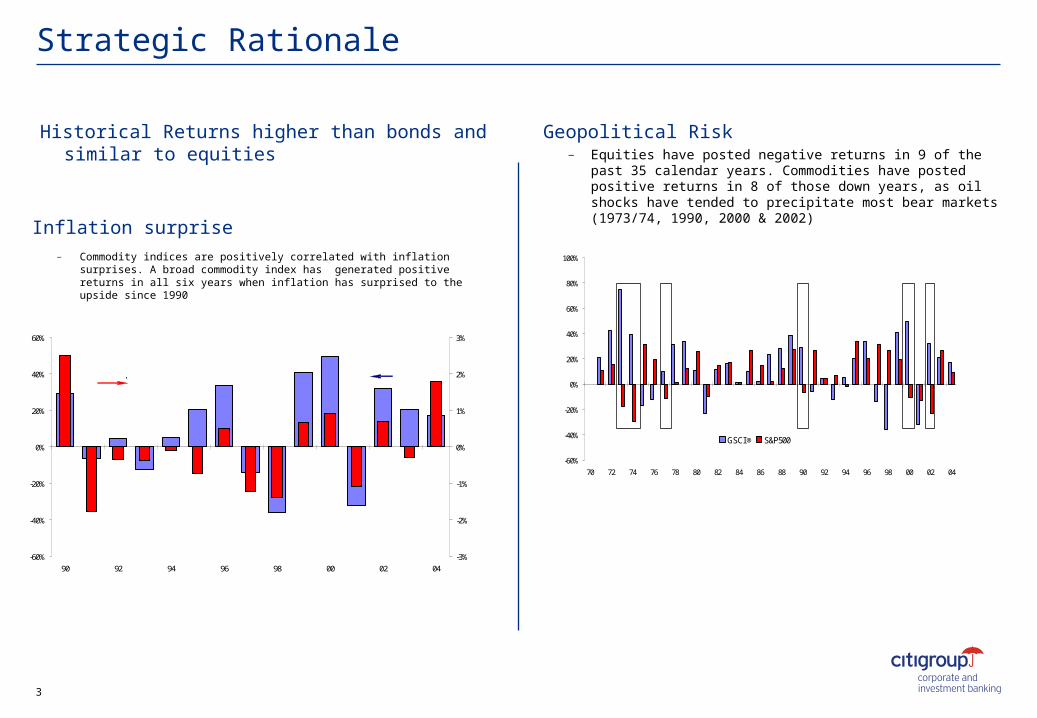
Historical Returns higher than bonds and similar to equities
Geopolitical Risk– Equities have posted negative returns in 9 of the past 35
calendar years. Commodities have posted positive returns in 8 of those down years, as oil shocks have tended to precipitate most bear markets (1973/74, 1990, 2000 & 2002)
Inflation surprise– Commodity indices are positively correlated with inflation surprises. A
broad commodity index has generated positive returns in all six years when inflation has surprised to the upside since 1990
3
-60%
-40%
-20%
0%
20%
40%
60%
80%
100%
70 72 74 76 78 80 82 84 86 88 90 92 94 96 98 00 02 04
GSCI ® S&P500
-60%
-40%
-20%
0%
20%
40%
60%
90 92 94 96 98 00 02 04-3%
-2%
-1%
0%
1%
2%
3%
Inflation surpriseGSCI return
Tactical Rationale
Chinese commodity use as % of world consumption
▲ China accounts for only 10% of global GDP but a much larger share of demand for certain commodities
▲ Industrial metals: 10%-20%
▲ Bulk commodities: 20%-30%
▲ Chinese demand growth is also more rapid than other countries’
Global growth and USD weakness
▲ Industrial metals have exhibited the strongest and most consistent correlation with the global business cycle
▲ Metals’ cyclicality is even stronger than equities’
▲ Energy prices also exhibit some cyclicality, but are strongly influenced by geopolitics
▲ Commodities are generally denominated in USD. A USD depreciation makes commodities cheaper for non US based investors/consumers and should attract more demand. Therefore commodities tend to be negatively correlated with the USD. Gold in particular has a strong negative correlation with the USD
4 [Section Title]
Specific market drivers: Energy
Oil Demand
Macro Economy– Sectoral trends – are growth sector energy
intensive?– Power generation trends – what kind of fuel
does new generation use?
– Transportation trends – number and type of cars sold?
– Tax and subsidy regimes – distort price signals to consumers and affect their consumption behavior
Weather, seasonality – winter heating demand, summer cooling demand, holidays, vacation and travel trends
Non-oil fuel markets, substitution (e.g. gas, coal, hydro, nuclear)
Misc. events – e.g. SARS, Sep. 11
Other
Deals associated with mergers/ acquisitions
Speculative flows
5 [Section Title]
Oil Supply
Upstream investment – capacity additions? Cost? Location? Type of crude?
Natural decline rates – Field age, field maintenance, geological makeup
Geopolitics
Field maintenance, unplanned outages
Weather (e.g. hurricanes)
OPEC decisions and politics – internal politics, spare capacity, relationships with consumer countries
Distribution
Seaborne disruptions – weather, traffic, accidents
Tanker supply/demand/rates
Port capacity, availability
Pipeline capacity/nominations
Oil Inventories
Level relative to demand
Level relative to long term trend and normal seasonality
Regional distribution
Levels at transit points
Crude versus refined product levels
Oil Refining
Refinery capacity/investment
Planned outages, unplanned outages
Refining economics, run rates
Refined product yields
Biggest Producers and world reserves
6 [Section Title]
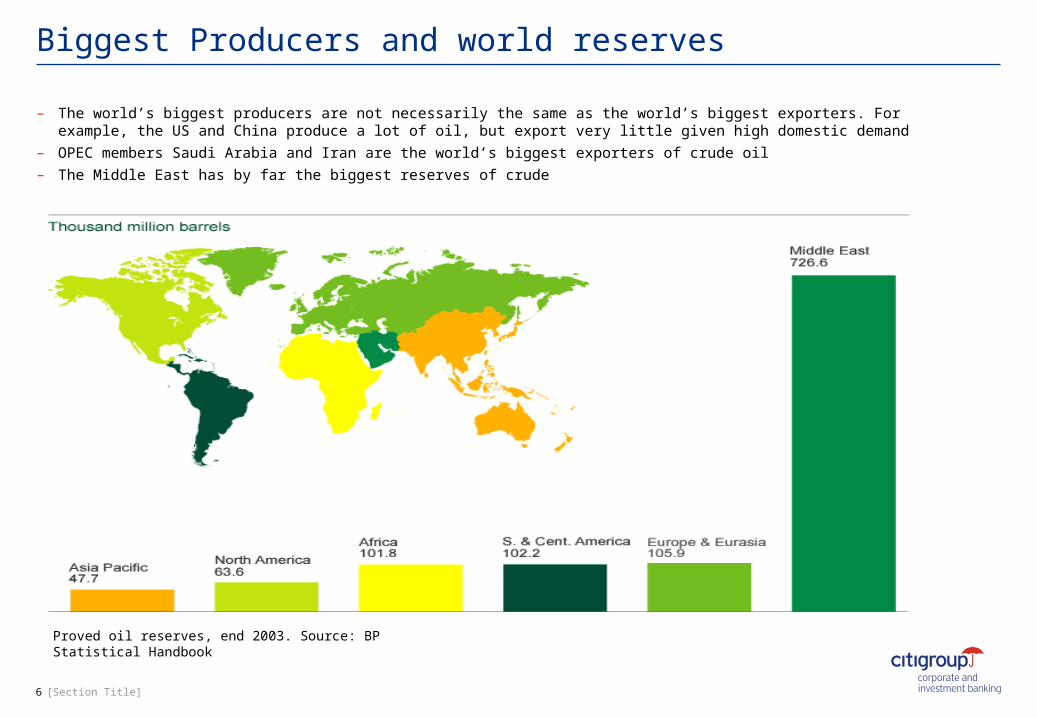
– The world’s biggest producers are not necessarily the same as the world’s biggest exporters. For example, the US and China produce a lot of oil, but export very little given high domestic demand
– OPEC members Saudi Arabia and Iran are the world’s biggest exporters of crude oil– The Middle East has by far the biggest reserves of crude
Proved oil reserves, end 2003. Source: BP Statistical Handbook
So what happened to oil over the past few years
– Tight refining capacity in a strong oil demand environment tops the list of supportive fundamentals
– Infrastructural and distributional constraints also feature prominently
– Speculative investment in energy magnified prices moves
– Potential geopolitical supply-side risks generated market ‘noise’ – Iraq, Venezuela, Nigeria, Lebanon
7 [Section Title]
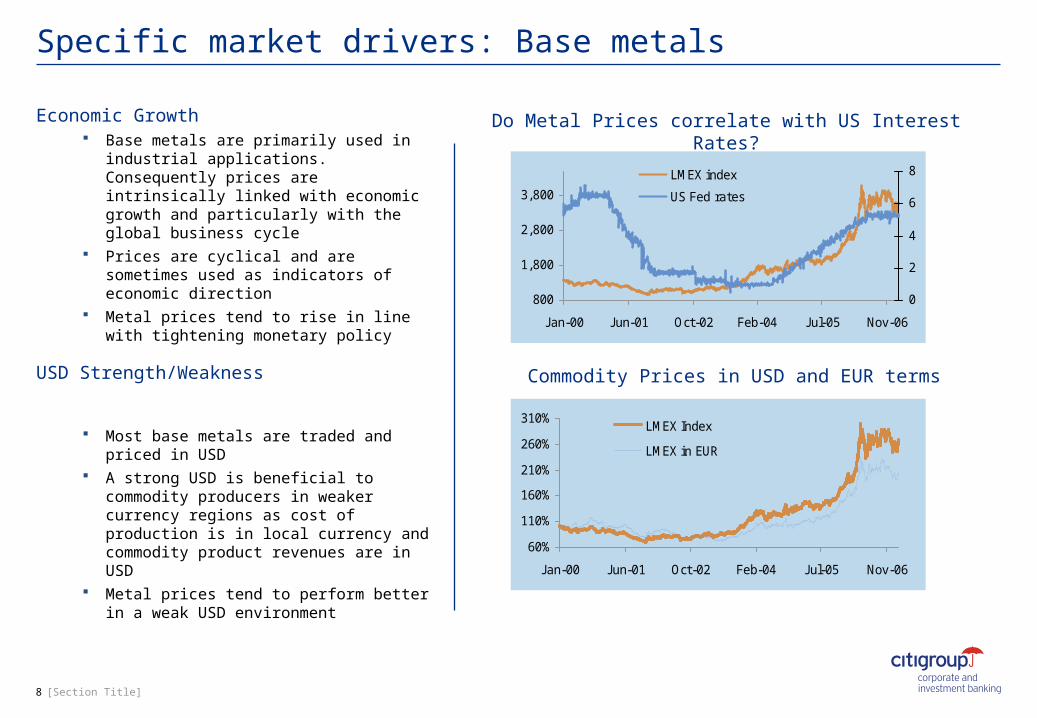
Economic Growth Base metals are primarily used in
industrial applications. Consequently prices are intrinsically linked with economic growth and particularly with the global business cycle
Prices are cyclical and are sometimes used as indicators of economic direction
Metal prices tend to rise in line with tightening monetary policy
USD Strength/Weakness
Most base metals are traded and priced in USD
A strong USD is beneficial to commodity producers in weaker currency regions as cost of production is in local currency and commodity product revenues are in USD
Metal prices tend to perform better in a weak USD environment
Specific market drivers: Base metals
8 [Section Title]
Do Metal Prices correlate with US Interest Rates?
Commodity Prices in USD and EUR terms
800
1,800
2,800
3,800
J an-00 J un-01 Oct-02 Feb-04 J ul-05 Nov-06
0
2
4
6
8LMEX index
US Fed rates
60%
110%
160%
210%
260%
310%
J an-00 J un-01 Oct-02 Feb-04 J ul-05 Nov-06
LMEX Index
LMEX in EUR
Base metals inventories
9 [Section Title]
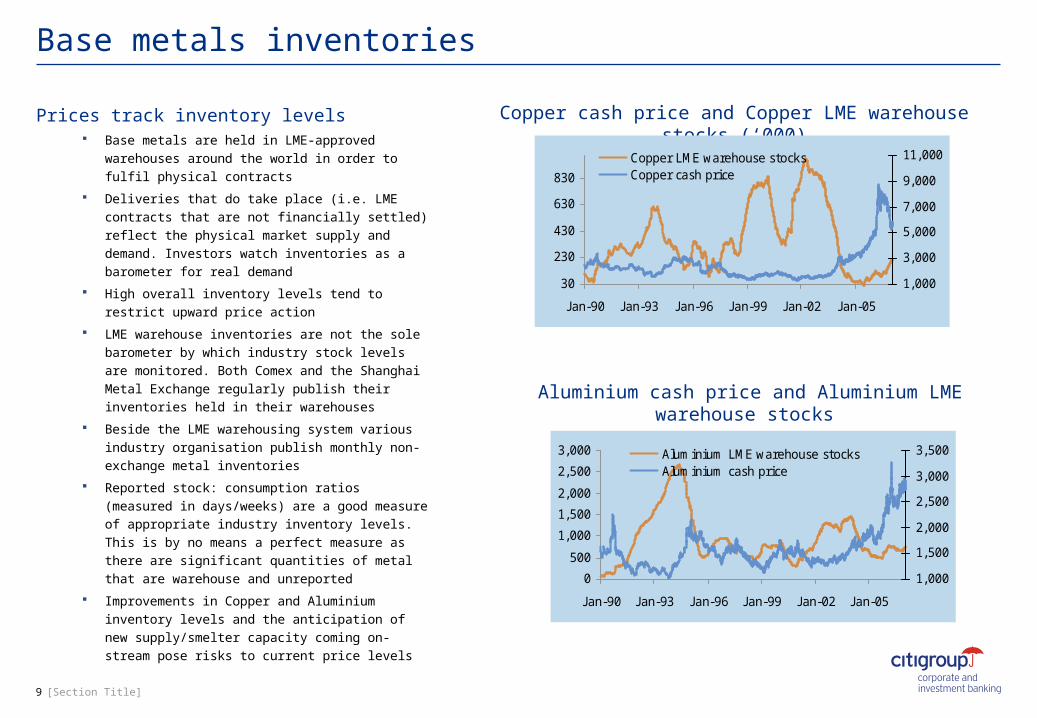
Prices track inventory levels Base metals are held in LME-approved
warehouses around the world in order to fulfil physical contracts
Deliveries that do take place (i.e. LME contracts that are not financially settled) reflect the physical market supply and demand. Investors watch inventories as a barometer for real demand
High overall inventory levels tend to restrict upward price action
LME warehouse inventories are not the sole barometer by which industry stock levels are monitored. Both Comex and the Shanghai Metal Exchange regularly publish their inventories held in their warehouses
Beside the LME warehousing system various industry organisation publish monthly non-exchange metal inventories
Reported stock: consumption ratios (measured in days/weeks) are a good measure of appropriate industry inventory levels. This is by no means a perfect measure as there are significant quantities of metal that are warehouse and unreported
Improvements in Copper and Aluminium inventory levels and the anticipation of new supply/smelter capacity coming on-stream pose risks to current price levels
Copper cash price and Copper LME warehouse stocks (‘000)
Aluminium cash price and Aluminium LME warehouse stocks
30
230
430
630
830
J an-90 J an-93 J an-96 J an-99 J an-02 J an-05
1,000
3,000
5,000
7,000
9,000
11,000Copper LME warehouse stocksCopper cash price
0
500
1,000
1,500
2,000
2,500
3,000
J an-90 J an-93 J an-96 J an-99 J an-02 J an-05
1,000
1,500
2,000
2,500
3,000
3,500Aluminium LME warehouse stocksAluminium cash price
Supply– Mine output and scrap were the predominant
sources of supply historically Majority of output comes from South Africa,
North America, Australia and China– Hedging / De-Hedging
Gold producers have been reducing their hedge books significantly in the past years driven by industry consolidation and a lower contango (determined by the difference between gold lease rates and LIBOR) which made forward selling less attractive
Producer hedging traditionally was an accelerated source of metal into the spot market, but now producer hedge reductions have added to demand for gold
– Central Banks Central banks sell from or lend reserves as
part of portfolio management 15 Central Banks are signatories to the 2004
Gold Agreement which limits annual sales to 500 tonnes and total sales to 2,500 tonnes in the 5 years to Sep-09
Specific market drivers: Gold
10 [Section Title]
Demand– Fabrication demand
Carat jewellery is dominated by India while Italy is a major manufacturer that sells finished goods to other Western countries
Other fabrication (dentistry, electronics) Gold Bar Hoarding and gold coin sales
– Investor demand Gold has traditionally been viewed as a
“safe haven” asset Recent turmoil in financial markets,
weakening global economies, and geopolitical developments have turned investor interest back to gold
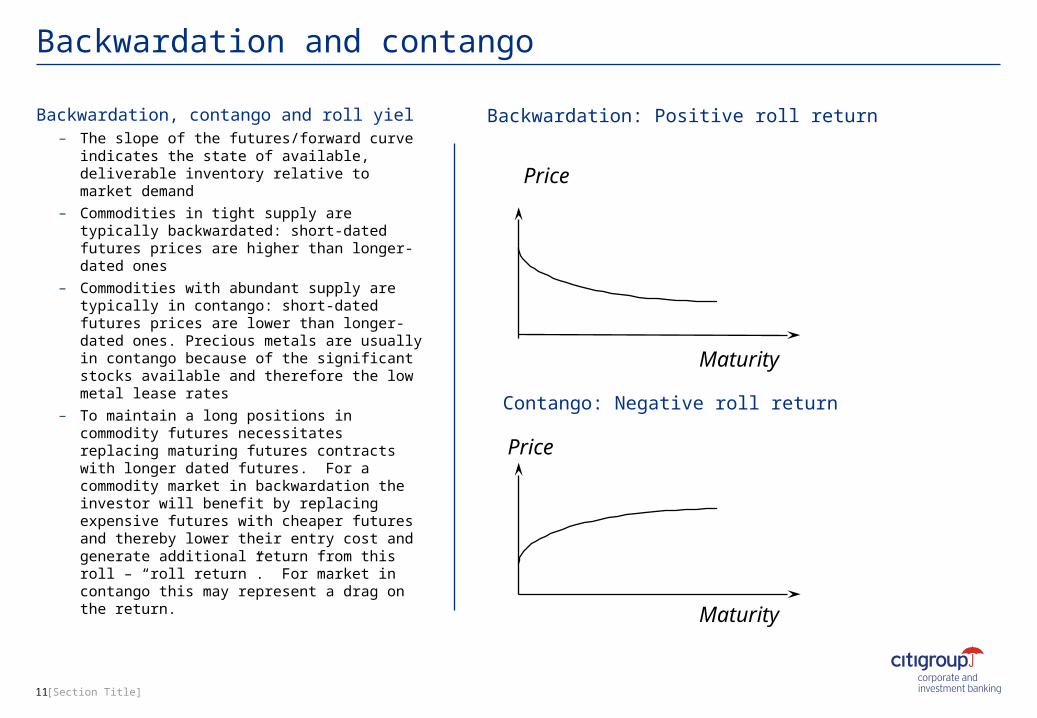
Backwardation, contango and roll yiel– The slope of the futures/forward curve
indicates the state of available, deliverable inventory relative to market demand
– Commodities in tight supply are typically backwardated: short-dated futures prices are higher than longer-dated ones
– Commodities with abundant supply are typically in contango: short-dated futures prices are lower than longer-dated ones. Precious metals are usually in contango because of the significant stocks available and therefore the low metal lease rates
– To maintain a long positions in commodity futures necessitates replacing maturing futures contracts with longer dated futures. For a commodity market in backwardation the investor will benefit by replacing expensive futures with cheaper futures and thereby lower their entry cost and generate additional return from this roll – “roll return”. For market in contango this may represent a drag on the return.
Backwardation and contango
11 [Section Title]
Backwardation: Positive roll return
Contango: Negative roll return
Price
Price
Maturity
Maturity
Current contango and backwardation in metals and energy
12 [Section Title]
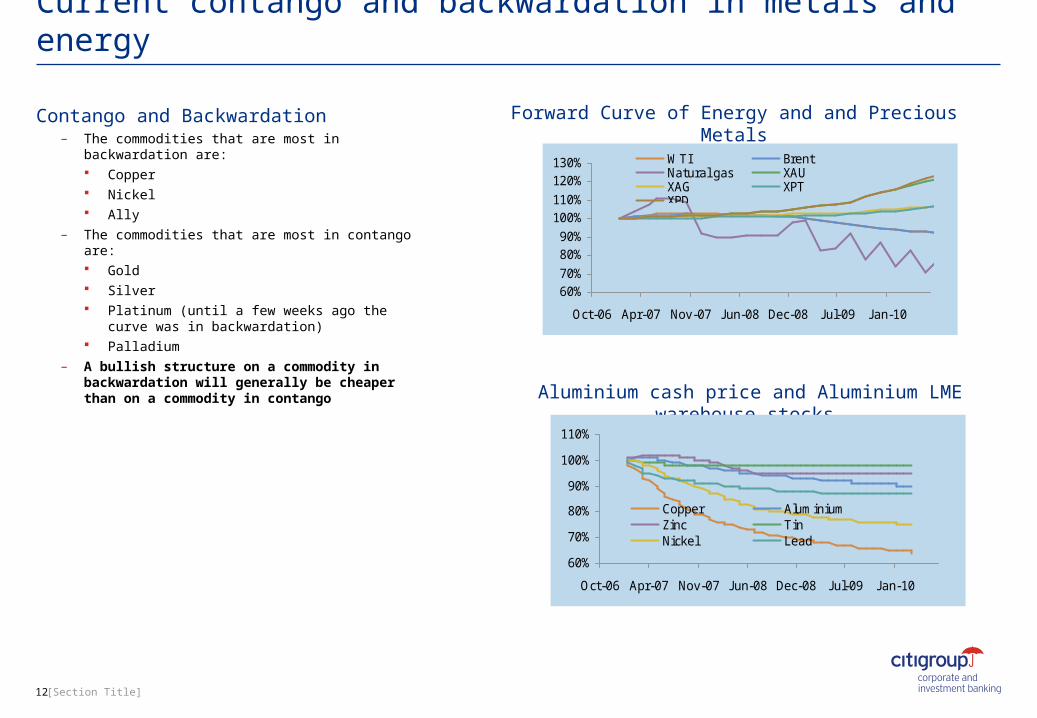
Contango and Backwardation– The commodities that are most in backwardation
are: Copper Nickel Ally
– The commodities that are most in contango are: Gold Silver Platinum (until a few weeks ago the curve was
in backwardation) Palladium
– A bullish structure on a commodity in backwardation will generally be cheaper than on a commodity in contango
Forward Curve of Energy and and Precious Metals
Aluminium cash price and Aluminium LME warehouse stocks
60%70%
80%90%
100%110%
120%130%
Oct-06 Apr-07 Nov-07 J un-08 Dec-08 J ul-09 J an-10
WTI BrentNatural gas XAUXAG XPTXPD
60%
70%
80%
90%
100%
110%
Oct-06 Apr-07 Nov-07 J un-08 Dec-08 J ul-09 J an-10
Copper AluminiumZinc TinNickel Lead
Current volatilities in metals and energy
13 [Section Title]
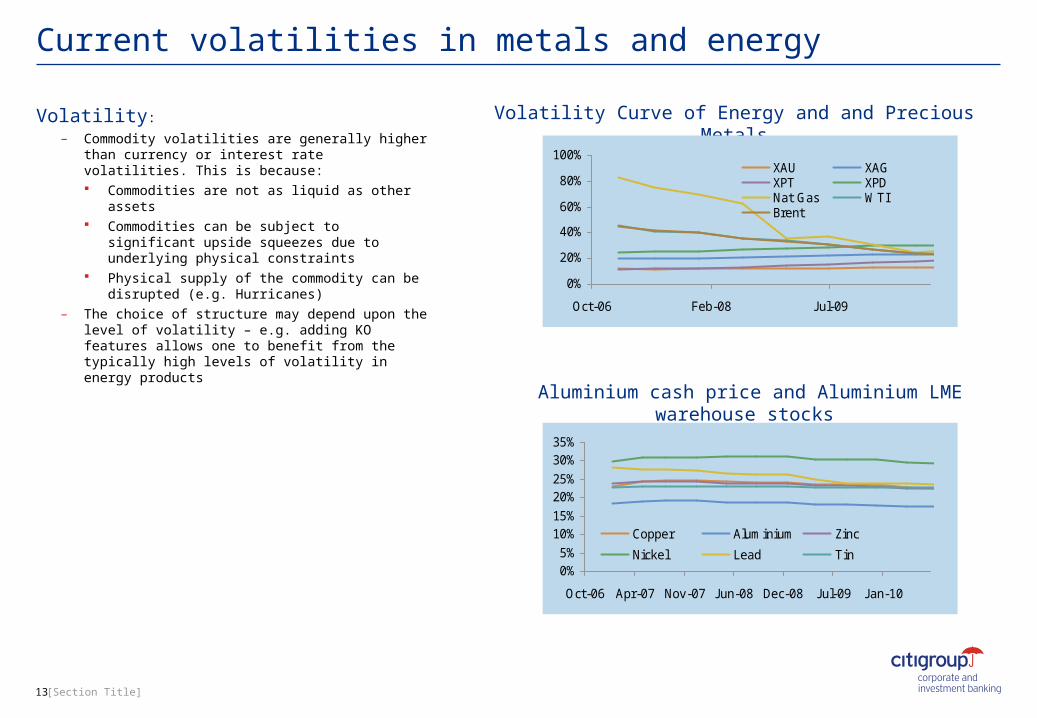
Volatility:
– Commodity volatilities are generally higher than currency or interest rate volatilities. This is because: Commodities are not as liquid as other assets Commodities can be subject to significant
upside squeezes due to underlying physical constraints
Physical supply of the commodity can be disrupted (e.g. Hurricanes)
– The choice of structure may depend upon the level of volatility – e.g. adding KO features allows one to benefit from the typically high levels of volatility in energy products
Volatility Curve of Energy and and Precious Metals
Aluminium cash price and Aluminium LME warehouse stocks
0%
20%
40%
60%
80%
100%
Oct-06 Feb-08 J ul-09
XAU XAGXPT XPDNat Gas WTIBrent
0%5%
10%15%
20%25%
30%35%
Oct-06 Apr-07 Nov-07 J un-08 Dec-08 J ul-09 J an-10
Copper Aluminium Zinc
Nickel Lead Tin
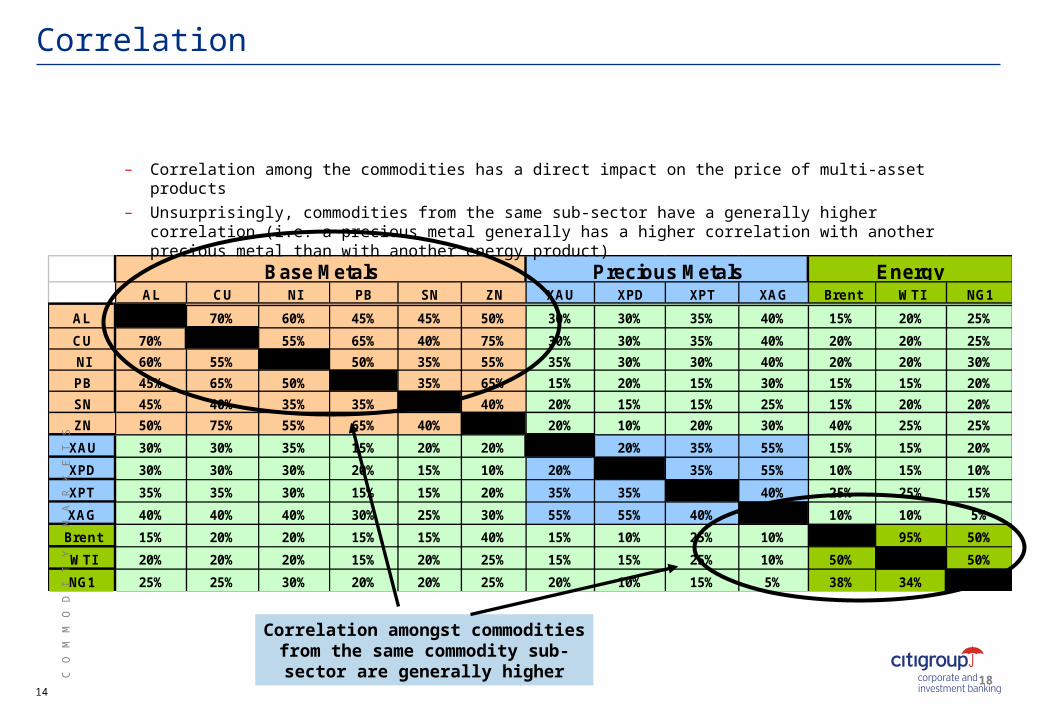
AL CU NI PB SN ZN XAU XPD XPT XAG Brent WTI NG1
AL 70% 60% 45% 45% 50% 30% 30% 35% 40% 15% 20% 25%
CU 70% 55% 65% 40% 75% 30% 30% 35% 40% 20% 20% 25%
NI 60% 55% 50% 35% 55% 35% 30% 30% 40% 20% 20% 30%
PB 45% 65% 50% 35% 65% 15% 20% 15% 30% 15% 15% 20%
SN 45% 40% 35% 35% 40% 20% 15% 15% 25% 15% 20% 20%
ZN 50% 75% 55% 65% 40% 20% 10% 20% 30% 40% 25% 25%
XAU 30% 30% 35% 15% 20% 20% 20% 35% 55% 15% 15% 20%
XPD 30% 30% 30% 20% 15% 10% 20% 35% 55% 10% 15% 10%
XPT 35% 35% 30% 15% 15% 20% 35% 35% 40% 25% 25% 15%
XAG 40% 40% 40% 30% 25% 30% 55% 55% 40% 10% 10% 5%
Brent 15% 20% 20% 15% 15% 40% 15% 10% 25% 10% 95% 50%
WTI 20% 20% 20% 15% 20% 25% 15% 15% 25% 10% 50% 50%
NG1 25% 25% 30% 20% 20% 25% 20% 10% 15% 5% 38% 34%
Base Metals Precious Metals Energy
Correlation
– Correlation among the commodities has a direct impact on the price of multi-asset products
– Unsurprisingly, commodities from the same sub-sector have a generally higher correlation (i.e. a precious metal generally has a higher correlation with another precious metal than with another energy product)
Correlation amongst commodities from the same commodity sub-sector are
generally higher18C
O M
M O
D I
T Y
M A
R K
E T
S
14
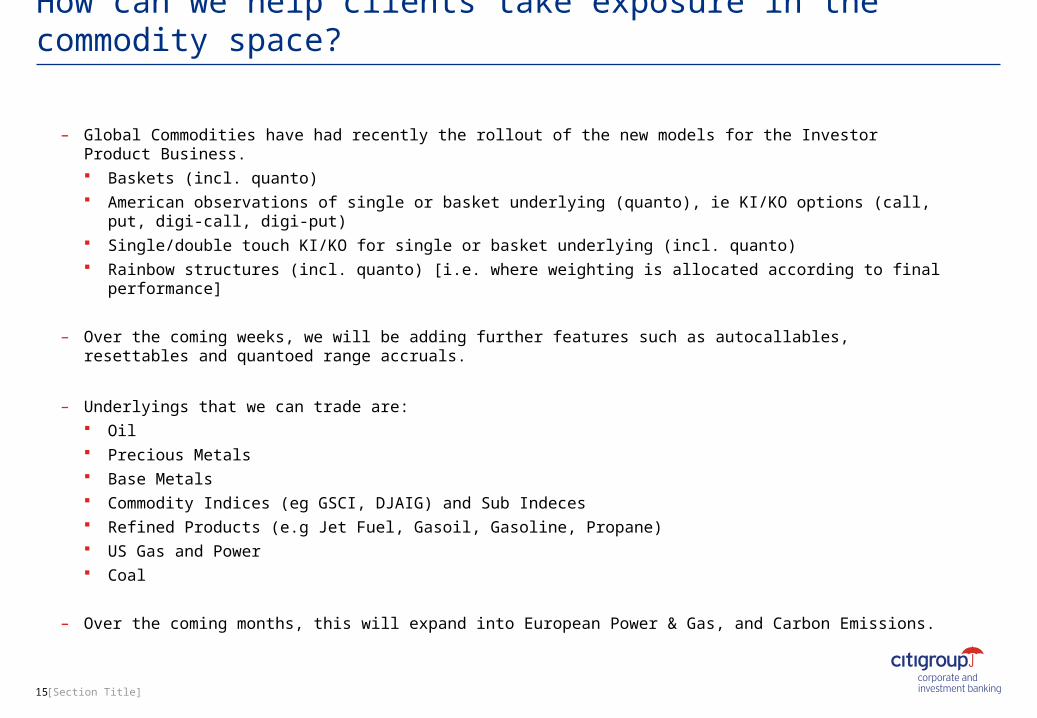
How can we help clients take exposure in the commodity space?
15 [Section Title]
– Global Commodities have had recently the rollout of the new models for the Investor Product Business. Baskets (incl. quanto) American observations of single or basket underlying (quanto), ie KI/KO options (call, put, digi-call, digi-
put) Single/double touch KI/KO for single or basket underlying (incl. quanto) Rainbow structures (incl. quanto) [i.e. where weighting is allocated according to final performance]
– Over the coming weeks, we will be adding further features such as autocallables, resettables and quantoed range accruals.
– Underlyings that we can trade are: Oil Precious Metals Base Metals Commodity Indices (eg GSCI, DJAIG) and Sub Indeces Refined Products (e.g Jet Fuel, Gasoil, Gasoline, Propane) US Gas and Power Coal
– Over the coming months, this will expand into European Power & Gas, and Carbon Emissions.
This material has been prepared by individual sales and/or trading personnel of Citigroup or its subsidiaries or affiliates and not by Citigroup's research department. Citigroup are pleased to present to you the proposed transaction or transactions described herein. All material contained herein, including proposed terms and conditions, are indicative and for discussion purposes only, is strictly confidential, may not be reproduced and is intended for your use only and does not constitute an invitation or offer to subscribe for or purchase any of the products or services mentioned. Finalised terms and conditions are subject to further discussion and negotiation. Information and opinions presented in this material have been obtained or derived from sources believed by Citigroup to be reliable, but Citigroup makes no representation as to their accuracy or completeness. Citigroup accepts no liability for loss (whether direct or consequential) arising from the use of this material. Citigroup does not provide legal, tax or accounting advice; such matters should be discussed with your independent advisors. The ultimate decision to proceed with any transaction rests solely with you. Citigroup is not acting as your advisor or agent. Therefore, prior to entering into any proposed transaction, you should determine, without reliance upon Citigroup or its affiliates, the economic risks and merits, as well as the legal, tax and accounting characterizations and consequences, of the transaction and that you are able to assume these risks. This material is directed exclusively at Citigroup's market professional and institutional investor customers ie market counterparties and intermediate customers as defined by the rules of the Financial Services Authority. It is not intended for private customers and such persons should not rely on this material. Moreover, any investment or service to which this material may relate, will not be made available by Citigroup to such private customers. This document and its contents are proprietary information and products of Citigroup and may not be reproduced or otherwise disseminated in whole or in part without Citigroup’s written consent.
Copyright © Citigroup 2005. All Rights Reserved
Disclaimer