Embed Size (px)
Citation preview
ihs.com
© 2015 IHS
Presentation
IHS
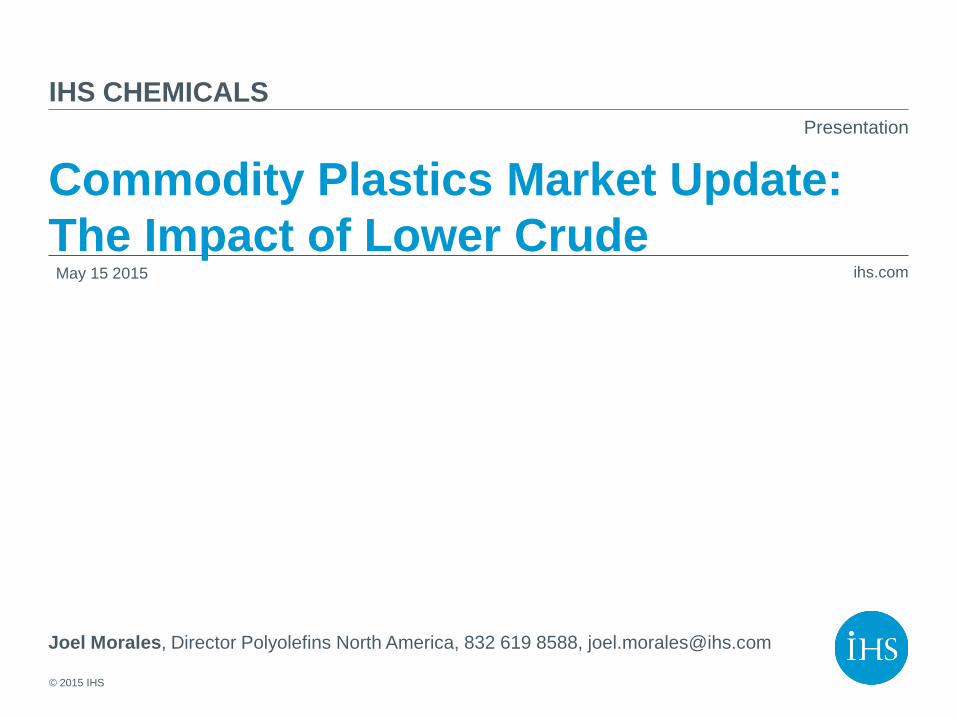
Commodity Plastics Market Update: The Impact of Lower Crude May 15 2015
Joel Morales, Director Polyolefins North America, 832 619 8588, [email protected]
CHEMICALS
© 2015 IHS
Terms of Use
The accompanying materials were prepared by IHS Inc. (IHS Chemical) and are not to be redistributed or reused in any manner without prior written consent, with the exception of client internal distribution as described below.
IHS Chemical strives to be supportive of client internal distribution of IHS Chemical content but requires that:
• IHS Chemical content and information, including but not limited to graphs, charts, tables, figures, and data, are not to be disseminated outside of a client organization to any third party, including a client’s customers, financial institutions, consultants, or the public.
• Content distributed within the client organization must display IHS Chemical’s legal notices and attributions of authorship.
Some information supplied by IHS Chemical may be obtained from sources that IHS Chemical believes to be reliable but are in no way warranted by IHS Chemical as to accuracy or completeness. Absent a specific agreement to the contrary, IHS Chemical has no obligation to update any content or information provided to a client.
Plastics Overview / May 2015
© 2015 IHS
© 2015 IHS
ABOUT IHS CHEMICAL
Plastics Overview / May 2015
© 2015 IHS
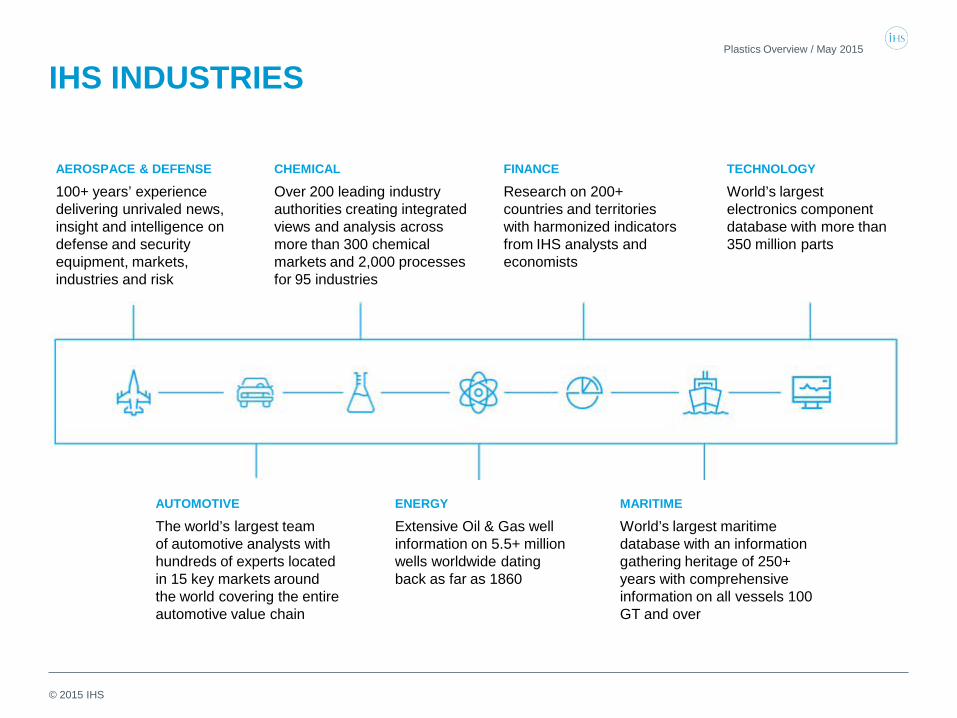
AEROSPACE & DEFENSE
100+ years’ experience delivering unrivaled news, insight and intelligence on defense and security equipment, markets, industries and risk
IHS INDUSTRIES Plastics Overview / May 2015
CHEMICAL
Over 200 leading industry authorities creating integrated views and analysis across more than 300 chemical markets and 2,000 processes for 95 industries
FINANCE
Research on 200+ countries and territories with harmonized indicators from IHS analysts and economists
TECHNOLOGY
World’s largest electronics component database with more than 350 million parts
AUTOMOTIVE
The world’s largest team of automotive analysts with hundreds of experts located in 15 key markets around the world covering the entire automotive value chain
ENERGY
Extensive Oil & Gas well information on 5.5+ million wells worldwide dating back as far as 1860
MARITIME
World’s largest maritime database with an information gathering heritage of 250+ years with comprehensive information on all vessels 100 GT and over
© 2015 IHS
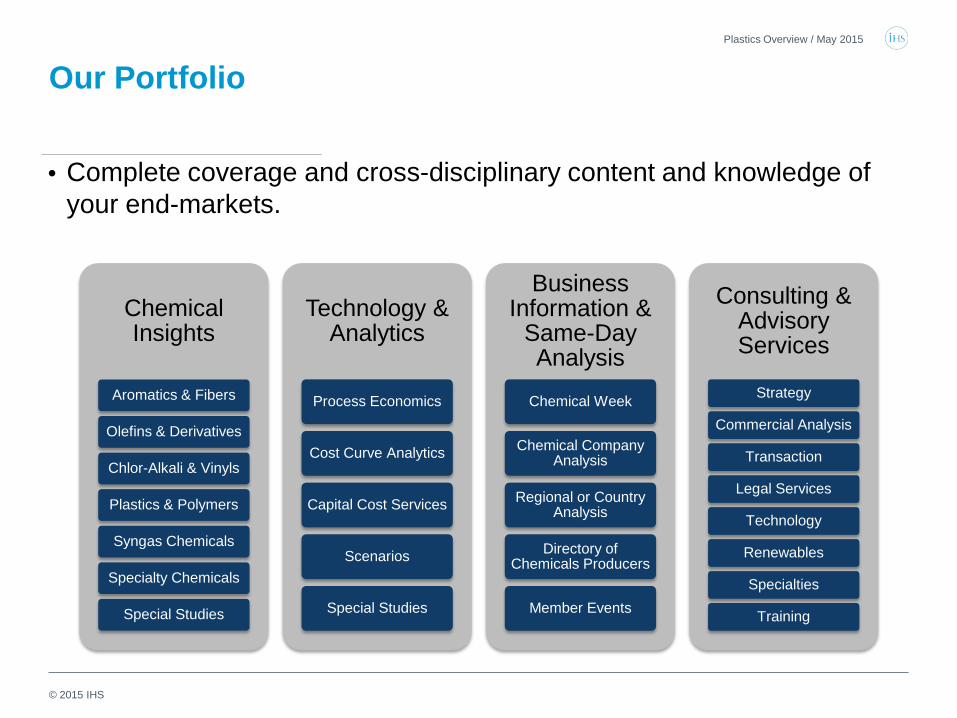
Our Portfolio
• Complete coverage and cross-disciplinary content and knowledge of your end-markets.
Plastics Overview / May 2015
Chemical Insights
Aromatics & Fibers
Olefins & Derivatives
Chlor-Alkali & Vinyls
Plastics & Polymers
Syngas Chemicals
Specialty Chemicals
Special Studies
Technology & Analytics
Process Economics
Cost Curve Analytics
Capital Cost Services
Scenarios
Special Studies
Business Information &
Same-Day Analysis
Chemical Week
Chemical Company Analysis
Regional or Country Analysis
Directory of Chemicals Producers
Member Events
Consulting & Advisory Services
Strategy
Commercial Analysis
Transaction
Legal Services
Technology
Renewables
Specialties
Training
© 2015 IHS
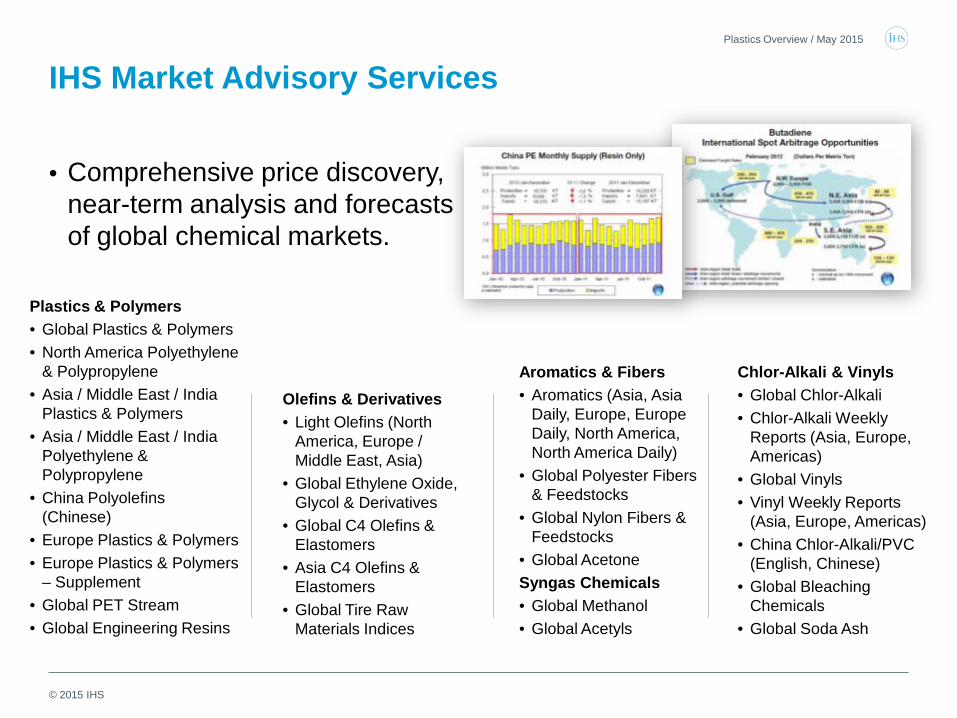
Aromatics & Fibers • Aromatics (Asia, Asia
Daily, Europe, Europe Daily, North America, North America Daily)
• Global Polyester Fibers & Feedstocks
• Global Nylon Fibers & Feedstocks
• Global Acetone Syngas Chemicals • Global Methanol • Global Acetyls
Plastics Overview / May 2015
IHS Market Advisory Services
• Comprehensive price discovery, near-term analysis and forecasts of global chemical markets.
Olefins & Derivatives • Light Olefins (North
America, Europe / Middle East, Asia)
• Global Ethylene Oxide, Glycol & Derivatives
• Global C4 Olefins & Elastomers
• Asia C4 Olefins & Elastomers
• Global Tire Raw Materials Indices
Chlor-Alkali & Vinyls • Global Chlor-Alkali • Chlor-Alkali Weekly
Reports (Asia, Europe, Americas)
• Global Vinyls • Vinyl Weekly Reports
(Asia, Europe, Americas) • China Chlor-Alkali/PVC
(English, Chinese) • Global Bleaching
Chemicals • Global Soda Ash
Plastics & Polymers • Global Plastics & Polymers • North America Polyethylene
& Polypropylene • Asia / Middle East / India
Plastics & Polymers • Asia / Middle East / India
Polyethylene & Polypropylene
• China Polyolefins (Chinese)
• Europe Plastics & Polymers • Europe Plastics & Polymers
– Supplement • Global PET Stream • Global Engineering Resins
© 2015 IHS
Energy Overview
Plastics Overview / May 2015
© 2015 IHS
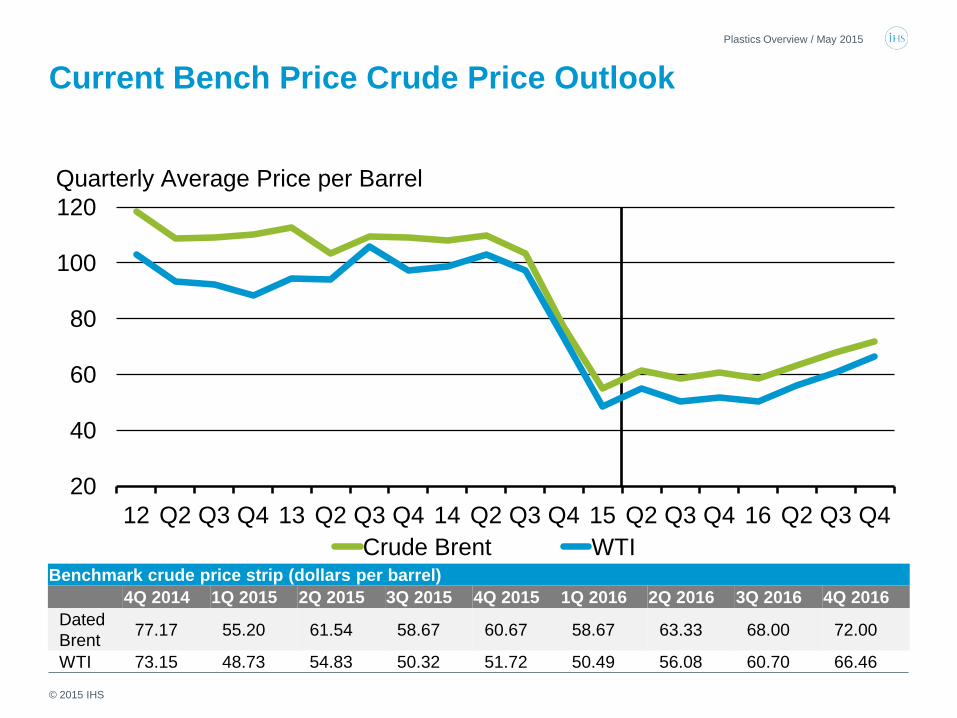
Current Bench Price Crude Price Outlook Plastics Overview / May 2015
Benchmark crude price strip (dollars per barrel) 4Q 2014 1Q 2015 2Q 2015 3Q 2015 4Q 2015 1Q 2016 2Q 2016 3Q 2016 4Q 2016
Dated Brent 77.17 55.20 61.54 58.67 60.67 58.67 63.33 68.00 72.00
WTI 73.15 48.73 54.83 50.32 51.72 50.49 56.08 60.70 66.46
20
40
60
80
100
120
12 Q2 Q3 Q4 13 Q2 Q3 Q4 14 Q2 Q3 Q4 15 Q2 Q3 Q4 16 Q2 Q3 Q4 Crude Brent WTI
Quarterly Average Price per Barrel
© 2015 IHS
Key Messages Regarding Oil Market Dynamics
• The oil price decline that began in June 2014 was triggered by Libya’s production return. However it was the underlying strength of US and non-OPEC supply amid weak global demand that exacerbated the effects.
• OPEC will let markets decide the clearing price for oil for the time being, keeping markets oversupplied.
• US shale oil and gas investment is slowing in 2015, but the impact on production growth will likely be less severe. Companies will ignore poor producing areas and remain focused on high-yield sweet spots.
• Crude oil and refined products demand remains relatively weak. Lower prices may allow an upside surprise but that additional demand will be insufficient to balance the market…this is a supply-side issue.
Plastics Overview / May 2015
© 2015 IHS
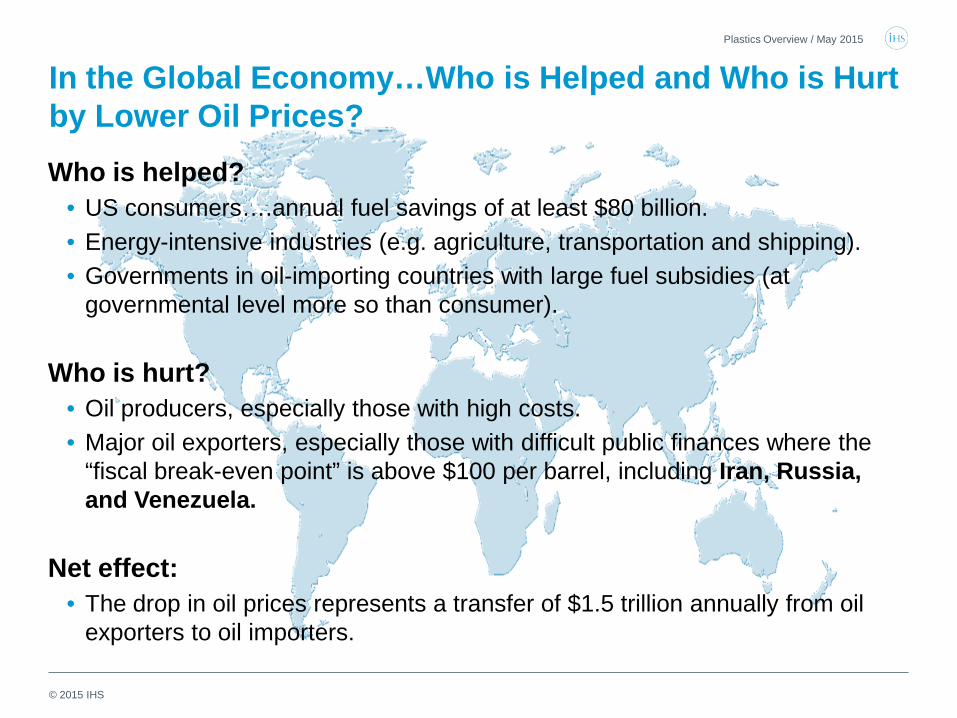
In the Global Economy…Who is Helped and Who is Hurt by Lower Oil Prices? Who is helped?
• US consumers….annual fuel savings of at least $80 billion. • Energy-intensive industries (e.g. agriculture, transportation and shipping). • Governments in oil-importing countries with large fuel subsidies (at
governmental level more so than consumer).
Who is hurt? • Oil producers, especially those with high costs. • Major oil exporters, especially those with difficult public finances where the
“fiscal break-even point” is above $100 per barrel, including Iran, Russia, and Venezuela.
Net effect:
• The drop in oil prices represents a transfer of $1.5 trillion annually from oil exporters to oil importers.
Plastics Overview / May 2015
© 2015 IHS
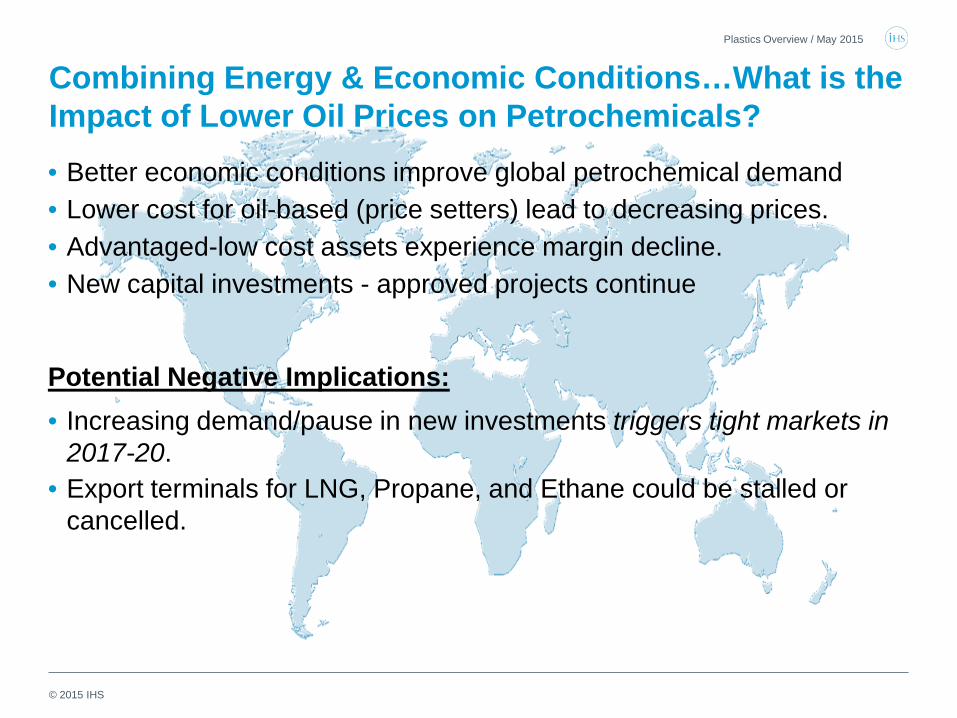
Combining Energy & Economic Conditions…What is the Impact of Lower Oil Prices on Petrochemicals? • Better economic conditions improve global petrochemical demand • Lower cost for oil-based (price setters) lead to decreasing prices. • Advantaged-low cost assets experience margin decline. • New capital investments - approved projects continue
Potential Negative Implications: • Increasing demand/pause in new investments triggers tight markets in
2017-20. • Export terminals for LNG, Propane, and Ethane could be stalled or
cancelled.
Plastics Overview / May 2015
© 2015 IHS
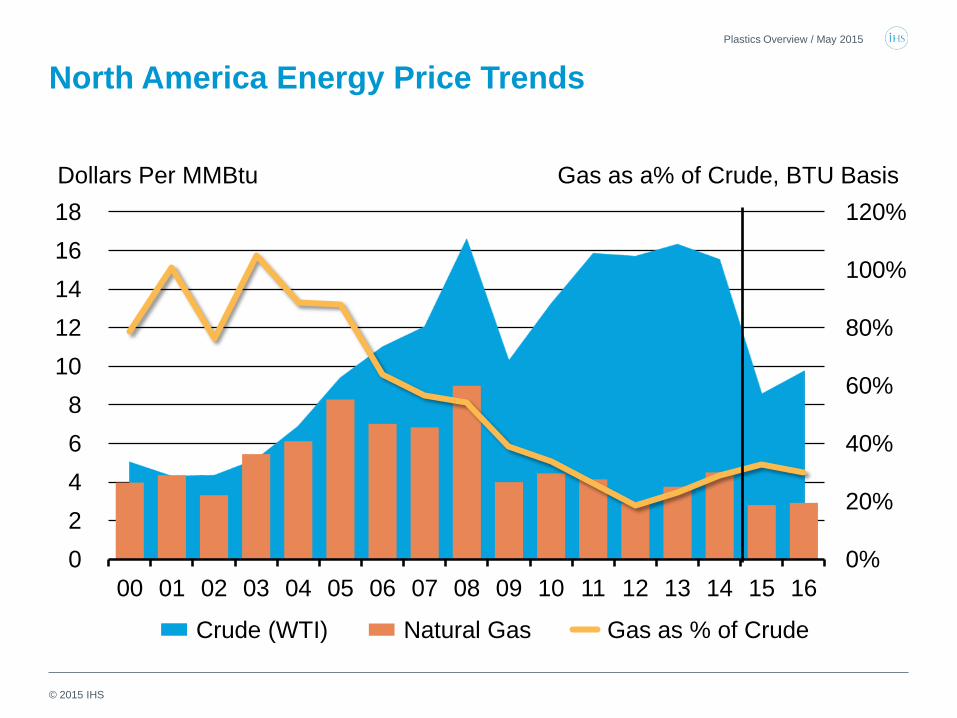
North America Energy Price Trends Plastics Overview / May 2015
0%
20%
40%
60%
80%
100%
120%
0 2 4 6 8
10 12 14 16 18
00 01 02 03 04 05 06 07 08 09 10 11 12 13 14 15 16
Crude (WTI) Natural Gas Gas as % of Crude
Dollars Per MMBtu Gas as a% of Crude, BTU Basis
© 2015 IHS
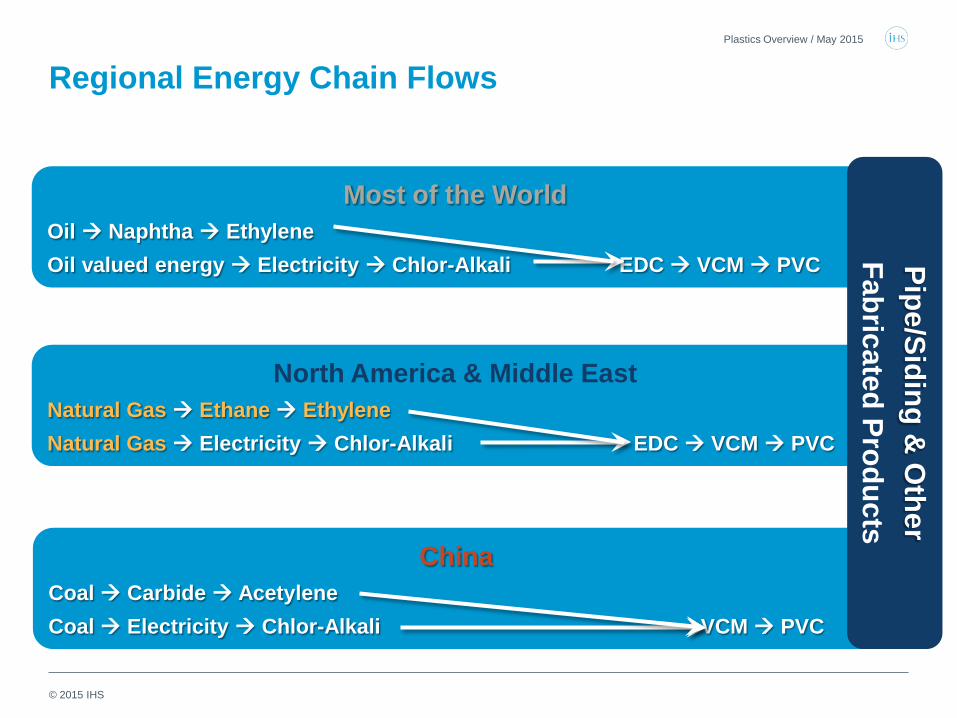
Regional Energy Chain Flows
China Coal Carbide Acetylene Coal Electricity Chlor-Alkali VCM PVC
North America & Middle East Natural Gas Ethane Ethylene Natural Gas Electricity Chlor-Alkali EDC VCM PVC
Most of the World Oil Naphtha Ethylene Oil valued energy Electricity Chlor-Alkali EDC VCM PVC Pipe/Siding &
Other
Fabricated Products
Plastics Overview / May 2015
© 2015 IHS
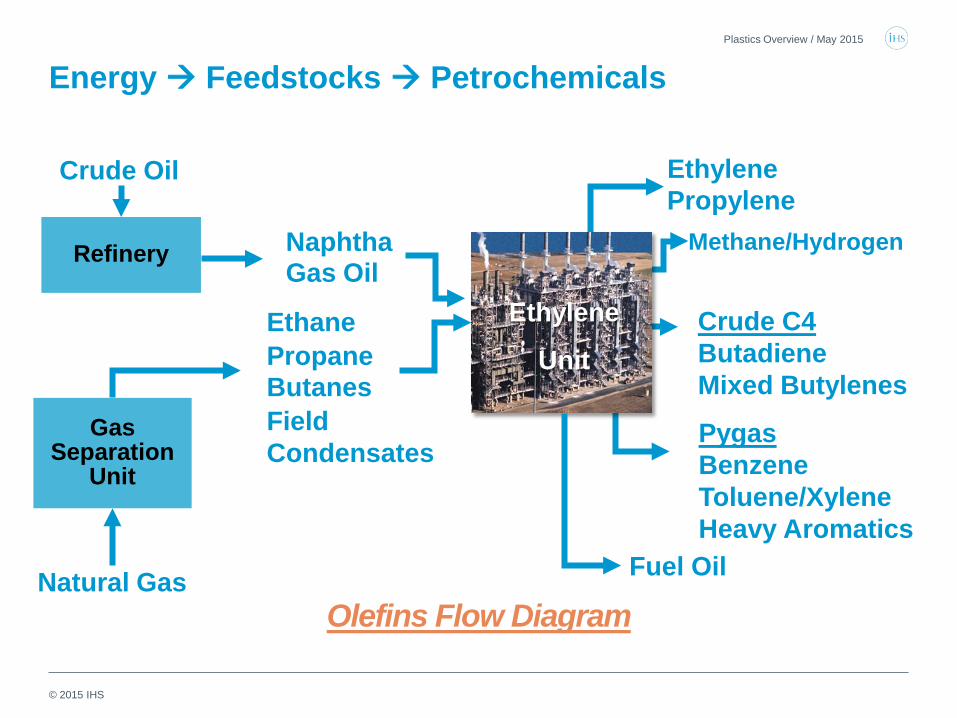
Energy Feedstocks Petrochemicals Plastics Overview / May 2015
Naphtha Gas Oil
Field Condensates
Ethane Propane Butanes
Propylene Ethylene
Fuel Oil
Methane/Hydrogen
Natural Gas
Crude Oil
Refinery
Gas Separation
Unit
Ethylene
Unit
Olefins Flow Diagram
Pygas Benzene Toluene/Xylene Heavy Aromatics
Crude C4 Butadiene Mixed Butylenes
© 2015 IHS
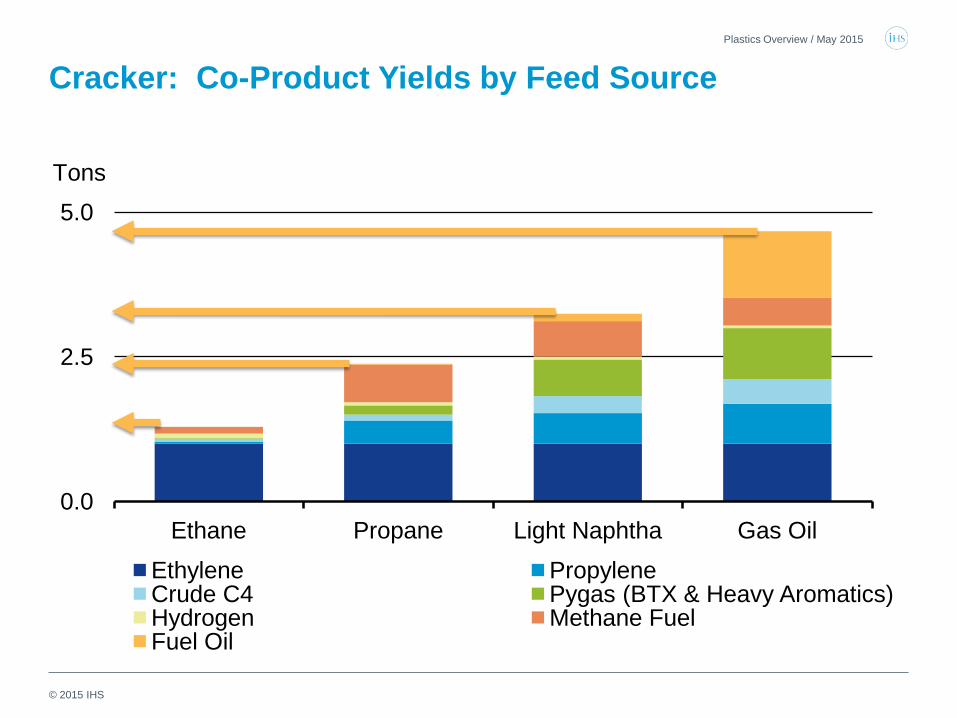
Cracker: Co-Product Yields by Feed Source Plastics Overview / May 2015
0.0
2.5
5.0
Ethane Propane Light Naphtha Gas Oil
Ethylene Propylene Crude C4 Pygas (BTX & Heavy Aromatics) Hydrogen Methane Fuel Fuel Oil
Tons
© 2015 IHS
The US economic expansion will continue • Accelerations in consumer spending and homebuilding, along with
continued robust capital spending, will support growth.
• As the largest net importer of crude oil, the United States is a beneficiary of lower oil prices, but oil industry investment will be cut in 2015.
• Consumers will boost spending in response to declining gasoline prices and gains in employment, real disposable income, and net worth.
• The recovery in homebuilding will gain momentum as labor markets improve and credit standards ease.
• Interest rates will rise significantly over the next three years as monetary accommodation is withdrawn. The petrochemical industry is exposed to a global market.
Plastics Overview / May 2015
© 2015 IHS
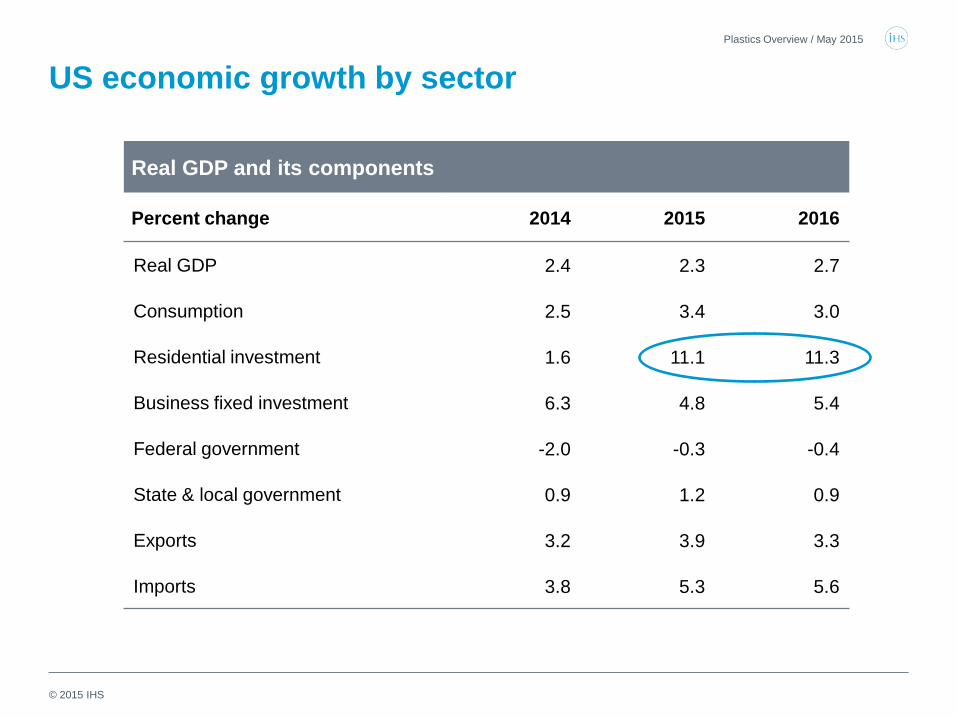
US economic growth by sector
Real GDP and its components
Percent change 2014 2015 2016
Real GDP 2.4 2.3 2.7
Consumption 2.5 3.4 3.0
Residential investment 1.6 11.1 11.3
Business fixed investment 6.3 4.8 5.4
Federal government -2.0 -0.3 -0.4
State & local government 0.9 1.2 0.9
Exports 3.2 3.9 3.3
Imports 3.8 5.3 5.6
Plastics Overview / May 2015
© 2015 IHS
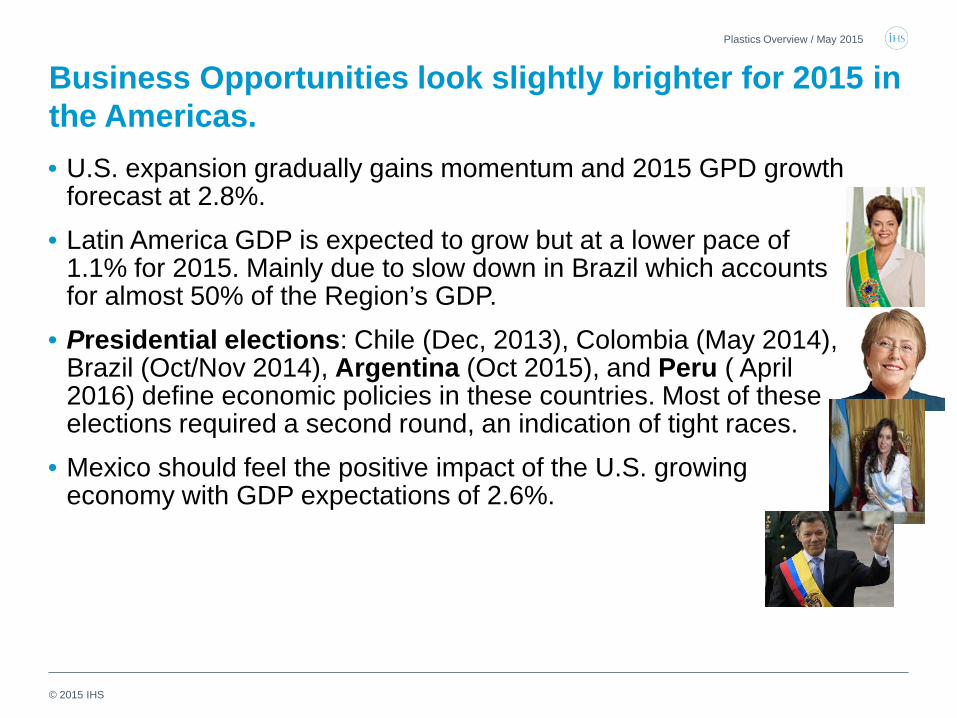
Business Opportunities look slightly brighter for 2015 in the Americas. • U.S. expansion gradually gains momentum and 2015 GPD growth
forecast at 2.8%. • Latin America GDP is expected to grow but at a lower pace of
1.1% for 2015. Mainly due to slow down in Brazil which accounts for almost 50% of the Region’s GDP.
• Presidential elections: Chile (Dec, 2013), Colombia (May 2014), Brazil (Oct/Nov 2014), Argentina (Oct 2015), and Peru ( April 2016) define economic policies in these countries. Most of these elections required a second round, an indication of tight races.
• Mexico should feel the positive impact of the U.S. growing economy with GDP expectations of 2.6%.
Plastics Overview / May 2015
© 2015 IHS
Plastics Overview / May 2015
Polyethylene
© 2015 IHS
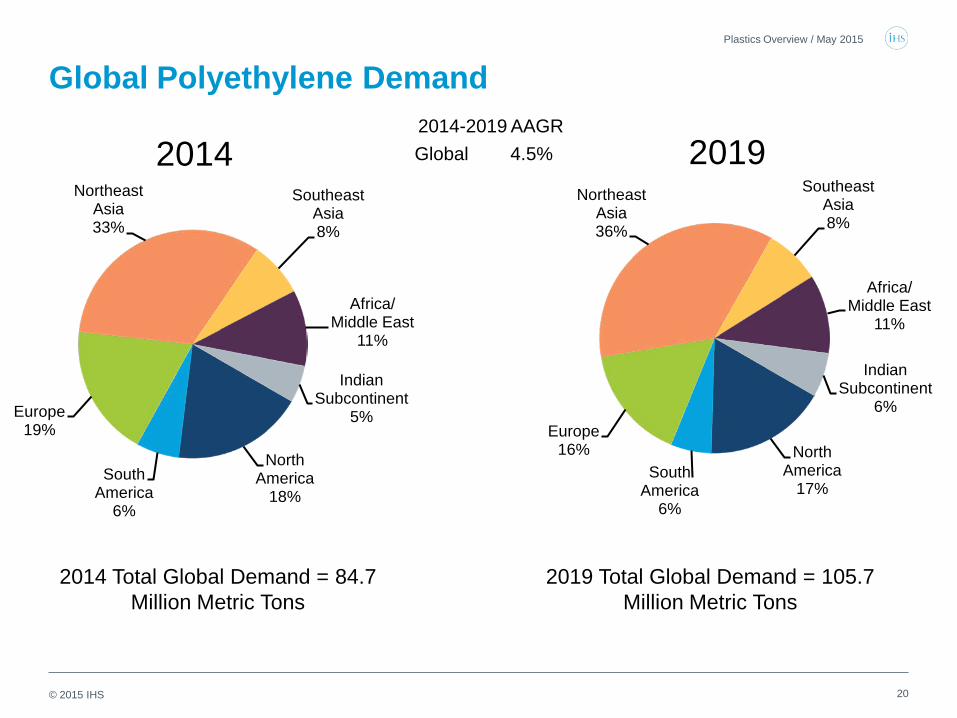
Global Polyethylene Demand
North America
18% South
America 6%
Europe 19%
Northeast Asia 33%
Southeast Asia 8%
Africa/ Middle East
11%
Indian Subcontinent
5%
2014
2014 Total Global Demand = 84.7 Million Metric Tons
2014-2019 AAGR Global 4.5%
2019 Total Global Demand = 105.7 Million Metric Tons
North America
17% South
America 6%
Europe 16%
Northeast Asia 36%
Southeast Asia 8%
Africa/ Middle East
11%
Indian Subcontinent
6%
2019
20
Plastics Overview / May 2015
© 2015 IHS
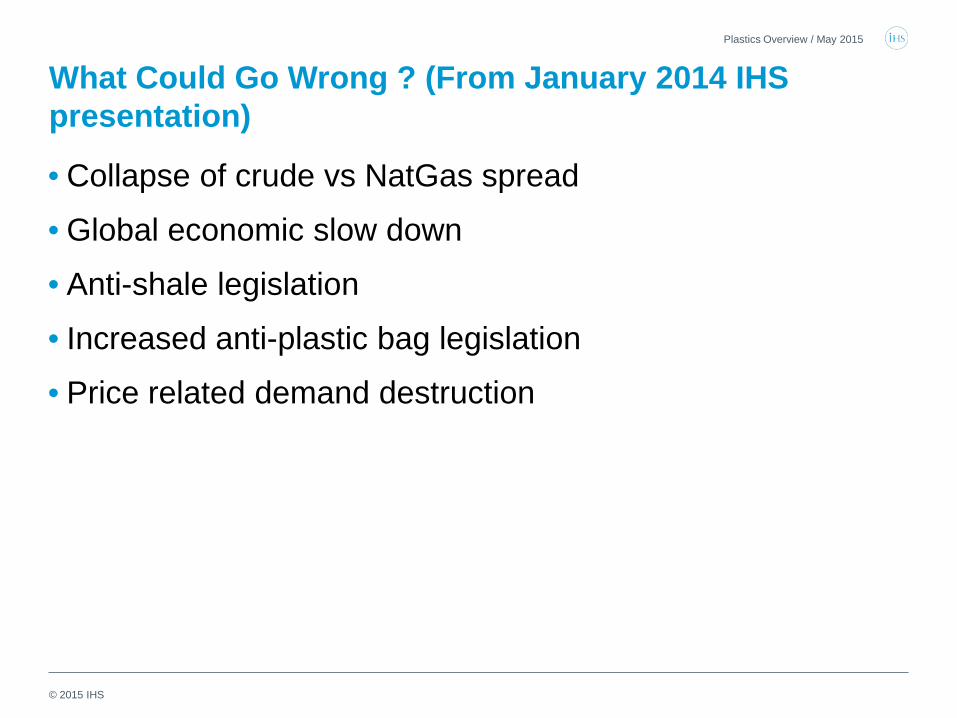
What Could Go Wrong ? (From January 2014 IHS presentation)
• Collapse of crude vs NatGas spread
• Global economic slow down
• Anti-shale legislation
• Increased anti-plastic bag legislation
• Price related demand destruction
Plastics Overview / May 2015
© 2015 IHS
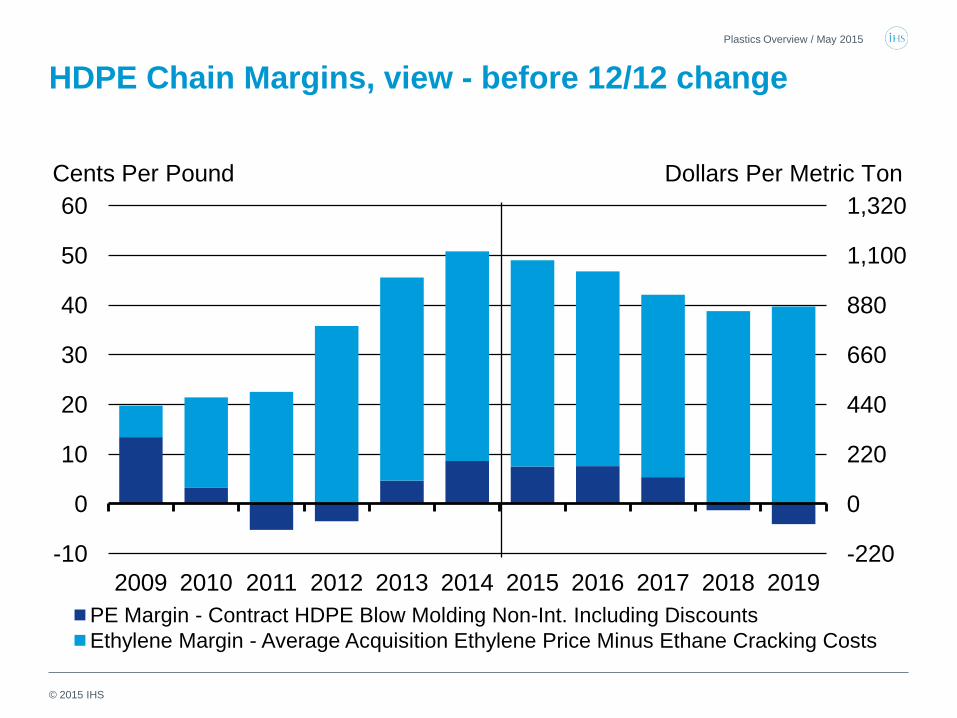
HDPE Chain Margins, view - before 12/12 change Plastics Overview / May 2015
-220
0
220
440
660
880
1,100
1,320
-10
0
10
20
30
40
50
60
2009 2010 2011 2012 2013 2014 2015 2016 2017 2018 2019 PE Margin - Contract HDPE Blow Molding Non-Int. Including Discounts Ethylene Margin - Average Acquisition Ethylene Price Minus Ethane Cracking Costs
Cents Per Pound Dollars Per Metric Ton Dollars Per Metric Ton
© 2015 IHS
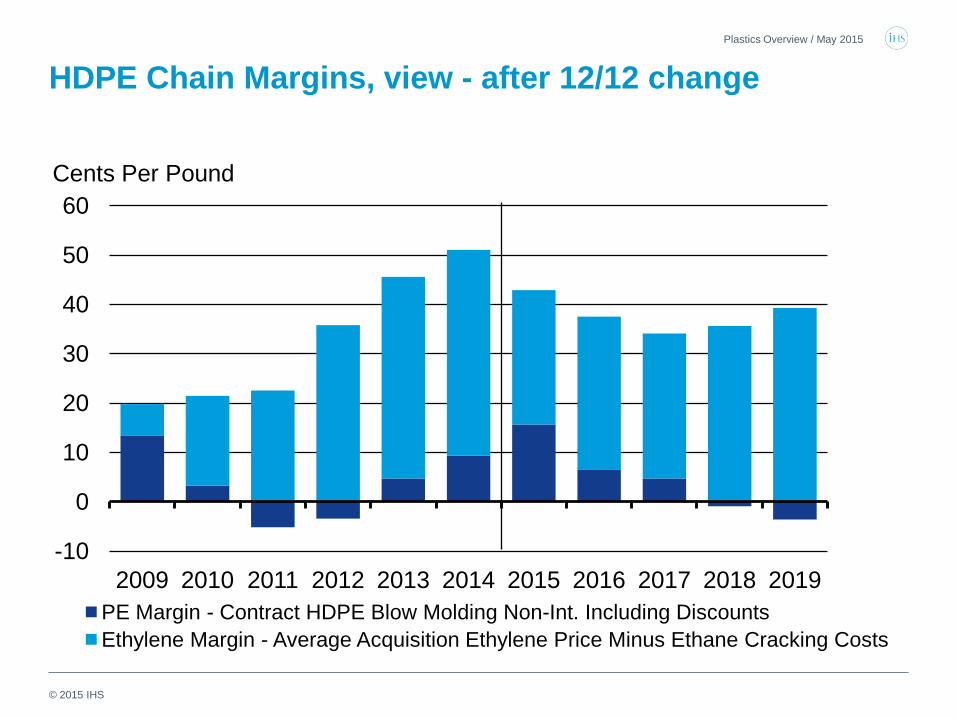
HDPE Chain Margins, view - after 12/12 change Plastics Overview / May 2015
-10
0
10
20
30
40
50
60
2009 2010 2011 2012 2013 2014 2015 2016 2017 2018 2019 PE Margin - Contract HDPE Blow Molding Non-Int. Including Discounts Ethylene Margin - Average Acquisition Ethylene Price Minus Ethane Cracking Costs
Cents Per Pound Dollars Per Metric Ton
© 2015 IHS
0
20
40
60
80
100
Jan-10 Jan-11 Jan-12 Jan-13 Jan-14 Jan-15 Jan-16
NAM Cash Cost, Integrated NAM LLDPE WEP LLDPE CHINA LLDPE (Spot)
Cents Per Pound
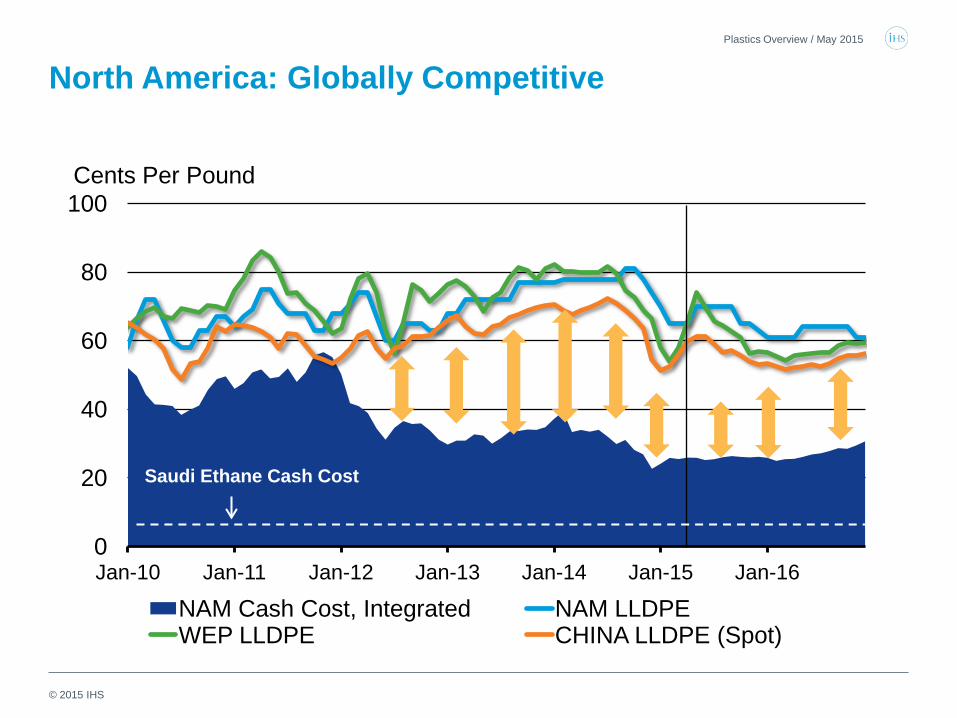
North America: Globally Competitive Plastics Overview / May 2015
Saudi Ethane Cash Cost
© 2015 IHS
2015 Regional PE Forecast Drivers
• Asia prices rebounded after initial declines • Recycle helps set floor, uptick in prime demand likely • Significant restocking after Lunar near year boosted demand
• Continued poor demand in Europe and emerging economies • Europe benefiting from tight supplies, lower Euro and MDE tariffs,
recent closures • Lower crude provides incentives for higher cost producers to run at
higher rates, both in China and Western Europe • Tight supply/demand fundamentals for North America continue into
2015/2016, but global PE price ceiling has been significantly lowered • Elevated arbitrages in 2015/2016 will encourage increased imports of pellets and
finished goods into North America. • Increased incentive to export more product in 2015 with improved supply of existing
assets.
Plastics Overview / May 2015
© 2015 IHS
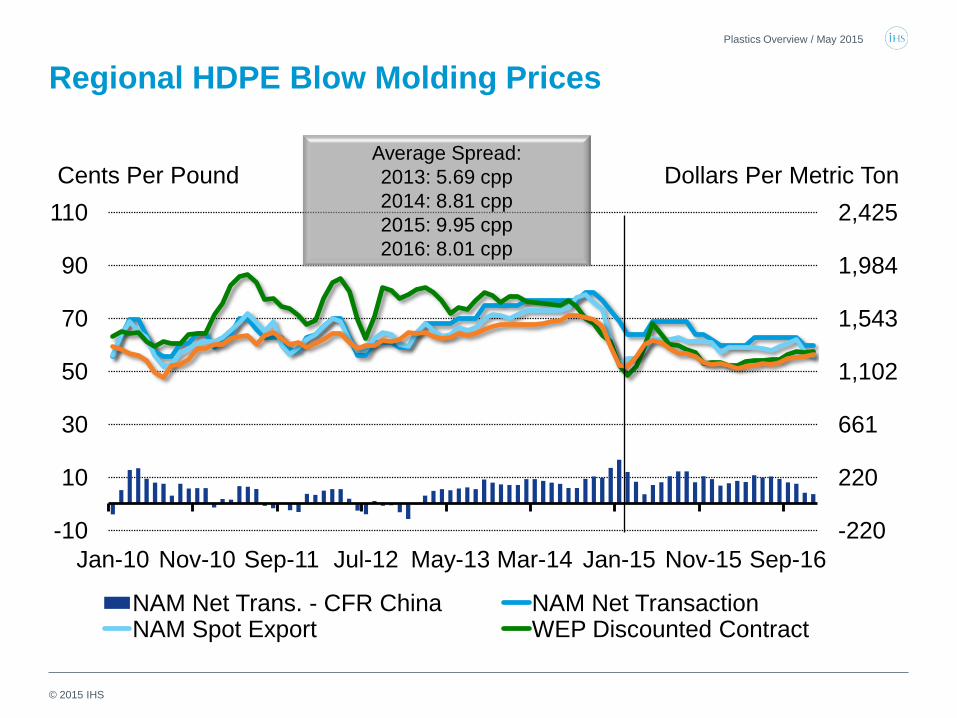
Regional HDPE Blow Molding Prices Plastics Overview / May 2015
-220
220
661
1,102
1,543
1,984
2,425
-10
10
30
50
70
90
110
Jan-10 Nov-10 Sep-11 Jul-12 May-13 Mar-14 Jan-15 Nov-15 Sep-16
NAM Net Trans. - CFR China NAM Net Transaction NAM Spot Export WEP Discounted Contract
Cents Per Pound Dollars Per Metric Ton Average Spread: 2013: 5.69 cpp 2014: 8.81 cpp 2015: 9.95 cpp 2016: 8.01 cpp
© 2015 IHS
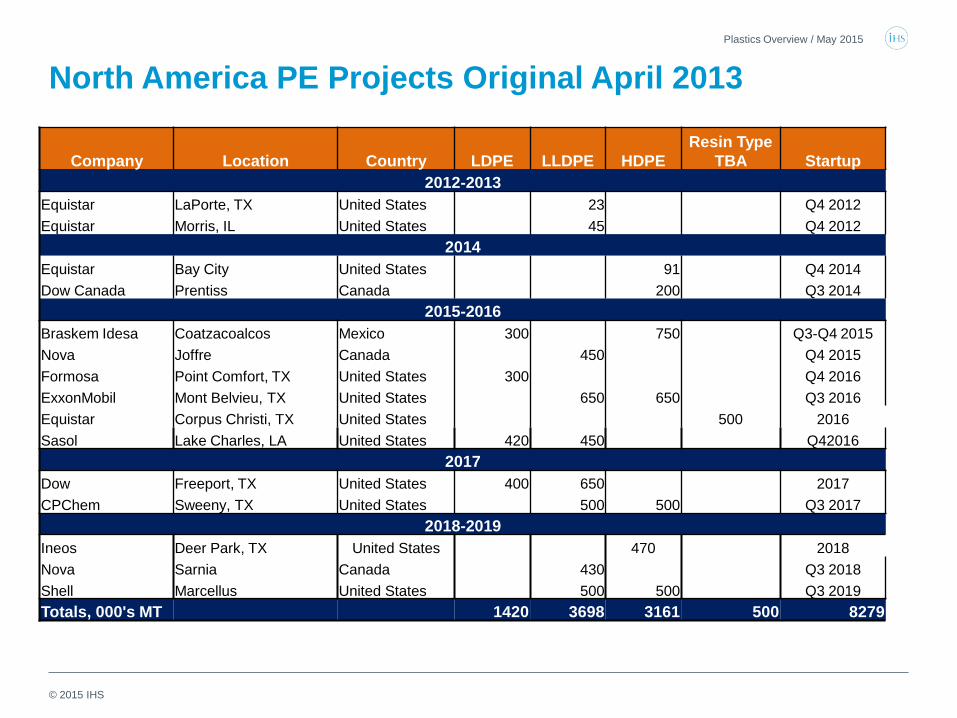
North America PE Projects Original April 2013 Plastics Overview / May 2015
Company Location Country LDPE LLDPE HDPE Resin Type
TBA Startup 2012-2013
Equistar LaPorte, TX United States 23 Q4 2012 Equistar Morris, IL United States 45 Q4 2012
2014 Equistar Bay City United States 91 Q4 2014 Dow Canada Prentiss Canada 200 Q3 2014
2015-2016 Braskem Idesa Coatzacoalcos Mexico 300 750 Q3-Q4 2015 Nova Joffre Canada 450 Q4 2015 Formosa Point Comfort, TX United States 300 Q4 2016 ExxonMobil Mont Belvieu, TX United States 650 650 Q3 2016 Equistar Corpus Christi, TX United States 500 2016 Sasol Lake Charles, LA United States 420 450 Q42016
2017 Dow Freeport, TX United States 400 650 2017 CPChem Sweeny, TX United States 500 500 Q3 2017
2018-2019 Ineos Deer Park, TX United States 470 2018 Nova Sarnia Canada 430 Q3 2018 Shell Marcellus United States 500 500 Q3 2019 Totals, 000's MT 1420 3698 3161 500 8279
© 2015 IHS
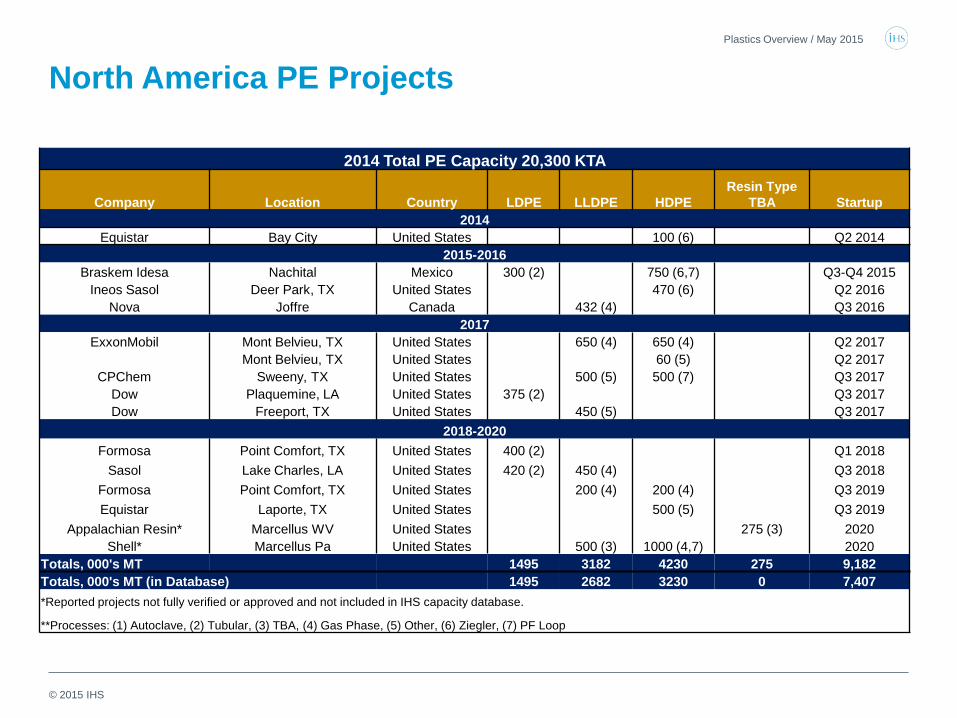
North America PE Projects Plastics Overview / May 2015
2014 Total PE Capacity 20,300 KTA
Company Location Country LDPE LLDPE HDPE Resin Type
TBA Startup 2014
Equistar Bay City United States 100 (6) Q2 2014 2015-2016
Braskem Idesa Nachital Mexico 300 (2) 750 (6,7) Q3-Q4 2015 Ineos Sasol Deer Park, TX United States 470 (6) Q2 2016
Nova Joffre Canada 432 (4) Q3 2016 2017
ExxonMobil Mont Belvieu, TX United States 650 (4) 650 (4) Q2 2017 Mont Belvieu, TX United States 60 (5) Q2 2017
CPChem Sweeny, TX United States 500 (5) 500 (7) Q3 2017 Dow Plaquemine, LA United States 375 (2) Q3 2017 Dow Freeport, TX United States 450 (5) Q3 2017
2018-2020 Formosa Point Comfort, TX United States 400 (2) Q1 2018
Sasol Lake Charles, LA United States 420 (2) 450 (4) Q3 2018 Formosa Point Comfort, TX United States 200 (4) 200 (4) Q3 2019 Equistar Laporte, TX United States 500 (5) Q3 2019
Appalachian Resin* Marcellus WV United States 275 (3) 2020 Shell* Marcellus Pa United States 500 (3) 1000 (4,7) 2020
Totals, 000's MT 1495 3182 4230 275 9,182 Totals, 000's MT (in Database) 1495 2682 3230 0 7,407 *Reported projects not fully verified or approved and not included in IHS capacity database.
**Processes: (1) Autoclave, (2) Tubular, (3) TBA, (4) Gas Phase, (5) Other, (6) Ziegler, (7) PF Loop
© 2015 IHS
-8%
-4%
0%
4%
8%
12%
16%
20%
-4.0
-2.0
0.0
2.0
4.0
6.0
8.0
10.0
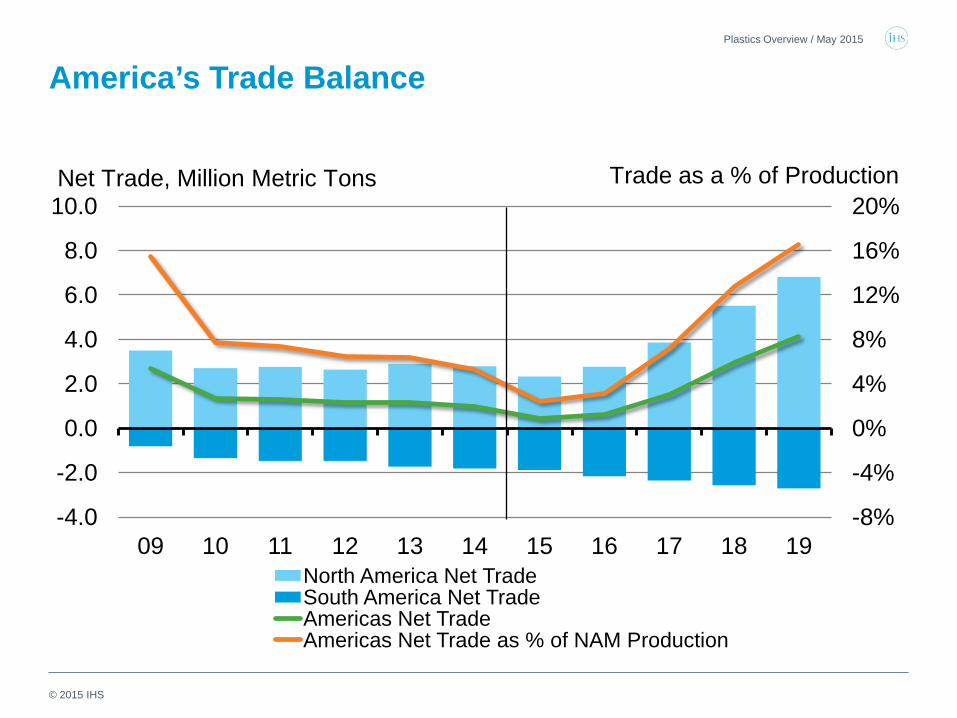
09 10 11 12 13 14 15 16 17 18 19 North America Net Trade South America Net Trade Americas Net Trade Americas Net Trade as % of NAM Production
Net Trade, Million Metric Tons Trade as a % of Production
America’s Trade Balance Plastics Overview / May 2015
© 2015 IHS
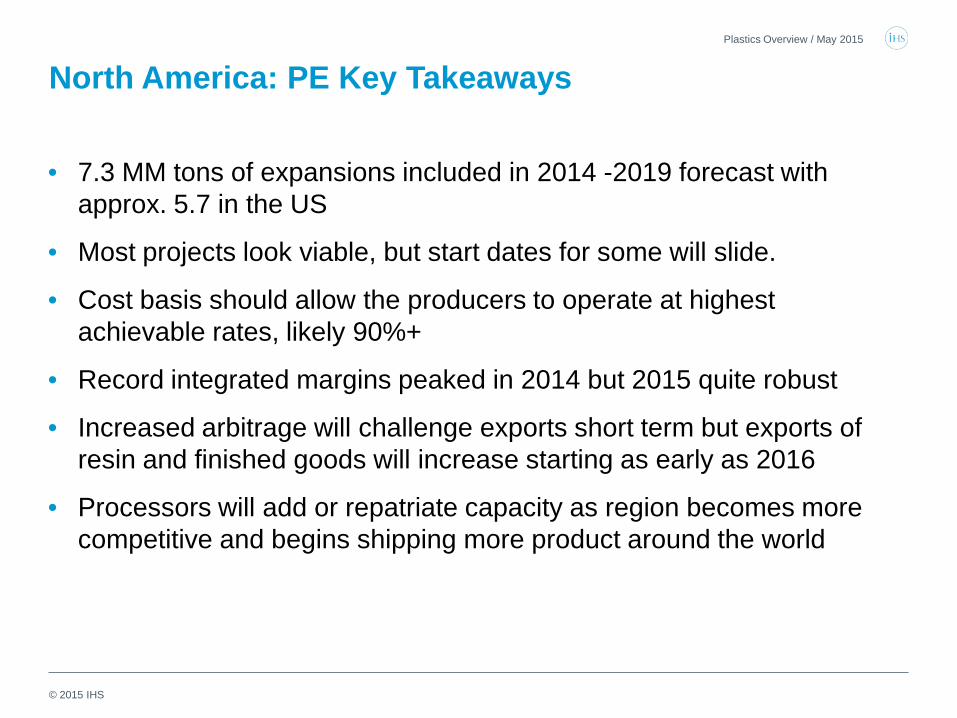
North America: PE Key Takeaways
• 7.3 MM tons of expansions included in 2014 -2019 forecast with approx. 5.7 in the US
• Most projects look viable, but start dates for some will slide.
• Cost basis should allow the producers to operate at highest achievable rates, likely 90%+
• Record integrated margins peaked in 2014 but 2015 quite robust
• Increased arbitrage will challenge exports short term but exports of resin and finished goods will increase starting as early as 2016
• Processors will add or repatriate capacity as region becomes more competitive and begins shipping more product around the world
Plastics Overview / May 2015
© 2015 IHS
Presentation
ihs.com
IHS
Polypropylene
CHEMICAL
© 2015 IHS
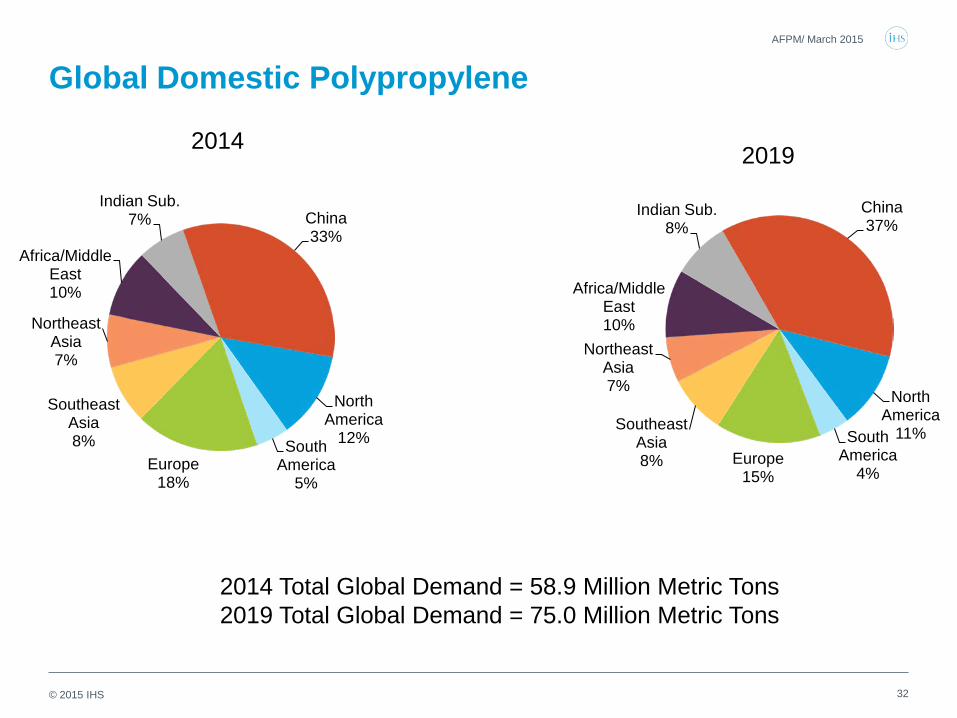
Global Domestic Polypropylene
32
AFPM/ March 2015
North America
12% South America
5% Europe
18%
Southeast Asia 8%
Northeast Asia 7%
Africa/Middle East 10%
Indian Sub. 7% China
33%
2014 Total Global Demand = 58.9 Million Metric Tons 2019 Total Global Demand = 75.0 Million Metric Tons
2014
North America
11% South America
4% Europe
15%
Southeast Asia 8%
Northeast Asia 7%
Africa/Middle East 10%
Indian Sub. 8%
China 37%
2019
© 2015 IHS
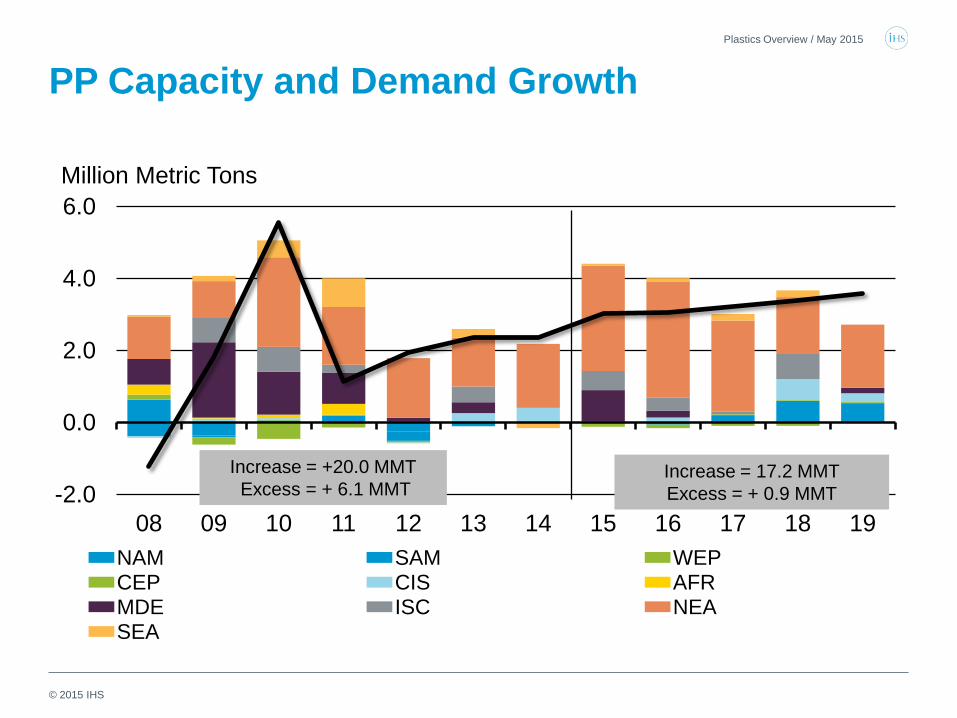
PP Capacity and Demand Growth
-2.0
0.0
2.0
4.0
6.0
08 09 10 11 12 13 14 15 16 17 18 19 NAM SAM WEP CEP CIS AFR MDE ISC NEA SEA Global Demand Change
Million Metric Tons
Increase = +20.0 MMT Excess = + 6.1 MMT
Plastics Overview / May 2015
Increase = 17.2 MMT Excess = + 0.9 MMT
© 2015 IHS
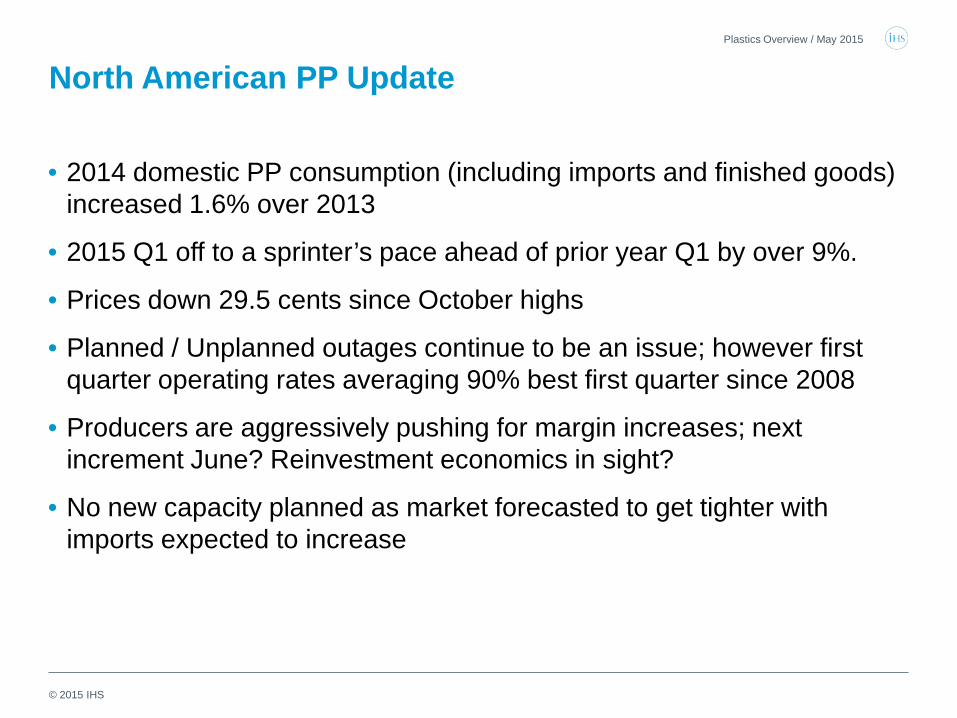
North American PP Update
• 2014 domestic PP consumption (including imports and finished goods) increased 1.6% over 2013
• 2015 Q1 off to a sprinter’s pace ahead of prior year Q1 by over 9%.
• Prices down 29.5 cents since October highs
• Planned / Unplanned outages continue to be an issue; however first quarter operating rates averaging 90% best first quarter since 2008
• Producers are aggressively pushing for margin increases; next increment June? Reinvestment economics in sight?
• No new capacity planned as market forecasted to get tighter with imports expected to increase
Plastics Overview / May 2015
© 2015 IHS
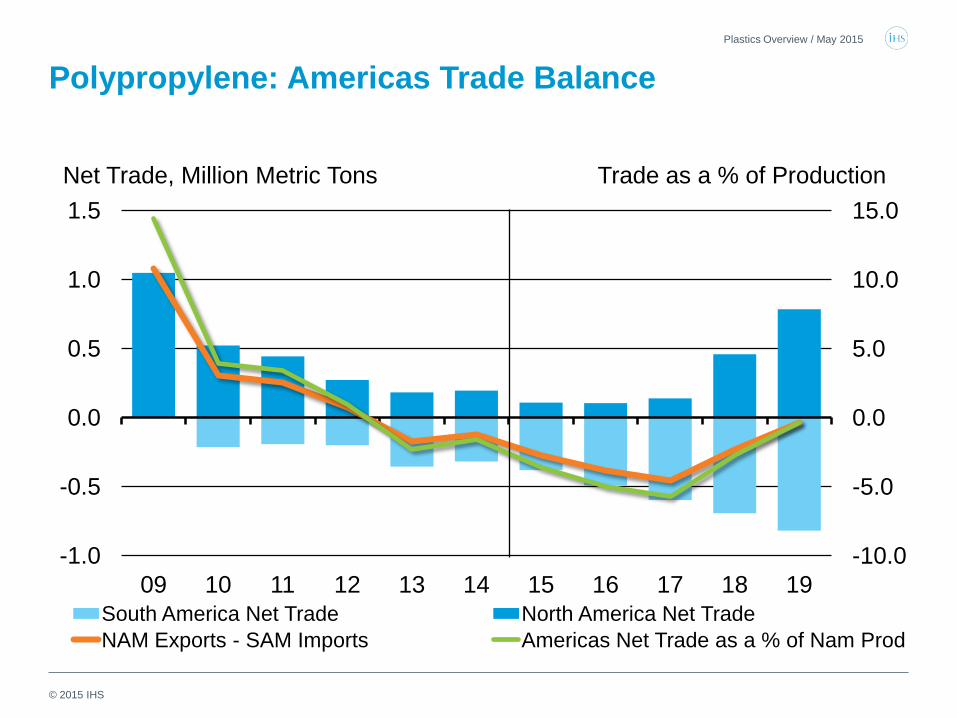
Polypropylene: Americas Trade Balance
-10.0
-5.0
0.0
5.0
10.0
15.0
-1.0
-0.5
0.0
0.5
1.0
1.5
09 10 11 12 13 14 15 16 17 18 19 South America Net Trade North America Net Trade NAM Exports - SAM Imports Americas Net Trade as a % of Nam Prod
Net Trade, Million Metric Tons Trade as a % of Production
Plastics Overview / May 2015
© 2015 IHS
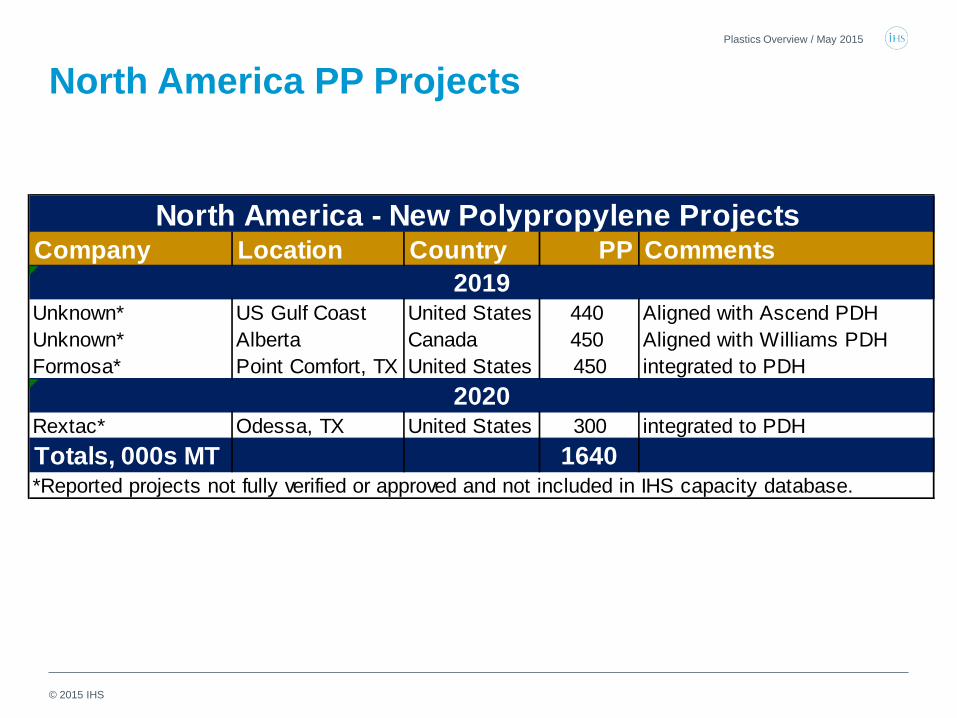
North America PP Projects Plastics Overview / May 2015
Company Location Country PP Comments
Unknown* US Gulf Coast United States 440 Aligned with Ascend PDHUnknown* Alberta Canada 450 Aligned with Williams PDHFormosa* Point Comfort, TX United States 450 integrated to PDH
Rextac* Odessa, TX United States 300 integrated to PDHTotals, 000s MT 1640
North America - New Polypropylene Projects
2019
*Reported projects not fully verified or approved and not included in IHS capacity database.
2020
© 2015 IHS
Regional PP Homopolymer Price
0
441
882
1,323
1,764
2,205
2,646
0
20
40
60
80
100
120
Jan-10 Dec-10 Nov-11 Oct-12 Sep-13 Aug-14 Jul-15 Jun-16 NAM-China Spread NAM Net Transaction WEP Disc. Contract NEA Spot Avg. CFR China
Dollars Per Metric Ton Cents Per Pound
Plastics Overview / May 2015
© 2015 IHS
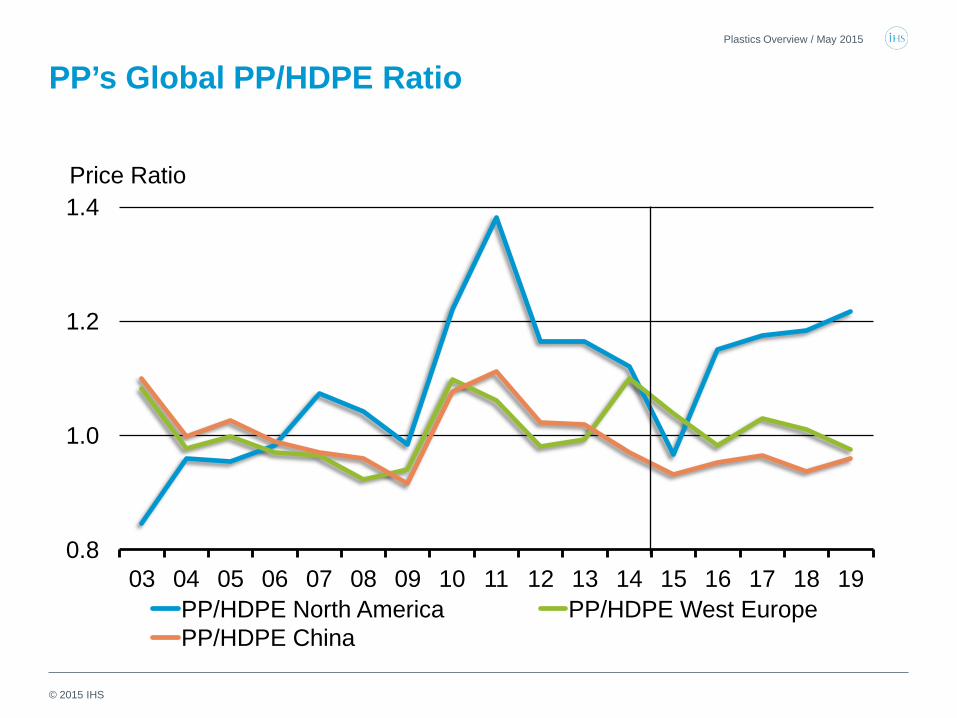
PP’s Global PP/HDPE Ratio
0.8
1.0
1.2
1.4
03 04 05 06 07 08 09 10 11 12 13 14 15 16 17 18 19 PP/HDPE North America PP/HDPE West Europe PP/HDPE China
Price Ratio Price Ratio
Plastics Overview / May 2015
© 2015 IHS
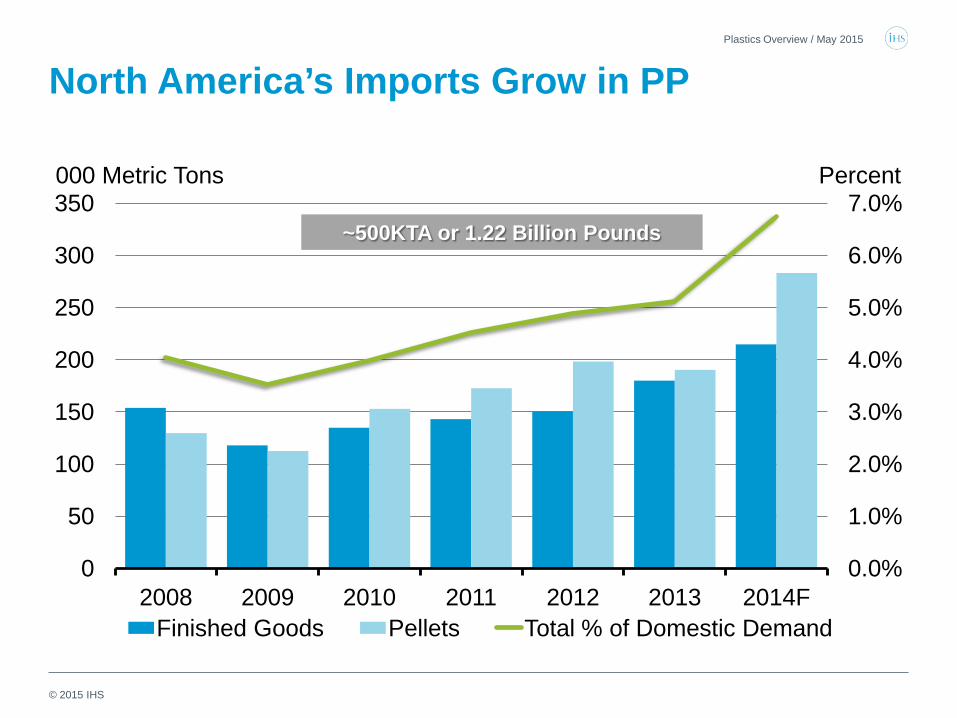
North America’s Imports Grow in PP Plastics Overview / May 2015
~500KTA or 1.22 Billion Pounds
0.0%
1.0%
2.0%
3.0%
4.0%
5.0%
6.0%
7.0%
0
50
100
150
200
250
300
350
2008 2009 2010 2011 2012 2013 2014F Finished Goods Pellets Total % of Domestic Demand
000 Metric Tons Percent
© 2015 IHS
Key Takeaways: Polypropylene • Chinese capacity expansions in propylene and derivatives shifts trade
balances and puts downward pressure on global prices
• PP to become very competitive in Asia and increase arbitrage pressure on North America producers
• Middle East redirects exports responding to Chinese self sufficiency
• Europe adapts to changing feedstocks and increased PP imports
• Regions in Southern Hemisphere increase net imports as global operating rates still remain in mid 80 percent range
• North America PP margins increase and expected to remain high prior to capacity expansions as producers push for reinvestment levels
Plastics Overview / May 2015
© 2015 IHS
Expanded Polystyrene and Polystyrene
Plastics Overview / May 2015
© 2015 IHS
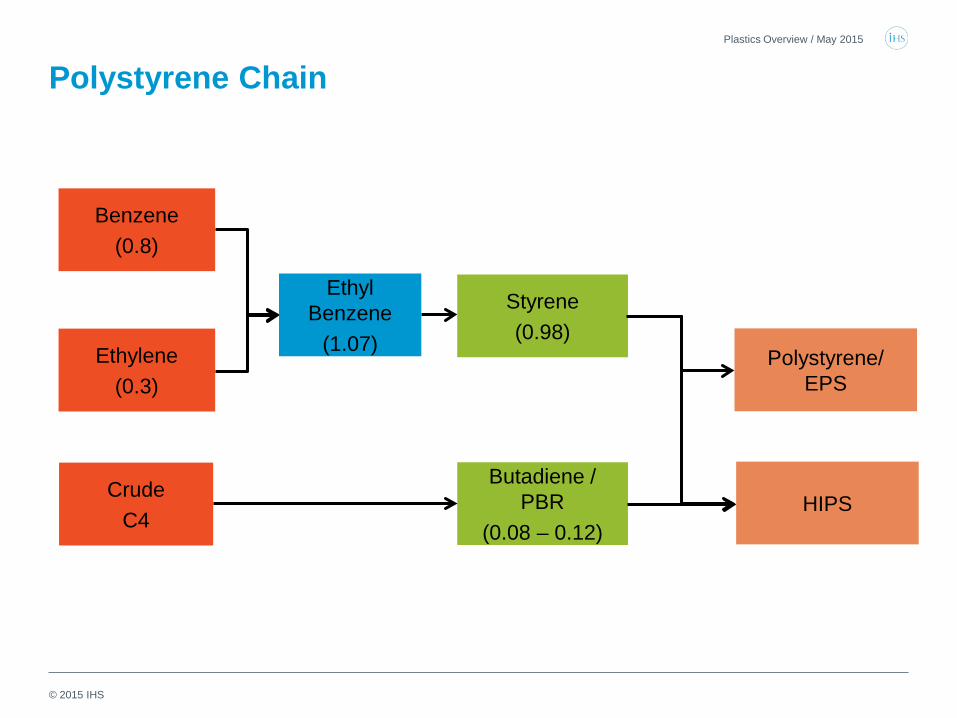
Polystyrene Chain Plastics Overview / May 2015
Polystyrene/ EPS
Benzene (0.8)
Ethylene (0.3)
Crude C4
Ethyl Benzene
(1.07)
Styrene (0.98)
Butadiene / PBR
(0.08 – 0.12) HIPS
© 2015 IHS
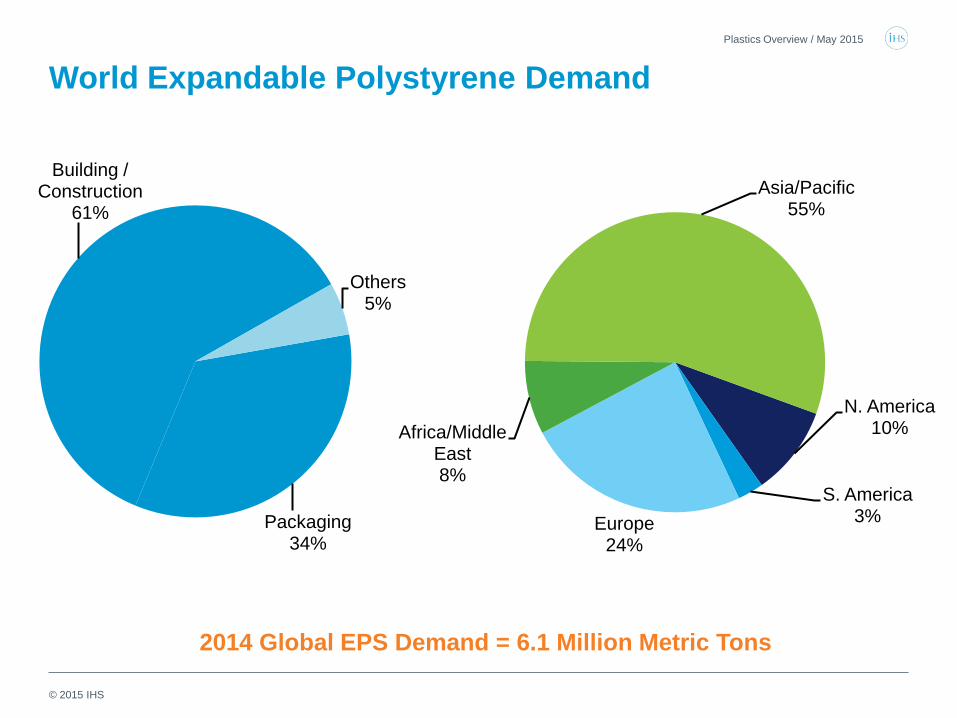
Packaging 34%
Building / Construction
61%
Others 5%
Plastics Overview / May 2015
World Expandable Polystyrene Demand
2014 Global EPS Demand = 6.1 Million Metric Tons
N. America 10%
S. America 3% Europe
24%
Africa/Middle East 8%
Asia/Pacific 55%
© 2015 IHS
Plastics Overview / May 2015
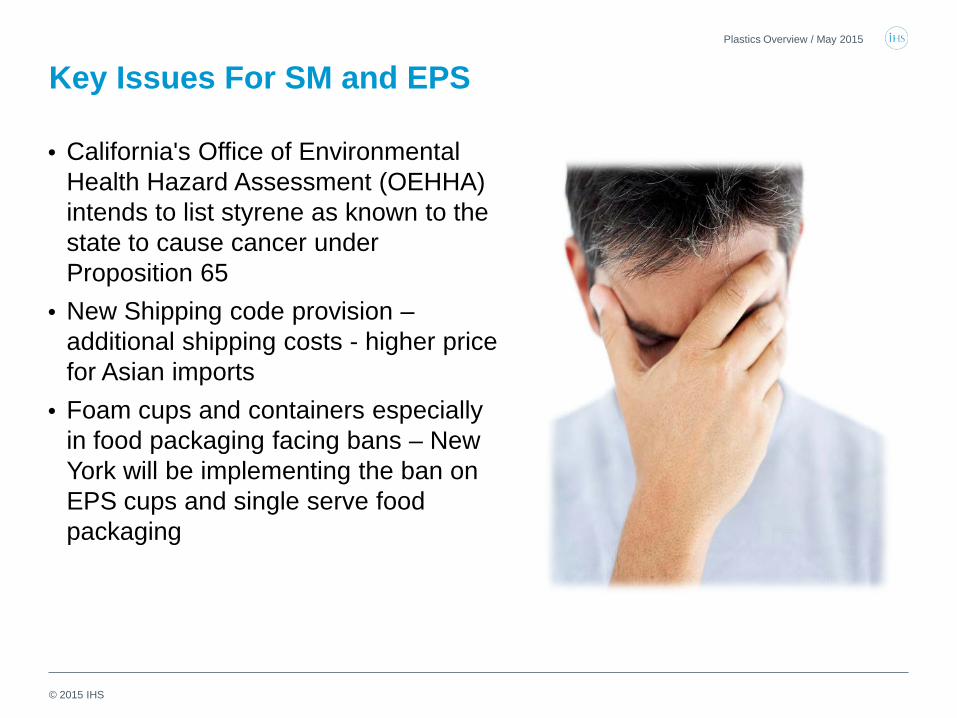
Key Issues For SM and EPS
• California's Office of Environmental Health Hazard Assessment (OEHHA) intends to list styrene as known to the state to cause cancer under Proposition 65
• New Shipping code provision – additional shipping costs - higher price for Asian imports
• Foam cups and containers especially in food packaging facing bans – New York will be implementing the ban on EPS cups and single serve food packaging
© 2015 IHS
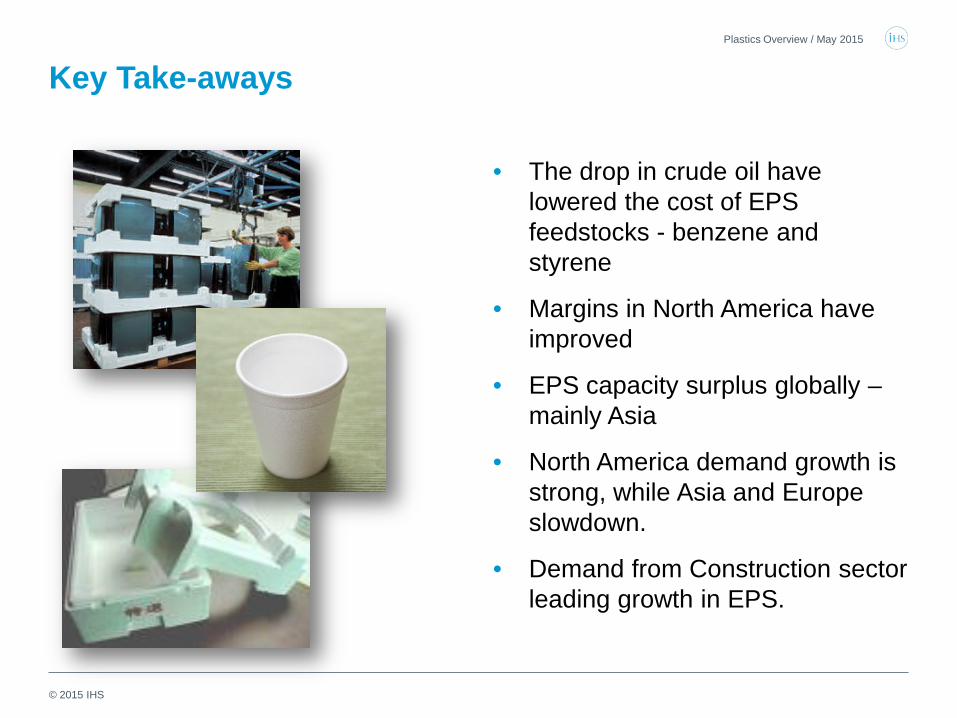
Key Take-aways
• The drop in crude oil have lowered the cost of EPS feedstocks - benzene and styrene
• Margins in North America have improved
• EPS capacity surplus globally – mainly Asia
• North America demand growth is strong, while Asia and Europe slowdown.
• Demand from Construction sector leading growth in EPS.
Plastics Overview / May 2015
© 2015 IHS
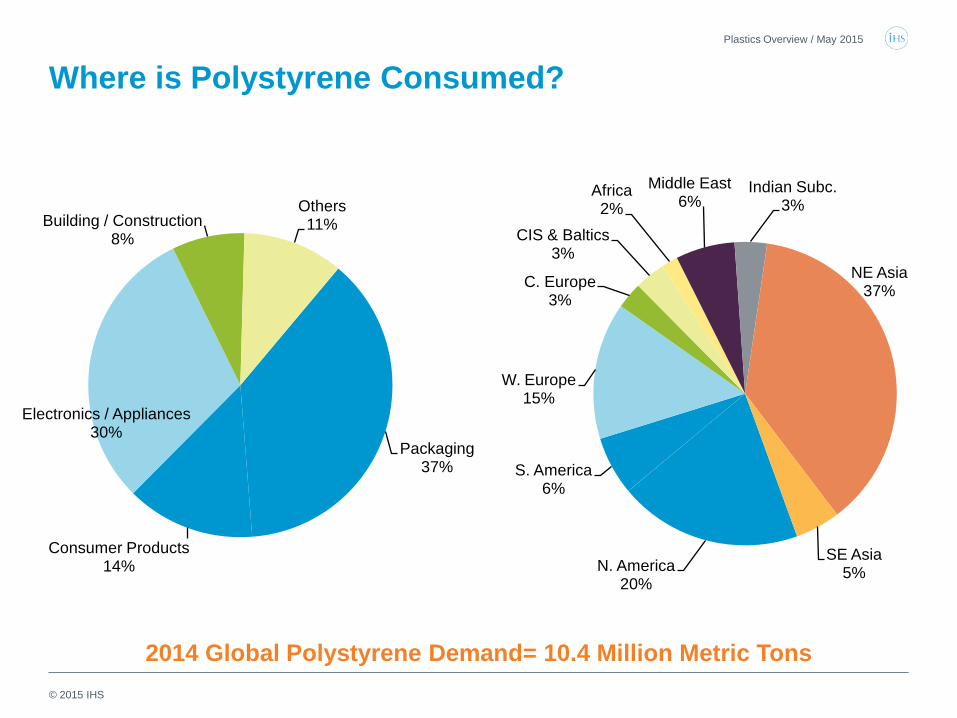
N. America 20%
S. America 6%
W. Europe 15%
C. Europe 3%
CIS & Baltics 3%
Africa 2%
Middle East 6%
Indian Subc. 3%
NE Asia 37%
SE Asia 5%
2014 Global Polystyrene Demand= 10.4 Million Metric Tons
Plastics Overview / May 2015
Where is Polystyrene Consumed?
Packaging 37%
Consumer Products 14%
Electronics / Appliances 30%
Building / Construction 8%
Others 11%
© 2015 IHS
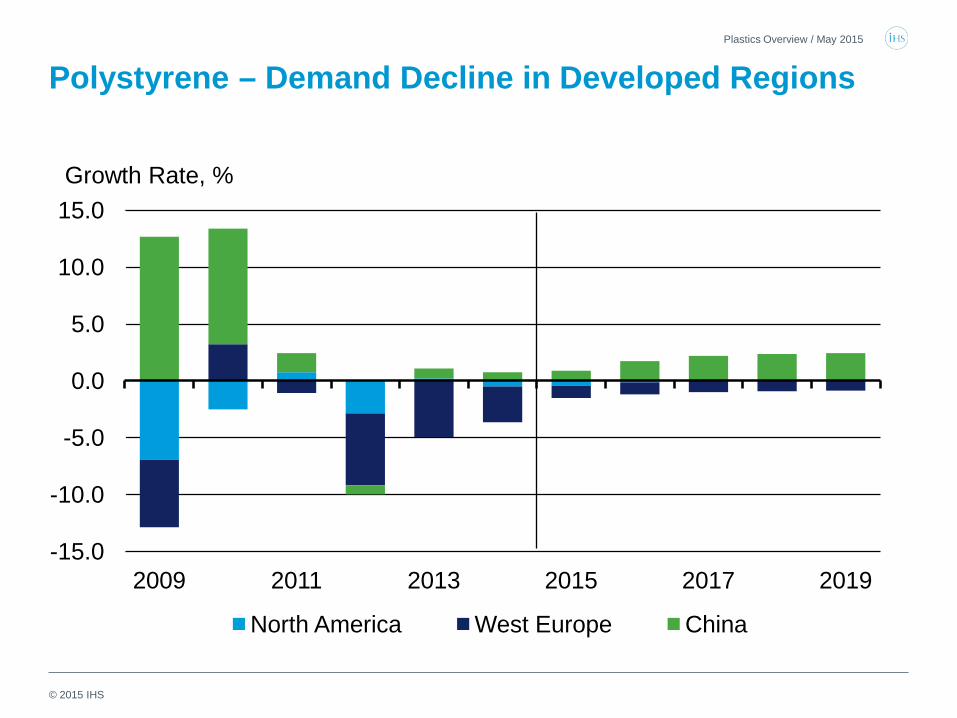
Polystyrene – Demand Decline in Developed Regions Plastics Overview / May 2015
-15.0
-10.0
-5.0
0.0
5.0
10.0
15.0
2009 2011 2013 2015 2017 2019
North America West Europe China
Growth Rate, %
© 2015 IHS
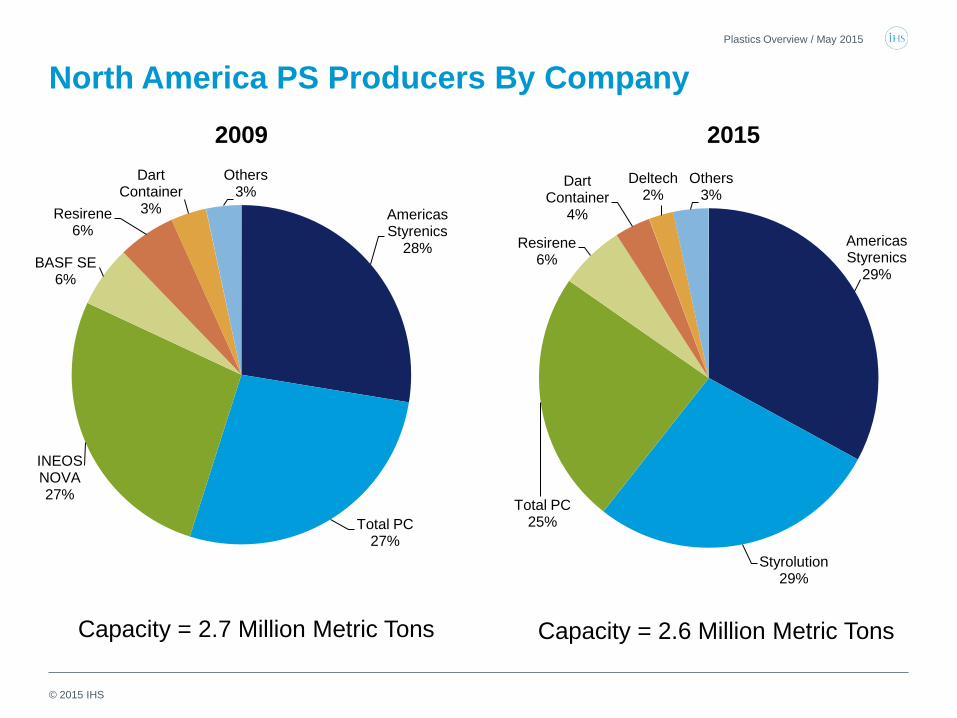
Plastics Overview / May 2015
North America PS Producers By Company 2015 2009
Capacity = 2.6 Million Metric Tons Capacity = 2.7 Million Metric Tons
Americas Styrenics
28%
Total PC 27%
INEOS NOVA 27%
BASF SE 6%
Resirene 6%
Dart Container
3%
Others 3%
Americas Styrenics
29%
Styrolution 29%
Total PC 25%
Resirene 6%
Dart Container
4%
Deltech 2%
Others 3%
© 2015 IHS
Conclusions • Global demand for polystyrene growing lower than GDP
• Slowdown in demand in China has slowed global demand growth
• Polystyrene market still in a oversupply situation globally
• Rationalization of capacity has been seen in North America and West Europe,
• Following historically high prices in 2014, the drop in crude and benzene prices has resulted in lower prices for PS
• North America will see demand remain stable and operating rates and margins improve
Plastics Overview / May 2015
© 2015 IHS
Polyvinyl Chloride
Plastics Overview / May 2015
© 2015 IHS
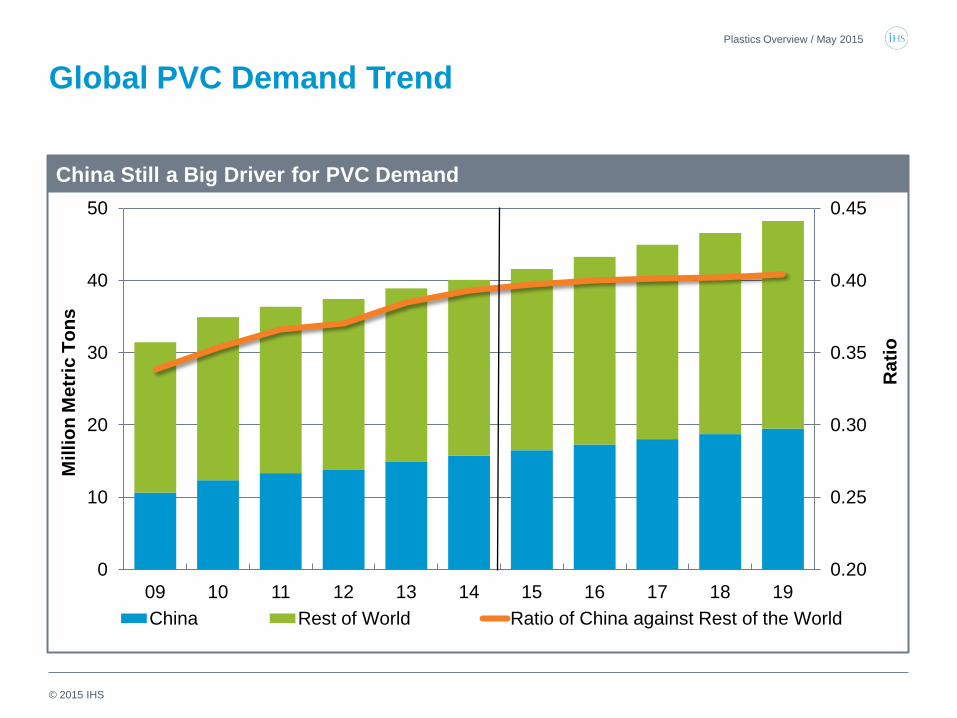
Global PVC Demand Trend
0.20
0.25
0.30
0.35
0.40
0.45
0
10
20
30
40
50
09 10 11 12 13 14 15 16 17 18 19 China Rest of World Ratio of China against Rest of the World
China Still a Big Driver for PVC Demand
Mill
ion
Met
ric T
ons
Rat
io
Plastics Overview / May 2015
© 2015 IHS
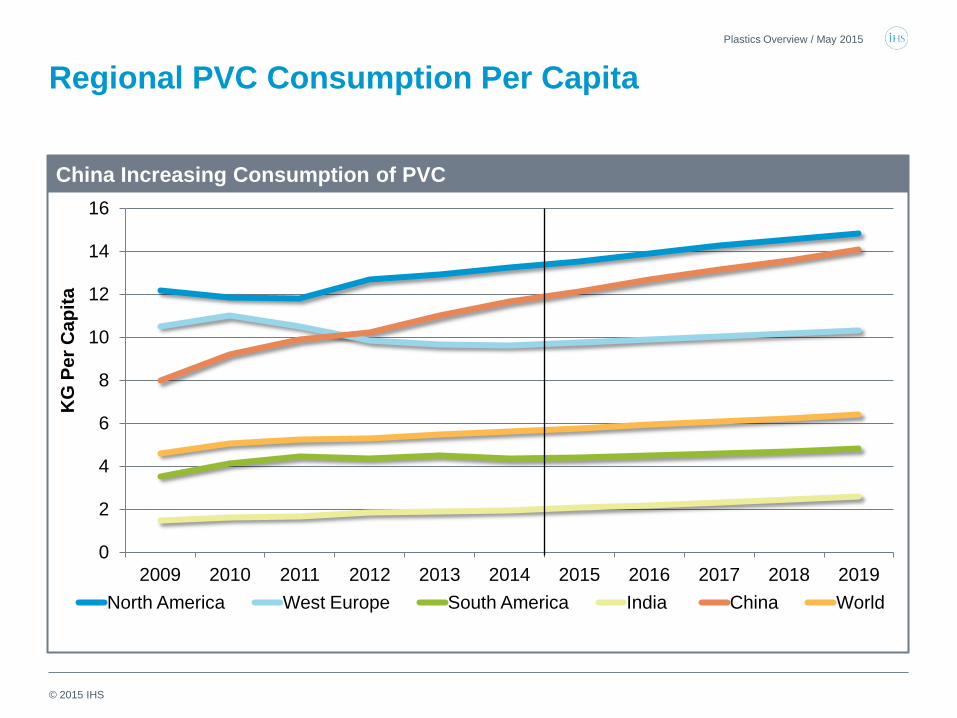
Regional PVC Consumption Per Capita
0
2
4
6
8
10
12
14
16
2009 2010 2011 2012 2013 2014 2015 2016 2017 2018 2019 North America West Europe South America India China World
China Increasing Consumption of PVC
KG
Per
Cap
ita
Plastics Overview / May 2015
© 2015 IHS
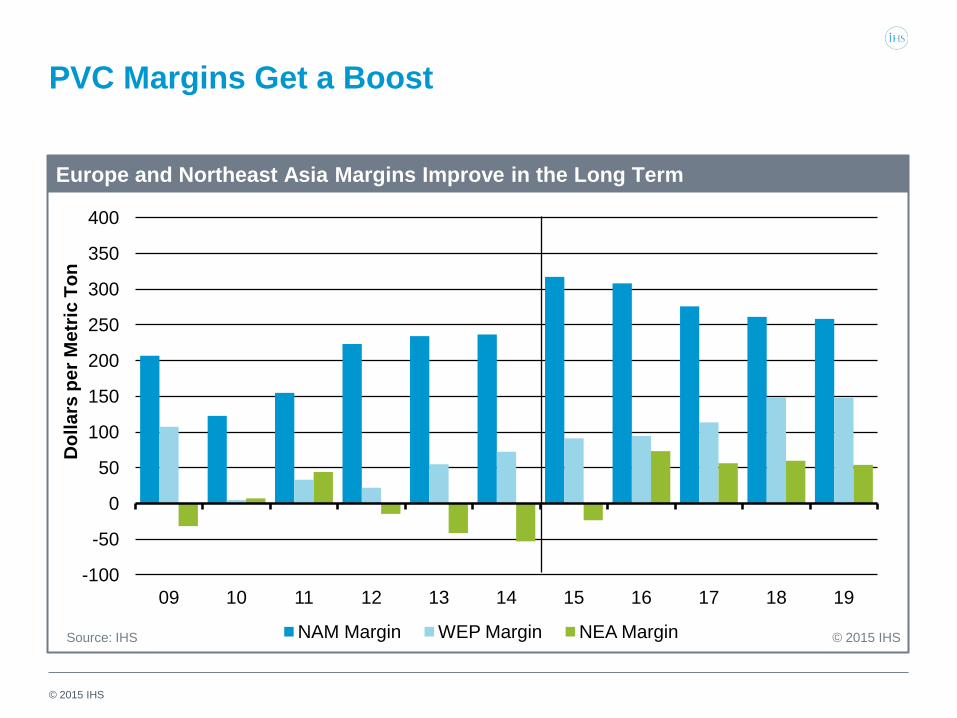
PVC Margins Get a Boost Plastics Overview / May 2015
Dol
lars
per
Met
ric T
on
Source: IHS © 2015 IHS
Europe and Northeast Asia Margins Improve in the Long Term
-100
-50
0
50
100
150
200
250
300
350
400
09 10 11 12 13 14 15 16 17 18 19
NAM Margin WEP Margin NEA Margin
© 2015 IHS
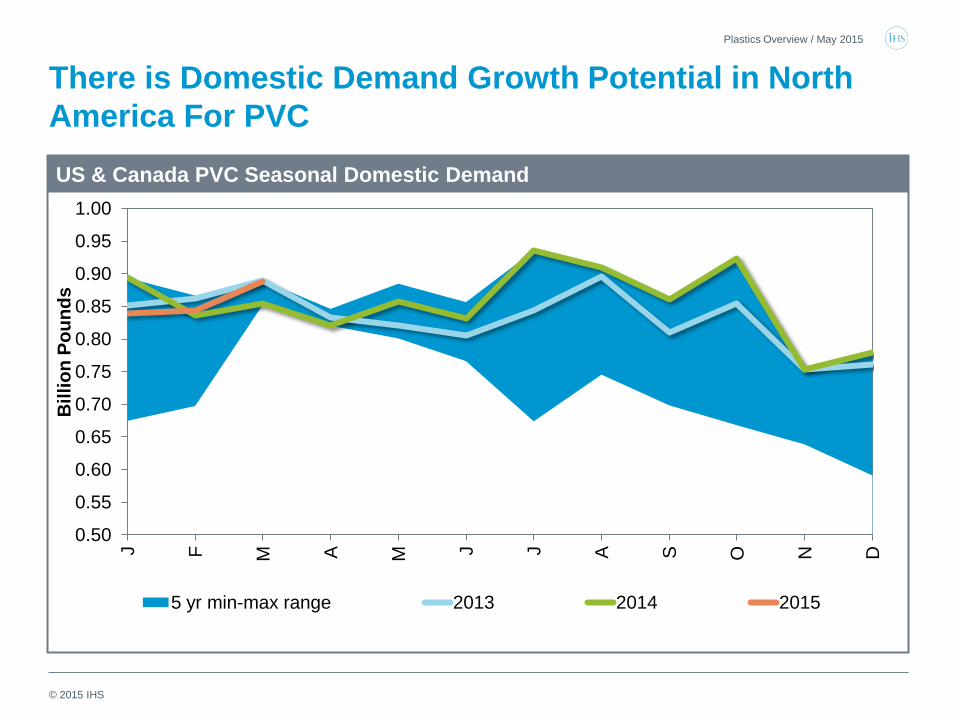
There is Domestic Demand Growth Potential in North America For PVC
0.50
0.55
0.60
0.65
0.70
0.75
0.80
0.85
0.90
0.95
1.00
J F M
A
M J J A
S
O
N
D
Bill
ion
Poun
ds
5 yr min-max range 2013 2014 2015
US & Canada PVC Seasonal Domestic Demand
Plastics Overview / May 2015
© 2015 IHS
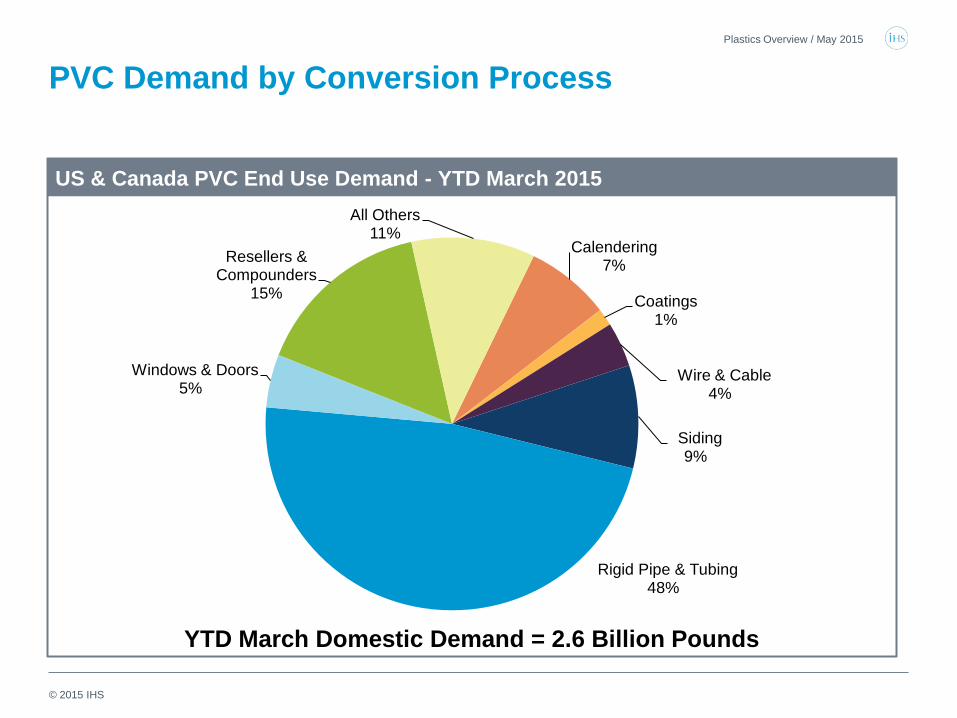
PVC Demand by Conversion Process
Calendering 7%
Coatings 1%
Wire & Cable 4%
Siding 9%
Rigid Pipe & Tubing 48%
Windows & Doors 5%
Resellers & Compounders
15%
All Others 11%
YTD March Domestic Demand = 2.6 Billion Pounds
US & Canada PVC End Use Demand - YTD March 2015
Plastics Overview / May 2015
© 2015 IHS
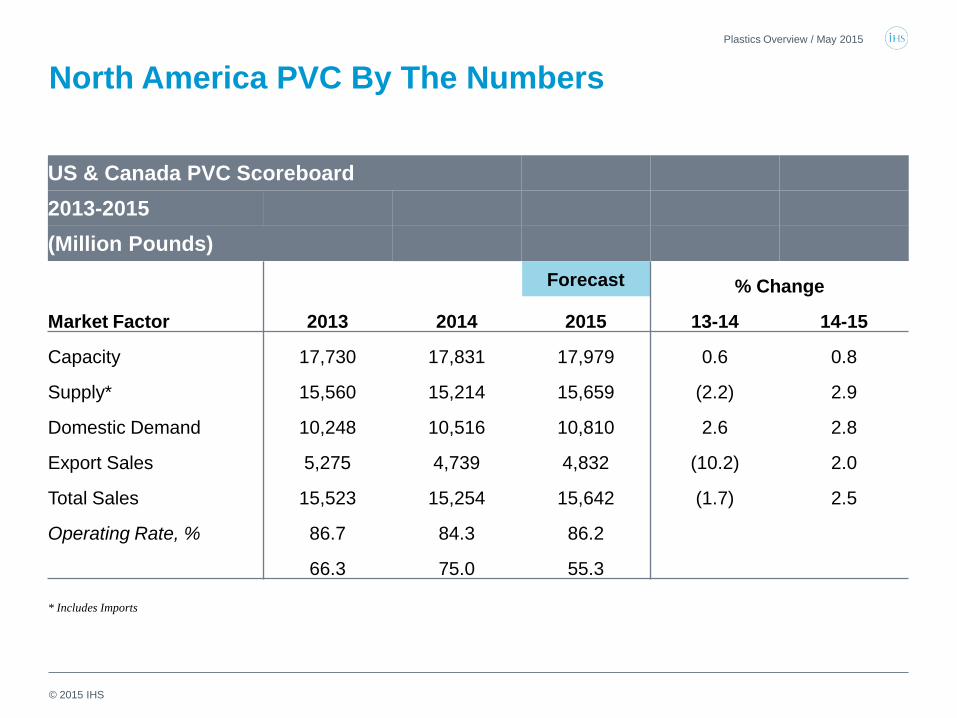
North America PVC By The Numbers
US & Canada PVC Scoreboard
2013-2015
(Million Pounds)
Forecast % Change
Market Factor 2013 2014 2015 13-14 14-15
Capacity 17,730 17,831 17,979 0.6 0.8
Supply* 15,560 15,214 15,659 (2.2) 2.9
Domestic Demand 10,248 10,516 10,810 2.6 2.8
Export Sales 5,275 4,739 4,832 (10.2) 2.0
Total Sales 15,523 15,254 15,642 (1.7) 2.5
Operating Rate, % 86.7 84.3 86.2
66.3 75.0 55.3
* Includes Imports
Plastics Overview / May 2015
© 2015 IHS
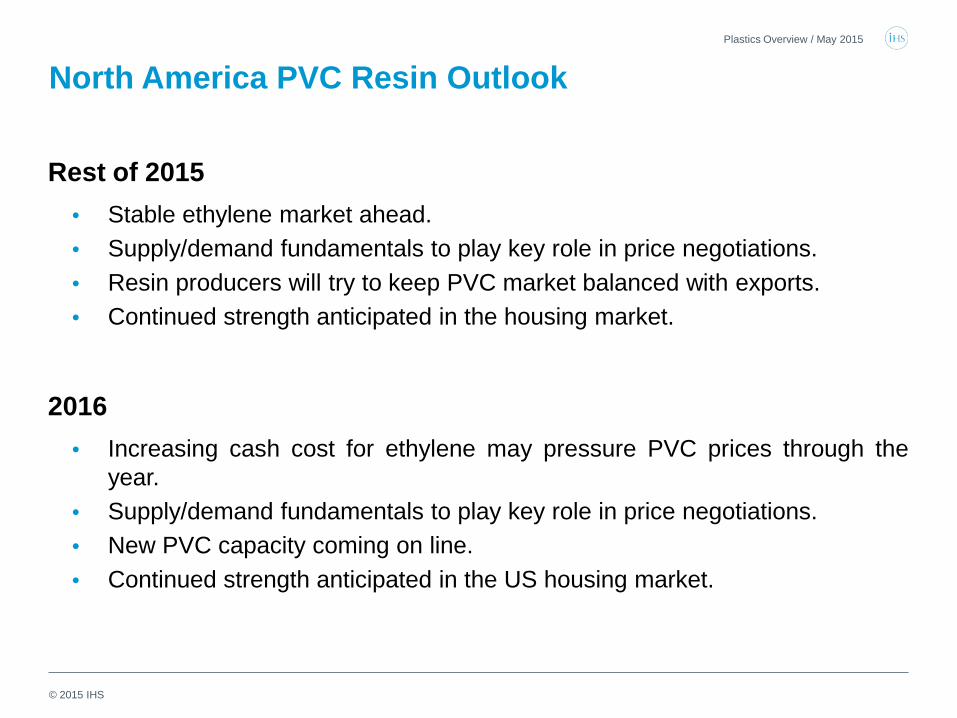
North America PVC Resin Outlook
Rest of 2015 • Stable ethylene market ahead. • Supply/demand fundamentals to play key role in price negotiations. • Resin producers will try to keep PVC market balanced with exports. • Continued strength anticipated in the housing market.
2016 • Increasing cash cost for ethylene may pressure PVC prices through the
year. • Supply/demand fundamentals to play key role in price negotiations. • New PVC capacity coming on line. • Continued strength anticipated in the US housing market.
Plastics Overview / May 2015
© 2015 IHS
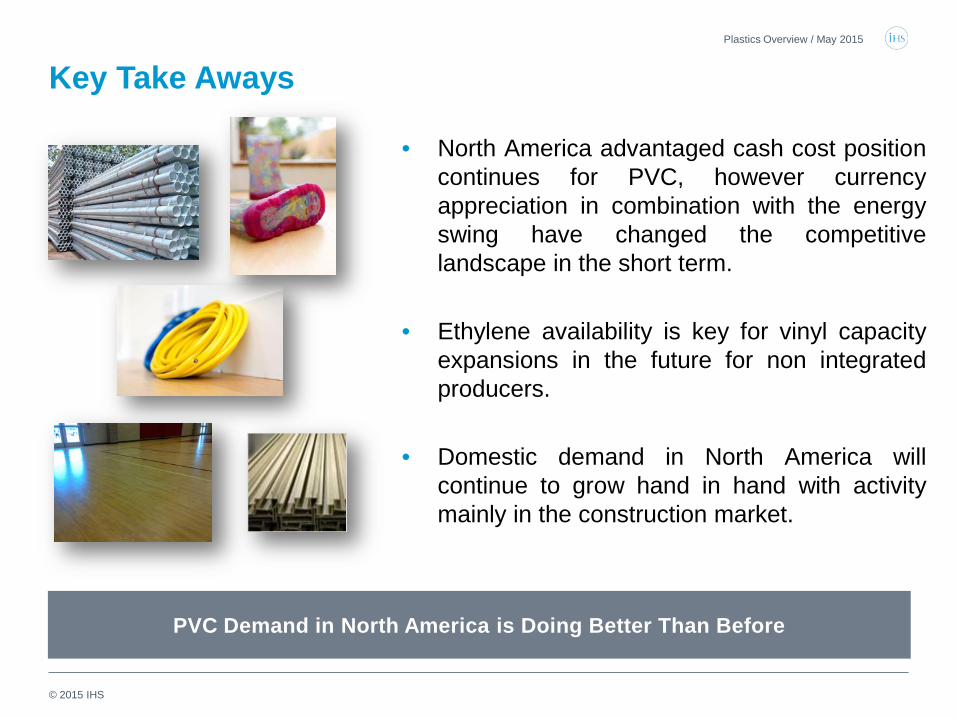
Key Take Aways
• North America advantaged cash cost position continues for PVC, however currency appreciation in combination with the energy swing have changed the competitive landscape in the short term.
• Ethylene availability is key for vinyl capacity expansions in the future for non integrated producers.
• Domestic demand in North America will continue to grow hand in hand with activity mainly in the construction market.
PVC Demand in North America is Doing Better Than Before
Plastics Overview / May 2015

© 2015 IHS
PET
Plastics Overview / May 2015
© 2015 IHS
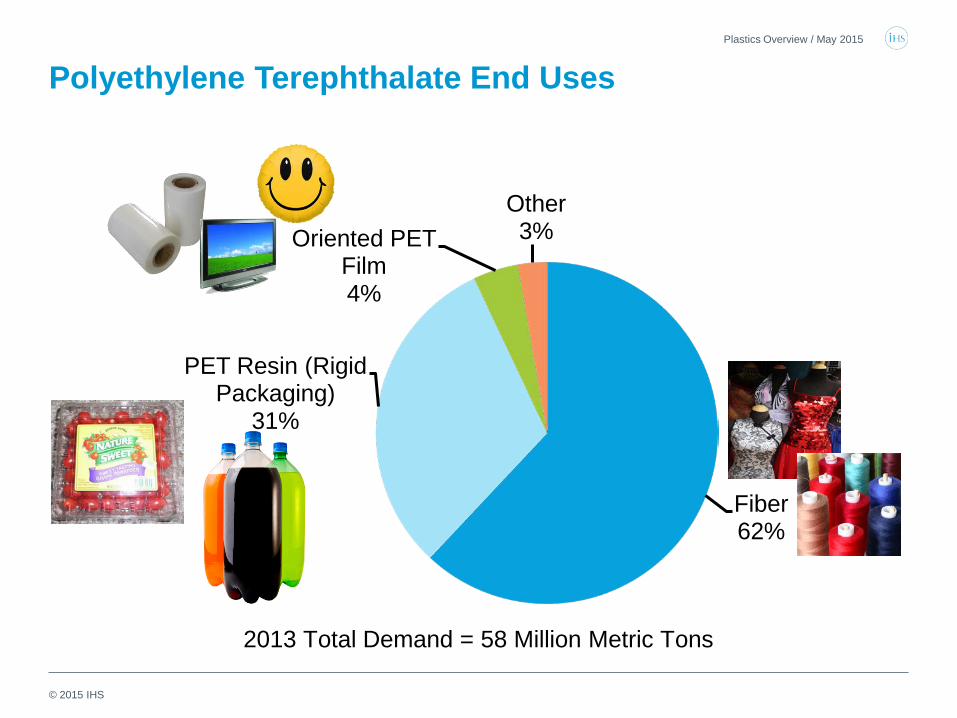
Fiber 62%
PET Resin (Rigid Packaging)
31%
Oriented PET Film 4%
Other 3%
2013 Total Demand = 58 Million Metric Tons
Polyethylene Terephthalate End Uses Plastics Overview / May 2015
© 2015 IHS
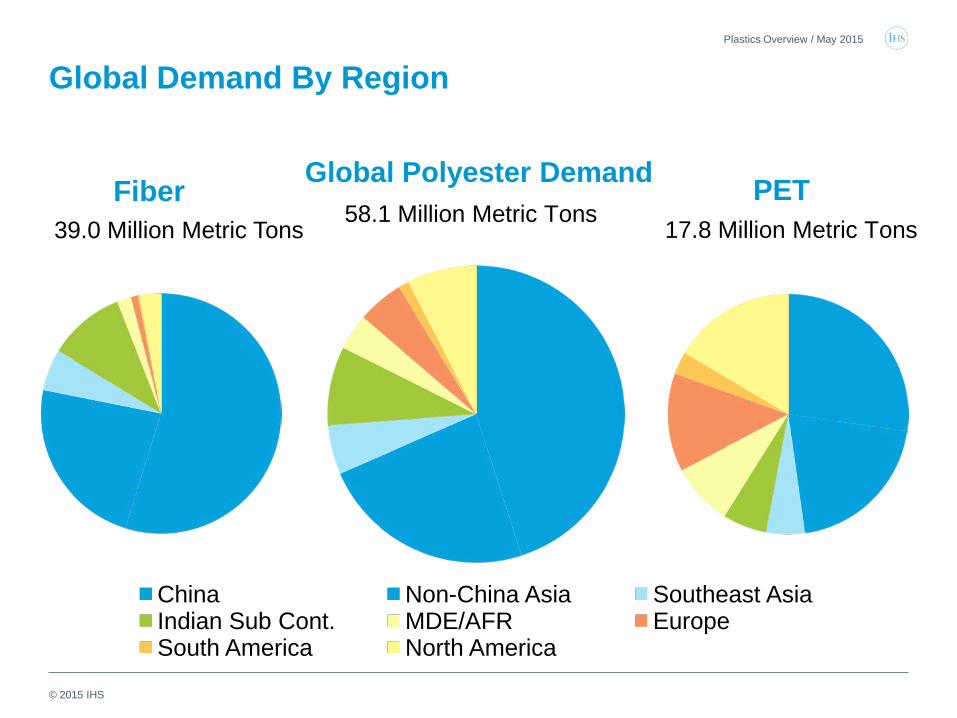
Global Polyester Demand
China Non-China Asia Southeast Asia Indian Sub Cont. MDE/AFR Europe South America North America
58.1 Million Metric Tons
Global Demand By Region
Fiber 39.0 Million Metric Tons
17.8 Million Metric Tons
PET
Plastics Overview / May 2015
© 2015 IHS
Global PET Supply/Demand Notes
• With very low barriers to entry, capacity growth continues to outpace demand growth despite massive overcapacity.
• Asia continues to be the incremental supplier to the world capping prices in any region at Asian cash costs plus freight and duty.
• Overall industry cost structure is falling with new world scale assets and falling margins in PX.
Plastics Overview / May 2015
© 2015 IHS
30 40 50 60 70 80 90 100
-2.0
-1.0
0.0
1.0
2.0
3.0
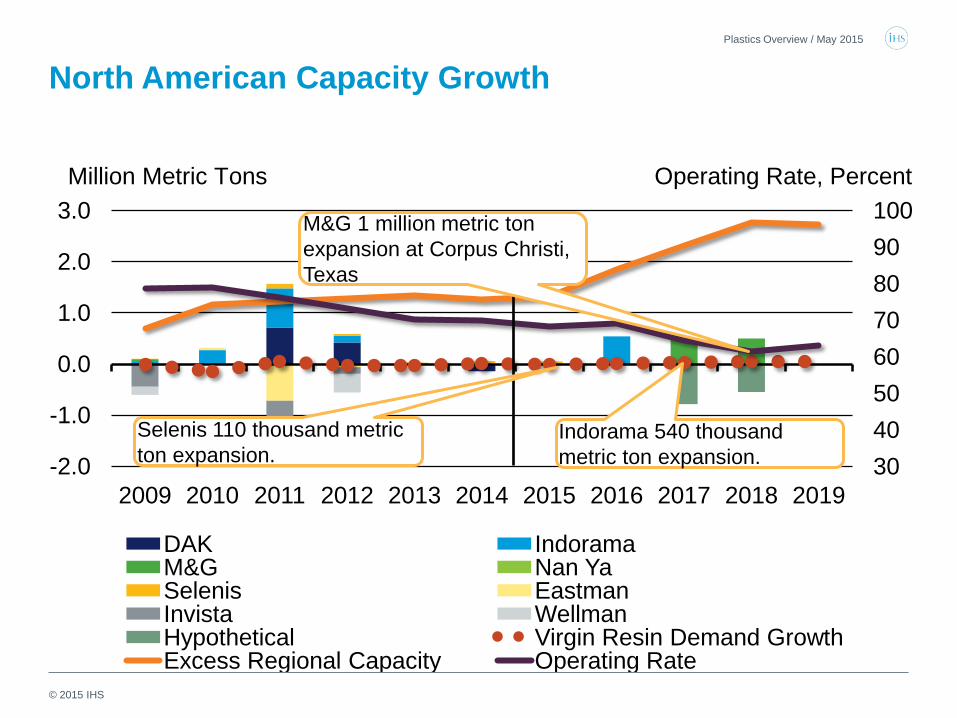
2009 2010 2011 2012 2013 2014 2015 2016 2017 2018 2019
DAK Indorama M&G Nan Ya Selenis Eastman Invista Wellman Hypothetical Virgin Resin Demand Growth Excess Regional Capacity Operating Rate
Operating Rate, Percent Million Metric Tons
North American Capacity Growth
M&G 1 million metric ton expansion at Corpus Christi, Texas
Indorama 540 thousand metric ton expansion.
Selenis 110 thousand metric ton expansion.
Plastics Overview / May 2015
© 2015 IHS
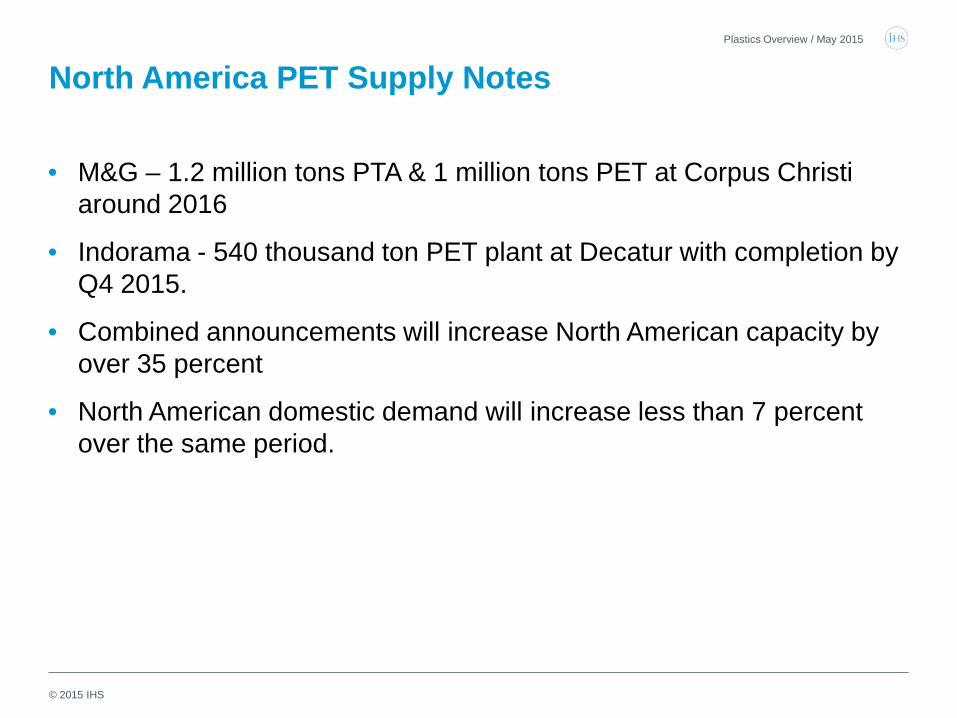
North America PET Supply Notes
• M&G – 1.2 million tons PTA & 1 million tons PET at Corpus Christi around 2016
• Indorama - 540 thousand ton PET plant at Decatur with completion by Q4 2015.
• Combined announcements will increase North American capacity by over 35 percent
• North American domestic demand will increase less than 7 percent over the same period.
Plastics Overview / May 2015
© 2015 IHS
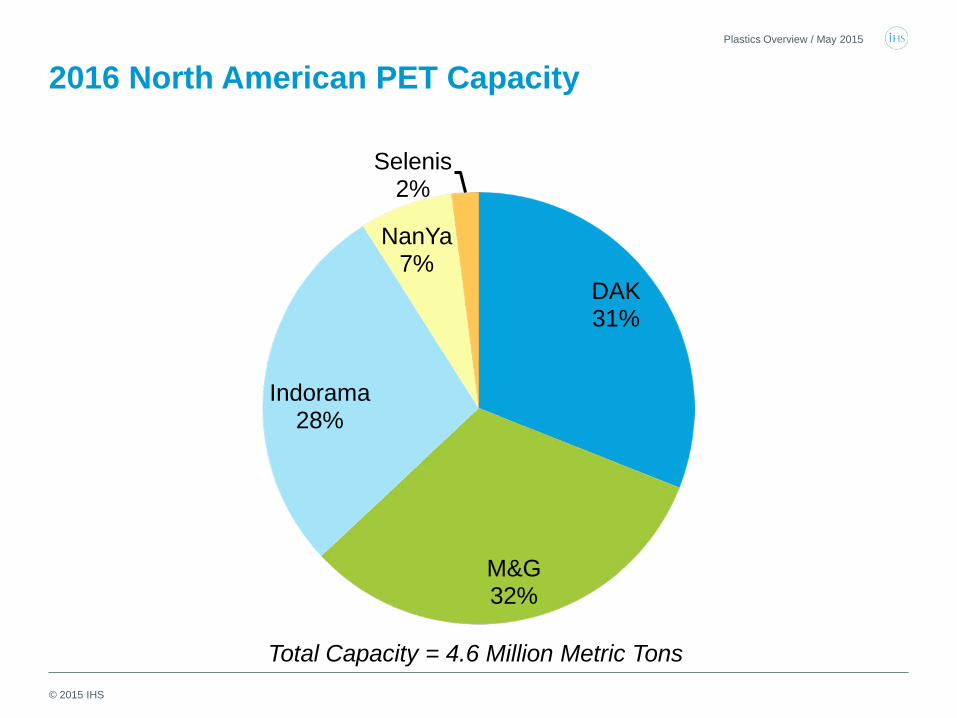
2016 North American PET Capacity
DAK 31%
M&G 32%
Indorama 28%
NanYa 7%
Selenis 2%
Total Capacity = 4.6 Million Metric Tons
Plastics Overview / May 2015
© 2015 IHS
• Global PET markets will continue to be vastly oversupplied.
• North America is embarking on even further capacity expansion which will change the economic dynamic.
• Falling PX will reduce PX prices with PX margins suffering due to increasing capacity.
Conclusions - PET PLASTICS OVERVIEW / MAY 2015
© 2015 IHS
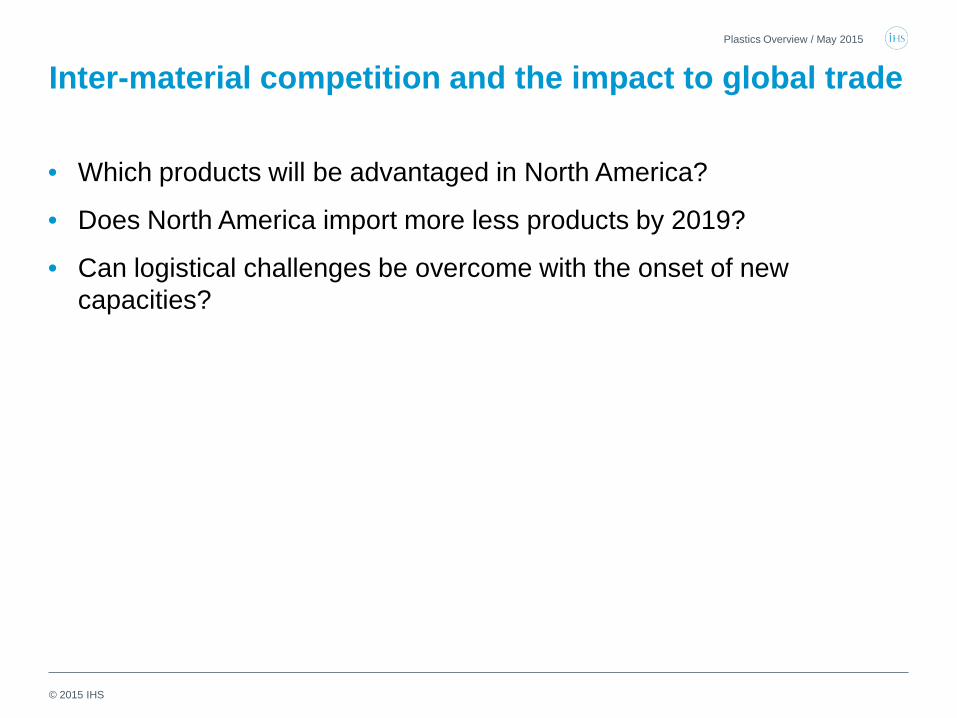
Inter-material competition and the impact to global trade
• Which products will be advantaged in North America?
• Does North America import more less products by 2019?
• Can logistical challenges be overcome with the onset of new capacities?
Plastics Overview / May 2015
© 2015 IHS
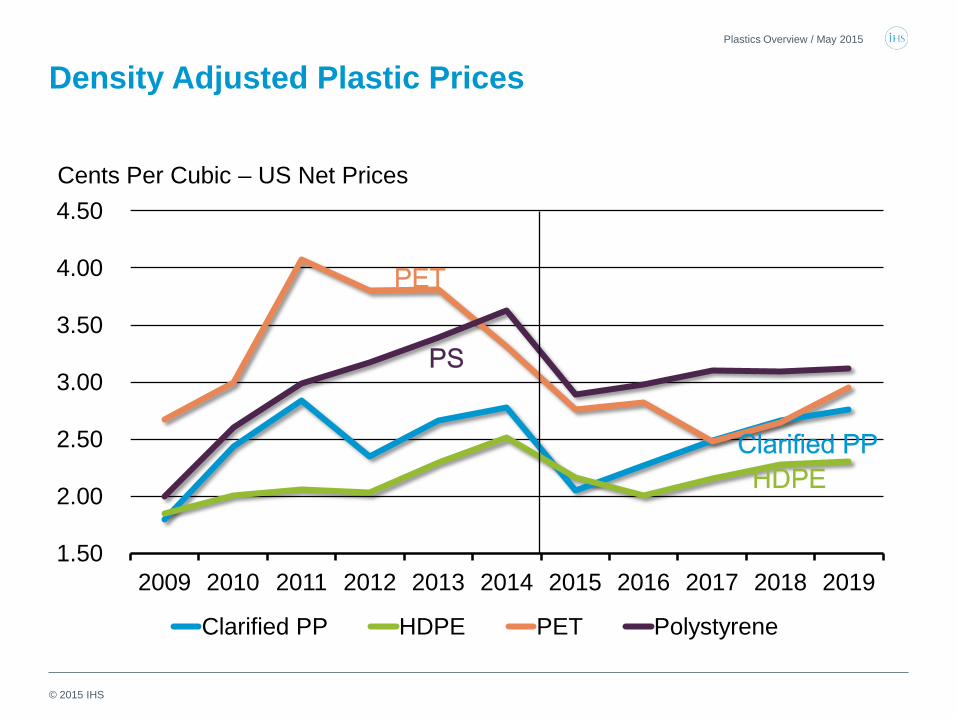
Density Adjusted Plastic Prices
1.50
2.00
2.50
3.00
3.50
4.00
4.50
2009 2010 2011 2012 2013 2014 2015 2016 2017 2018 2019
Clarified PP HDPE PET Polystyrene
Cents Per Cubic – US Net Prices
Plastics Overview / May 2015
© 2015 IHS
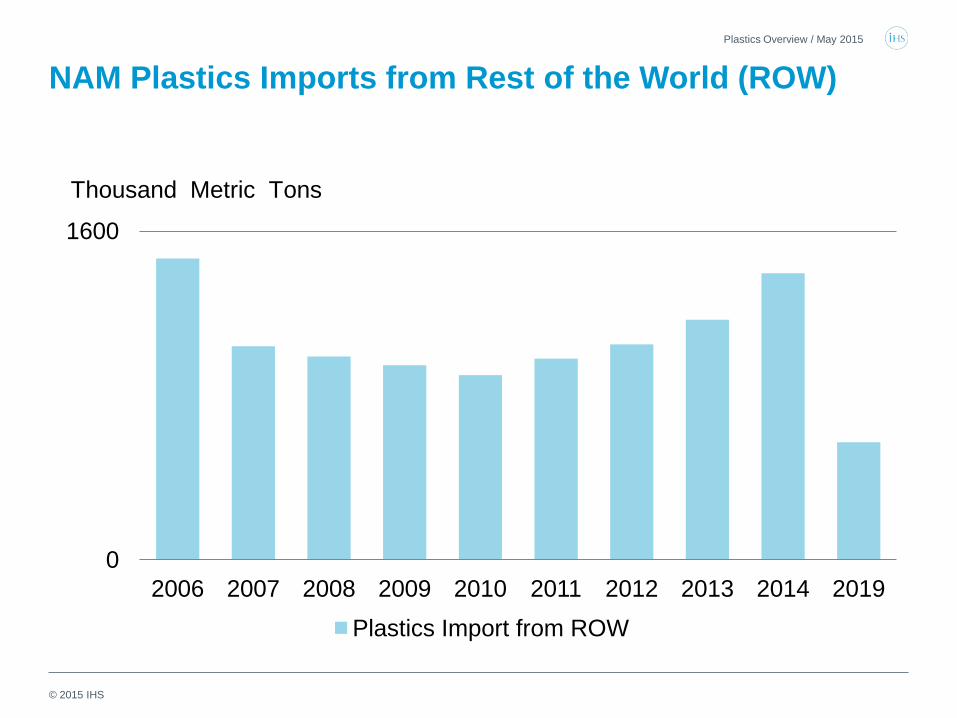
NAM Plastics Imports from Rest of the World (ROW)
Plastics Overview / May 2015
0
1600
2006 2007 2008 2009 2010 2011 2012 2013 2014 2019 Plastics Import from ROW
Thousand Metric Tons
© 2015 IHS
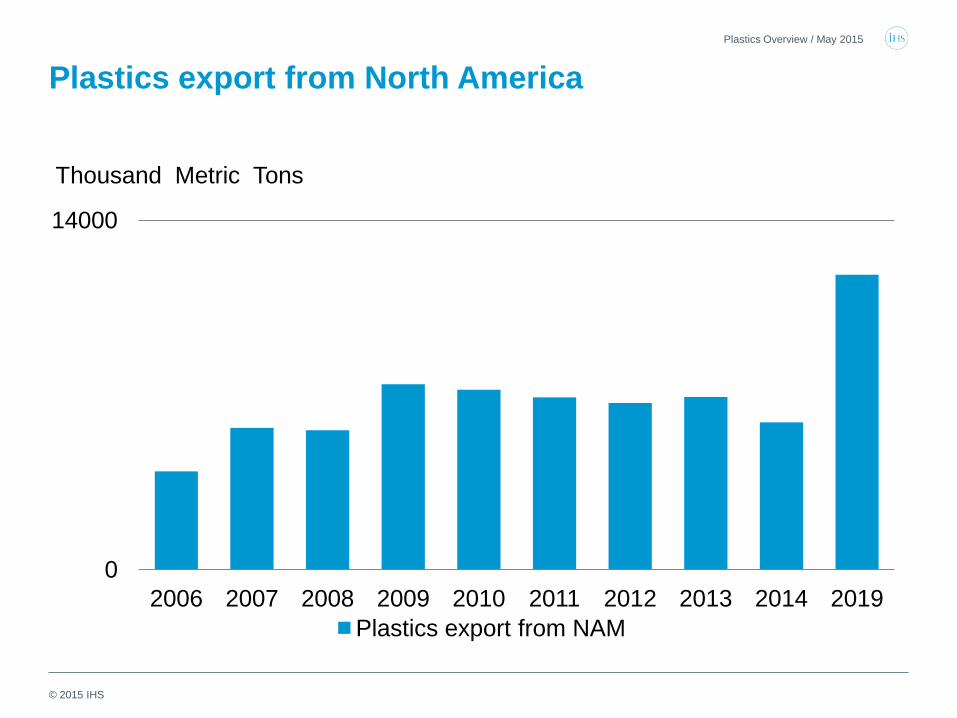
Plastics export from North America
Plastics Overview / May 2015
0
14000
2006 2007 2008 2009 2010 2011 2012 2013 2014 2019 Plastics export from NAM
Thousand Metric Tons
© 2015 IHS
Plastics Overview / May 2015
Conclusions
• Defining factor in new energy world order is OPEC stepping down from the role of supply buffer maintain price.
• All base chemicals and derivatives & plastics markets adjusting to this new energy environment
• Price setters have lower cost…prices will decline unless tight markets exist
• Demand pause, likely to see surge once crude markets are stable; trade patterns likely to shift; look for higher volatility as a result
• Approved new capacity in advantaged regions continue; new projects pause
• Integrated margins for low-cost producers decline, some high-cost producers see margin improvement