Embed Size (px)
Citation preview

Commodity Price Indices and Terms of Trade
(Q1 2020)
NATIONAL BUREAU OF STATISTICS
Report Date: June 2020
Data Source: National Bureau of Statistics (NBS)

Commodity Price Indices And Terms Of Trade – Q1 2020
Highlights
Term of Trade
Commodity Price Index January to March, 2020
All Commodity Group Import Index
All Commodity Group Export Index
Terms of Trade by Commodity
All Region Group Export Index
All Region Group Import Index
Terms of Trade by Country (Regions)
Merchandise Trade By Top Five Partners and By Major Commodities
Appendix
Technical Notes
Acknowledgements/Contacts
1
CONTENTS
1
2
2
7
12
13
19
21
24
39
46
47

machinery and appliances, and Base metals.
- The All commodity group import index decreased by 0.84%. This was driven by a fall in the prices of
Plastic, rubber and articles thereof, Articles of stone, plaster, cement, asbestos, mica, ceramic and
- The All region group import index decreased by 0.84% due to decreases in the prices of goods from
Between January and March 2020 (Jan 2018=100):
Footwear, headgear, umbrellas, sunshades, whips etc.
- The All commodity group export price index decreased by 0.59% due to decreases in Boilers,
- Overall, the all products terms of trade (TOT) index rose 0.26% driven by increase in the prices of
Plastic, rubber and articles thereof, Vegetable products and Wood and articles of wood, wood
charcoal and articles.
- The All region group export index decreased by 0.59% due to decreases in the prices of exports to
all regions.
Europe, Asia and Oceania.
Asia and Europe
- The major export to these countries were crude petroleum and natural gas, while the major imports
were Motor spirits, motor cycles and Gas oil.
- The major trading markets for Nigeria in Q1, 2020 were India, Spain, China, the Netherlands and
- The All region terms of trade on average increased by 0.26% due to improved export prices to
South Africa.
HIGHLIGHTS:
Terms Of Trade
The terms of trade (TOT) represent the ratio between a country's export prices and its import prices. The
ratio is calculated by dividing the price of the exports by the price of the imports, usually in percentage
terms. An increase in the terms of trade between two periods (or when TOT is greater than 100%) means
that the value of exports is increasing relative to the value of imports, and the country can afford more
imports for the same value of exports. For example, an increase in the price of oil between two periods
(with oil production remaining the same) is likely to increase or improve the terms of trade for Nigeria and
vice versa. The TOT is recorded as an index, and can be used as an indicator of an economy's health.
1Commodity Price Indices and Term of Trade - Q1 2020
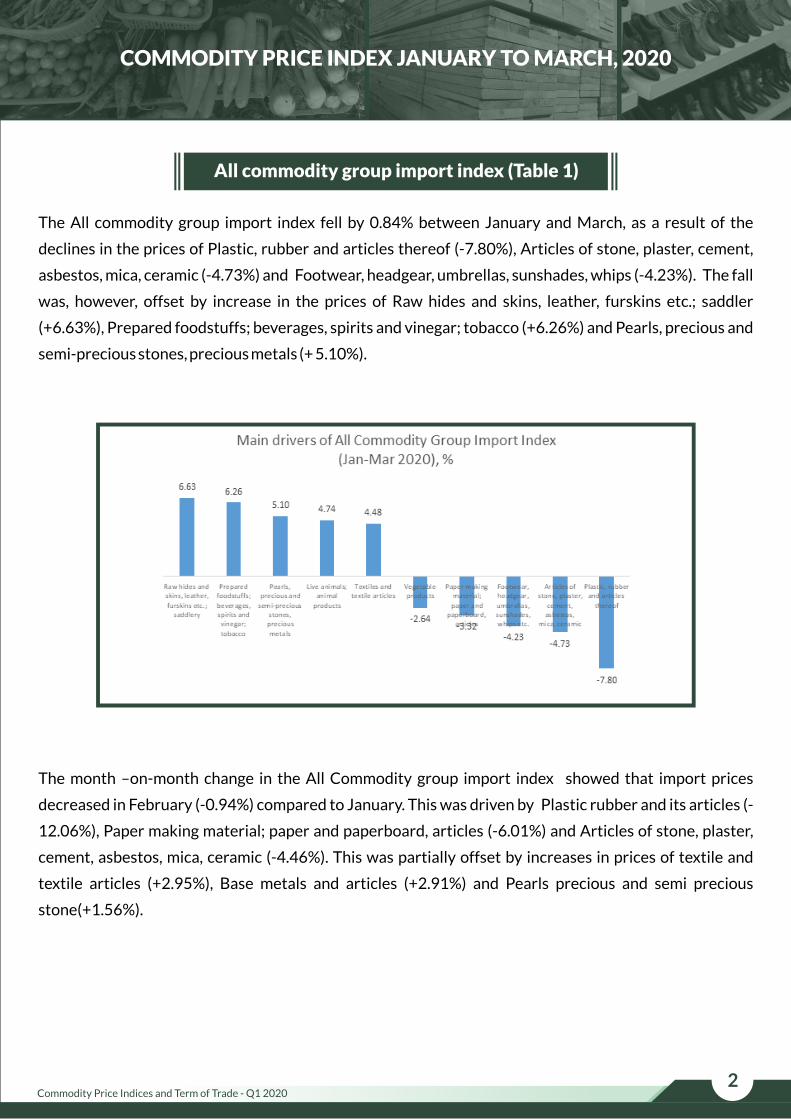
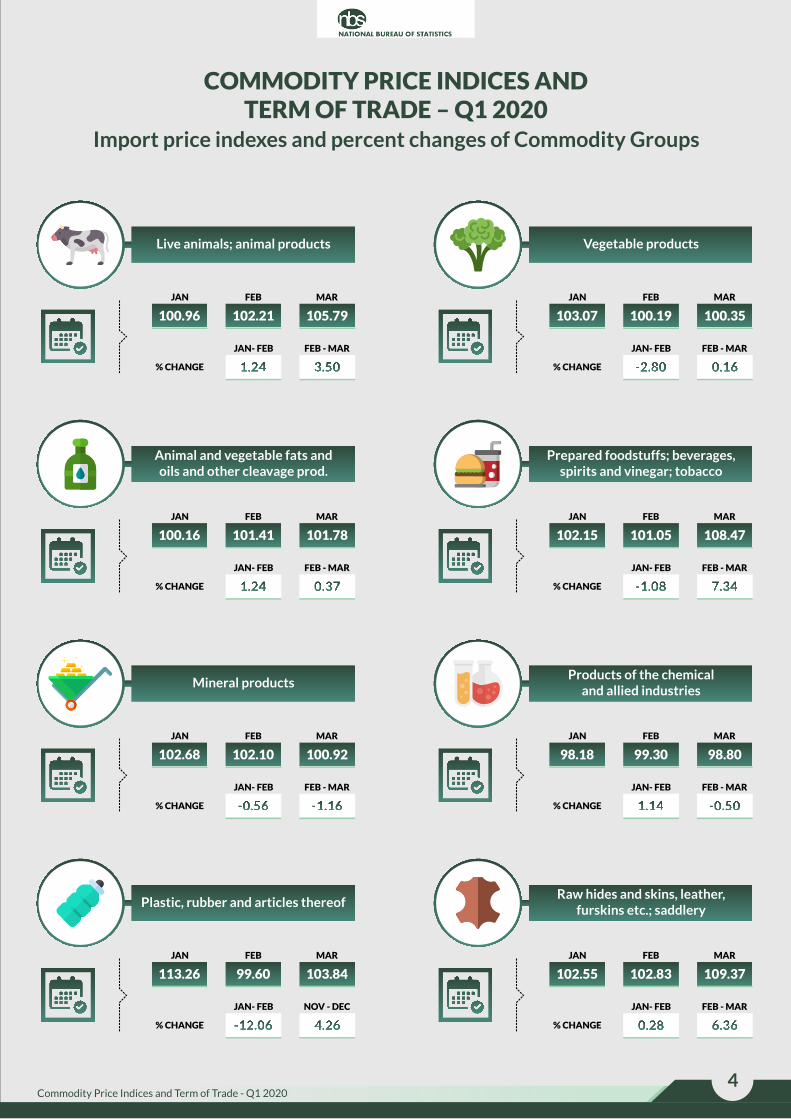
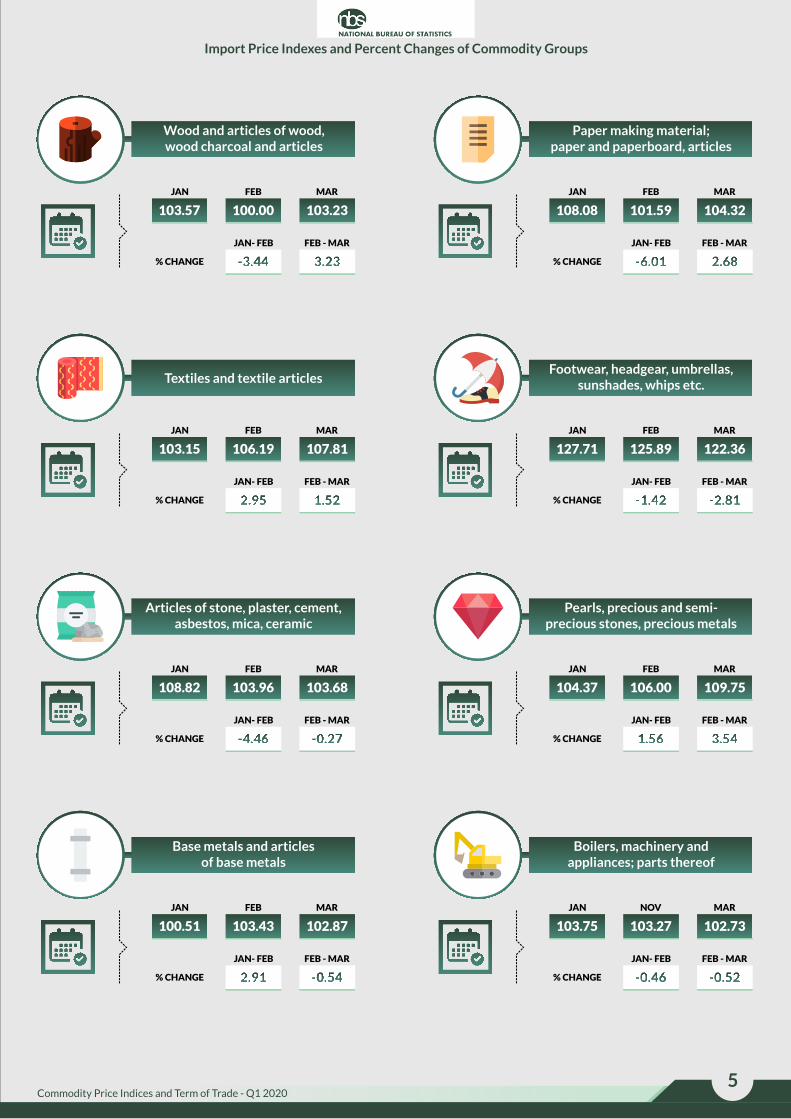
The All commodity group import index fell by 0.84% between January and March, as a result of the
declines in the prices of Plastic, rubber and articles thereof (-7.80%), Articles of stone, plaster, cement,
asbestos, mica, ceramic (-4.73%) and Footwear, headgear, umbrellas, sunshades, whips (-4.23%). The fall
was, however, offset by increase in the prices of Raw hides and skins, leather, furskins etc.; saddler
(+6.63%), Prepared foodstuffs; beverages, spirits and vinegar; tobacco (+6.26%) and Pearls, precious and
semi-precious stones, precious metals (+ 5.10%).
All commodity group import index (Table 1)
COMMODITY PRICE INDEX JANUARY TO MARCH, 2020
The month –on-month change in the All Commodity group import index showed that import prices
decreased in February (-0.94%) compared to January. This was driven by Plastic rubber and its articles (-
12.06%), Paper making material; paper and paperboard, articles (-6.01%) and Articles of stone, plaster,
cement, asbestos, mica, ceramic (-4.46%). This was partially offset by increases in prices of textile and
textile articles (+2.95%), Base metals and articles (+2.91%) and Pearls precious and semi precious
stone(+1.56%).
2Commodity Price Indices and Term of Trade - Q1 2020

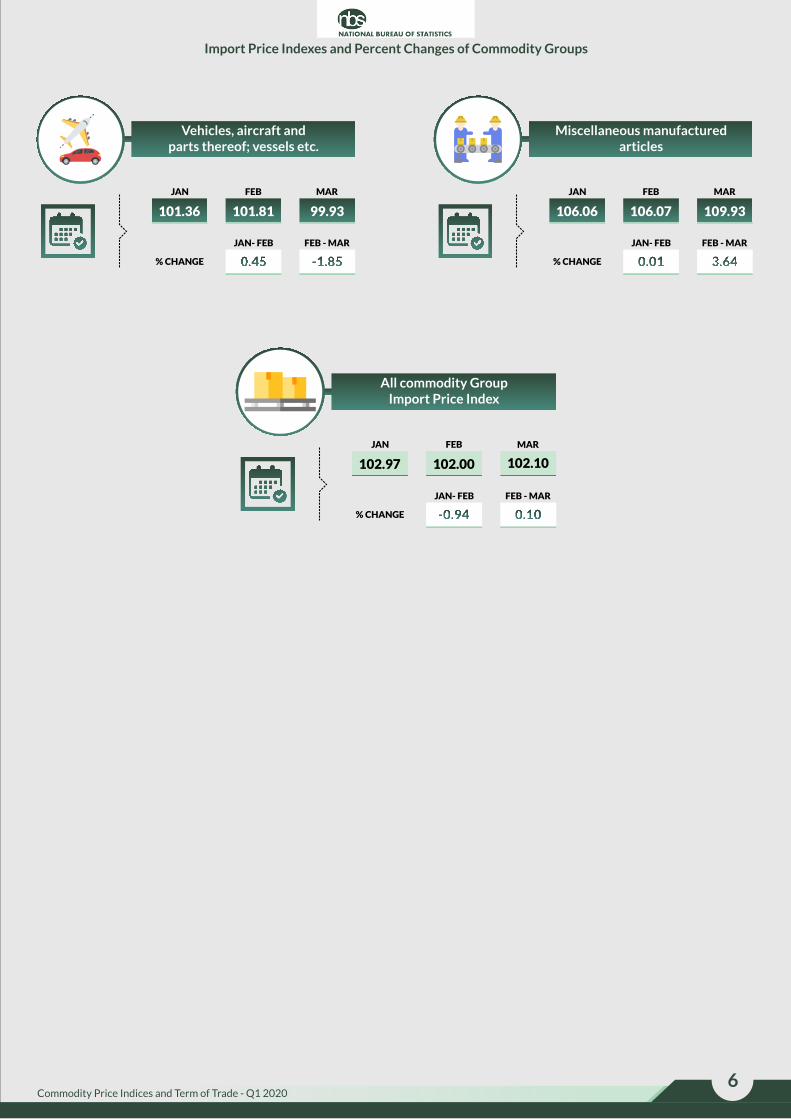
In March 2020, import prices of All commodity groups increased by 0.10% on average.The overall
increase was mainly attributed to the increase in prices of Prepared foodstuffs; beverages, spirits and
vinegar; tobacco(+7.34%), Raw hides and skins, leather, furskins etc.; saddlery (+6.36%) and Plastic,
rubber and articles thereof (+4.26%). However, this was negatively affected by changes in prices of
Footwear, headgear, umbrellas, sunshades, whips etc(-0.81%), Vehicles, aircraft and parts thereof; vessels
etc (-1.85%) and Mineral products (-1.16%).
3Commodity Price Indices and Term of Trade - Q1 2020
COMMODITY PRICE INDICES AND TERM OF TRADE – Q1 2020
Import price indexes and percent changes of Commodity Groups
Live animals; animal products Vegetable products
Animal and vegetable fats and oils and other cleavage prod.
Prepared foodstuffs; beverages, spirits and vinegar; tobacco
Mineral productsProducts of the chemical
and allied industries
Plastic, rubber and articles thereofRaw hides and skins, leather,
furskins etc.; saddlery
100.96
JAN
102.21
FEB
105.79
MAR
1.24
JAN- FEB
3.50
FEB - MAR
% CHANGE
103.07
JAN
100.19
FEB
100.35
MAR
-2.80
JAN- FEB
0.16
FEB - MAR
% CHANGE
102.15
JAN
101.05
FEB
108.47
MAR
-1.08
JAN- FEB
7.34
FEB - MAR
% CHANGE
100.16
JAN
101.41
FEB
101.78
MAR
1.24
JAN- FEB
0.37
FEB - MAR
% CHANGE
98.18
JAN
99.30
FEB
98.80
MAR
1.14
JAN- FEB
-0.50
FEB - MAR
% CHANGE
102.68
JAN
102.10
FEB
100.92
MAR
-0.56
JAN- FEB
-1.16
FEB - MAR
% CHANGE
102.55
JAN
102.83
FEB
109.37
MAR
0.28
JAN- FEB
6.36
FEB - MAR
% CHANGE
113.26
JAN
99.60
FEB
103.84
MAR
-12.06
JAN- FEB
4.26
NOV - DEC
% CHANGE
4Commodity Price Indices and Term of Trade - Q1 2020
Import Price Indexes and Percent Changes of Commodity Groups
Wood and articles of wood, wood charcoal and articles
Paper making material; paper and paperboard, articles
Textiles and textile articlesFootwear, headgear, umbrellas,
sunshades, whips etc.
Articles of stone, plaster, cement, asbestos, mica, ceramic
Pearls, precious and semi-precious stones, precious metals
Base metals and articles of base metals
Boilers, machinery and appliances; parts thereof
108.08
JAN
101.59
FEB
104.32
MAR
-6.01
JAN- FEB
2.68
FEB - MAR
% CHANGE
103.57
JAN
100.00
FEB
103.23
MAR
-3.44
JAN- FEB FEB - MAR
3.23% CHANGE
127.71
JAN
125.89
FEB
122.36
MAR
-1.42
JAN- FEB
-2.81
FEB - MAR
% CHANGE
103.15
JAN
106.19
FEB
107.81
MAR
2.95
JAN- FEB
1.52
FEB - MAR
% CHANGE
104.37
JAN
106.00
FEB
109.75
MAR
1.56
JAN- FEB
3.54
FEB - MAR
% CHANGE
108.82
JAN
103.96
FEB
103.68
MAR
-4.46
JAN- FEB
-0.27
FEB - MAR
% CHANGE
103.75
JAN
103.27
NOV
102.73
MAR
-0.46
JAN- FEB
-0.52
FEB - MAR
% CHANGE
100.51
JAN
103.43
FEB
102.87
MAR
2.91
JAN- FEB
-0.54
FEB - MAR
% CHANGE
5Commodity Price Indices and Term of Trade - Q1 2020
Import Price Indexes and Percent Changes of Commodity Groups
Vehicles, aircraft and parts thereof; vessels etc.
Miscellaneous manufactured articles
102.97 102.00
FEB
102.10
-0.94 0.10% CHANGE
All commodity Group Import Price Index
106.06
JAN
106.07
FEB
109.93
MAR
0.01
JAN- FEB
3.64
FEB - MAR
% CHANGE
101.36
JAN
101.81
FEB
99.93
MAR
0.45
JAN- FEB
-1.85
FEB - MAR
% CHANGE
6
JAN MAR
JAN- FEB FEB - MAR
Commodity Price Indices and Term of Trade - Q1 2020
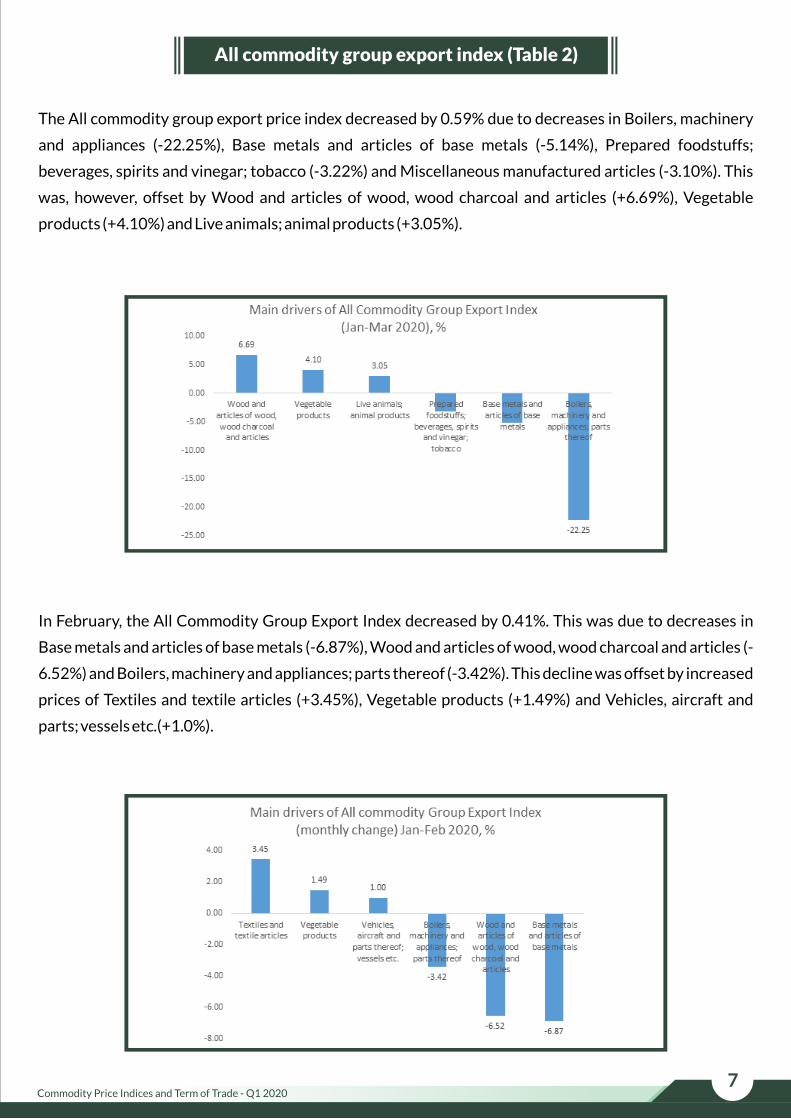
The All commodity group export price index decreased by 0.59% due to decreases in Boilers, machinery
and appliances (-22.25%), Base metals and articles of base metals (-5.14%), Prepared foodstuffs;
beverages, spirits and vinegar; tobacco (-3.22%) and Miscellaneous manufactured articles (-3.10%). This
was, however, offset by Wood and articles of wood, wood charcoal and articles (+6.69%), Vegetable
products (+4.10%) and Live animals; animal products (+3.05%).
All commodity group export index (Table 2)
In February, the All Commodity Group Export Index decreased by 0.41%. This was due to decreases in
Base metals and articles of base metals (-6.87%), Wood and articles of wood, wood charcoal and articles (-
6.52%) and Boilers, machinery and appliances; parts thereof (-3.42%). This decline was offset by increased
prices of Textiles and textile articles (+3.45%), Vegetable products (+1.49%) and Vehicles, aircraft and
parts; vessels etc.(+1.0%).
7Commodity Price Indices and Term of Trade - Q1 2020

The monthly change in March of all commodity export index stood at -0.18%.This decrease can be
attributed to a significant decrease in Boilers, machinery and appliances; parts thereof (-18.83%),
Prepared foodstuffs; beverages, spirits and vinegar; tobacco(-3.90%) and Textiles and textile articles(-
2.34%). The decline was offset by increases in the prices of Wood and articles of wood, wood charcoal and
articles (+13.21%) and Live animals; animal products (+3.59%).
8Commodity Price Indices and Term of Trade - Q1 2020

COMMODITY PRICE INDICES AND TERM OF TRADE – Q1 2020
Export price indexes and percent changes of all Commodities
9
Live animals; animal products Vegetable products
Animal and vegetable fats and oils and other cleavage prod.
Prepared foodstuffs; beverages, spirits and vinegar; tobacco
Mineral productsProducts of the chemical
and allied industries
Plastic, rubber and articles thereofRaw hides and skins, leather,
furskins etc.; saddlery
102.40
JAN
101.84
FEB
105.50
MAR
-0.54
JAN- FEB
3.59
FEB - MAR
% CHANGE
104.67
JAN
106.23
FEB
109.00
MAR
1.49
JAN- FEB
2.61
FEB - MAR
% CHANGE
109.95
JAN
110.69
FEB
106.37
MAR
0.67
JAN- FEB
-3.90
FEB - MAR
% CHANGE
108.75
JAN
108.94
FEB
108.57
MAR
0.18
JAN- FEB
-0.35
FEB - MAR
% CHANGE
105.75
JAN
105.99
FEB
105.52
MAR
0.23
JAN- FEB
-0.44
FEB - MAR
% CHANGE
105.98
JAN
105.52
FEB
105.34
MAR
-0.43
JAN- FEB
-0.17
FEB - MAR
% CHANGE
102.36
JAN
102.57
FEB
102.44
MAR
0.20
JAN- FEB
-0.12
FEB - MAR
% CHANGE
106.22
JAN
105.72
FEB
104.50
MAR
-0.47
JAN- FEB
-1.15
FEB - MAR
% CHANGE
Commodity Price Indices and Term of Trade - Q1 2020

Export price indexes and percent changes of all Commodities
10
Wood and articles of wood, wood charcoal and articles
Paper making material; paper and paperboard, articles
Textiles and textile articlesFootwear, headgear, umbrellas,
sunshades, whips etc.
Articles of stone, plaster, cement, asbestos, mica, ceramic
Base metals and articles of base metals
Boilers, machinery and appliances; parts thereof
96.69
JAN
96.51
FEB
96.68
MAR
-0.19
JAN- FEB
0.18
FEB - MAR
% CHANGE
102.45
JAN
95.78
FEB
108.43
MAR
-6.52
JAN- FEB FEB - MAR
13.21% CHANGE
100.06
JAN
100.41
FEB
100.54
MAR
0.35
JAN- FEB
0.13
FEB - MAR
% CHANGE
98.08
JAN
101.47
FEB
99.10
MAR
3.45
JAN- FEB
-2.34
FEB - MAR
% CHANGE
108.93
JAN
101.45
FEB
103.20
MAR
-6.87
JAN- FEB
1.73
FEB - MAR
% CHANGE
103.78
JAN
103.70
FEB
103.76
MAR
-0.08
JAN- FEB
0.06
FEB - MAR
% CHANGE
100.39
JAN
101.39
FEB
101.23
MAR
1.00
JAN- FEB
-0.16
FEB - MAR
% CHANGE
105.92
JAN
102.30
FEB
83.03
MAR
-3.42
JAN- FEB
-18.83
FEB - MAR
% CHANGE
Vehicles, aircraft and parts thereof; vessels etc.
Commodity Price Indices and Term of Trade - Q1 2020

11
Miscellaneous manufactured articles
105.98
JAN
105.55
FEB
105.36
MAR
-0.41
JAN- FEB
-0.18
FEB - MAR
% CHANGE
98.52
JAN
96.52
FEB
95.49
MAR
-2.04
JAN- FEB
-1.06
FEB - MAR
% CHANGE
All commodity Group Export Price Index
Commodity Price Indices and Term of Trade - Q1 2020
Export price indexes and percent changes of all Commodities
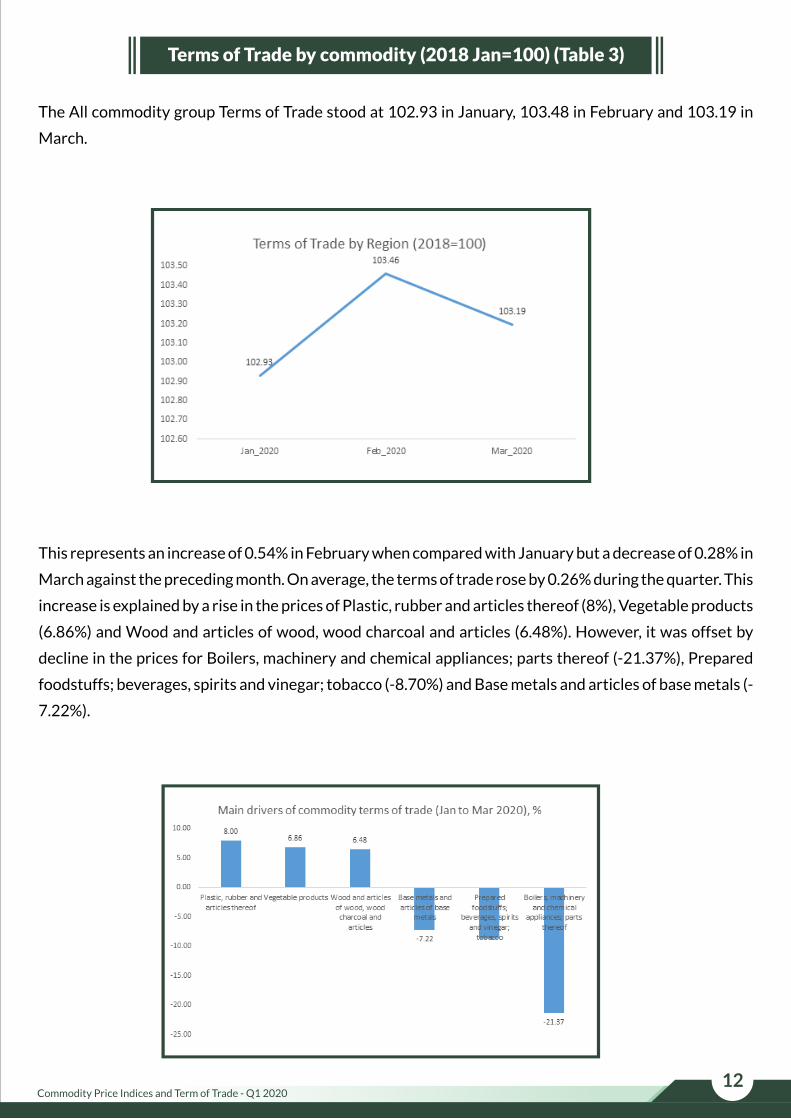
Terms of Trade by commodity (2018 Jan=100) (Table 3)
The All commodity group Terms of Trade stood at 102.93 in January, 103.48 in February and 103.19 in
March.
12
This represents an increase of 0.54% in February when compared with January but a decrease of 0.28% in
March against the preceding month. On average, the terms of trade rose by 0.26% during the quarter. This
increase is explained by a rise in the prices of Plastic, rubber and articles thereof (8%), Vegetable products
(6.86%) and Wood and articles of wood, wood charcoal and articles (6.48%). However, it was offset by
decline in the prices for Boilers, machinery and chemical appliances; parts thereof (-21.37%), Prepared
foodstuffs; beverages, spirits and vinegar; tobacco (-8.70%) and Base metals and articles of base metals (-
7.22%).
Commodity Price Indices and Term of Trade - Q1 2020

All Region Group export index (Table 4)
The All region group export index fell by 0.59% between January and March due to declines in the prices of
exports to all regions. The month –on-month change showed that the all region export index fell in
February by -0.41%, and in March by -0.18%.
13Commodity Price Indices and Term of Trade - Q1 2020
In February 2020, the main cause of the decline in the index were lower prices in Europe (-1.03%), America
(-0.08%) and Oceania (-0.02%). However, this decline was partially offset by Africa (+0.5%) and Asia
(+0.08%).

14
Between February and March, the monthly change in All Region export index stood at -0.18%. This is
explained by the decreases in export prices to Africa (-0.44%), America (-0.39%), Asia (-0.25%) and Europe
(-0.01%).
Commodity Price Indices and Term of Trade - Q1 2020
COMMODITY PRICE INDICES AND TERM OF TRADE – Q1 2020
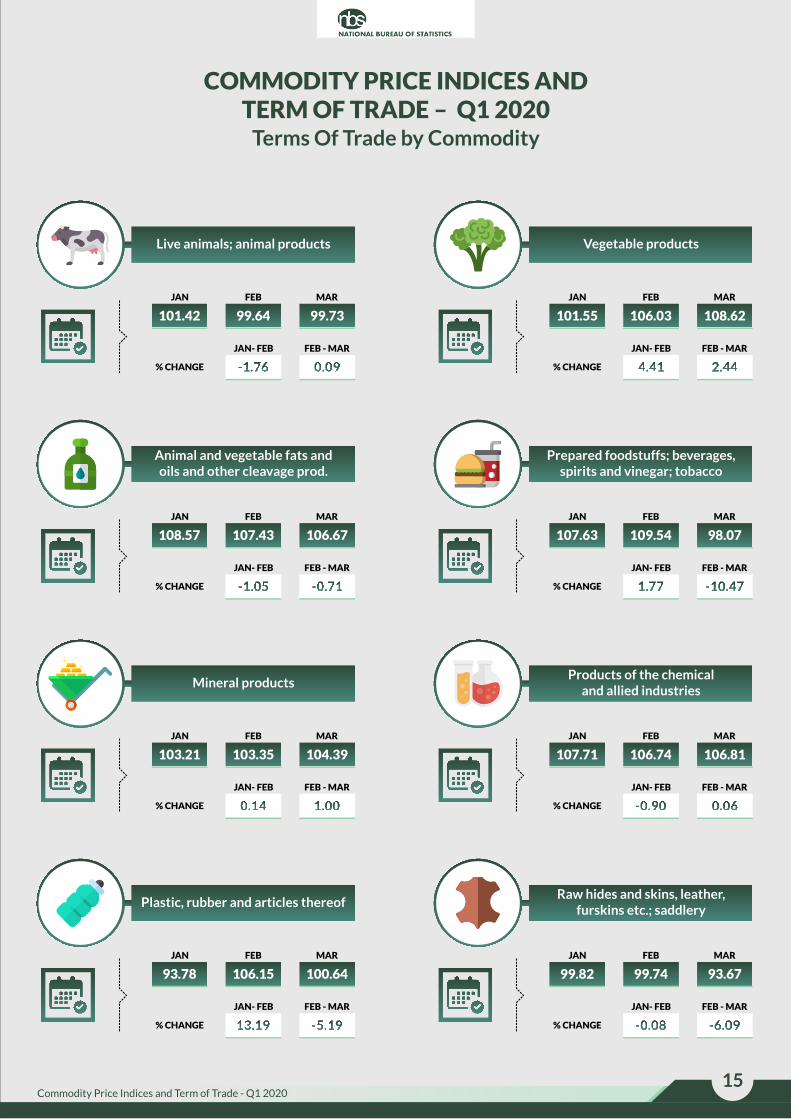
Terms Of Trade by Commodity
15
Live animals; animal products Vegetable products
Animal and vegetable fats and oils and other cleavage prod.
Prepared foodstuffs; beverages, spirits and vinegar; tobacco
Mineral productsProducts of the chemical
and allied industries
Plastic, rubber and articles thereofRaw hides and skins, leather,
furskins etc.; saddlery
101.42
JAN
99.64
FEB
99.73
MAR
-1.76
JAN- FEB
0.09
FEB - MAR
% CHANGE
101.55
JAN
106.03
FEB
108.62
MAR
4.41
JAN- FEB
2.44
FEB - MAR
% CHANGE
107.63
JAN
109.54
FEB
98.07
MAR
1.77
JAN- FEB
-10.47
FEB - MAR
% CHANGE
108.57
JAN
107.43
FEB
106.67
MAR
-1.05
JAN- FEB
-0.71
FEB - MAR
% CHANGE
107.71
JAN
106.74
FEB
106.81
MAR
-0.90
JAN- FEB
0.06
FEB - MAR
% CHANGE
103.21
JAN
103.35
FEB
104.39
MAR
0.14
JAN- FEB
1.00
FEB - MAR
% CHANGE
99.82
JAN
99.74
FEB
93.67
MAR
-0.08
JAN- FEB
-6.09
FEB - MAR
% CHANGE
93.78
JAN
106.15
FEB
100.64
MAR
13.19
JAN- FEB
-5.19
FEB - MAR
% CHANGE
Commodity Price Indices and Term of Trade - Q1 2020

Terms Of Trade by Commodity
16
Wood and articles of wood, wood charcoal and articles
Paper making material; paper and paperboard, articles
Textiles and textile articlesFootwear, headgear, umbrellas,
sunshades, whips etc.
Articles of stone, plaster, cement, asbestos, mica, ceramic
Base metals and articles of base metals
Boilers, machinery and appliances; parts thereof
89.45
JAN
94.99
FEB
92.68
MAR
6.19
JAN- FEB
-2.44
FEB - MAR
% CHANGE
98.93
JAN
95.78
FEB
105.03
MAR
-3.18
JAN- FEB FEB - MAR
9.66% CHANGE
78.35
JAN
79.76
FEB
82.17
MAR
1.79
JAN- FEB
3.02
FEB - MAR
% CHANGE
95.09
JAN
95.55
FEB
91.92
MAR
0.49
JAN- FEB
-3.80
FEB - MAR
% CHANGE
108.38
JAN
98.08
FEB
100.32
MAR
-9.50
JAN- FEB
2.29
FEB - MAR
% CHANGE
95.37
JAN
99.75
FEB
100.07
MAR
4.59
JAN- FEB
0.33
FEB - MAR
% CHANGE
99.04
JAN
99.58
FEB
101.29
MAR
0.55
JAN- FEB
1.71
FEB - MAR
% CHANGE
102.09
JAN
99.06
FEB
80.83
MAR
-2.97
JAN- FEB
-18.40
FEB - MAR
% CHANGE
Vehicles, aircraft and parts thereof; vessels etc.
Commodity Price Indices and Term of Trade - Q1 2020

Terms Of Trade by Commodity
17
Miscellaneous manufactured articles
102.93
JAN
103.48
FEB
103.19
MAR
0.54
JAN- FEB
-0.28
FEB - MAR
% CHANGE
92.89
JAN
90.99
FEB
86.86
MAR
-2.05
JAN- FEB
-4.54
FEB - MAR
% CHANGE
All commodity Group Export Price Index
Commodity Price Indices and Term of Trade - Q1 2020

COMMODITY PRICE INDICES AND TERM OF TRADE – Q1 2020Export Price Indexes by Region
All Region Group Export Index
AFRICA
AMERICA
ASIA
EUROPE
OCEANIA
105.98 105.55 105.36
-0.41
JAN - FEB
-0.18
FEB - MAR
% CHANGE
JAN FEB MAR
105.201
JAN
105.729 105.262
MAR
0.502
JAN - FEB
-0.442
FEB - MAR
% CHANGE
FEB
100.915
JAN
100.829 100.437
MAR
-0.085
JAN - FEB
-0.389
FEB - MAR
% CHANGE
FEB
108.297
JAN
108.379 108.113
MAR
0.076
JAN - FEB
-0.246
FEB - MAR
% CHANGE
FEB
106.318
JAN
105.221 105.206
MAR
-1.032
JAN - FEB
-0.014
FEB - MAR
% CHANGE
FEB
102.958
JAN
102.936 102.940
MAR
-0.021
JAN - FEB
0.004
FEB - MAR
% CHANGE
FEB
18Commodity Price Indices and Term of Trade - Q1 2020

All Region Group import index (Table 5)
The All region group import index fell by 0.84% on average, following a decrease of 0.92% in February and
an increase of 0.08% in March.
This was due to declines in import prices of goods from Europe (-2.16%), Asia (-1.76%) and Oceania (-
0.29%), but offset by increases in import prices from America (+8.08%) and Africa(+0.95%).
19Commodity Price Indices and Term of Trade - Q1 2020

In February, the All region group import index fell by 0.92% as a result of declines in import prices from
Africa (-3.09%), Asia (-1.37%), Europe (-0.63%) and America (-0.21%). The decline was offset by higher
prices in Oceania which rose by 1.05%.
20Commodity Price Indices and Term of Trade - Q1 2020
In March, the All region group import index increased marginally by 0.08% largely due to increase in
import prices from America (+8.29%) and Africa (+4.04%), while falling prices were recorded in Europe (-
1.53%), Oceania (-1.34%) and Asia (-0.39%).

The All Region group terms of trade was recorded at 102.93 in January, rising to 103.46 in February and
slightly declining 103.19 in March.
Terms of Trade by Regions [2018 Jan=100] (Table 6)
21Commodity Price Indices and Term of Trade - Q1 2020
In effect, the terms of trade rose by 0.52% in February against January, but fell by 0.26% in March
compared to February. Overall, the All region terms of trade rose by 0.26% due to improved export prices
to Asia (+1.61%) and Europe (+1.14%) but was negatively affected by export price declines in America(-
7.89%) and Africa (-0.60%).

COMMODITY PRICE INDICES AND TERM OF TRADE – Q1 2020
Import Price Indexes by Region Percent Changes
22
All Region Group Import Index
Commodity Price Indices and Term of Trade - Q1 2020
AFRICA
AMERICA
ASIA
EUROPE
OCEANIA
102.97 102.02 102.10
-0.92
JAN - FEB
0.08
FEB - MAR
% CHANGE
JAN FEB MAR
105.40
JAN
102.1 106.3
MAR
-3.09
JAN - FEB
4.04
FEB - MAR
% CHANGE
FEB
101.67
JAN
101.5 109.9
MAR
-0.21
JAN - FEB
8.29
FEB - MAR
% CHANGE
FEB
103.03
JAN
101.6 101.2
MAR
-1.37
JAN - FEB
-0.39
FEB - MAR
% CHANGE
FEB
103.05
JAN
102.4 100.8
MAR
-0.63
JAN - FEB
-1.53
FEB - MAR
% CHANGE
FEB
101.41
JAN
102.5 101.1
MAR
1.05
JAN - FEB
-1.34
FEB - MAR
% CHANGE
FEB

COMMODITY PRICE INDICES AND TERM OF TRADE – Q1 2020
Terms of Trade by (REGIONS)
99.81
JAN
103.50
FEB
99.05
MAR
105.11
JAN
106.65
FEB
106.81
MAR
101.53
JAN
100.45
FEB
101.81
MAR
99.25
JAN
99.38
FEB
91.41
MAR
103.17
JAN
102.75
FEB
104.33
MAR
102.93
JAN
103.46
FEB
103.19
MAR
23Commodity Price Indices and Term of Trade - Q1 2020
AFRICA AMERICA
ASIA EUROPE
OCEANIA ALL REGION TERMS OF TRADE
0.12
JAN - FEB
-8.02
FEB - MAR
-0.40
JAN - FEB
1.54
FEB - MAR
0.52
JAN - FEB
-0.26
FEB - MAR
% CHANGE
% CHANGE
% CHANGE
3.70
JAN - FEB
-4.30
FEB - MAR
1.46
JAN - FEB
0.15
FEB - MAR
% CHANGE
% CHANGE
-1.06
JAN - FEB
1.36
FEB - MAR
% CHANGE
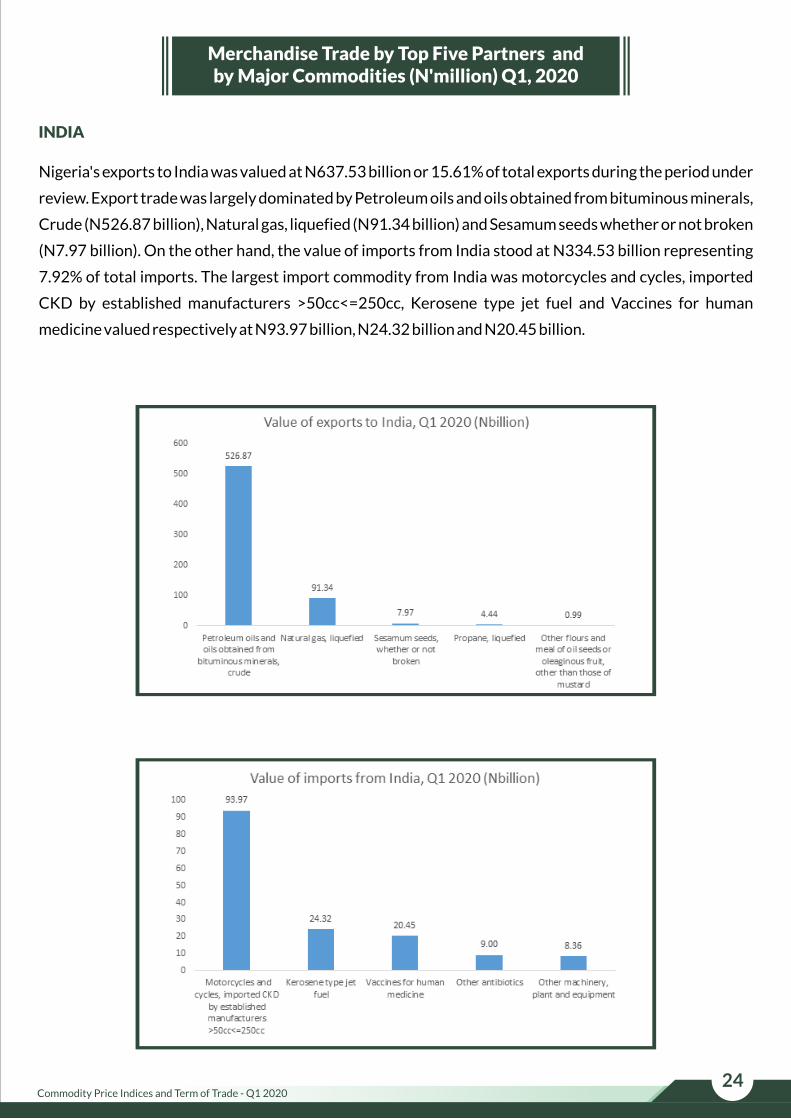
Merchandise Trade by Top Five Partners and by Major Commodities (N'million) Q1, 2020
Nigeria's exports to India was valued at N637.53 billion or 15.61% of total exports during the period under
review. Export trade was largely dominated by Petroleum oils and oils obtained from bituminous minerals,
Crude (N526.87 billion), Natural gas, liquefied (N91.34 billion) and Sesamum seeds whether or not broken
(N7.97 billion). On the other hand, the value of imports from India stood at N334.53 billion representing
7.92% of total imports. The largest import commodity from India was motorcycles and cycles, imported
CKD by established manufacturers >50cc<=250cc, Kerosene type jet fuel and Vaccines for human
medicine valued respectively at N93.97 billion, N24.32 billion and N20.45 billion.
INDIA
24Commodity Price Indices and Term of Trade - Q1 2020

COMMODITY PRICE INDICES AND TERM OF TRADE – Q1 2020
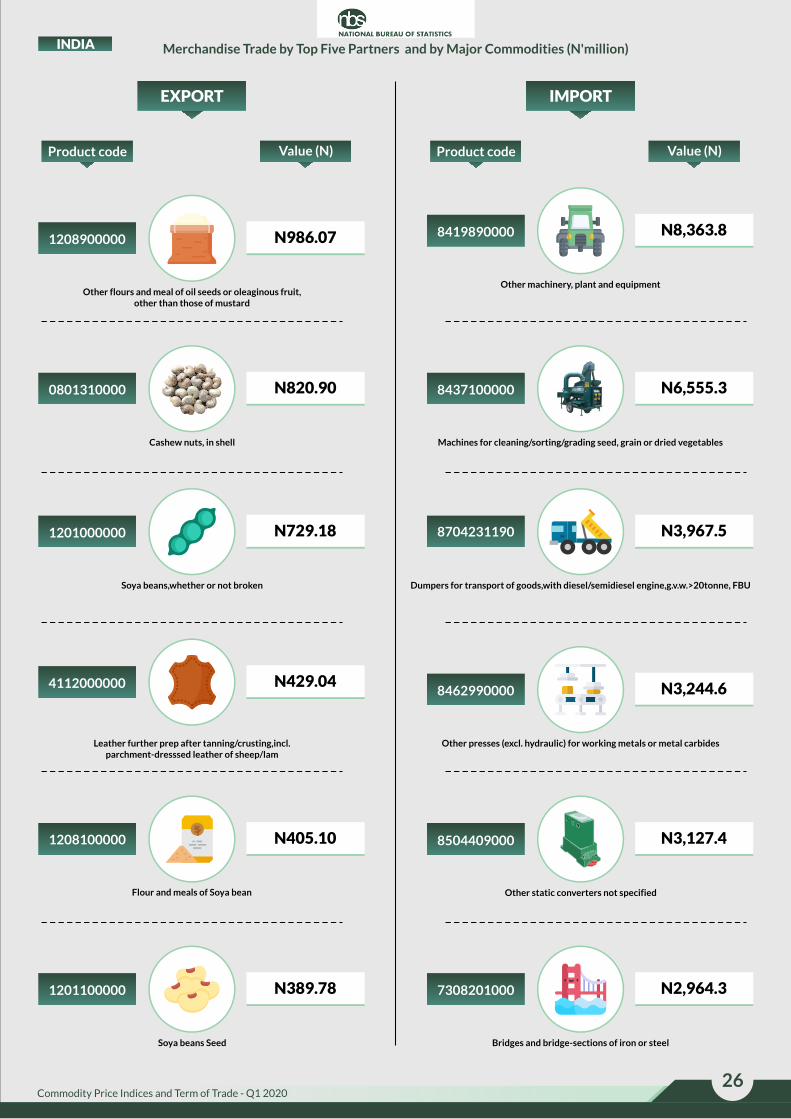
Merchandise Trade by Top Five Partners and by Major Commodities (N'million)
25
INDIA
2709000000 N526,874.03
Product code Value (N)
2711110000 N91,340.88
1207400000 N7,966.05
8711201000 N93,968.2
Product code Value (N)
3002200000 N20,453.1
3004909000 N9,001.1
EXPORT IMPORT
Petroleum oils and oils obtained from bituminous minerals, crude
Natural gas, liquefied
motorcycles and cycles, imported CKD by established manufacturers >50cc<=250cc
Other antibiotics
Vaccines for human medicine
2711120000 N4,436.26
2710191100 N24,324.8
Kerosene type jet fuel
Sesamum seeds, whether or not broken
Commodity Price Indices and Term of Trade - Q1 2020
Propane, liquefied
INDIA
26
Merchandise Trade by Top Five Partners and by Major Commodities (N'million)
Product code Value (N)
1208100000
1201100000
N405.10
N389.78
Product code Value (N)
8437100000 N6,555.3
8462990000
8504409000
7308201000
N3,244.6
N3,127.4
N2,964.3
EXPORT IMPORT
Other presses (excl. hydraulic) for working metals or metal carbides
Other static converters not specified
Bridges and bridge-sections of iron or steel
1208900000 N986.07
0801310000 N820.90
Other flours and meal of oil seeds or oleaginous fruit, other than those of mustard
4112000000 N429.04
Flour and meals of Soya bean
1201000000 N729.18
Soya beans,whether or not broken
8419890000 N8,363.8
Other machinery, plant and equipment
Commodity Price Indices and Term of Trade - Q1 2020
Cashew nuts, in shell
Leather further prep after tanning/crusting,incl. parchment-dresssed leather of sheep/lam
Soya beans Seed
Machines for cleaning/sorting/grading seed, grain or dried vegetables
8704231190 N3,967.5
Dumpers for transport of goods,with diesel/semidiesel engine,g.v.w.>20tonne, FBU
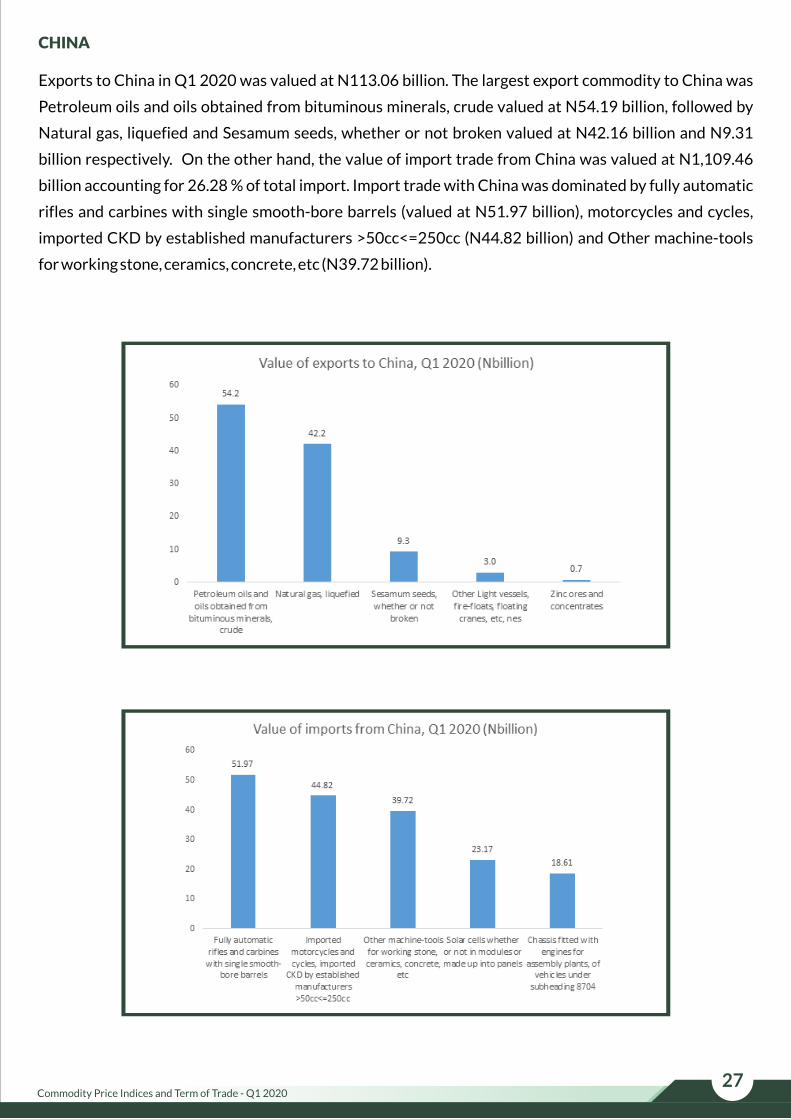
Exports to China in Q1 2020 was valued at N113.06 billion. The largest export commodity to China was
Petroleum oils and oils obtained from bituminous minerals, crude valued at N54.19 billion, followed by
Natural gas, liquefied and Sesamum seeds, whether or not broken valued at N42.16 billion and N9.31
billion respectively. On the other hand, the value of import trade from China was valued at N1,109.46
billion accounting for 26.28 % of total import. Import trade with China was dominated by fully automatic
rifles and carbines with single smooth-bore barrels (valued at N51.97 billion), motorcycles and cycles,
imported CKD by established manufacturers >50cc<=250cc (N44.82 billion) and Other machine-tools
for working stone, ceramics, concrete, etc (N39.72 billion).
CHINA
27Commodity Price Indices and Term of Trade - Q1 2020

COMMODITY PRICE INDICES AND TERM OF TRADE – Q1 2020
CHINA
N54,185.5
Product code Value (N)
1207400000 N9,309.5
Product code Value (N)
EXPORT IMPORT
Natural gas, liquefied
8905900000 N2,975.0
Other Light vessels, fire-floats, floating cranes, etc, nes
8711201000 N44,819.14
8464900000 N39,720.39
Imported motorcycles and cycles, imported CKD by established manufacturers >50cc<=250cc
9301901100 N51,974.782709000000
N42,164.4
Petroleum oils and oils obtained from bituminous minerals, crude
8541401000 N23,169.00
Solar cells whether or not in modules or made up into panels
2711110000
Other machine-tools for working stone, ceramics, concrete, etc
28
Merchandise Trade by Top Five Partners and by Major Commodities (N'million)
Commodity Price Indices and Term of Trade - Q1 2020
Sesamum seeds, whether or not broken
Fully automatic rifles and carbines with single smooth-bore barrels
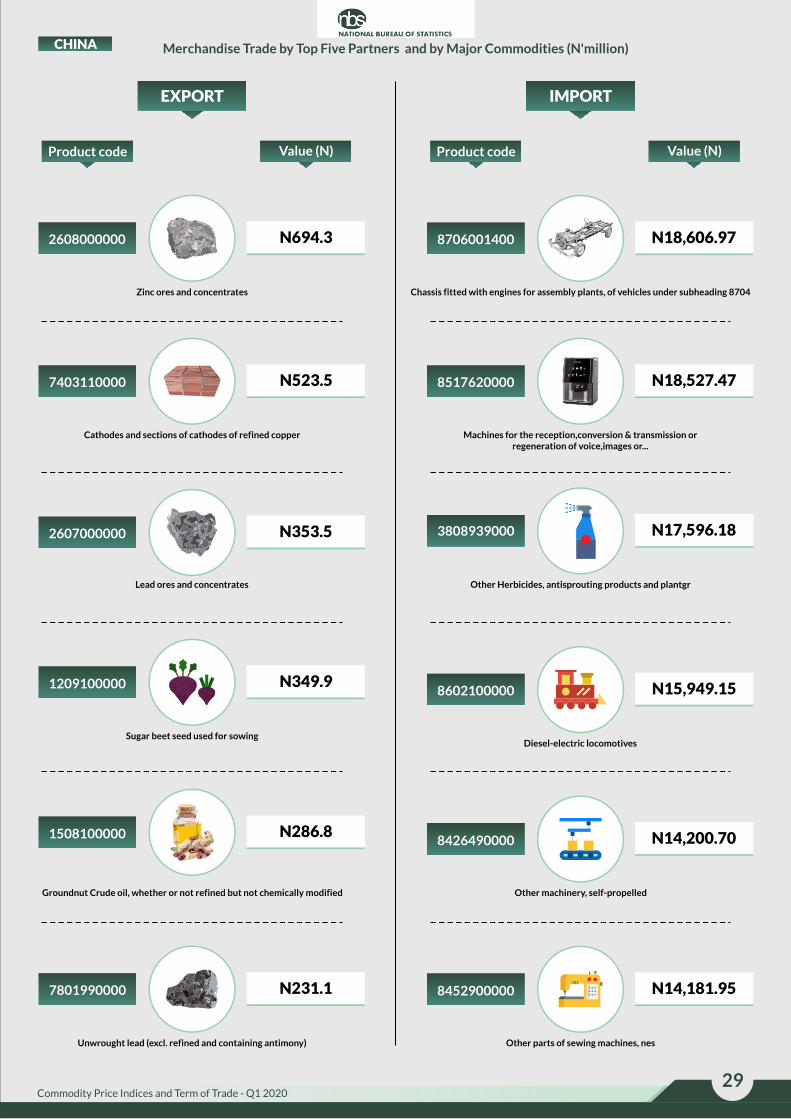
2608000000 N694.3
Product code Value (N) Product code Value (N)
8602100000
8426490000
N15,949.15
N14,200.70
EXPORT IMPORT
CHINA
Diesel-electric locomotives
7403110000 N523.5
2607000000 N353.5
1508100000 N286.8
Sugar beet seed used for sowing
8706001400 N18,606.97
Chassis fitted with engines for assembly plants, of vehicles under subheading 8704
8517620000 N18,527.47
3808939000 N17,596.18
1209100000 N349.9
7801990000 N231.1 8452900000 N14,181.95
Groundnut Crude oil, whether or not refined but not chemically modified
Machines for the reception,conversion & transmission or regeneration of voice,images or...
29
Merchandise Trade by Top Five Partners and by Major Commodities (N'million)
Commodity Price Indices and Term of Trade - Q1 2020
Zinc ores and concentrates
Cathodes and sections of cathodes of refined copper
Lead ores and concentrates
Unwrought lead (excl. refined and containing antimony)
Other Herbicides, antisprouting products and plantgr
Other machinery, self-propelled
Other parts of sewing machines, nes
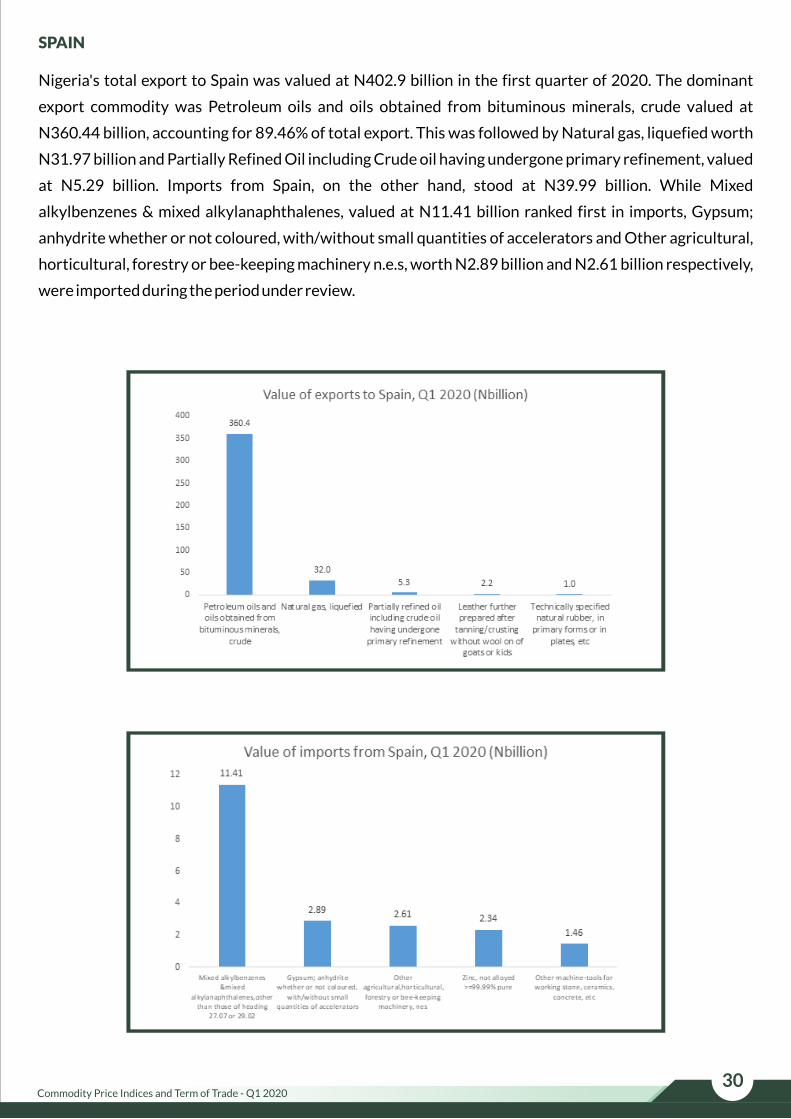
Nigeria's total export to Spain was valued at N402.9 billion in the first quarter of 2020. The dominant
export commodity was Petroleum oils and oils obtained from bituminous minerals, crude valued at
N360.44 billion, accounting for 89.46% of total export. This was followed by Natural gas, liquefied worth
N31.97 billion and Partially Refined Oil including Crude oil having undergone primary refinement, valued
at N5.29 billion. Imports from Spain, on the other hand, stood at N39.99 billion. While Mixed
alkylbenzenes & mixed alkylanaphthalenes, valued at N11.41 billion ranked first in imports, Gypsum;
anhydrite whether or not coloured, with/without small quantities of accelerators and Other agricultural,
horticultural, forestry or bee-keeping machinery n.e.s, worth N2.89 billion and N2.61 billion respectively,
were imported during the period under review.
SPAIN
30Commodity Price Indices and Term of Trade - Q1 2020

COMMODITY PRICE INDICES AND TERM OF TRADE – Q1 2020
SPAIN
2709000000 N360,443.8
Product code Value (N)
2711110000 N31,968.0
2710111000 N5,290.7
4113100000 N2,229.9
3817000000 N11,407.0
Product code Value (N)
2520100000 N2,892.5
8436800000 N2,610.1
7901110000 N2,344.6
EXPORT IMPORT
Petroleum oils and oils obtained from bituminous minerals, crude
Natural gas, liquefied
Partially refined oil including crude oil having undergone primary refinement
Leather further prepared after tanning/crusting without wool on of goats or kids
Mixed alkylbenzenes &mixed alkylanaphthalenes,other than those of heading 27.07 or 29.02
Gypsum; anhydrite whether or not coloured, with/without small quantities of accelerators
Other agricultural,horticultural, forestry or bee-keeping machinery, nes
Zinc, not alloyed >=99.99% pure
31
Merchandise Trade by Top Five Partners and by Major Commodities (N'million)
Commodity Price Indices and Term of Trade - Q1 2020

SPAIN
Product code Value (N)
1804000000 N101.3
Product code Value (N)
2202901000
8441100000 N951.7
EXPORT IMPORT
Cocoa butter, fat and oil
Beverages containing high doses of caffeine of the kind Energy drinks
Cutting machines for paper pulp, paper or paperboard
7403110000 N234.6
Cathodes and sections of cathodes of refined copper
4001220000 N1,036.8
8425310000 N313.0
Other winches, capstans, powered by electric motor
7801990000 N397.1
Unwrought lead (excl. refined and containing antimony)
8419810000 N825.4
8419400000 N1,370.4
Distilling or rectifying plant
8464900000 N1,462.3
Other machine-tools for working stone, ceramics, concrete, etc
1803100000 N468.7
Cocoa paste, not defatted
6908900000 N1,053.0
Glazed ceramic flags and paving, hearth or wall tiles, etc, nes
N1,014.2
32
Merchandise Trade by Top Five Partners and by Major Commodities (N'million)
Commodity Price Indices and Term of Trade - Q1 2020
Technically specified natural rubber, in primary forms or in plates, etc
Other machinery,plant and equipment for making hot drinks or for cooking or heating food

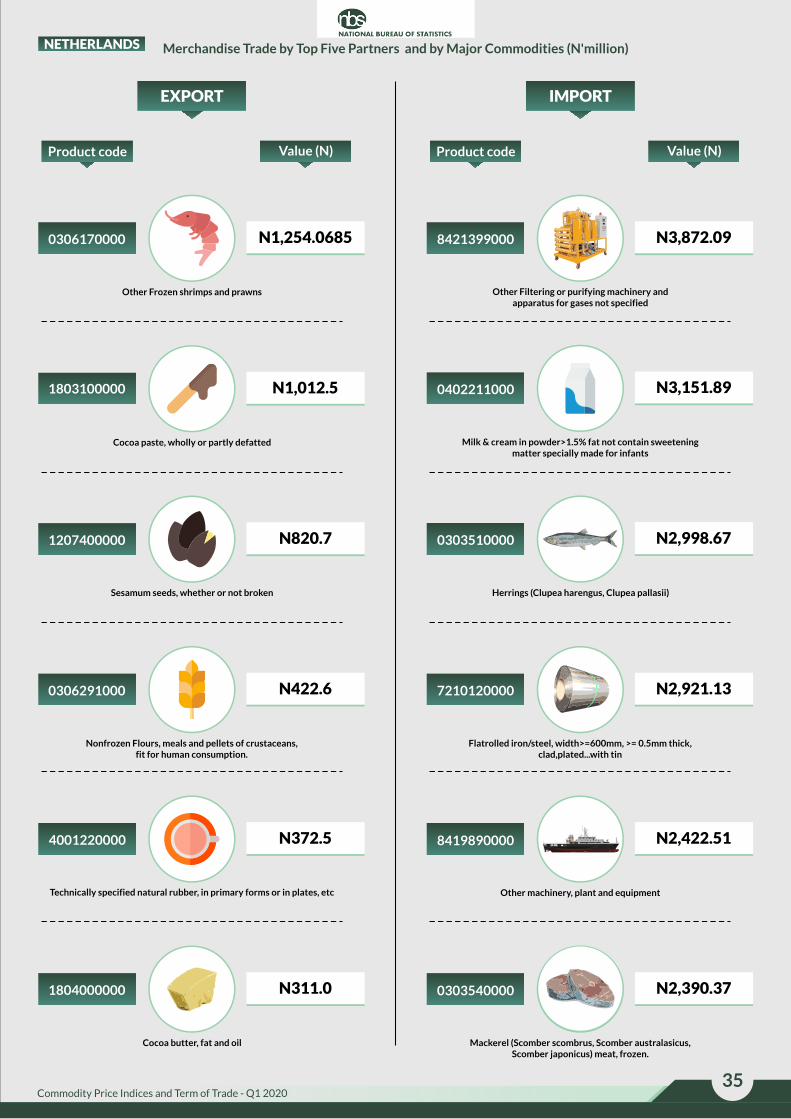
Nigeria's export trade with the Netherlands, in Q1 2020, was valued at N396.93 billion. The major export
commodities were: Petroleum oils and oils obtained from bituminous minerals, crude valued at N360.70
billion, as well as Good fermented Nigerian cocoa beans, and Superior quality raw cocoa beans,
respectively valued at N16.53 billion and N11.22 billion. Conversely, the value of imports stood at
N470.11 billion, with the main commodity imported being Motor Spirits ordinary, valued at N303.65
billion. Other products imported were Gas oils (N102.82 billion) and Kerosene type jet fuel (N4.52 billion).
THE NETHERLANDS
33Commodity Price Indices and Term of Trade - Q1 2020

34Commodity Price Indices and Term of Trade - Q1 2020
COMMODITY PRICE INDICES AND TERM OF TRADE – Q1 2020
NETHERLANDS
2709000000 N360,698.5
Product code Value (N)
1801000000 N16,530.1
2710115000 303,648.92
Product code Value (N)
2710192100 N102,821.55
2710191100 N4,521.20
0303680000 N4,247.71
EXPORT IMPORT
Petroleum oils and oils obtained from bituminous minerals, crude Motor Spirit ordinary
Gas Oil
2711110000 N3,160.6
1801001100 N11,216.1
Superior quality raw cocoa beans
Natural gas, liquefied Blue whitings (Micromesistius poutassou, Micromesistius australis) meat, frozen.
Kerosene type jet fuel
Good Fermented Nigerian Cocoa Beans - Main Crop 2015/2016
Merchandise Trade by Top Five Partners and by Major Commodities (N'million)
35Commodity Price Indices and Term of Trade - Q1 2020
NETHERLANDS Merchandise Trade by Top Five Partners and by Major Commodities (N'million)
0306170000 N1,254.0685
Product code Value (N)
1803100000 N1,012.5
1207400000 N820.7
0306291000
4001220000
N422.6
N372.5
8421399000 N3,872.09
Product code Value (N)
7210120000
8419890000
N2,921.13
N2,422.51
EXPORT IMPORT
Other Frozen shrimps and prawns
Technically specified natural rubber, in primary forms or in plates, etc
Nonfrozen Flours, meals and pellets of crustaceans, fit for human consumption.
Other Filtering or purifying machinery and apparatus for gases not specified
Flatrolled iron/steel, width>=600mm, >= 0.5mm thick,clad,plated...with tin
Other machinery, plant and equipment
0303510000 N2,998.67
Herrings (Clupea harengus, Clupea pallasii)
0402211000 N3,151.89
Milk & cream in powder>1.5% fat not contain sweetening matter specially made for infants
1804000000 N311.0 0303540000 N2,390.37
Cocoa butter, fat and oil Mackerel (Scomber scombrus, Scomber australasicus, Scomber japonicus) meat, frozen.
Sesamum seeds, whether or not broken
Cocoa paste, wholly or partly defatted

In Q1 2020, Nigeria's exports to South Africa was valued at N319.47billion, representing 7.8% of total
exports. The major commodities exported during the period were Petroleum oils and oils obtained from
bituminous minerals, crude (N318.5 billion), Technically specified natural rubber, in primary forms or in
plates (N0.3billion), Sesamum seeds, whether or not broken (N0.3billion), Ginger, neither crushed nor
ground (N0.2 billion) and Refined lead, unwrought (N0.1billion). On the import side, imports from South
Africa were valued at N40.6 billion or 0.96% of total imports during the period under review. The main
commodities imported were Polypropylene, in primary forms (N9.02 billion), Apples, fresh (N2.66billion),
Chassis fitted with engines for assembly plants (N2.14billion), Other ships' derricks; cranes, including
cable cranes; mobile lifting frames (N1.54billion) and Others imported by MV assemblers and
manufacturers (N1.33 billion).
SOUTH AFRICA
36Commodity Price Indices and Term of Trade - Q1 2020

37Commodity Price Indices and Term of Trade - Q1 2020
COMMODITY PRICE INDICES AND TERM OF TRADE – Q1 2020
2709000000 N318,484.3
Product code Value (N)
4001220000 N314.5
3902100000 N9,024.97
Product code Value (N)
0808100000 N2,664.22
8706001400 N2,141.02
8426190000 N1,536.59
EXPORT IMPORT
Petroleum oils and oils obtained from bituminous minerals, crude Polypropylene, in primary forms
Apples, fresh
0910110000 N165.5
1207400000 N250.2
Sesamum seeds, whether or not broken
Ginger, Neither crushed nor ground Other ships' derricks; cranes, including cable cranes; mobile lifting frames
Chassis fitted with engines for assembly plants, of vehicles under subheading 8704
Technically specified natural rubber, in primary forms or in plates, etc
Merchandise Trade by Top Five Partners and by Major Commodities (N'million)
SOUTH AFRICA

38
Merchandise Trade by Top Five Partners and by Major Commodities (N'million)
Commodity Price Indices and Term of Trade - Q1 2020
SOUTH AFRICA
7801100000 N112.3
Product code Value (N)
7806009000 N54.6
0910100000 N28.5
1202200000
2203001000
N24.5
N20.5
8702901291 N1,330.33
Product code Value (N)
4811599000
2207109000
N822.08
N815.87
EXPORT IMPORT
Refined lead, unwrought
Stout and porter
Peanuts Kernels (Groundnuts)
Other imported by MV assemblers and manufacturers
Other Paper and paperboard coated, impregnated or cove
Undenatured ethyl alcohol with alcoholic =>80% vol: not for medical, pharmacy or science
8484200000 N876.27
Mechanical seals
2701120000 N1,114.29
Bituminous coal, not agglomerated
6704190000 N13.4 8702901390 N683.18
False beards, eyebrows and eyelashes, etc, of synthetic fibres
Motor vehicles for transport of>30 persons,Petrol fuel engine, FBU
Ginger
Other articles of lead not specified.

TABLE 1 IMPORT PRICE INDEXES AND PERCENT CHANGES OF COMMODITY GROUPS: JAN-MAR 2020, [2018 JAN=100]
JAN_2018 Jan_2020 Feb_2020 Mar_2020
Jan_2020 Feb_2020
to to
Feb_2020 Mar_2020
Live animals; animal products 100 100.96 102.21 105.79 1.24 3.50
Vegetable products 100 103.07 100.19 100.35 -2.80 0.16
Animal and vegetable fats and oils and other cleavage prod. 100 100.16 101.41 101.78 1.24 0.37
Prepared foodstuffs; beverages, spirits and vinegar; tobacco 100 102.15 101.05 108.47 -1.08 7.34
Mineral products 100 102.68 102.10 100.92 -0.56 -1.16
Products of the chemical and allied industries 100 98.18 99.30 98.80 1.14 -0.50
Plastic, rubber and articles thereof 100 113.26 99.60 103.84 -12.06 4.26
Raw hides and skins, leather, furskins etc.; saddlery 100 102.55 102.83 109.37 0.28 6.36
Wood and articles of wood, wood charcoal and articles 100 103.57 100.00 103.23 -3.44 3.23
Paper making material; paper and paperboard, articles 100 108.08 101.59 104.32 -6.01 2.68
Textiles and textile articles 100 103.15 106.19 107.81 2.95 1.52
Footwear, headgear, umbrellas, sunshades, whips etc. 100 127.71 125.89 122.36 -1.42 -2.81
Articles of stone, plaster, cement, asbestos, mica, ceramic 100 108.82 103.96 103.68 -4.46 -0.27
Pearls, precious and semi-precious stones, precious metals 100 104.37 106.00 109.75 1.56 3.54
Base metals and articles of base metals 100 100.51 103.43 102.87 2.91 -0.54
Boilers, machinery and appliances; parts thereof 100 103.75 103.27 102.73 -0.46 -0.52
Vehicles, aircraft and parts thereof; vessels etc. 100 101.36 101.81 99.93 0.45 -1.85
Miscellaneous manufactured articles 100 106.06 106.07 109.93 0.01 3.64
All commodity Group Import Price Index 100 102.97 102.00 102.10 -0.94 0.10
Description
Index Percentage change (monthly)

TABLE 2 EXPORT PRICE INDEXES AND PERCENT CHANGES OF ALL COMMODITIES:JAN-MAR 2020, [2018 JAN=100]
JAN_2018 Jan_2020 Feb_2020 Mar_2020
Jan_2020 Feb_2020
to to
Feb_2020 Mar_2020
Live animals; animal products 100 102.40 101.84 105.50 -0.54 3.59
Vegetable products 100 104.67 106.23 109.00 1.49 2.61
Animal and vegetable fats and oils and other cleavage prod. 100 108.75 108.94 108.57 0.18 -0.35
Prepared foodstuffs; beverages, spirits and vinegar; tobacco 100 109.95 110.69 106.37 0.67 -3.90
Mineral products 100 105.98 105.52 105.34 -0.43 -0.17
Products of the chemical and allied industries 100 105.75 105.99 105.52 0.23 -0.44
Plastic, rubber and articles thereof 100 106.22 105.72 104.50 -0.47 -1.15
Raw hides and skins, leather, furskins etc.; saddlery 100 102.36 102.57 102.44 0.20 -0.12
Wood and articles of wood, wood charcoal and articles 100 102.45 95.78 108.43 -6.52 13.21
Paper making material; paper and paperboard, articles 100 96.69 96.51 96.68 -0.19 0.18
Textiles and textile articles 100 98.08 101.47 99.10 3.45 -2.34
Footwear, headgear, umbrellas, sunshades, whips etc. 100 100.06 100.41 100.54 0.35 0.13
Articles of stone, plaster, cement, asbestos, mica, ceramic 100 103.78 103.70 103.76 -0.08 0.06
Base metals and articles of base metals 100 108.93 101.45 103.20 -6.87 1.73
Boilers, machinery and appliances; parts thereof 100 105.92 102.30 83.03 -3.42 -18.83
Vehicles, aircraft and parts thereof; vessels etc. 100 100.39 101.39 101.23 1.00 -0.16
Miscellaneous manufactured articles 100 98.52 96.52 95.49 -2.04 -1.06
All commodity Group Export Price Index 100 105.98 105.55 105.36 -0.41 -0.18
Description
IndexPercentage change (monthly)

TABLE3 TERMS OF TRADE BY COMMODITY JAN-MAR 2020, [2018 JAN=100]
Percentage change (monthly)
Commodity Group JAN_2018 Jan_2020 Feb_2020 Mar_2020 Jan_2020 to Feb_2020 Feb_2020 to Mar_2020
Live animals; animal products 100 101.42 99.64 99.73 -1.76 0.09
Vegetable products 100 101.55 106.03 108.62 4.41 2.44
Animal and vegetable fats and oils and other cleavage products. 100 108.57 107.43 106.67 -1.05 -0.71
Prepared foodstuffs; beverages, spirits and vinegar; tobacco 100 107.63 109.54 98.07 1.77 -10.47
Mineral products 100 103.21 103.35 104.39 0.14 1.00
Products of the chemical and allied industries 100 107.71 106.74 106.81 -0.90 0.06
Plastic, rubber and articles thereof 100 93.78 106.15 100.64 13.19 -5.19
Raw hides and skins, leather, furskins etc.; saddlery 100 99.82 99.74 93.67 -0.08
Wood and articles of wood, wood charcoal and articles 100 98.93 95.78 105.03 -3.18 9.66
Paper making material; paper and paperboard, articles 100 89.45 94.99 92.68 6.19 -2.44
Textiles and textile articles 100 95.09 95.55 91.92 0.49 -3.80
Footwear, headgear, umbrellas, sunshades, whips etc. 100 78.35 79.76 82.17 1.79 3.02
Articles of stone, plaster, cement, asbestos, mica, ceramic 100 95.37 99.75 100.07 4.59 0.33
Base metals and articles of base metals 100 108.38 98.08 100.32 -9.50 2.29
Boilers, machinery and chemical appliances; parts thereof 100 102.09 99.06 80.83 -2.97 -18.40
Vehicles, aircraft and parts thereof; vessels etc. 100 99.04 99.58 101.29 0.55 1.71
Miscellaneous manufactured articles 100 92.89 90.99 86.86 -2.05 -4.54
All Products Terms of Trade 100 102.93 103.48 103.19 0.54 -0.28

TABLE 4 EXPORT PRICE INDEXES BY REGION, ALL REGIONS–JAN-MAR 2020, [2018 JAN=100]
JAN_2018 Jan_2020 Feb_2020 Mar_2020Percentage
change (monthly)
Jan_2020 Feb_2020
to to
Feb_2020 Mar_2020
AFRICA 100 105.201 105.729 105.262 0.502 -0.442
AMERICA 100 100.915 100.829 100.437 -0.085 -0.389
ASIA 100 108.297 108.379 108.113 0.076 -0.246
EUROPE 100 106.318 105.221 105.206 -1.032 -0.014
OCEANIA 100 102.958 102.936 102.940 -0.021 0.004
All Region group Export
index100 105.98 105.55 105.36 -0.41 -0.18
REGION
Index

TABLE 5 IMPORT PRICE INDEXES BY REGION AND PERCENT CHANGES: JAN-MAR 2020, [2018 JAN=100]
JAN_2018 Jan_2020 Feb_2020 Mar_2020
Jan_2020 Feb_2020
to to
Feb_2020 Mar_2020
AFRICA 100 105.40 102.1 106.3 -3.09 4.04
AMERICA 100 101.67 101.5 109.9 -0.21 8.29
ASIA 100 103.03 101.6 101.2 -1.37 -0.39
EUROPE 100 103.05 102.4 100.8 -0.63 -1.53
OCEANIA 100 101.41 102.5 101.1 1.05 -1.34
All Region group Import index 100 102.97 102.02 102.10 -0.92 0.08
REGION
Index
Percentage change
(monthly)
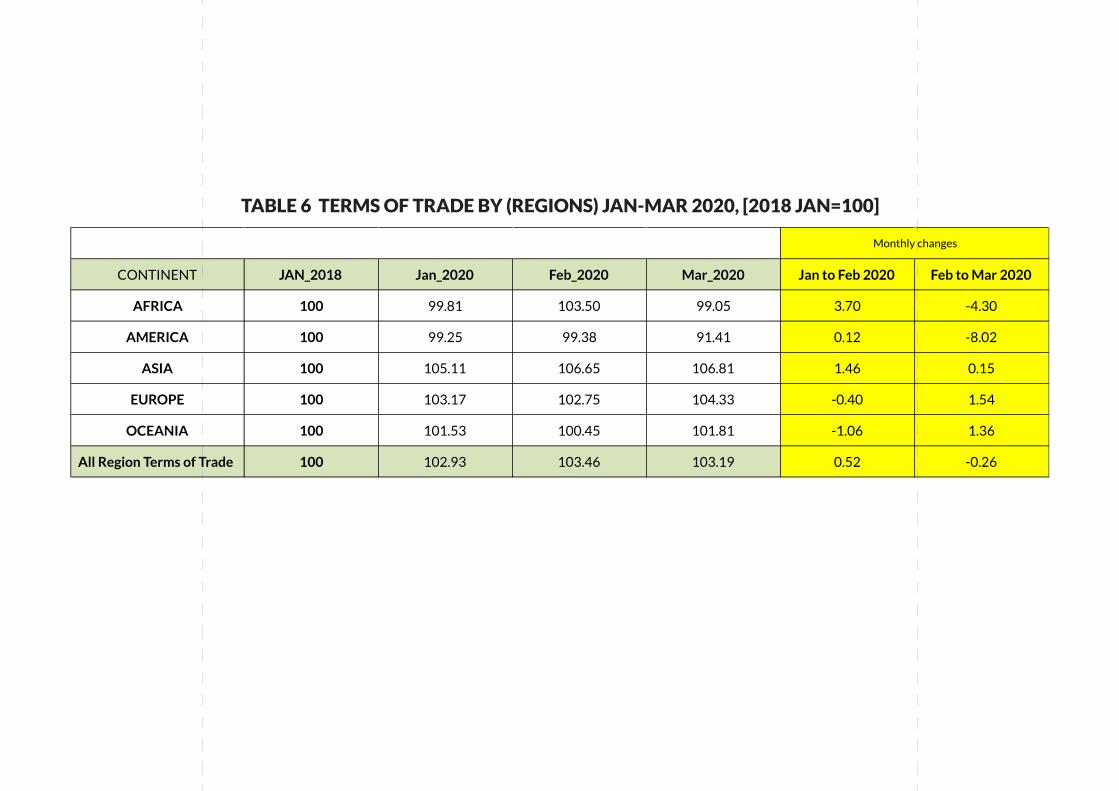
TABLE 6 TERMS OF TRADE BY (REGIONS) JAN-MAR 2020, [2018 JAN=100]
CONTINENT JAN_2018 Jan_2020 Feb_2020 Mar_2020 Jan to Feb 2020 Feb to Mar 2020
AFRICA 100 99.81 103.50 99.05 3.70 -4.30
AMERICA 100 99.25 99.38 91.41 0.12 -8.02
ASIA 100 105.11 106.65 106.81 1.46 0.15
EUROPE 100 103.17 102.75 104.33 -0.40 1.54
OCEANIA 100 101.53 100.45 101.81 -1.06 1.36
All Region Terms of Trade 100 102.93 103.46 103.19 0.52 -0.26
Monthly changes

Table 7 MERCHANDISE TRADE BY TOP FIVE PARTNERS AND BY MAJOR COMMODITIES (N’million) Q1, 2020
EXPORT IMPORT
Product code Product description Value (N) Product code Product description Value (N)
2709000000 Petroleum oils and oils obtained from bituminous minerals, crude 526,874.03 8711201000 motorcycles and cycles, imported CKD by established manufacturers >50cc<=250cc 93,968.2
2711110000 Natural gas, liquefied 91,340.88 2710191100 Kerosene type jet fuel 24,324.8
1207400000 Sesamum seeds, whether or not broken 7,966.05 3002200000 Vaccines for human medicine 20,453.1
2711120000 Propane, liquefied 4,436.26 3004909000 Other antibiotics 9,001.1
1208900000 Other flours and meal of oil seeds or oleaginous fruit, other than those of mustard 986.07 8419890000 Other machinery, plant and equipment 8,363.8
0801310000 Cashew nuts, in shell 820.90 8437100000 Machines for cleaning/sorting/grading seed, grain or dried vegetables 6,555.3
1201000000 Soya beans,whether or not broken. 729.18 8704231190 Dumpers for transport of goods,with diesel/semidiesel engine,g.v.w.>20tonne, FBU 3,967.5
4112000000 Leather further prep after tanning/crusting,incl.parchment-dresssed leather of sheep/lam 429.04 8462990000 Other presses (excl. hydraulic) for working metals or metal carbides 3,244.6
1208100000 Flour and meals of Soya bean 405.10 8504409000 Other static converters not specified 3,127.4
1201100000 Soya beans Seed 389.78 7308201000 Bridges and bridge-sections of iron or steel 2,964.3
EXPORT IMPORT
Product code Product description Value (N) Product code Product description Value (N)
2709000000 Petroleum oils and oils obtained from bituminous minerals, crude 360,443.8 3817000000 Mixed alkylbenzenes &mixed alkylanaphthalenes,other than those of heading 27.07 or 29.02 11,407.0
2711110000 Natural gas, liquefied 31,968.0 2520100000 Gypsum; anhydrite whether or not coloured, with/without small quantities of accelerators 2,892.5
2710111000 Partially refined oil including crude oil having undergone primary refinement 5,290.7 8436800000 Other agricultural,horticultural, forestry or bee-keeping machinery, nes 2,610.1
4113100000 Leather further prepared after tanning/crusting without wool on of goats or kids 2,229.9 7901110000 Zinc, not alloyed >=99.99% pure 2,344.6
4001220000 Technically specified natural rubber, in primary forms or in plates, etc 1,036.8 8464900000 Other machine-tools for working stone, ceramics, concrete, etc 1,462.3
1803100000 Cocoa paste, not defatted 468.7 8419400000 Distilling or rectifying plant 1,370.4
7801990000 Unwrought lead (excl. refined and containing antimony) 397.1 6908900000 Glazed ceramic flags and paving, hearth or wall tiles, etc, nes 1,053.0
8425310000 Other winches, capstans, powered by electric motor 313.0 2202901000 Beverages containing high doses of caffeine of the kind Energy drinks 1,014.2
7403110000 Cathodes and sections of cathodes of refined copper 234.6 8441100000 Cutting machines for paper pulp, paper or paperboard 951.7
1804000000 Cocoa butter, fat and oil 101.3 8419810000 Other machinery,plant and equipment for making hot drinks or for cooking or heating food 825.4
EXPORT IMPORT
Product code Product description Value (N) Product code Product description Value (N)
2709000000 Petroleum oils and oils obtained from bituminous minerals, crude 360,698.5 2710115000 Motor Spirit ordinary 303,648.92
1801000000 GOOD FERMENTED NIGERIAN COCOA BEANS - MAIN CROP 2015/2016 16,530.1 2710192100 Gas Oil 102,821.55
1801001100 Superior quality raw cocoa beans 11,216.1 2710191100 Kerosene type jet fuel 4,521.20
2711110000 Natural gas, liquefied 3,160.6 0303680000 Blue whitings (Micromesistius poutassou, Micromesistius australis) meat, frozen. 4,247.71
0306170000 Other Frozen shrimps and prawns 1254.068471 8421399000 Other Filtering or purifying machinery and apparatus for gases not specified 3,872.09
1803100000 Cocoa paste, not defatted 1,012.5 0402211000 Milk & cream in powder>1.5% fat not contain sweetening matter specially made for infants 3,151.89
1207400000 Sesamum seeds, whether or not broken 820.7 0303510000 Herrings (Clupea harengus, Clupea pallasii) 2,998.67
0306291000 Nonfrozen Flours, meals and pellets of crustaceans, fit for human consumption. 422.6 7210120000 Flatrolled iron/steel, width>=600mm, >= 0.5mm thick,clad,plated...with tin 2,921.13
4001220000 Technically specified natural rubber, in primary forms or in plates, etc 372.5 8419890000 Other machinery, plant and equipment 2,422.51
1804000000 Cocoa butter, fat and oil 311.0 0303540000 Mackerel (Scomber scombrus, Scomber australasicus, Scomber japonicus) meat, frozen. 2,390.37
EXPORT IMPORT
Product code Product description Value (N) Product code Product description Value (N)
2709000000 Petroleum oils and oils obtained from bituminous minerals, crude 318,484.3 3902100000 Polypropylene, in primary forms 9,024.97
4001220000 Technically specified natural rubber, in primary forms or in plates, etc 314.5 0808100000 Apples, fresh 2,664.22
1207400000 Sesamum seeds, whether or not broken 250.2 8706001400 Chassis fitted with engines for assembly plants, of vehicles under subheading 8704 2,141.02
0910110000 Ginger, Neither crushed nor ground 165.5 8426190000 Other ships' derricks;cranes, including cable cranes; mobile lifting frames 1,536.59
7801100000 Refined lead, unwrought 112.3 8702901291 Other imported by MV assemblers and manufacturers 1,330.33
7806009000 Other articles of lead not specified. 54.6 2701120000 Bituminous coal, not agglomerated 1,114.29
0910100000 Ginger 28.5 8484200000 Mechanical seals 876.27
1202200000 PEANUTS KERNELS (GROUNDNUTS) 24.5 4811599000 Other Paper and paperboard coated, impregnated or cove 822.08
2203001000 Stout and porter 20.5 2207109000 Undenatured ethyl alcohol with alcoholic =>80% vol: not for medical, pharmacy or science 815.87
6704190000 False beards, eyebrows and eyelashes, etc, of synthetic fibres 13.4 8702901390 Motor vehicles for transport of>30 persons,Petrol fuel engine,FBU 683.18
EXPORT IMPORT
Product code Product description Value (N) Product code Product description Value (N)
2709000000 Petroleum oils and oils obtained from bituminous minerals, crude 54,185.5 9301901100 Fully automatic rifles and carbines with single smooth-bore barrels 51,974.78
2711110000 Natural gas, liquefied 42,164.4 8711201000 Imported motorcycles and cycles, imported CKD by established manufacturers >50cc<=250cc 44,819.14
1207400000 Sesamum seeds, whether or not broken 9,309.5 8464900000 Other machine-tools for working stone, ceramics, concrete, etc 39,720.39
8905900000 Other Light vessels, fire-floats, floating cranes, etc, nes 2,975.0 8541401000 Solar cells whether or not in modules or made up into panels 23,169.00
2608000000 Zinc ores and concentrates 694.3 8706001400 Chassis fitted with engines for assembly plants, of vehicles under subheading 8704 18,606.97
7403110000 Cathodes and sections of cathodes of refined copper 523.5 8517620000 Machines 4 the reception,conversion & transmission or regeneration of voice,images or... 18,527.47
2607000000 Lead ores and concentrates 353.5 3808939000 Other Herbicides, antisprouting products and plantgr 17,596.18
1209100000 Sugar beet seed used for sowing 349.9 8602100000 Diesel-electric locomotives 15,949.15
1508100000 Groundnut Crude oil, whether or not refined but not chemically modified 286.8 8426490000 Other machinery, self-propelled 14,200.70
7801990000 Unwrought lead (excl. refined and containing antimony) 231.1 8452900000 Other parts of sewing machines, nes 14,181.95
INDIA
SPAIN
NETHERLANDS
CHINA
SOUTH AFRICA
Data sources: Trade in goods statistics compilation by NBS is largely from secondary data source which
includes; the Nigerian Customs Service (NCS) through the Nigeria Integrated Customs Information System
(NICIS), Nigerian National Petroleum Corporation (NNPC) , Petroleum Products Pricing and Regulatory
Agency (PPPRA), Nigeria Liquefied Natural Gas Ltd (NLNG), Central Bank of Nigeria (CBN), Cobalt
International Services Ltd, Carmine Assayer Ltd Inspection Services, NerolIi Technology, Nigerian Export
Processing Zone Agency (NEPZA), Oil and Gas Free Zone Agency (OGFZA), Nigerian Electricity Regulatory
Commission (NERC), Federal Airports Authority of Nigeria (FAAN), Nigeria Civil Aviation Authority (NCAA)
and Nigerian Ports Authority (NPA). They include government and non government shipment of goods, and
exclude military, diplomatic and consular installations abroad, Nigeria goods returned to Nigeria by its
Armed forces, Personal and household effects of travelers and in-transit shipments .
Terms of Trade: The terms of trade for Nigeria are calculated as the value of its exports as percent of the
value of its imports. An increase in the terms of trade means that the value of its export is increasing relative
to the value of imports. The country can afford to buy more imports with the revenue from its exports. For
example an increase in the price of oil increases (improves) the terms of Trade for the oil exporting Countries
and lowers it for the other Countries.
Commodity price: A commodity price index is a weighted average of selected commodity prices. It is an
index that tracks a basket of commodities to measure their performance. Export and Import Price Indices
(XMPIs) measure the overall change in the prices of transactions in goods and services between the
residents of an economic territory and residents of the rest of the world. A price index assumes a value of
100, in the reference period. The values of the index for other periods of time show the percentage change in
prices from the reference period.
Export price index: The export price index (EPI) tracks changes in the prices that Nigerian firms receive for
the products they export. Increases in the EPI are normally due to either stronger demand abroad or higher
production costs in Nigeria. Generally only increases in the EPI due to robust international demand are
beneficial to the Nigerian economy as a whole. Export Price Indexes - Products have been classified by the
Harmonized Tariff Schedule.
The Laspeyers index formula was used in the calculation of the import and export trade indices. The series
use a base year of 2018 Jan =100.
Import price index: The import price index (IPI) tracks changes in the prices paid for goods imported to
Nigeria. The import price index becomes useful in determining whether a change in import volume has
actually sprung from a higher foreign demand or from a real increase in prices for foreign goods. Import
Price Indexes - Products have been classified by the Harmonized Tariff Schedule.
TECHNICAL NOTES
46Commodity Price Indices and Term of Trade - Q1 2020

We acknowledge our technical partners, Proshare in the design, concept and production of this publication.
Contact Us
Plot 762,IndependenceAvenue,Central
Business District,FCT, Abuja Nigeria.
Head Office Address [email protected]+234 803 386 5388
@nigerianstat www.nigerianstat.gov.ng NBSNigeria
Acknowledgements
ACKNOWLEDGEMENTS/CONTACTS
47Commodity Price Indices and Term of Trade - Q1 2020