Embed Size (px)
Citation preview
TRIPLE POINT TECHNOLOGY, INC. | 301 RIVERSIDE AVENUE | WESTPORT, CT 06880 USA | 1.203.291.7979 | 1.203.291.7977 FAX | TPT.COM
View enterprise-wide Kpis with high impact Visuals
Commodity XL Management Dashboard™ mines vast amounts of trading, risk and supply chain data to deliver pinpoint analysis for superior executive decision making. Its high-impact visuals give management a real-time graphical display of key performance indicators (KPIs) across the entire business.
Key Business Benefits
Turns vast amounts of transaction data into actionable ■■
decision-making information
Supplies executives with visibility into critical KPIs ■■
across the entire supply chain on a single screen
Measures & monitors trader, business unit & enterprise- ■■
wide performance
Drives smarter, quicker executive decision-making ■■
with interactive high-impact visuals
Gives executives fact based information and improves ■■
bottom-line results
Provides C-suite & the board real-time insight into ■■
the business never before available
with management dashboard, executives Can . . .
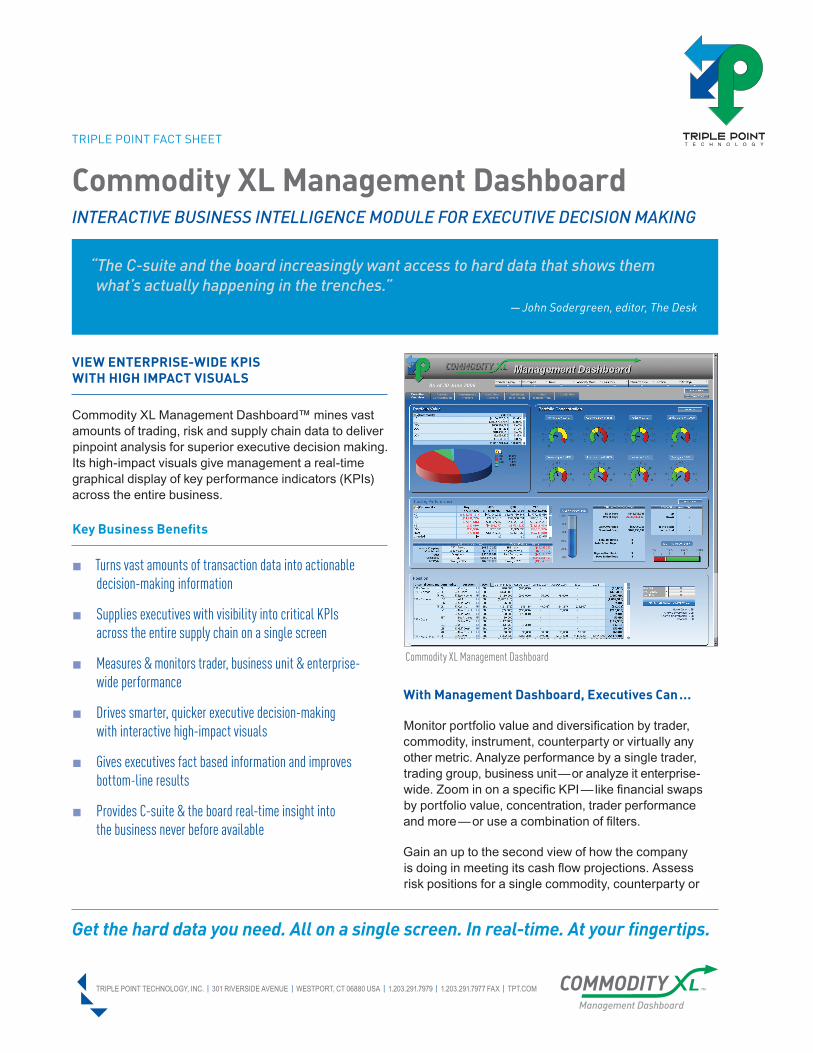
Monitor portfolio value and diversification by trader, commodity, instrument, counterparty or virtually any other metric. Analyze performance by a single trader, trading group, business unit — or analyze it enterprise-wide. Zoom in on a specific KPI — like financial swaps by portfolio value, concentration, trader performance and more — or use a combination of filters.
Gain an up to the second view of how the company is doing in meeting its cash flow projections. Assess risk positions for a single commodity, counterparty or
Commodity XL Management Dashboard
Get the hard data you need. All on a single screen. In real-time. At your fingertips.
INTERACTIVE BUSINESS INTELLIGENCE MODULE FOR EXECUTIVE DECISION MAKING
Commodity Xl management dashboard
“The C-suite and the board increasingly want access to hard data that shows them what’s actually happening in the trenches.” — John Sodergreen, editor, The Desk
TRIPLE POINT FACT SHEET
TRIPLE POINT TECHNOLOGY, INC. | 301 RIVERSIDE AVENUE | WESTPORT, CT 06880 USA | 1.203.291.7979 | 1.203.291.7977 FAX | TPT.COM
“Each gauge represents how diversified my portfolio is by each category…with a glance across the dials, an executive can get a read on the health of the overall business, an overview of exposure in a specific commodity area or any of a score of other factors.”
—The Desk
market — or across all commodities and geographies. Track hedging and risk management effectiveness with unprecedented visual precision.
Get the hard data you need. All on a single screen. In real-time. At your fingertips. However you slice, dice and view it, Management Dashboard puts you in the driver’s seat to make your company’s most important bottom-line decisions. It delivers the speed, flexibility and ease-of-use you need to identify trends, problems and opportunities — proactively and precisely.
unprecedented tool for strategic decision support
The complexities of today’s volatile commodity markets require systems capable of amalgamating large amounts of data. Management Dashboard not only synthesizes vast sums of data, but also integrates information from across the enterprise to provide an invaluable tool for measuring and monitoring key metrics in real-time. It provides unique, insightful analysis via high-impact visuals not available elsewhere. With timely and accurate information displayed in an easy-to-grasp format, executives are better equipped to make the intelligent business decisions that have the biggest impact on the bottom line.
Key Features
“Executive Overview” screen displays snapshot of portfolio ■■
value by trader, commodity, instrument, counterparty and a range of other metrics
Color-coded dashboard dials & gauges present real-time ■■
positions at a glance
Ability to slice-and-dice to the lowest level of granularity ■■
or roll-up to an enterprise view
Impactful KPIs using a single filter or combination ■■
of filters
Risk management analytic and effectiveness tools■■
triple point Commodity Xl
Management Dashboard is an add-on business intel-ligence module to Triple Point Commodity XL, the only true next-generation solution built specifically from the ground up for high-volume, complex transaction man-agement organizations. It meets all the requirements for trading in today’s highly volatile environment: multi-com-modity capabilities, real-time integration of physical and financial positions, comprehensive risk management, and scalability. Comprised of a family of commodity-specific products that can be deployed alone or in seamless combination with each other, Commodity XL manages every aspect of global cross-industry supply, trading, marketing, and logistics operations.
about triple point technology, inc.
Triple Point Technology is the established leader in trading, risk management and logistics solutions for commodities, including power, oil, gas, coal, emissions, metals, agricultural products, biofuels and freight. Triple Point Commodity XL profitably integrates physical and financial markets from the front-to-back office for all commodities on a real-time, next-generation platform. Triple Point’s award-winning solutions are used by more than 25 percent of both Global 500 commodity trading companies and Global 500 energy companies. Founded in 1993 and headquartered in Westport, Connecticut, USA, Triple Point serves clients from eight development and support centers located around the globe. More information is available at www.tpt.com.
Timely and accurate information via high-impact visuals.