Embed Size (px)
Citation preview
sensors
Article
Communication System Design for an AdvancedMetering Infrastructure
Ricardo Siqueira de Carvalho 1,*, Pankaj Kumar Sen 1, Yaswanth Nag Velaga 1,Lucas Feksa Ramos 2 and Luciane Neves Canha 3
1 Department of Electrical Engineering, Colorado School of Mines, Golden CO 80401, USA;[email protected] (P.K.S.); [email protected] (Y.N.V.)
2 Department of Electrical Engineering, Federal University of Rondônia, Porto Velho 76801-059, Brazil;[email protected]
3 Department of Electromechanics and Power Systems, Federal University of Santa Maria,Santa Maria 97105-900, Brazil; [email protected]
* Correspondence: [email protected] (R.S.d.C.); Tel.: +1-303-384-2020
Received: 8 September 2018; Accepted: 29 October 2018; Published: 2 November 2018�����������������
Abstract: This paper primarily deals with the design of an Information and Control Technology (ICT)network for an advanced metering infrastructure (AMI) on the IEEE 34 node radial distributionnetwork. The application is comprised of 330 smart meters deployed in the low voltage system and33 data concentrators in the medium voltage system. A power line carrier (PLC) communicationsystem design is developed and simulated in Network Simulator 3 (NS-3). The simulation result isvalidated by comparing the communication network performance with the minimum performancerequirements for AMI. The network delay of a single data frame is calculated and compared with thesimulation delay. The design methodology proposed in this article may be used for other smart gridapplications. The secondary goal is to provide AMI network traffic based on the IEC Std. 61968 anda discussion on whether or not AMI could possibly be a source of big data on the future power grid.
Keywords: communication network; cyber-physical systems; smart grid; advanced metering; powerline communication; network simulator 3
1. Introduction
The modern electric grid integrates the existing power system infrastructure with an ICT networkallowing for improvements of the system in terms of efficiency, reliability, and flexibility [1–3].The definition of smart grid is adopted from the National Institute of Standards and Technology(NIST) that includes the increased use of digital information and controls technology in the powersystem [4].
Since the amount of data and control in the modern power grid is increasing rapidly as it becomesmore mature, the interdependency between the cyber and physical systems increases as well. The ICTnetwork design for smart power applications becomes a more critical task [5]. In the past few years,several surveys have been published addressing the smart grid applications and its communicationrequirements as well as the ICT technologies [6]. Reference [4] provides a comprehensive overview ofthe design process of the ICT layer of a smart grid. However, due to the complexity, the design andimplementation of the ICT network is still a very challenging task. Different power utilities acrossthe globe have different power network characteristics as well as different geographical features. It isdifficult, if not impossible to have a single generalized design procedure that fits all power systems [7].It is worth mentioning the related AMI work from reference [8] but this research differs from thereference by following the information model provided by IEC Std. 61968.
Sensors 2018, 18, 3734; doi:10.3390/s18113734 www.mdpi.com/journal/sensors
Sensors 2018, 18, 3734 2 of 11
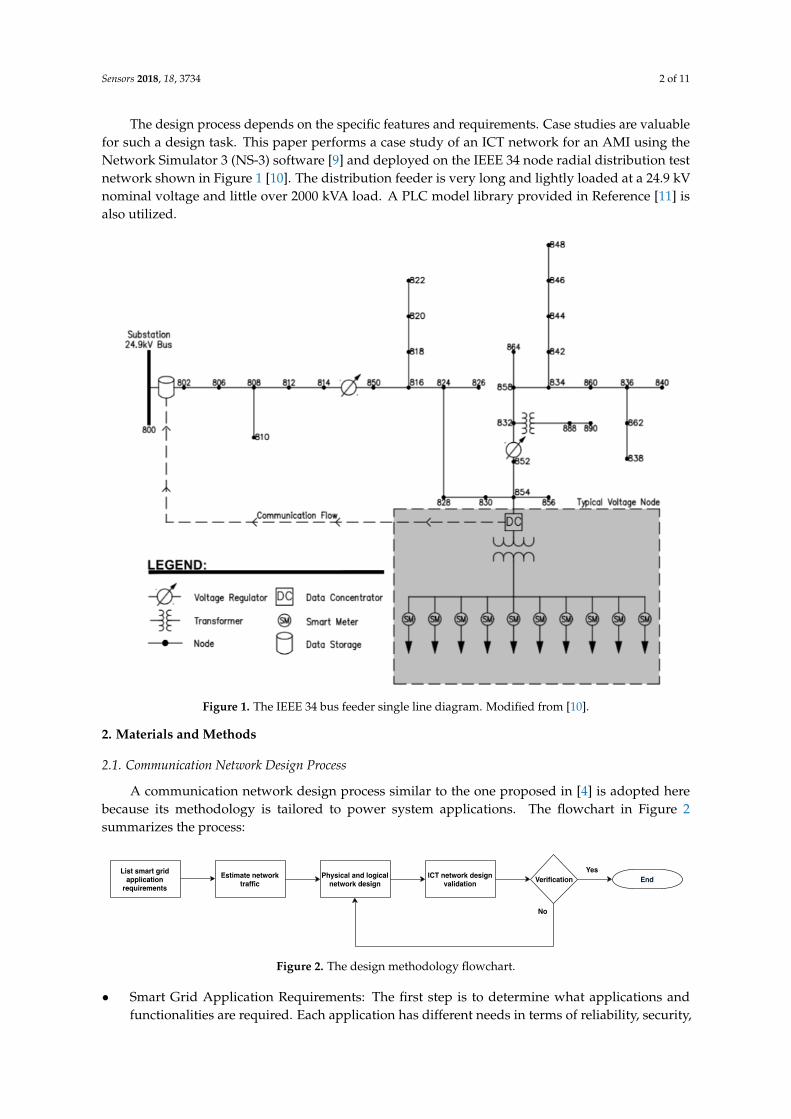
The design process depends on the specific features and requirements. Case studies are valuablefor such a design task. This paper performs a case study of an ICT network for an AMI using theNetwork Simulator 3 (NS-3) software [9] and deployed on the IEEE 34 node radial distribution testnetwork shown in Figure 1 [10]. The distribution feeder is very long and lightly loaded at a 24.9 kVnominal voltage and little over 2000 kVA load. A PLC model library provided in Reference [11] isalso utilized.
Sensors 2018, 18, x 2 of 11
[8] but this research differs from the reference by following the information model provided by IEC Std. 61968.
The design process depends on the specific features and requirements. Case studies are valuable for such a design task. This paper performs a case study of an ICT network for an AMI using the Network Simulator 3 (NS-3) software [9] and deployed on the IEEE 34 node radial distribution test network shown in Figure 1 [10]. The distribution feeder is very long and lightly loaded at a 24.9 kV nominal voltage and little over 2000 kVA load. A PLC model library provided in Reference [11] is also utilized.
Figure 1. The IEEE 34 bus feeder single line diagram. Modified from [10].
2. Materials and Methods
2.1. Communication Network Design Process
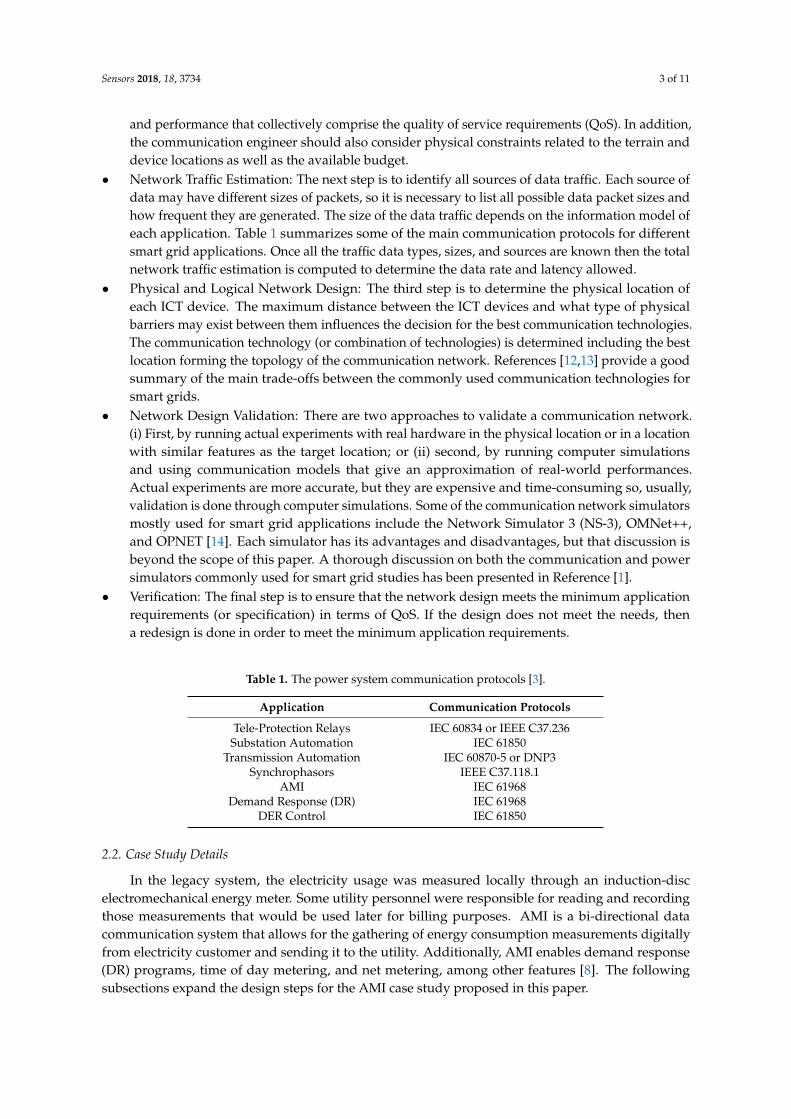
A communication network design process similar to the one proposed in [4] is adopted here because its methodology is tailored to power system applications. The flowchart in Figure 2 summarizes the process:
Figure 2. The design methodology flowchart.
Figure 1. The IEEE 34 bus feeder single line diagram. Modified from [10].
2. Materials and Methods
2.1. Communication Network Design Process
A communication network design process similar to the one proposed in [4] is adopted herebecause its methodology is tailored to power system applications. The flowchart in Figure 2summarizes the process:
Sensors 2018, 18, x 2 of 11
[8] but this research differs from the reference by following the information model provided by IEC Std. 61968.
The design process depends on the specific features and requirements. Case studies are valuable for such a design task. This paper performs a case study of an ICT network for an AMI using the Network Simulator 3 (NS-3) software [9] and deployed on the IEEE 34 node radial distribution test network shown in Figure 1 [10]. The distribution feeder is very long and lightly loaded at a 24.9 kV nominal voltage and little over 2000 kVA load. A PLC model library provided in Reference [11] is also utilized.
Figure 1. The IEEE 34 bus feeder single line diagram. Modified from [10].
2. Materials and Methods
2.1. Communication Network Design Process
A communication network design process similar to the one proposed in [4] is adopted here because its methodology is tailored to power system applications. The flowchart in Figure 2 summarizes the process:
Figure 2. The design methodology flowchart.
Figure 2. The design methodology flowchart.
• Smart Grid Application Requirements: The first step is to determine what applications andfunctionalities are required. Each application has different needs in terms of reliability, security,
Sensors 2018, 18, 3734 3 of 11
and performance that collectively comprise the quality of service requirements (QoS). In addition,the communication engineer should also consider physical constraints related to the terrain anddevice locations as well as the available budget.
• Network Traffic Estimation: The next step is to identify all sources of data traffic. Each source ofdata may have different sizes of packets, so it is necessary to list all possible data packet sizes andhow frequent they are generated. The size of the data traffic depends on the information model ofeach application. Table 1 summarizes some of the main communication protocols for differentsmart grid applications. Once all the traffic data types, sizes, and sources are known then the totalnetwork traffic estimation is computed to determine the data rate and latency allowed.
• Physical and Logical Network Design: The third step is to determine the physical location ofeach ICT device. The maximum distance between the ICT devices and what type of physicalbarriers may exist between them influences the decision for the best communication technologies.The communication technology (or combination of technologies) is determined including the bestlocation forming the topology of the communication network. References [12,13] provide a goodsummary of the main trade-offs between the commonly used communication technologies forsmart grids.
• Network Design Validation: There are two approaches to validate a communication network.(i) First, by running actual experiments with real hardware in the physical location or in a locationwith similar features as the target location; or (ii) second, by running computer simulationsand using communication models that give an approximation of real-world performances.Actual experiments are more accurate, but they are expensive and time-consuming so, usually,validation is done through computer simulations. Some of the communication network simulatorsmostly used for smart grid applications include the Network Simulator 3 (NS-3), OMNet++,and OPNET [14]. Each simulator has its advantages and disadvantages, but that discussion isbeyond the scope of this paper. A thorough discussion on both the communication and powersimulators commonly used for smart grid studies has been presented in Reference [1].
• Verification: The final step is to ensure that the network design meets the minimum applicationrequirements (or specification) in terms of QoS. If the design does not meet the needs, thena redesign is done in order to meet the minimum application requirements.
Table 1. The power system communication protocols [3].
Application Communication Protocols
Tele-Protection Relays IEC 60834 or IEEE C37.236Substation Automation IEC 61850
Transmission Automation IEC 60870-5 or DNP3Synchrophasors IEEE C37.118.1
AMI IEC 61968Demand Response (DR) IEC 61968
DER Control IEC 61850
2.2. Case Study Details
In the legacy system, the electricity usage was measured locally through an induction-discelectromechanical energy meter. Some utility personnel were responsible for reading and recordingthose measurements that would be used later for billing purposes. AMI is a bi-directional datacommunication system that allows for the gathering of energy consumption measurements digitallyfrom electricity customer and sending it to the utility. Additionally, AMI enables demand response(DR) programs, time of day metering, and net metering, among other features [8]. The followingsubsections expand the design steps for the AMI case study proposed in this paper.
Sensors 2018, 18, 3734 4 of 11
2.2.1. AMI Application Requirements
Each smart grid application has different requirements in terms of reliability, bandwidth,and latency. The minimum requirements for some of the common applications are available inReference [3]. For the AMI case, the minimum data rate is 56 kbps and the maximum latency is 2s [3]. However, it is a good practice to design a communication network based on the network trafficestimation that may have more stringent requirements.
The standard communication protocol for AMI, IEC Std. 61968, specifies the information modelas well as which network protocols may be used, and it also specifies that the messages between thecommunication nodes should be done using the extensible markup language (XML) [15]. This networkprotocol is adopted in this design for the messages between the substation and the smart meters.
2.2.2. AMI Network Traffic Estimation
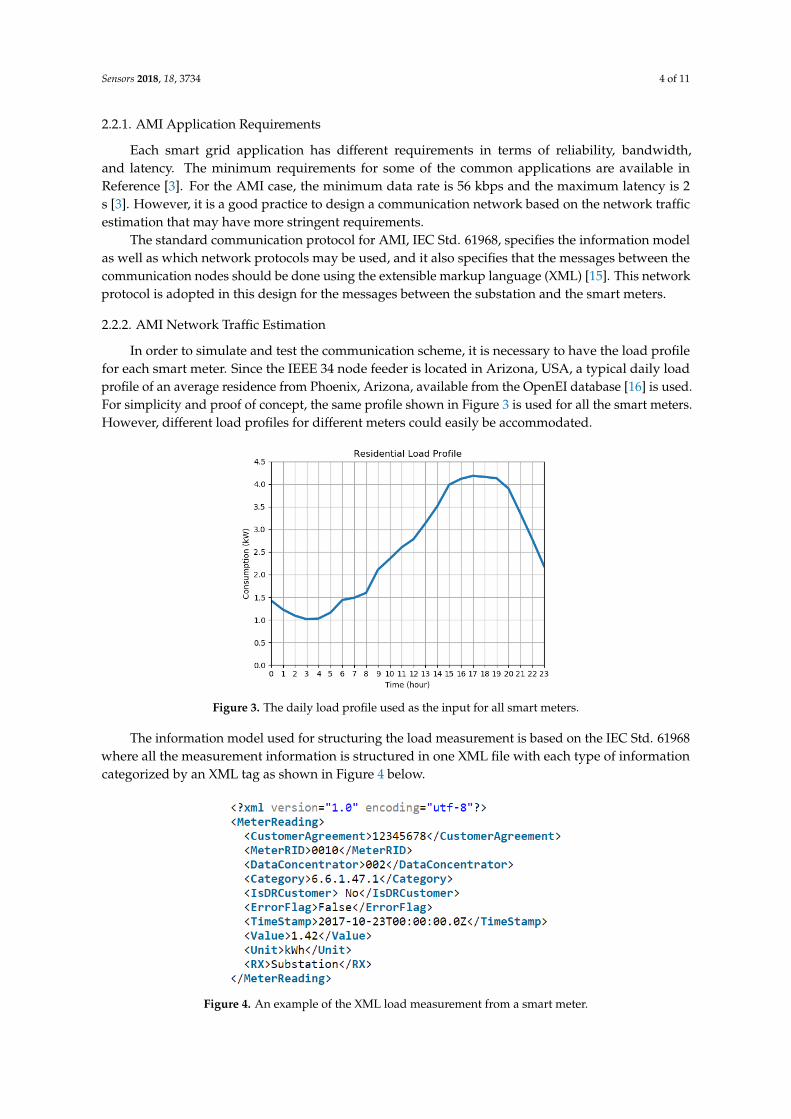
In order to simulate and test the communication scheme, it is necessary to have the load profilefor each smart meter. Since the IEEE 34 node feeder is located in Arizona, USA, a typical daily loadprofile of an average residence from Phoenix, Arizona, available from the OpenEI database [16] is used.For simplicity and proof of concept, the same profile shown in Figure 3 is used for all the smart meters.However, different load profiles for different meters could easily be accommodated.
Sensors 2018, 18, x 4 of 11
2.2.1. AMI Application Requirements
Each smart grid application has different requirements in terms of reliability, bandwidth, and latency. The minimum requirements for some of the common applications are available in Reference [3]. For the AMI case, the minimum data rate is 56 kbps and the maximum latency is 2 s [3]. However, it is a good practice to design a communication network based on the network traffic estimation that may have more stringent requirements.
The standard communication protocol for AMI, IEC Std. 61968, specifies the information model as well as which network protocols may be used, and it also specifies that the messages between the communication nodes should be done using the extensible markup language (XML) [15]. This network protocol is adopted in this design for the messages between the substation and the smart meters.
2.2.2. AMI Network Traffic Estimation
In order to simulate and test the communication scheme, it is necessary to have the load profile for each smart meter. Since the IEEE 34 node feeder is located in Arizona, USA, a typical daily load profile of an average residence from Phoenix, Arizona, available from the OpenEI database [16] is used. For simplicity and proof of concept, the same profile shown in Figure 3 is used for all the smart meters. However, different load profiles for different meters could easily be accommodated.
Figure 3. The daily load profile used as the input for all smart meters.
The information model used for structuring the load measurement is based on the IEC Std. 61968 where all the measurement information is structured in one XML file with each type of information categorized by an XML tag as shown in Figure 4 below.
Figure 3. The daily load profile used as the input for all smart meters.
The information model used for structuring the load measurement is based on the IEC Std. 61968where all the measurement information is structured in one XML file with each type of informationcategorized by an XML tag as shown in Figure 4 below.Sensors 2018, 18, x 5 of 11
Figure 4. An example of the XML load measurement from a smart meter.
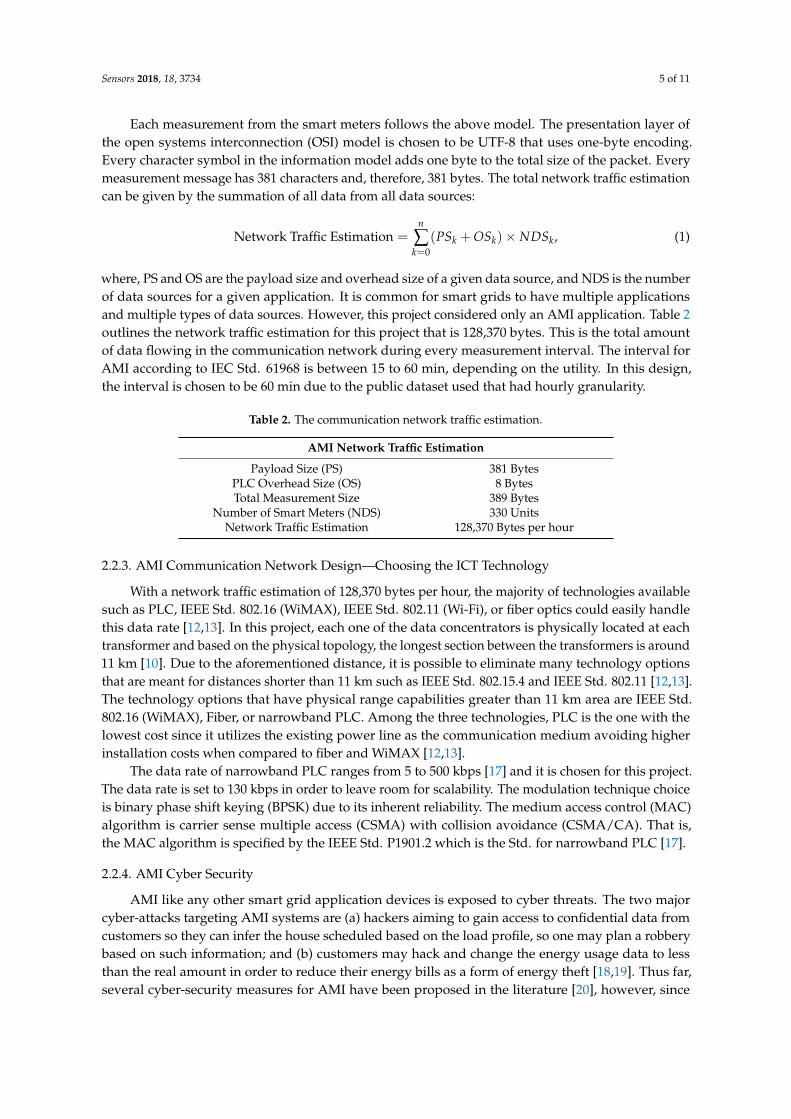
Each measurement from the smart meters follows the above model. The presentation layer of the open systems interconnection (OSI) model is chosen to be UTF-8 that uses one-byte encoding. Every character symbol in the information model adds one byte to the total size of the packet. Every measurement message has 381 characters and, therefore, 381 bytes. The total network traffic estimation can be given by the summation of all data from all data sources:
Network Traffic Estimation = � (𝑃𝑃𝑃𝑃𝑘𝑘 + 𝑂𝑂𝑃𝑃𝑘𝑘)𝑛𝑛𝑘𝑘=0 × 𝑁𝑁𝑁𝑁𝑃𝑃𝑘𝑘, (1)
where, PS and OS are the payload size and overhead size of a given data source, and NDS is the number of data sources for a given application. It is common for smart grids to have multiple applications and multiple types of data sources. However, this project considered only an AMI application. Table 2 outlines the network traffic estimation for this project that is 128,370 bytes. This is the total amount of data flowing in the communication network during every measurement interval. The interval for AMI according to IEC Std. 61968 is between 15 to 60 min, depending on the utility. In this design, the interval is chosen to be 60 min due to the public dataset used that had hourly granularity.
Table 2. The communication network traffic estimation.
AMI Network Traffic Estimation Payload Size (PS) 381 Bytes
PLC Overhead Size (OS) 8 Bytes Total Measurement Size 389 Bytes
Number of Smart Meters (NDS) 330 Units Network Traffic Estimation 128,370 Bytes per hour
2.2.4. AMI Communication Network Design—Choosing the ICT Technology
With a network traffic estimation of 128,370 bytes per hour, the majority of technologies available such as PLC, IEEE Std. 802.16 (WiMAX), IEEE Std. 802.11 (Wi-Fi), or fiber optics could easily handle this data rate [12,13]. In this project, each one of the data concentrators is physically located at each transformer and based on the physical topology, the longest section between the transformers is around 11 km [10]. Due to the aforementioned distance, it is possible to eliminate many technology options that are meant for distances shorter than 11 km such as IEEE Std. 802.15.4 and IEEE Std. 802.11 [12,13]. The technology options that have physical range capabilities greater than 11 km area are IEEE Std. 802.16 (WiMAX), Fiber, or narrowband PLC. Among the three technologies, PLC is the one with the lowest cost since it utilizes the existing power line as the communication medium avoiding higher installation costs when compared to fiber and WiMAX [12,13].
The data rate of narrowband PLC ranges from 5 to 500 kbps [17] and it is chosen for this project. The data rate is set to 130 kbps in order to leave room for scalability. The modulation technique choice is binary phase shift keying (BPSK) due to its inherent reliability. The medium access control (MAC)
Figure 4. An example of the XML load measurement from a smart meter.
Sensors 2018, 18, 3734 5 of 11
Each measurement from the smart meters follows the above model. The presentation layer ofthe open systems interconnection (OSI) model is chosen to be UTF-8 that uses one-byte encoding.Every character symbol in the information model adds one byte to the total size of the packet. Everymeasurement message has 381 characters and, therefore, 381 bytes. The total network traffic estimationcan be given by the summation of all data from all data sources:
Network Traffic Estimation =n
∑k=0
(PSk + OSk)× NDSk, (1)
where, PS and OS are the payload size and overhead size of a given data source, and NDS is the numberof data sources for a given application. It is common for smart grids to have multiple applicationsand multiple types of data sources. However, this project considered only an AMI application. Table 2outlines the network traffic estimation for this project that is 128,370 bytes. This is the total amountof data flowing in the communication network during every measurement interval. The interval forAMI according to IEC Std. 61968 is between 15 to 60 min, depending on the utility. In this design,the interval is chosen to be 60 min due to the public dataset used that had hourly granularity.
Table 2. The communication network traffic estimation.
AMI Network Traffic Estimation
Payload Size (PS) 381 BytesPLC Overhead Size (OS) 8 BytesTotal Measurement Size 389 Bytes
Number of Smart Meters (NDS) 330 UnitsNetwork Traffic Estimation 128,370 Bytes per hour
2.2.3. AMI Communication Network Design—Choosing the ICT Technology
With a network traffic estimation of 128,370 bytes per hour, the majority of technologies availablesuch as PLC, IEEE Std. 802.16 (WiMAX), IEEE Std. 802.11 (Wi-Fi), or fiber optics could easily handlethis data rate [12,13]. In this project, each one of the data concentrators is physically located at eachtransformer and based on the physical topology, the longest section between the transformers is around11 km [10]. Due to the aforementioned distance, it is possible to eliminate many technology optionsthat are meant for distances shorter than 11 km such as IEEE Std. 802.15.4 and IEEE Std. 802.11 [12,13].The technology options that have physical range capabilities greater than 11 km area are IEEE Std.802.16 (WiMAX), Fiber, or narrowband PLC. Among the three technologies, PLC is the one with thelowest cost since it utilizes the existing power line as the communication medium avoiding higherinstallation costs when compared to fiber and WiMAX [12,13].
The data rate of narrowband PLC ranges from 5 to 500 kbps [17] and it is chosen for this project.The data rate is set to 130 kbps in order to leave room for scalability. The modulation technique choiceis binary phase shift keying (BPSK) due to its inherent reliability. The medium access control (MAC)algorithm is carrier sense multiple access (CSMA) with collision avoidance (CSMA/CA). That is,the MAC algorithm is specified by the IEEE Std. P1901.2 which is the Std. for narrowband PLC [17].
2.2.4. AMI Cyber Security
AMI like any other smart grid application devices is exposed to cyber threats. The two majorcyber-attacks targeting AMI systems are (a) hackers aiming to gain access to confidential data fromcustomers so they can infer the house scheduled based on the load profile, so one may plan a robberybased on such information; and (b) customers may hack and change the energy usage data to lessthan the real amount in order to reduce their energy bills as a form of energy theft [18,19]. Thus far,several cyber-security measures for AMI have been proposed in the literature [20], however, since
Sensors 2018, 18, 3734 6 of 11
cyber-security is not the focus of this research, those measures were not implemented in this project.Nevertheless, cyber-security is a very important part of the smart grid communication design.
2.2.5. PLC Network System Modeling
The PLC communication network is modeled using the C++ and the NS-3 simulator. The electricalmodel for overhead lines, transformers, and other electric devices as well as the channel model isdeveloped in [11]. This is the base for building the physical electric model. As mentioned earlier,330 smart meters deployed in the low voltage system and each meter is connected to one of the33 data concentrators located in the high voltage side of each distribution transformers. Each dataconcentrator gathers the hourly load data from the controller located in the substation and pulls all themeasurement data. The information gathered at the substation controller may be used later for bothbilling purposes and for demand response programs. Each data concentrator is capable of transmittingdata at 130 kbps with binary phase shift keying (BPSK) modulation and carrier sense multiple accesswith collision avoidance (CSMA/CA) as the medium access control protocol in order to make sharedmedium communication possible.
In this design, the transport and network layers are not used because they would increase theoverhead size of the data traffic without adding relevant benefits since the computer network onlyhas 33 data concentrators and one substation controller. The smart meter device models developedhere mimic the behavior of real smart meters by sending hourly power measurements wheneverthe substation sends metering requests. Table 3 summarizes all the simulation parameters for thedeveloped PLC network model.
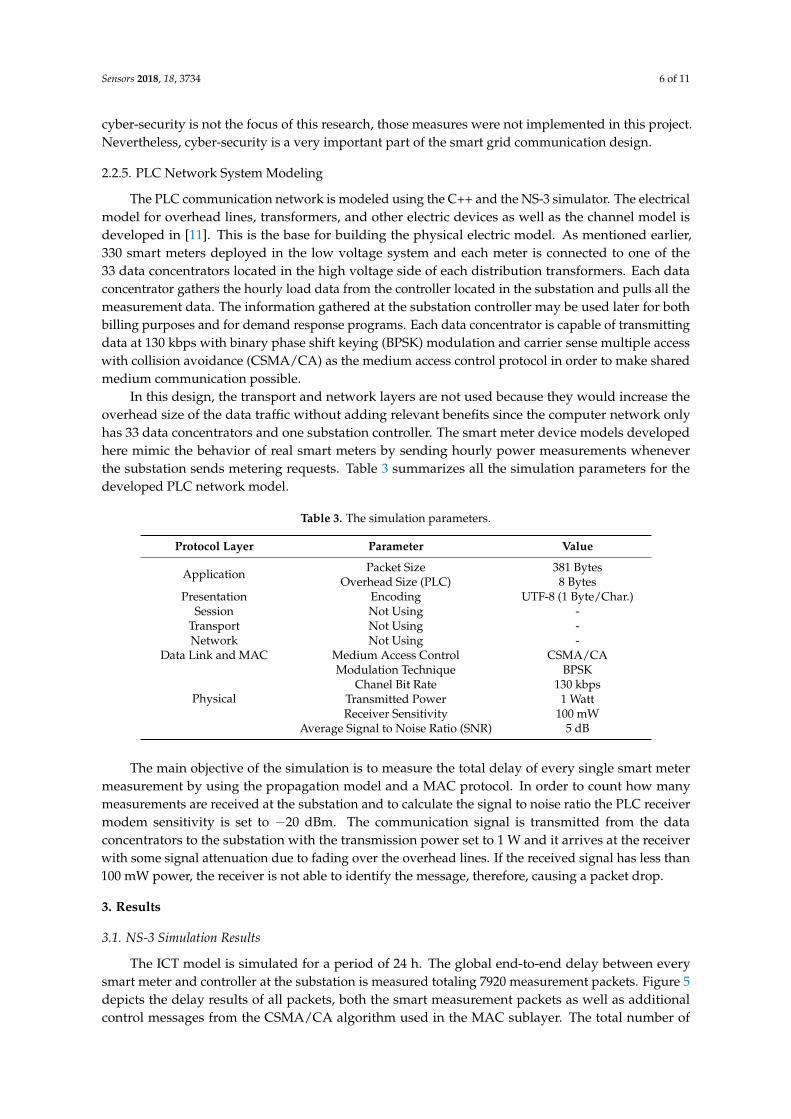
Table 3. The simulation parameters.
Protocol Layer Parameter Value
Application Packet Size 381 BytesOverhead Size (PLC) 8 Bytes
Presentation Encoding UTF-8 (1 Byte/Char.)Session Not Using -
Transport Not Using -Network Not Using -
Data Link and MAC Medium Access Control CSMA/CA
Physical
Modulation Technique BPSKChanel Bit Rate 130 kbps
Transmitted Power 1 WattReceiver Sensitivity 100 mW
Average Signal to Noise Ratio (SNR) 5 dB
The main objective of the simulation is to measure the total delay of every single smart metermeasurement by using the propagation model and a MAC protocol. In order to count how manymeasurements are received at the substation and to calculate the signal to noise ratio the PLC receivermodem sensitivity is set to −20 dBm. The communication signal is transmitted from the dataconcentrators to the substation with the transmission power set to 1 W and it arrives at the receiverwith some signal attenuation due to fading over the overhead lines. If the received signal has less than100 mW power, the receiver is not able to identify the message, therefore, causing a packet drop.
3. Results
3.1. NS-3 Simulation Results
The ICT model is simulated for a period of 24 h. The global end-to-end delay between everysmart meter and controller at the substation is measured totaling 7920 measurement packets. Figure 5depicts the delay results of all packets, both the smart measurement packets as well as additionalcontrol messages from the CSMA/CA algorithm used in the MAC sublayer. The total number of
Sensors 2018, 18, 3734 7 of 11
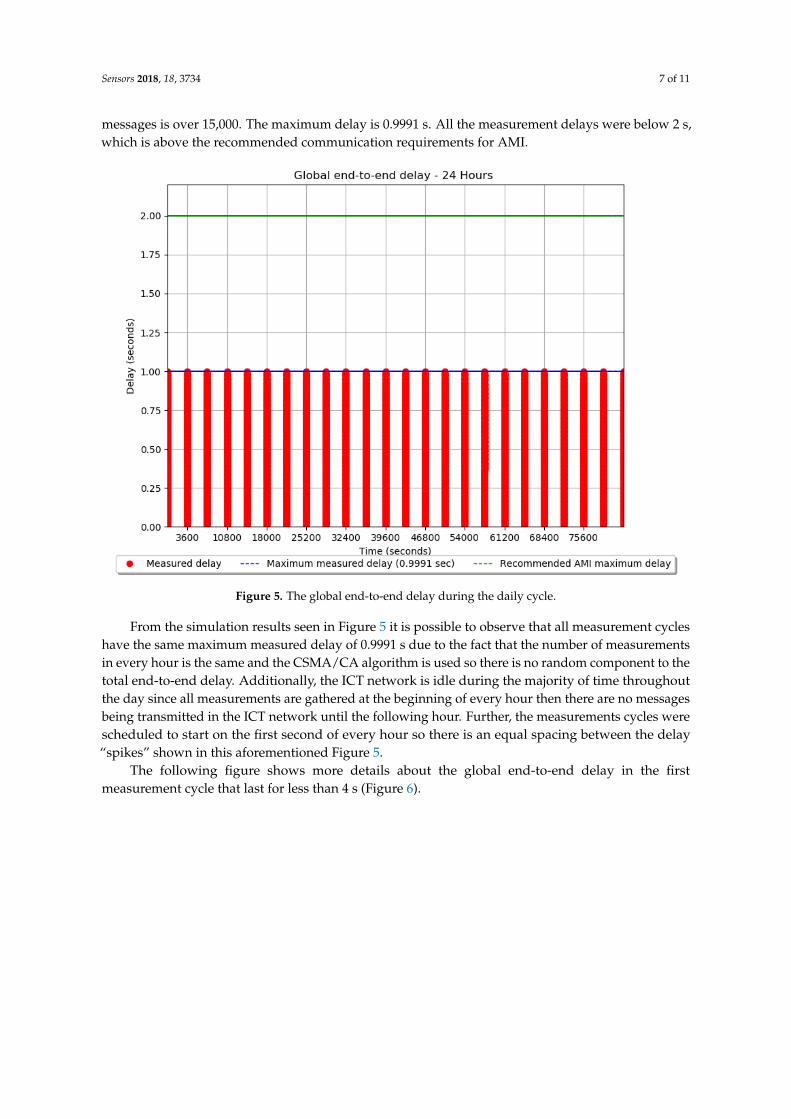
messages is over 15,000. The maximum delay is 0.9991 s. All the measurement delays were below 2 s,which is above the recommended communication requirements for AMI.
Sensors 2018, 18, x 7 of 11
concentrators to the substation with the transmission power set to 1 W and it arrives at the receiver with some signal attenuation due to fading over the overhead lines. If the received signal has less than 100 mW power, the receiver is not able to identify the message, therefore, causing a packet drop.
3. Results
3.1. NS-3 Simulation Results
The ICT model is simulated for a period of 24 h. The global end-to-end delay between every smart meter and controller at the substation is measured totaling 7920 measurement packets. Figure 5 depicts the delay results of all packets, both the smart measurement packets as well as additional control messages from the CSMA/CA algorithm used in the MAC sublayer. The total number of messages is over 15,000. The maximum delay is 0.9991 s. All the measurement delays were below 2 s , which is above the recommended communication requirements for AMI.
Figure 5. The global end-to-end delay during the daily cycle.
From the simulation results seen in Figure 5 it is possible to observe that all measurement cycles have the same maximum measured delay of 0.9991 s due to the fact that the number of measurements in every hour is the same and the CSMA/CA algorithm is used so there is no random component to the total end-to-end delay. Additionally, the ICT network is idle during the majority of time throughout the day since all measurements are gathered at the beginning of every hour then there are no messages being transmitted in the ICT network until the following hour. Further, the measurements cycles were scheduled to start on the first second of every hour so there is an equal spacing between the delay “spikes” shown in this aforementioned Figure 5.
The following figure shows more details about the global end-to-end delay in the first measurement cycle that last for less than 4 s (Figure 6).
Figure 5. The global end-to-end delay during the daily cycle.
From the simulation results seen in Figure 5 it is possible to observe that all measurement cycleshave the same maximum measured delay of 0.9991 s due to the fact that the number of measurementsin every hour is the same and the CSMA/CA algorithm is used so there is no random component to thetotal end-to-end delay. Additionally, the ICT network is idle during the majority of time throughoutthe day since all measurements are gathered at the beginning of every hour then there are no messagesbeing transmitted in the ICT network until the following hour. Further, the measurements cycles werescheduled to start on the first second of every hour so there is an equal spacing between the delay“spikes” shown in this aforementioned Figure 5.
The following figure shows more details about the global end-to-end delay in the firstmeasurement cycle that last for less than 4 s (Figure 6).
Sensors 2018, 18, 3734 8 of 11Sensors 2018, 18, x 8 of 11
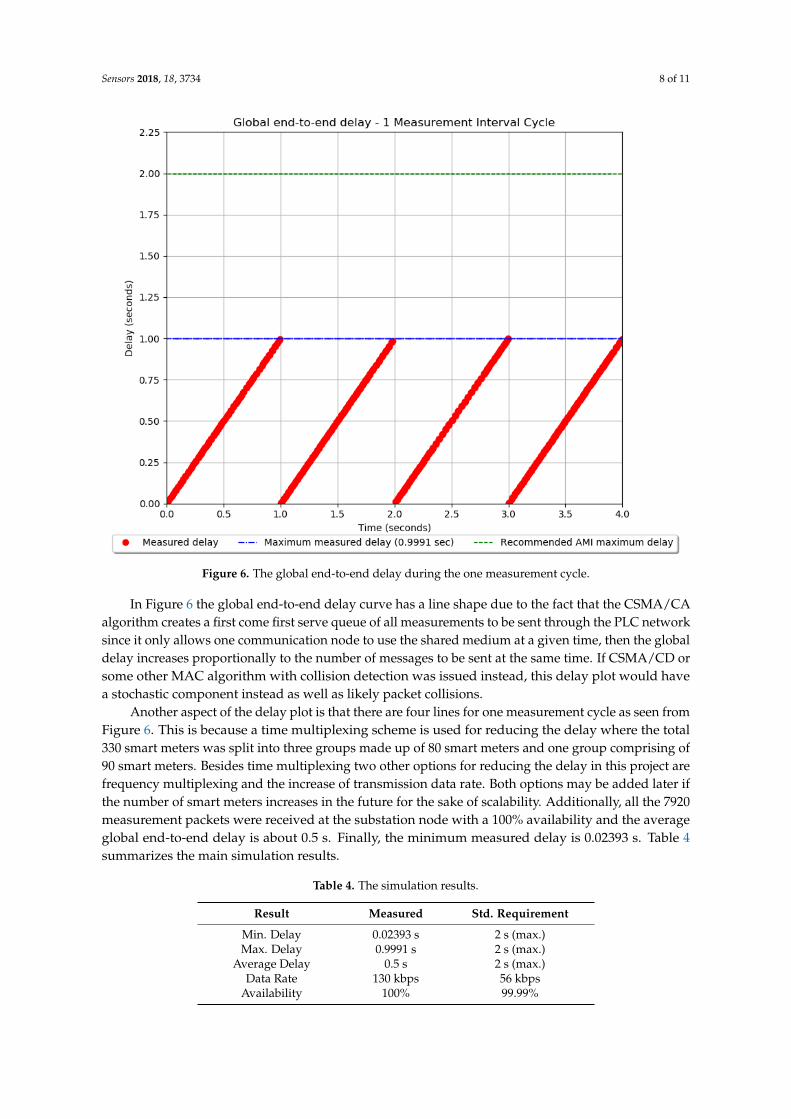
Figure 6. The global end-to-end delay during the one measurement cycle.
In Figure 6 the global end-to-end delay curve has a line shape due to the fact that the CSMA/CA algorithm creates a first come first serve queue of all measurements to be sent through the PLC network since it only allows one communication node to use the shared medium at a given time, then the global delay increases proportionally to the number of messages to be sent at the same time. If CSMA/CD or some other MAC algorithm with collision detection was issued instead, this delay plot would have a stochastic component instead as well as likely packet collisions.
Another aspect of the delay plot is that there are four lines for one measurement cycle as seen from Figure 6. This is because a time multiplexing scheme is used for reducing the delay where the total 330 smart meters was split into three groups made up of 80 smart meters and one group comprising of 90 smart meters. Besides time multiplexing two other options for reducing the delay in this project are frequency multiplexing and the increase of transmission data rate. Both options may be added later if the number of smart meters increases in the future for the sake of scalability. Additionally, all the 7920 measurement packets were received at the substation node with a 100% availability and the average global end-to-end delay is about 0.5 s. Finally, the minimum measured delay is 0.02393 s. Table 4 summarizes the main simulation results.
Table 4. The simulation results.
Result Measured Std. Requirement Min. Delay 0.02393 s 2 s (max.) Max. Delay 0.9991 s 2 s (max.)
Average Delay 0.5 s 2 s (max.) Data Rate 130 kbps 56 kbps
Availability 100% 99.99%
Figure 6. The global end-to-end delay during the one measurement cycle.
In Figure 6 the global end-to-end delay curve has a line shape due to the fact that the CSMA/CAalgorithm creates a first come first serve queue of all measurements to be sent through the PLC networksince it only allows one communication node to use the shared medium at a given time, then the globaldelay increases proportionally to the number of messages to be sent at the same time. If CSMA/CD orsome other MAC algorithm with collision detection was issued instead, this delay plot would havea stochastic component instead as well as likely packet collisions.
Another aspect of the delay plot is that there are four lines for one measurement cycle as seen fromFigure 6. This is because a time multiplexing scheme is used for reducing the delay where the total330 smart meters was split into three groups made up of 80 smart meters and one group comprising of90 smart meters. Besides time multiplexing two other options for reducing the delay in this project arefrequency multiplexing and the increase of transmission data rate. Both options may be added later ifthe number of smart meters increases in the future for the sake of scalability. Additionally, all the 7920measurement packets were received at the substation node with a 100% availability and the averageglobal end-to-end delay is about 0.5 s. Finally, the minimum measured delay is 0.02393 s. Table 4summarizes the main simulation results.
Table 4. The simulation results.
Result Measured Std. Requirement
Min. Delay 0.02393 s 2 s (max.)Max. Delay 0.9991 s 2 s (max.)
Average Delay 0.5 s 2 s (max.)Data Rate 130 kbps 56 kbps
Availability 100% 99.99%
Sensors 2018, 18, 3734 9 of 11
3.2. Numerical Analysis and Model Validation
In order to validate the NS-3 simulation results, the authors used the end-to-end delay numericalanalysis from reference [21]. This can be calculated as
End to end Delay (d) = Queuing Delay(dqueuing ) + Transmission Delay (dtransmission)
+ Propagation Delay(dpropagation
),
(2)
where the Queuing Delay depends on both the network topology and the MAC algorithm (CSMA/CAin this case) and is not trivial to compute. For a single data frame when the channel is free it can beassumed to be zero seconds. The Transmission Delay is given by
dtransmission =Frame Lenght
Channel Capacity(3)
The Propagation Delay depends on the path length and on the propagation velocity that has beenassumed to be close to the speed of light (approximately 3 × 10⁸ m/s):
dpropagation =Path Lenght
Propagation Velocity(4)
The end-to-end delay of 1 data frame in the link between the node 802 and the substation node(node 800) has been compared with the measured delay from the NS-3 simulation. In this case, sincethe channel is free there is no Queuing Delay, therefore, dqueuing = 0 s. The frame size is 389 bytes(3112 bits) and the channel capacity is 130,000 bits/s. The distance between nodes 800 and 802 is786 m [10] and the propagation velocity is assumed to be the same as the speed of light. Using Equation(2) the calculated End-to-end Delay for this case will be
d = 0 +3112 bits
130, 000 bitss
+786 m
3 × 10⁸ ms= 0.02393 + 0.0000026,
d = 0.0239326 s
which is close to the simulated value of 0.02393 s. From the numerical analysis, it can be noticed thatthe main component of the delay is the Transmission Delay, in this case.
4. Discussion and Conclusions
This paper presents a narrowband PLC communication design and an analysis for an AMIapplication deploying 330 smart meters along the IEEE 34 bus distribution network. This is modeledin Network Simulator 3 (NS-3) and is compared with the communication network performancerequirements for AMI. The network traffic is 285.26 bits per second, which is considered to be verylow when compared to state-of-the-art communication technologies. The simulation results show thatthe proposed communication network meets the minimum requirements and the following lessonsare learned:
• Among all communication technologies applicable to modern power systems there is no one“best” technology. Each technology has its pros and cons and the communication engineer shouldlook for the options that meet all the project requirements and the design criteria at minimumcost. Additionally, the ICT design could be a combination of two or more ICT technologies. Thisis usually the case for smart grids with large geographical areas and/or multiple applications.
• PLC communication has proven to be a cost-effective solution for this AMI application with scopefor further scalability without changing the ICT network. The network design steps proposedhere are generic and relevant regardless of the different project requirements that may be used forother smart grid applications.

Sensors 2018, 18, 3734 10 of 11
• When there are multiple applications for a smart grid, it is necessary to assign differentpriorities to different applications. For instance, if an ICT network is being used for bothAMI and tele-protection applications then the ICT network should prioritize all messages fromtele-protection because it is a more critical application.
• The network traffic of a single smart meter in this study is 0.86 bits per second. When compared toother smart grid applications this traffic is considered very low. For instance, IEEE Std. C37.118.2for synchrophasor data points that a phasor measurement unit (PMU) with 60 Hz samplinggenerates 23,040 bits per second which is much higher than a smart meter data rate. Based onthose numbers more than 26,000 smart meters would be necessary to generate the same amountof data of a single PMU. Because of this reason, the authors believe that smart metering is notamong the applications driving big data in power systems.
Author Contributions: Investigation, methodology, software, and validation, R.S.d.C.; resources and partialfunding, P.K.S. and L.N.C; writing—draft preparation, R.S.d.C. and P.K.S.; writing—review and editing, R.S.d.C.and P.K.S.; visualization, Y.N.V., L.F.R., L.N.C. and R.S.d.C.; overall supervision, P.K.S.
Funding: This research was funded by CAPES—Brazilian Federal Agency for Support and Evaluation of GraduateEducation within the Ministry of Education of Brazil, scholarship number 99999.013282/2013-01. Also, the authorswould like to thank CNPq PQ 1D Process 311516/2014-9, NCTGD, CNPq Process 465640/2014-1, CAPES Processno. 23038.000776/2017-54 and FAPERGS 17/2551-0000517-1 for partial funding.
Acknowledgments: The authors would like to thank Federal University of Rondônia and Colorado Schoolof Mines.
Conflicts of Interest: The authors declare no conflict of interest.
References
1. Mets, K.; Ojea, J.A.; Develder, C. Combining Power and Communication Network Simulation forCost-Effective Smart Grid Analysis. IEEE Commun. Surv. Tutor. 2014, 16, 1771–1796. [CrossRef]
2. Maxwell, J.C. A Treatise on Electricity and Magnetism, 3rd ed.; Oxford University Press: Clarendon, UK, 1892;pp. 68–73.
3. Gungor, V.C.; Sahin, D.; Kocak, T.; Ergut, S.; Buccella, C.; Cecati, C.; Hancke, G.P. A Survey on SmartGrid Potential Applications and Communication Requirements. IEEE Trans. Ind. Informat. 2013, 9, 28–42.[CrossRef]
4. Budka, K.C.; Deshpande, J.G.; Thottan, M. Communication Networks for Smart Grids, 1st ed.; Springer: London,UK, 2014.
5. Yan, Y.; Qian, Y.; Sharif, H.; Tipper, D. A Survey on Smart Grid Communication Infrastructures: Motivations,Requirements and Challenges. IEEE Commun. Surv. Tutor. 2013, 15, 5–20. [CrossRef]
6. Fang, X.; Misra, S.; Xue, D.; Yang, D. Smart Grid—The New and Improved Power Grid: A Survey.IEEE Commun. Surveys Tutor. 2012, 14, 944–980. [CrossRef]
7. De-Carvalho, R.S.; Mohagheghi, S. Analyzing Impact of Communication Network Topologies onReconfiguration of Networked Microgrids, Impact of Communication System on Smart Grid Reliability,Security and Operation. In Proceedings of the 2016 North American Power Symposium (NAPS), Denver,CO, USA, 18–20 September 2016; IEEE: Denver, CO, USA, 2016.
8. Huh, J.; Otgonchimeg, S.; Seo, K. Advanced metering infrastructure design and test bed experiment usingintelligent agents: Focusing on the PLC network base technology for Smart Grid system. J. Supercomput.2016, 72, 1862–1877. [CrossRef]
9. NS-3. Available online: https://www.nsnam.org/ (accessed on 9 March 2015).10. IEEE 34 Bus Test Feeder. Available online: http://ewh.ieee.org/soc/pes/dsacom/testfeeders/ (accessed on
23 January 2017).11. Aalamifar, F.; Schlogl, A.; Harris, D.; Lampe, L. Modelling Power Line Communication Using Network
Simulator-3. In Proceedings of the 2013 IEEE Global Communications Conference (GLOBECOM), Atlanta,GA, USA, 9–13 December 2013; IEEE: Atlanta, GA, USA, 2013.

Sensors 2018, 18, 3734 11 of 11
12. Asbery, C.W.; Jiao, X.; Liao, Y. Implementation Guidance of Smart Grid Communication. In Proceedingsof the 2016 North American Power Symposium (NAPS), Denver, CO, USA, 18–20 September 2016; IEEE:Denver, CO, USA, 2016.
13. Kabalci, Y. A survey on smart metering and smart grid communication. Renew. Sustain. Energy Rev. 2016, 57,302–318. [CrossRef]
14. Vélez-Rivera, C.; Andrade, F.; Vélez-Rivera, C.; Andrade, F.; Arzuaga-Cruz, E.; Irizarry-Rivera, A. Gorilla:An Open Interface for Smart Agents and Real-Time Power Microgrid System Simulations. Inventions 2018, 3,58. [CrossRef]
15. Arifuzzaman, K.Y.M.; Wen, Z.; Zhang, D.; Sato, T. A Key Management Scheme for Secure Communicationsof Information Centric Advanced Metering Infrastructure in Smart Grid. IEEE Trans. Instrum. Meas. 2015, 64,2072–2085. [CrossRef]
16. Open Energy Information. Available online: https://openei.org/datasets/files/961/pub/EPLUS_TMY2_RESIDENTIAL_BASE/ (accessed on 17 July 2017).
17. Cano, C.; Pittolo, A.; Malone, D.; Lampe, L.; Tonello, A.M.; Dabak, A.G. State of the Art in Power LineCommunications: From the Applications to the Medium. IEEE J. Sel. Areas Commun. 2016, 34, 1935–1952.[CrossRef]
18. McLaughlin, S.; Podkuiko, D.; Delozier, A.; Miadzvezhanka, S.; McDaniel, P. Multi-vendor PenetrationTesting in the Advanced Metering Infrastructure. In Proceedings of the 26th Annual Computer SecurityApplications Conference (ACSAC 2010), Austin, TX, USA, 6–10 December 2010.
19. Lee, S.; Huh, J. An Effective Security Measures for Nuclear Power Plant Using Big Data Analysis Approach.J. Supercomput. 2018, 1–28. [CrossRef]
20. Mohassel, R.R.; Fung, A.; Mohammadi, F.; Raahemifar, K. A survey on Advanced Metering Infrastructure.Int. J. Electr. Power Energy Syst. 2014, 63, 473–484. [CrossRef]
21. Kurose, J.F.; Ross, K.W. Computer Networking a Top-Down Approach, 6th ed.; Pearson: Boston, MA, USA, 2013.
© 2018 by the authors. Licensee MDPI, Basel, Switzerland. This article is an open accessarticle distributed under the terms and conditions of the Creative Commons Attribution(CC BY) license (http://creativecommons.org/licenses/by/4.0/).